Nightstartm - Concurrent Computer Corporation
Nightstartm - Concurrent Computer Corporation
Nightstartm - Concurrent Computer Corporation

You also want an ePaper? Increase the reach of your titles
YUMPU automatically turns print PDFs into web optimized ePapers that Google loves.
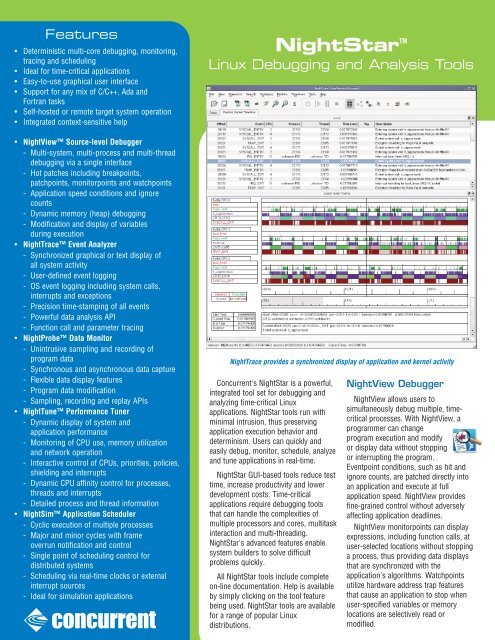
Features<br />
• Deterministic multi-core debugging, monitoring,<br />
tracing and scheduling<br />
• Ideal for time-critical applications<br />
• Easy-to-use graphical user interface<br />
• Support for any mix of C/C++, Ada and<br />
Fortran tasks<br />
• Self-hosted or remote target system operation<br />
• Integrated context-sensitive help<br />
• NightView Source-level Debugger<br />
- Multi-system, multi-process and multi-thread<br />
debugging via a single interface<br />
- Hot patches including breakpoints,<br />
patchpoints, monitorpoints and watchpoints<br />
- Application speed conditions and ignore<br />
counts<br />
- Dynamic memory (heap) debugging<br />
- Modification and display of variables<br />
during execution<br />
• NightTrace Event Analyzer<br />
- Synchronized graphical or text display of<br />
all system activity<br />
- User-defined event logging<br />
- OS event logging including system calls,<br />
interrupts and exceptions<br />
- Precision time-stamping of all events<br />
- Powerful data analysis API<br />
- Function call and parameter tracing<br />
• NightProbe Data Monitor<br />
- Unintrusive sampling and recording of<br />
program data<br />
- Synchronous and asynchronous data capture<br />
- Flexible data display features<br />
- Program data modification<br />
- Sampling, recording and replay APIs<br />
• NightTune Performance Tuner<br />
- Dynamic display of system and<br />
application performance<br />
- Monitoring of CPU use, memory utilization<br />
and network operation<br />
- Interactive control of CPUs, priorities, policies,<br />
shielding and interrupts<br />
- Dynamic CPU affinity control for processes,<br />
threads and interrupts<br />
- Detailed process and thread information<br />
• NightSim Application Scheduler<br />
- Cyclic execution of multiple processes<br />
- Major and minor cycles with frame<br />
overrun notification and control<br />
- Single point of scheduling control for<br />
distributed systems<br />
- Scheduling via real-time clocks or external<br />
interrupt sources<br />
- Ideal for simulation applications<br />
NightStar TM<br />
Linux Debugging and Analysis Tools<br />
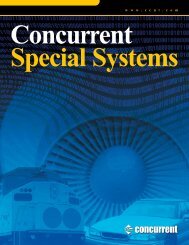
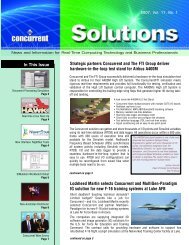
NightTrace provides a synchronized display of application and kernel activity<br />
<strong>Concurrent</strong>'s NightStar is a powerful,<br />
integrated tool set for debugging and<br />
analyzing time-critical Linux<br />
applications. NightStar tools run with<br />
minimal intrusion, thus preserving<br />
application execution behavior and<br />
determinism. Users can quickly and<br />
easily debug, monitor, schedule, analyze<br />
and tune applications in real-time.<br />
NightStar GUI-based tools reduce test<br />
time, increase productivity and lower<br />
development costs. Time-critical<br />
applications require debugging tools<br />
that can handle the complexities of<br />
multiple processors and cores, multitask<br />
interaction and multi-threading.<br />
NightStar's advanced features enable<br />
system builders to solve difficult<br />
problems quickly.<br />
All NightStar tools include complete<br />
on-line documentation. Help is available<br />
by simply clicking on the tool feature<br />
being used. NightStar tools are available<br />
for a range of popular Linux<br />
distributions.<br />
NightView Debugger<br />
NightView allows users to<br />
simultaneously debug multiple, timecritical<br />
processes. With NightView, a<br />
programmer can change<br />
program execution and modify<br />
or display data without stopping<br />
or interrupting the program.<br />
Eventpoint conditions, such as hit and<br />
ignore counts, are patched directly into<br />
an application and execute at full<br />
application speed. NightView provides<br />
fine-grained control without adversely<br />
affecting application deadlines.<br />
NightView monitorpoints can display<br />
expressions, including function calls, at<br />
user-selected locations without stopping<br />
a process, thus providing data displays<br />
that are synchronized with the<br />
application's algorithms. Watchpoints<br />
utilize hardware address trap features<br />
that cause an application to stop when<br />
user-specified variables or memory<br />
locations are selectively read or<br />
modified.
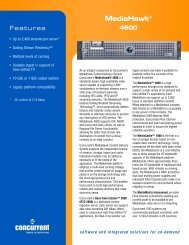
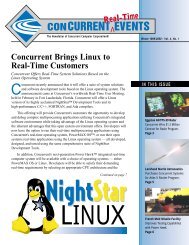
NightView supports multiprocessor, multiprocess debugging in any mix of languages<br />
from a single GUI<br />
Language-sensitive Debugging<br />
NightView supports the debugging of<br />
multiple applications written in any<br />
combination of C/C++, Ada and Fortran. All<br />
variables and expressions in each program<br />
are referenced in its own language syntax.<br />
NightView is fully integrated with the<br />
NightTrace event analyzer. NightView can<br />
insert tracepoints at user-specified locations<br />
for live or post-execution analysis with<br />
NightTrace.<br />
More Powerful Than The Gnu<br />
Debugger<br />
NightView offers many features not<br />
available in gnu debuggers (gdb/ddd).<br />
NightView advantages include the ability to<br />
debug multiple processes from a single<br />
session and processes started from scripts.<br />
With NightView, patched-in code runs at full<br />
speed. While a process is executing, hot<br />
patching can modify variables, change<br />
execution flow, add eventpoints and add or<br />
replace subprograms. Monitorpoints can<br />
display expressions and stack variables, and<br />
signals can be delivered directly to the<br />
process, bypassing the debugger.<br />
Complete Memory Debugging<br />
NightView includes an interactive memory<br />
debugger that helps find and eliminate<br />
problems during the debug process without<br />
code recompilation or relinking. NightView<br />
watches for heap memory leaks, monitors the<br />
amount of memory an application uses, and<br />
tracks how it allocates and frees memory.<br />
With its memory debugger enabled,<br />
NightView lets users track heap transactions<br />
in real-time, thus allowing for more efficient<br />
debugging than post-run analysis.<br />
Programmers can stop execution, check for<br />
problems, test patches and then continue<br />
debugging.<br />
NightView can detect common heap<br />
programming errors, such as uninitialized use<br />
of allocated areas, double-frees, use of freed<br />
pointers and writing past the end of allocated<br />
areas. No recompilation or relinking is<br />
required.<br />
NightTrace Event Analyzer<br />
NightTrace is a tool for displaying and<br />
analyzing the dynamic behavior of<br />
applications, the Linux operating system and<br />
the interaction between them. NightTrace can<br />
log events from multiple processes executing<br />
simultaneously on multiple CPUs or systems.<br />
NightTrace can also combine userdefined<br />
application events with OS<br />
events to present a synchronized<br />
view of the entire system. NightTrace allows<br />
users to zoom, search, filter, summarize and<br />
analyze events. Tracing analysis can be<br />
performed live or post-execution.<br />
NightTrace was specifically designed to<br />
meet the most stringent requirements of<br />
time-critical applications. Using<br />
synchronized, fast-access hardware clocks<br />
and kernel-free primitives, NightTrace<br />
tracepoints are logged with minimal<br />
overhead. Tracepoints can be inserted into<br />
device drivers, interrupt level code and any<br />
user application. Tracepoints can be left in<br />
production applications even when not<br />
collecting trace data. In distributed<br />
applications, multiple systems can be traced<br />
when connected via <strong>Concurrent</strong>'s Real-Time<br />
Clock & Interrupt Module (RCIM).<br />
NightTrace also provides instrumentation<br />
for user programs to automatically display<br />
and log the details of their activity including<br />
function call parameters, entry, return and<br />
return values.<br />
Graphical and Interactive<br />
NightTrace graphically displays requested<br />
events and states along a timeline graph to<br />
clearly show the relative timing of events and<br />
provide an overall picture of application and<br />
operating system activity. NightTrace can<br />
locate specific events and zoom in on them<br />
with a fine degree of granularity for precise<br />
timing observation.<br />
The NightTrace graphical display is<br />
completely user-configurable and<br />
customizable. Configurations can be saved<br />
and later recalled, and different<br />
configurations can be viewed simultaneously.<br />
Automatic Function Call Tracing<br />
NightTrace’s application illumination feature<br />
allows programmers to automatically trace<br />
application function calls and examine the<br />
values of parameters passed and returned.<br />
Function call tracing is fully customizable and<br />
can provide a complete view of system library<br />
activity (e.g. glibc, pthread).<br />
Kernel Trace Support<br />
By combining system event information<br />
such as interrupts, exceptions, context<br />
switches, system calls and device accesses<br />
together with event information from user<br />
applications, NightTrace provides a clear<br />
picture of the activities of the kernel at any<br />
point during the application's run.<br />
NightTrace provides statistical performance<br />
data about events and states, including<br />
frequency, time of occurrence, duration, gap<br />
and minimum and maximum times. Users<br />
can create customized state and event
conditions by specifying the applicable<br />
process, thread, CPU, system and event<br />
content. Displays can be customized to yield<br />
insight into operating system and application<br />
performance and behavior.<br />
NightTrace's Analysis API allows users to<br />
easily create custom programs that monitor<br />
or analyze application or system activity.<br />
NightProbe Data Monitor<br />
NightProbe is a tool for monitoring,<br />
modifying and recording data values from<br />
multiple, independent application resources,<br />
including programs, shared memory<br />
segments, memory mapped files and PCI<br />
devices. NightProbe can be used in<br />
development for debugging,<br />
analysis, prototyping and fault<br />
injection, or in a production<br />
environment to create a GUI control panel for<br />
program input and output.<br />
NightProbe utilizes a non-intrusive<br />
technique of mapping the target resource's<br />
address space into its own. Subsequent<br />
direct memory reads and writes by<br />
NightProbe allow it to sample and modify<br />
data without interrupting or otherwise<br />
affecting resources.<br />
Synchronized and<br />
Asynchronous<br />
Logging<br />
NightProbe can<br />
perform synchronous<br />
logging of data via a<br />
simple API.<br />
Asynchronous logging<br />
can be performed via<br />
on-demand sampling<br />
or a cyclic clock rate.<br />
NightProbe allows<br />
logging of data items<br />
using tracepoints for<br />
simultaneous analysis<br />
by the NightTrace<br />
event analyzer. Sampled data<br />
can be combined with kernel<br />
trace and additional user trace data to obtain<br />
a synchronized picture of application and OS<br />
behavior. NightProbe can also record data to<br />
disk files for subsequent playback.<br />
Interactive Sampling and Modification<br />
NightProbe offers a variety of data display<br />
options including lists, tables, spreadsheets<br />
and graphs. Direct modification of user data<br />
is accomplished by simply typing new data<br />
item values into cells that display the<br />
variables. NightProbe allows sampled data to<br />
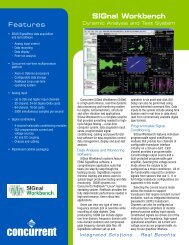
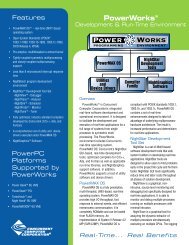
NightProbe provides configuration and control for data monitoring and recording<br />
NightSim controls all scheduling parameters and displays<br />
information about all processes, including executing frequency<br />
be passed to user applications for live<br />
customized display or for post-run analysis.<br />
NightProbe supports scalar and structured<br />
data types in C/C++, Ada and Fortran that<br />
have static base addresses. Pointer<br />
indirection is also supported. NightProbe<br />
scans the symbol table and debug<br />
information of user programs allowing the<br />
user to browse for data items or specifically<br />
entering the names of data items to be<br />
monitored. Any application that contains<br />
symbol table and debug information may be<br />
used with NightProbe. No application source<br />
code changes are required.<br />
NightSim Application<br />
Scheduler<br />
NightSim is a tool for scheduling and<br />
monitoring time-critical applications that<br />
require predictable, cyclic process execution.<br />
Ideal for simulation applications, NightSim<br />
allows developers to dynamically<br />
adjust the execution of multiple,<br />
coordinated processes, their<br />
priorities, scheduling policies and CPU<br />
assignments. Users can monitor the<br />
performance of applications by displaying<br />
period execution times, minimums and<br />
maximums, and optionally pause all<br />
application execution when any process<br />
overruns its allocated frame.<br />
NightSim provides a GUI to the operating<br />
system's Frequency-Based Scheduler (FBS),<br />
a high-resolution task scheduler that enables<br />
processes to run cyclically. NightSim lets<br />
users easily configure groups of processes
to run on local or distributed systems, and<br />
save the resulting configurations for reuse.<br />
A performance monitor gathers CPU<br />
utilization data for processes running under<br />
the FBS.<br />
NightSim may be used during the<br />
development, debug and production phases<br />
of a simulation model. Configurations can<br />
be saved as a script and then re-executed to<br />
repeat a simulation. NightSim scripts are<br />
useful in target environments where GUI<br />
processing is prohibited or undesired.<br />
Synchronized Distributed Scheduling<br />
In addition to symmetric multiprocessors,<br />
NightSim supports multiple systems<br />
connected via a <strong>Concurrent</strong> RCIM. NightSim<br />
simplifies the creation of distributed<br />
scheduling and provides a single-point-ofcontrol<br />
for individual schedulers distributed<br />
across multiple target systems. NightSim<br />
handles the interface to hardware such as<br />
real-time clocks and distributed interrupt<br />
sources. Users don't need to interface with<br />
the underlying OS for scheduling<br />
operations.<br />
Extensive Performance Statistics<br />
NightSim monitors up to 14 different performance<br />
statistics for each process, such as minimum and maximum<br />
cycle times. Using these statistics, users can optimize CPU<br />
utilization by balancing their load across multiple processors.<br />
NightSim displays are customizable, allowing users to select<br />
specific statistics and processes to monitor and sorting<br />
criteria for weighted display.<br />
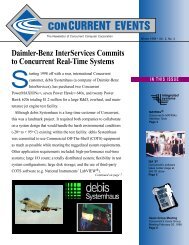
NightTune System & Application Tuner<br />
NightTune provides a GUI for monitoring and tuning<br />
application and system performance. Users can monitor the<br />
priority, scheduling policy, CPU assignment and<br />
CPU usage of user applications. NightTune also<br />
monitors system CPU usage, context switches,<br />
interrupts, memory utilization, and disk and<br />
network activity.<br />
NightTune can monitor processes individually or in userspecified<br />
groups or by CPU. NightTune also displays<br />
information about individual threads or tasks within a<br />
process. Available information includes library and system<br />
call tracking (strace), file descriptor usage and connections,<br />
2881 Gateway Drive<br />
Pompano Beach, Florida 33069<br />
Phone: 1-800-666-4544 or 954-974-1700<br />
Sales or Marketing Support<br />
FAX: 954-973-5398<br />
E-mail: info@ccur.com • www.ccur.com<br />
NightTune monitors system activity including CPU use, context switches and disk utilization.<br />
signal states, and detailed memory usage with page-level<br />
statistics on residency, locking and NUMA pools. Multiple<br />
frames and windows are used to display information allowing<br />
users to customize the desired display.<br />
System Tuning by GUI<br />
NightTune's GUI can change the process attributes of an<br />
individual thread, task, process or group of processes as a<br />
whole. For example, dragging a process icon to a CPU icon<br />
binds the process to that processor. The user instantly views<br />
the results of the tuning effort both graphically and as text.<br />
NightTune provides a hierarchial display of logical CPUs<br />
showing multiple cores and hyperthreading. Users can also<br />
easily change CPU interrupt assignments.<br />
NightTune optionally provides a textual log of all application<br />
and system tuning actions taking during a NightTune session.<br />
Supported Linux Distributions<br />
NightStar is available for <strong>Concurrent</strong> RedHawk Linux, Red<br />
Hat Enterprise Linux, SUSE Linux Enterprise Server and<br />
Desktop, openSUSE, Fedora, CentOS, Debian and Ubuntu. Not<br />
all features are supported on all Linux distributions. Please<br />
consult www.ccur.com/nightstar_versions for details.<br />
Information subject to change without notice. <strong>Concurrent</strong> <strong>Computer</strong> <strong>Corporation</strong> its logo and Everstream and its logo are registered trademarks<br />
of <strong>Concurrent</strong> <strong>Computer</strong> <strong>Corporation</strong>. All other <strong>Concurrent</strong> product names are trademarks of <strong>Concurrent</strong> while all other product names<br />
are trademarks or registered trademarks of their respective owners. Linux® is used pursuant to a sublicense from the Linux Mark Institute.<br />
© 2009 <strong>Concurrent</strong> <strong>Computer</strong> <strong>Corporation</strong>. RTlit-0021 0409 2000