Table of Contents - International Water Management Institute
Table of Contents - International Water Management Institute
Table of Contents - International Water Management Institute

Create successful ePaper yourself
Turn your PDF publications into a flip-book with our unique Google optimized e-Paper software.
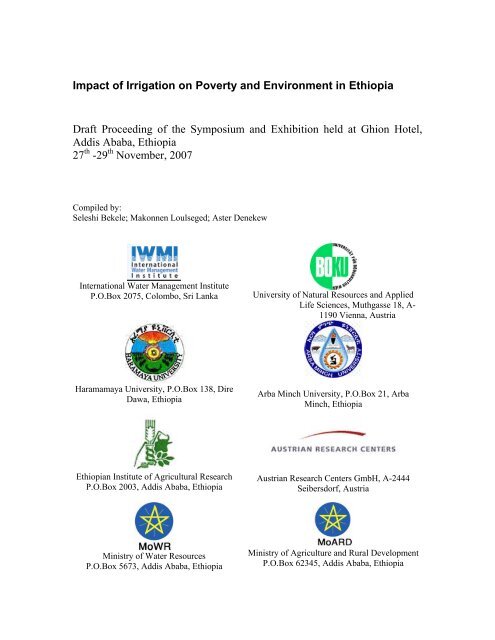
Impact <strong>of</strong> Irrigation on Poverty and Environment in Ethiopia<br />
Draft Proceeding <strong>of</strong> the Symposium and Exhibition held at Ghion Hotel,<br />
Addis Ababa, Ethiopia<br />
27 th -29 th November, 2007<br />
Compiled by:<br />
Seleshi Bekele; Makonnen Loulseged; Aster Denekew<br />
<strong>International</strong> <strong>Water</strong> <strong>Management</strong> <strong>Institute</strong><br />
P.O.Box 2075, Colombo, Sri Lanka<br />
University <strong>of</strong> Natural Resources and Applied<br />
Life Sciences, Muthgasse 18, A-<br />
1190 Vienna, Austria<br />
Haramamaya University, P.O.Box 138, Dire<br />
Dawa, Ethiopia<br />
Arba Minch University, P.O.Box 21, Arba<br />
Minch, Ethiopia<br />
Ethiopian <strong>Institute</strong> <strong>of</strong> Agricultural Research<br />
P.O.Box 2003, Addis Ababa, Ethiopia<br />
Austrian Research Centers GmbH, A-2444<br />
Seibersdorf, Austria<br />
Ministry <strong>of</strong> <strong>Water</strong> Resources<br />
P.O.Box 5673, Addis Ababa, Ethiopia<br />
Ministry <strong>of</strong> Agriculture and Rural Development<br />
P.O.Box 62345, Addis Ababa, Ethiopia
IWMI receives its principal funding from 58 governments, private foundations, and international<br />
and regional organizations known as the Consultative Group on <strong>International</strong> Agricultural<br />
Research (CGIAR). Support is also given by the Governments <strong>of</strong> Ghana, Pakistan, South Africa,<br />
Sri Lanka and Thailand.<br />
Awlachew, S.B.; M. Loulseged.; Yilma, A.D.; 2008. Impact <strong>of</strong> irrigation on poverty and<br />
environment in Ethiopia.<br />
/water management/irrigation management/socioeconomic impact/environnemental impact/water<br />
right/<br />
ISBN :<br />
ISBN :<br />
Copyright © 2008, by IWMI. All rights reserved.<br />
Please direct inquiries and comments to: iwmi@cgiar.org
<strong>Table</strong> <strong>of</strong> <strong>Contents</strong><br />
Acronyms and Abbreviations .................................................................... vii<br />
Acknowledgement........................................................................................ ix<br />
Welcoming address...................................................................................... xi<br />
Seleshi B. Awulachew................................................................................................................ xi<br />
Akissa Bahri, IWMI ................................................................................................................. xiii<br />
Opening Address........................................................................................ xvi<br />
H.E Dr. Leopohld Moll ............................................................................................................ xvi<br />
H.E Ato Adugna Jebessa ......................................................................................................... xvii<br />
Theme one: Status Quo Analysis, Characterization and Assessment <strong>of</strong><br />
Performance <strong>of</strong> Irrigation in Ethiopia.................................................. 1<br />
Statues quo analysis, Characterization and Assessment <strong>of</strong> Performance <strong>of</strong> Irrigation in Ethiopia<br />
..................................................................................................................................................... 2<br />
Comparison <strong>of</strong> irrigation performance based on management and cropping types .................. 14<br />
Irrigation and Rain-fed Crop Production System in Ethiopia ................................................... 27<br />
Basline Servey <strong>of</strong> Irrigation and Rainfed Agriculture in........................................................... 37<br />
Blue Nile Basin ......................................................................................................................... 37<br />
Assessment <strong>of</strong> Design Practices and Performance <strong>of</strong> Small Scale Irrigation Structures in South<br />
Region ....................................................................................................................................... 47<br />
Across System Comparative Assessment <strong>of</strong> irrigation performance <strong>of</strong> community managed<br />
scheme in Southern Ethiopia..................................................................................................... 59<br />
Analysis <strong>of</strong> irrigation systems using comparative performance indicators:.............................. 77<br />
A case study <strong>of</strong> two large scale irrigation systems in the upper Awash basin .......................... 77<br />
Discussion on Theme 1: Status Quo Analysis, Characterization, and Assessment <strong>of</strong><br />
Performance <strong>of</strong> Irrigation in Ethiopia ........................................................................... 93<br />
Theme two: Irrigation Impact on Poverty and Economy....................... 95<br />
Rural poverty and inequality in Ethiopia: does access to.......................................................... 97<br />
small-scale irrigation make a difference?.................................................................................. 97<br />
An Assessment <strong>of</strong> the financial viability and income impact <strong>of</strong> small scale irrigation in<br />
Ethiopia ................................................................................................................................... 117<br />
Importance <strong>of</strong> Irrigated Agriculture to the Ethiopian Economy: Capturing the direct net<br />
benefits <strong>of</strong> irrigation ................................................................................................................ 127<br />
Investment in irrigation as a poverty reduction strategy: Analysis <strong>of</strong> small-scale irrigation<br />
impact on poverty in Tigray, Ethiopia..................................................................................... 156<br />
The Impact <strong>of</strong> Small Scale Irrigation on Household Food Security: The Case <strong>of</strong> Filtino and<br />
Godino Irrigation Schemes in Ada Liben District,.................................................................. 179<br />
East Shoa, Ethiopia.................................................................................................................. 179<br />
A Comparative Analysis <strong>of</strong> the Technical Efficiency <strong>of</strong> Irrigated and ................................... 193<br />
Rainfed Agriculture: A case <strong>of</strong> Awash and Rift Valleys <strong>of</strong> Ethiopia...................................... 193<br />
Impact <strong>of</strong> irrigation on livelihood and food security in the modern Hare river irrigation scheme<br />
in Southern Ethiopia................................................................................................................ 210<br />
Impact Assessment <strong>of</strong> Rainwater Harvesting Ponds: .............................................................. 223<br />
The Case <strong>of</strong> Alaba Woreda, Ethiopia ...................................................................................... 223<br />
Discussion on Theme 2: Irrigation Impact Poverty and Economy ............................. 256<br />
Theme three: Irrigation Institutions and Support Services ................. 259<br />
v
Status <strong>of</strong> Irrigation Institutions and Support Services in Ethiopia .......................................... 260<br />
Does Access To Small Scale Irrigation Promote Market Oriented Production In Ethiopia? .. 262<br />
Small Scale Irrigation Interventions for System Productivity and .......................................... 282<br />
Natural Resource <strong>Management</strong> in Ethiopian Highlands: ........................................................ 282<br />
Institutions, <strong>Management</strong> Practices and Challenges <strong>of</strong> Small-Scale Irrigation Systems in<br />
Ethiopia: A Case Study <strong>of</strong> Two Modern Smallholders Irrigation Systems in Western Oromia,<br />
Ethiopia ................................................................................................................................... 298<br />
<strong>Water</strong> Rights and the Processes <strong>of</strong> Negotiations Among Irrigators in .................................... 323<br />
West Shewa Zone: The Case <strong>of</strong> Indris Scheme in Toke Kutaye District................................ 323<br />
Technical and Institutional Evaluation <strong>of</strong> Geray Irrigation Scheme in West Gojjam Zone,<br />
Amhara Region........................................................................................................................ 342<br />
Discussion on Theme 3: Irrigation Institutions and Support Services........................ 354<br />
Theme four: Environmental and Health Impact <strong>of</strong> Irrigation ............ 356<br />
Case study review <strong>of</strong> investigated irrigation projects in Ethiopia ........................................... 357<br />
Environmental Impact Analysis <strong>of</strong> Two Large Scale Irrigation Schemes .............................. 370<br />
in Ethiopia ............................................................................................................................... 370<br />
GIS And Remote Sensing Integrated Environmental Impact Assessment <strong>of</strong> Irrigation Project In<br />
Finchaa Valley Area................................................................................................................ 400<br />
Entomological studies on the impact <strong>of</strong> a small-scale irrigation scheme on malaria transmission<br />
around Zeway, Ethiopia........................................................................................................... 418<br />
Malaria Transmission In Ziway, Eastern Shewa Zone, As Related to Irrgation Development439<br />
Discussion on Theme 4: Environmental and Health Impact <strong>of</strong> Irrigation .................. 455<br />
Group discussion and findings ................................................................ 461<br />
Way Forward and Synthesis Plan........................................................... 461<br />
Exhibition .................................................................................................. 461<br />
Closing........................................................................................................ 462<br />
List <strong>of</strong> Participants ……………………………………………………...463<br />
vi
Acronyms and Abbreviations<br />
ADA<br />
ADB<br />
ADLI<br />
AHFSI<br />
AIP<br />
AMU<br />
ARC<br />
ARIS<br />
ARWS<br />
BOKU<br />
CA<br />
CSA<br />
CGIAR<br />
DAP<br />
DPPC<br />
EARO<br />
EIA<br />
EIAR<br />
EPA<br />
ESDA<br />
FAO<br />
FDRE<br />
FFW<br />
GDP<br />
GMs<br />
GSDID<br />
HU<br />
IAR<br />
IDP<br />
IDP<br />
IFAD<br />
IIPE<br />
IWMI<br />
MoA<br />
MoARD<br />
MoFED<br />
MoWR<br />
Austrian Development Agency<br />
African Development Bank<br />
Agricultural Development-led Industrialization<br />
Aggregate Household Food Security Index<br />
Amibara Irrigation Project<br />
Arba Minch University<br />
Austrian Research Centers<br />
Annual Relative Irrigation Supply<br />
Annual Relative <strong>Water</strong> Supply<br />
University <strong>of</strong> Natural Resources and Applied Life Sciences<br />
Comprehensive Assessment<br />
Central Statistical Authority<br />
Consultative Group on <strong>International</strong> Agricultural Research<br />
Diammonium Phosphate Fertilizer<br />
Disaster Prevention and Protection Commission<br />
Ethiopian Agricultural Research Organisation<br />
Environmental Impact Assessment<br />
Ethiopian <strong>Institute</strong> <strong>of</strong> Agricultural Research<br />
Environmental Protection Authority<br />
Ethiopian Sugar Development Agency<br />
Food and Agriculture Organization <strong>of</strong> the United Nations<br />
Federal Democratic Republic <strong>of</strong> Ethiopia<br />
Food-for-Work<br />
Gross Domestic Product<br />
gross margins<br />
Gobu Seyo District Irrigation Desk<br />
Haramaya University<br />
<strong>Institute</strong> <strong>of</strong> Agricultural Research<br />
Irrigation Development Program<br />
Irrigation Development Strategy<br />
<strong>International</strong> Food and Agricultural Development<br />
Impact <strong>of</strong> Irrigation on Poverty and Environment<br />
<strong>International</strong> <strong>Water</strong> <strong>Management</strong> <strong>Institute</strong><br />
Ministry <strong>of</strong> Agriculture<br />
Ministry <strong>of</strong> Agriculture and Rural Development<br />
Ministry <strong>of</strong> Finance and Economic Development<br />
Ministry <strong>of</strong> <strong>Water</strong> Resources<br />
vii
MSI<br />
NDVI<br />
OIDA<br />
PA<br />
PASDEP<br />
PRSP<br />
REST<br />
RWH<br />
SNNPR<br />
SSI<br />
TUs<br />
UNDP<br />
USDA<br />
WDR<br />
WSDP<br />
Medium Scale Irrigation<br />
Normalized Difference Vegetation Index<br />
Oromia Irrigation Development Authority<br />
Peasant Association<br />
Plan for Accelerated and Sustained Development to End Poverty<br />
Poverty Reduction Strategy Paper<br />
Relief Society <strong>of</strong> Tigray<br />
Rain <strong>Water</strong> Harvesting<br />
Southern Nation and Nationalities People Region<br />
Small Scale Irrigation<br />
Tertiary Units<br />
United Nation Development Project<br />
United States Department <strong>of</strong> Agriculture<br />
<strong>Water</strong> Delivery Ration<br />
<strong>Water</strong> Sector Development Program<br />
viii
Acknowledgement<br />
This proceeding is the output <strong>of</strong> three days symposium and exhibition organized by <strong>International</strong><br />
<strong>Water</strong> <strong>Management</strong> <strong>Institute</strong> (IWMI), University <strong>of</strong> Boku, ARC Sieberdorf, Haramaya University<br />
(AU), Arbaminch University (AMU), and Ethiopian <strong>Institute</strong> for Agricultural Research (EIAR).<br />
There were over 126 participants representing institutions from Government, NGOs, private<br />
sector, irrigators and students supported by the project who have contributed to the success <strong>of</strong> this<br />
symposium.<br />
The <strong>International</strong> <strong>Water</strong> <strong>Management</strong> <strong>Institute</strong> is thankful to Austrian Government for allocating<br />
the necessary resource to undertake this research which will provide comprehensive and valuable<br />
input to the irrigated agriculture sub sector in Ethiopia in particular and Sub Saharan Africa in<br />
general.<br />
The authors and co-authors who presented pepares during this symposium also acknowledge the<br />
support and assistance provided by various parties in the successefull accomplishment <strong>of</strong> their<br />
respectieve research work.<br />
ix
Welcoming address<br />
Seleshi B. Awulachew<br />
Head, <strong>International</strong> <strong>Water</strong> <strong>Management</strong> <strong>Institute</strong> (IWMI)<br />
East Africa and Nile Basin, Addis Ababa, Ethiopia<br />
Your Excellency Ato Adugna Jebessa, State Minister, Ministry <strong>of</strong> <strong>Water</strong> Resources<br />
Representatives <strong>of</strong> partner institutions for Impact <strong>of</strong> Irrigation on Poverty and<br />
Environment from Univeritaet Bodunkultur Wien, ARC Sibersodrf, Arba Minch University,<br />
Haramaya University, Ethiopian <strong>Institute</strong> <strong>of</strong> Agriculture<br />
Delegates from various federal and regional government <strong>of</strong>fices<br />
Academic and research institutions<br />
<strong>International</strong> donor communities<br />
<strong>International</strong> and regional institutions<br />
Non governmental organizations<br />
Private sector representatives<br />
Irrigation scheme operators<br />
Ladies and gentlemen:<br />
Thank you very much for accepting our invitation on the Impact <strong>of</strong> Irrigation on Poverty and<br />
Environment symposium and poster exhibition and welcome. The symposium and exhibition are<br />
organized towards the final period <strong>of</strong> the project which has been implemented during the last<br />
three and half years<br />
The three days symposium and exhibition are organized in order to share the generated<br />
knowledge by the researchers to the wider audience and stakeholders in the irrigation sector.<br />
The symposium is organized with the objectives <strong>of</strong>:<br />
‣ Bring together and share experiences among government (policy makers, technical<br />
experts), NGOs, private sector, international donors and financial institutions and related<br />
stake holders that are working on irrigation, socio-economy and environment;<br />
‣ Disseminate and Share the results generated during the project implementation period;<br />
‣ Carry out focused discussion to explore opportunities and mechanisms through which the<br />
uptake <strong>of</strong> knowledge, application, and dissemination and out scaling <strong>of</strong> findings could be<br />
enhanced.<br />
The symposium is organized under four themes that include:<br />
1. Statues quo analysis, Characterization and Assessment <strong>of</strong> Performance <strong>of</strong> irrigation in<br />
Ethiopia:<br />
2. Irrigation Impact on Poverty and Economy<br />
3. Irrigation Policy, Institutions and Support Services)<br />
4. Environmental and Health Impact <strong>of</strong> Irrigation<br />
In total 28 papers will be presented. In addition a number <strong>of</strong> posters will also be exhibited. We<br />
will be having a number <strong>of</strong> plenary discussions and group work deliberations. You have the<br />
details <strong>of</strong> the program in your bags.<br />
xi
It is my hope that you will enjoy this event and we can make useful discussions that can lead to a<br />
good synthesis <strong>of</strong> knowledge building on the result <strong>of</strong> the project and wealth <strong>of</strong> experience and<br />
wisdom <strong>of</strong> the participants towards the support <strong>of</strong> sustainable development irrigation in Ethiopia.<br />
In order to start and <strong>of</strong>ficially open the symposium I will like to request the representative <strong>of</strong> the<br />
various institutions sitting on the podium to make opening remarks. After the opening remarks,<br />
his Excellency Ato Adugna Jebessa will make an <strong>of</strong>ficial opening speech <strong>of</strong> the symposium.<br />
Accordingly, first I will like to invite:<br />
- Pr<strong>of</strong>. Willibald Loiskandl, BOKU<br />
- Pr<strong>of</strong>. Belay Kassa, HU<br />
- Dr. Tarkegn Tadessa, AMU<br />
- Dr. Solomon Assefa, EIAR<br />
- Dr. Akissa Bahri, IWMI<br />
Thank you!<br />
xii
Welcoming address<br />
Akissa Bahri, IWMI<br />
Head, <strong>International</strong> <strong>Water</strong> <strong>Management</strong> <strong>Institute</strong> (IWMI)<br />
Africa Region, Accra, Ghana<br />
Your excellency, Mr. Ato Adugna Jebessa, State Minister <strong>of</strong> Ministry <strong>of</strong> <strong>Water</strong> Resources<br />
Dr. Leopohld Moll, Director, Austrian Development Cooperation<br />
Pr<strong>of</strong>. Willibald Loiskandl, Universität für Bodenkultur Wien<br />
Distinguished representatives <strong>of</strong> partner institutions for Impact <strong>of</strong> Irrigation on Poverty and<br />
Environment from Universität für Bodenkultur Wien, ARC Siebersdorf, University <strong>of</strong> Natural<br />
Resources and Applied Life Science, Arba Minch University, Haramaya University, Ethiopian<br />
<strong>Institute</strong> <strong>of</strong> Agriculture<br />
Ladies and gentlemen,<br />
It is with great pleasure that I welcome you all on behalf <strong>of</strong> the <strong>International</strong> <strong>Water</strong> <strong>Management</strong><br />
<strong>Institute</strong> and on my own behalf to this symposium on “Impact <strong>of</strong> Irrigation on Poverty and<br />
Environment in Ethiopia” and to this opening session.<br />
This two-day symposium is the output <strong>of</strong> a collaborative research project sponsored three years<br />
ago by the Austrian Development Agency (ADA) and implemented by the <strong>International</strong> <strong>Water</strong><br />
<strong>Management</strong> <strong>Institute</strong> (IWMI), Austrian Institutions, Universität für Bodenkultur Wien (BOKU,<br />
Vienna), Austrian Research Centers (ARC Siebersdorf), the University <strong>of</strong> Natural Resources and<br />
Applied Life Science and Ethiopian Institutions: Arba Minch University (AMU), Haramaya<br />
University (HU), the Ethiopian <strong>Institute</strong> <strong>of</strong> Agricultural Research (EIAR), the Ministry <strong>of</strong> <strong>Water</strong><br />
Resources (MoWR), the Ministry <strong>of</strong> Agriculture and Rural Development (MoARD) and the<br />
Regional Bureaus for Irrigation and Agriculture.<br />
The <strong>International</strong> <strong>Water</strong> <strong>Management</strong> <strong>Institute</strong>, member <strong>of</strong> the CGIAR system, is the leading<br />
international scientific research organization on water, food and environment, with an overall<br />
mission <strong>of</strong> “improving the management <strong>of</strong> water and land resources for food, livelihoods and<br />
nature”. In Africa, IWMI conducts research in three sub-regions; the Nile Basin and East Africa,<br />
West Africa and Southern Africa. <strong>Water</strong> scarcity, poverty, low productivity, health issues, water<br />
quality, endemic droughts and floods and transboundary conflicts in water management, along<br />
with land degradation are some <strong>of</strong> the critical issues Africa faces. IWMI works closely with<br />
Africa-wide sub–regional organizations and many national and agricultural research systems to<br />
study the land and water management challenges facing poor rural communities and to develop<br />
innovative approaches, tools and interventions that can improve food security, livelihoods, health<br />
and ecosystem services.<br />
Improved land and water management is essential for sustainable development and poverty<br />
reduction in sub-Saharan Africa including Ethiopia. I would therefore like to mention two key<br />
research programs, the Comprehensive Assessment <strong>of</strong> <strong>Water</strong> <strong>Management</strong> in Agriculture (the<br />
CA) (Comprehensive Assessment <strong>of</strong> <strong>Water</strong> <strong>Management</strong> in Agriculture. 2007) and the<br />
xiii
Investment in Agricultural <strong>Water</strong> for Poverty Reduction and Economic Growth in Sub-Saharan<br />
Africa (a collaborative program <strong>of</strong> the World Bank, FAO, IFAD, ADB and IWMI, in partnership<br />
with NEPAD, 2007) whose findings should be considered along the results <strong>of</strong> the present project.<br />
• The CA has critically evaluated the benefits, costs and impacts <strong>of</strong> the past 50 years <strong>of</strong><br />
water development, the water management challenges communities are facing today, and<br />
solutions people have developed. The results <strong>of</strong> the CA will support better investment<br />
and management decisions in water and agriculture in the near future and over the next<br />
50 years.<br />
• The synthesis report <strong>of</strong> the Agricultural Investment Study analyses the contribution to<br />
date <strong>of</strong> agricultural water management to poverty reduction and growth in the sub-<br />
Saharan Africa, the reasons for its slow expansion and apparently poor track record, as<br />
well as the ways in which increased investment in agricultural water management could<br />
make a sustainable contribution to further poverty reduction and growth.<br />
Investment in irrigation is needed to reduce poverty in rural areas. Eighty-five percent <strong>of</strong> sub-<br />
Saharan Africa’s poor live in the rural areas and depend largely on agriculture for their<br />
livelihoods. The Nile basin is home to an estimated 175 million people and more than 330 million<br />
people live in the NBEA sub-region. The Nile Basin and East Africa sub-region is far from being<br />
homogenous in terms <strong>of</strong> agro-ecology, socio-economic development, historical and political<br />
background. The Sub-region, despite having significant water and land resources, has the highest<br />
proportion <strong>of</strong> people living below the poverty line and is the most food insecure sub-region in the<br />
world. Dependence on rainfed agriculture, coupled with high rainfall variability, is one <strong>of</strong> the<br />
main causes <strong>of</strong> food insecurity. Drought is a frequent and recurrent event throughout much <strong>of</strong> the<br />
region, the impacts <strong>of</strong> which are made worse by HIV-AIDS and war. The majority <strong>of</strong> the people,<br />
over 70%, depend on subsistence agriculture. However, the resource base <strong>of</strong> land and water is not<br />
well utilized, nor appropriately managed, and is degrading very rapidly. <strong>Water</strong>-related diseases<br />
are common and a major cause <strong>of</strong> the relatively low life expectancy in the region.<br />
Agricultural growth is therefore clearly key to poverty reduction; it can also help drive national<br />
economic growth. Ethiopia relies on agriculture for a large part <strong>of</strong> its GDP (44%). Raising<br />
agricultural productivity is the most viable option for reducing poverty, and irrigation<br />
development can enhance economic development. Irrigation schemes can facilitate multiple uses<br />
<strong>of</strong> water that combine agriculture with livestock, fisheries, and other income-generating activities<br />
to enhance rural incomes and sustainability. Investment in irrigation is also needed to keep up<br />
with global demand for agricultural products and adapt to changing food preferences and societal<br />
demands, to adapt to urbanization, industrialization, and increasing allocations to the environment<br />
and to respond to climate change. Climate variability and extreme events will require water<br />
resources development, large water storage facilities, further irrigation development, and changes<br />
in the operation <strong>of</strong> existing schemes.<br />
Your excellency,<br />
Distinguished participants,<br />
Ladies and gentlemen,<br />
I hope that at the end <strong>of</strong> this symposium, we would gain insights into how various irrigation<br />
strategies have impacted on agricultural output and hence the reduction <strong>of</strong> poverty as well as<br />
improvement in the environmental conditions <strong>of</strong> Ethiopia. This should then help us to better<br />
understand the role that irrigation can play in Ethiopia’s development process and hence improve<br />
rural poverty, achieve gender equity and protect Ethiopia’s environment.<br />
xiv
It is my hope that this symposium will constitute a major step that will lead to better natural<br />
resources management in Ethiopia.<br />
On behalf <strong>of</strong> IWMI, I would like to thank you all for coming and look forward for a fruitful and<br />
rewarding symposium.<br />
Thank you<br />
xv
Opening Address<br />
H.E Dr. Leopohld Moll<br />
Director, Austrian Development Cooperation<br />
Addis Ababa, Ethiopia<br />
His Excellency Dr. Leopohld Moll, Director Austrian Development Cooperation in his oral<br />
speech said that the Austrian Government is pleased to support t the Government <strong>of</strong> the Federal<br />
Republic <strong>of</strong> Ethiopia in its effort to fight poverty and improve the well being <strong>of</strong> its people. The<br />
Austrian government recognizes the significance <strong>of</strong> irrigated agriculture in mitigating the impacts<br />
<strong>of</strong> climate variability and attaining food security in Ethiopia. He said, it is my sincere belief that<br />
the out puts <strong>of</strong> the research results <strong>of</strong> the IIPE project provides veritable information that can<br />
assist policy makers to make appropriate policy related decsions in the subsector.<br />
Finally, he wished participants a successful two days deliberation.<br />
xvi
Opening Address<br />
H.E Ato Adugna Jebessa<br />
State Minister, Ministry <strong>of</strong> <strong>Water</strong> Resources<br />
Addis Ababa, Ethiopia<br />
Dear delegates <strong>of</strong> government and non governmental organizations<br />
Representatives <strong>of</strong> academic and research organizations<br />
Dear invited guests and participants<br />
Ladies and Gentlemen,<br />
It is indeed my great pleasure to be here with you today for the opening <strong>of</strong> this important<br />
workshop on impact <strong>of</strong> irrigation on poverty and environment research in Ethiopia.<br />
As you all know there is a global consensus to fight poverty and improve human well being<br />
through appropriate measures that can target the issues related to poverty. Accordingly, in the<br />
year 2000 the MDG have set quantitative targets to be achieved by the year 2015 for the<br />
reduction <strong>of</strong> poverty, i.e. improvement in health, education, and the environment and other<br />
dimensions <strong>of</strong> human well being, particularly in sub-Saharan Africa where about 25% <strong>of</strong> the<br />
world poor live.<br />
The economy <strong>of</strong> Ethiopia is significantly agricultural based. Access to reliable water is a<br />
fundamental factor in influencing poverty and economy. In this country, recurrent droughts have<br />
caused serious failures in agricultural production that have resulted in mass starvation and loss <strong>of</strong><br />
human and animal life, not to mention the devastation <strong>of</strong> the natural environment. A more<br />
satisfactory outcome can be achieved through the development <strong>of</strong> the country's water resources<br />
for growth <strong>of</strong> productivity and irrigation, wherever opportunities exist.<br />
Population explosion and food insecurity are serious twin problems that must be addressed<br />
simultaneously on priority basis. Despite several attempts to address the situation, the problem <strong>of</strong><br />
environmental degradation, agricultural productivity and food shortage remains critical. Unless<br />
they are seriously tackled they are threats to the country and can worsen poverty in the face <strong>of</strong> the<br />
rapidly growing population.<br />
The Ministry <strong>of</strong> <strong>Water</strong> Resources in an effort to develop and utilize the countries water resources<br />
in a systematic way has prepared policy, strategy and development plans for effective and<br />
efficient water use. Through the river basin master plan studies all the potentials for irrigation<br />
developments are identified and there exists over about 3.5 million hectares <strong>of</strong> land suitable for<br />
irrigation development. In addition, improving water management in the rain fed systems as well<br />
has significant scope to increase productivity <strong>of</strong> agriculture<br />
Recognizing these facts, while small scale irrigation and rainfed agriculture water management<br />
are undertaken by regional government, medium and large scale irrigation developments have<br />
been given significant attention by the federal government and the Ministry <strong>of</strong> <strong>Water</strong> Resources<br />
xvii
in it's development program. Accordingly, 487,000 ha <strong>of</strong> land are planned to be irrigated during<br />
the PASDEP period (2009/10) in addition to the existing one. Some <strong>of</strong> these projects are ready<br />
for detail design and construction and some are already under construction. This clearly shows,<br />
substantial investment in irrigated agriculture is needed to meet targets for poverty alleviation,<br />
food security and economic growth. I would like to also stress that some <strong>of</strong> the large and medium<br />
scale irrigations are and will be designed to benefit the smallholder farmers, as the government <strong>of</strong><br />
Ethiopia strongly committed to eradicate the rural poverty. Notable example is the Koga<br />
irrigation development which is designed to develop about 6,000ha with over 7,000 (?)<br />
beneficiaries. As the development <strong>of</strong> large schemes for small holders is new experience for the<br />
country, it is important for research institutions to support such endeavors by undertaking<br />
adoptive and applied research which can support this and future development in sustainable<br />
manner<br />
While many Sub-Saharan countries and Ethiopia alike committed to water infrastructure<br />
development, lending for irrigation in Sub-Saharan Africa has declined considerably over the past<br />
few decades. But still, there are reports that indicate many Bank-financed irrigation projects had<br />
produced satisfactory outcomes and the outputs <strong>of</strong> this particular research are expected to prove<br />
that the benefits <strong>of</strong> investment have reached the poor. However, it is clear that there are issues to<br />
be addressed and constraints to be overcome if investments in agricultural water or irrigation<br />
development are to achieve viability and sustainability.<br />
Among other factors, capacity building stands as a key factor to obtain diversified expertise and<br />
to increase knowledge that is required for sustainable irrigation and drainage. There are pertinent<br />
issues with regard to technology, material and equipment selection and even methodologies in<br />
engineering design <strong>of</strong> irrigation projects. In this regard, researchers are expected to contribute<br />
significantly towards scientific, practical, and multidisciplinary solution for the prevailing<br />
irrigation development constraints and be able to advice decision makers. At this juncture, I<br />
would like to mention the MOU signed with <strong>International</strong> <strong>Water</strong> <strong>Management</strong> <strong>Institute</strong> (IWMI) is<br />
having such an objective <strong>of</strong> initiating conceptual and practical research on high priority areas in<br />
collaboration with Ethiopian partners, including issues that would have impact on the<br />
development.<br />
Another important area is to ensure that all the partners public, private, civil society as well as<br />
donor/lending partners, have sufficient information from our data base to allow them understand<br />
the benefits <strong>of</strong> irrigation development from both social and economic perspective. I hope studies<br />
like the Impact <strong>of</strong> Irrigation on Poverty and Environment for which this symposium is organized<br />
can help to enhance such understanding and synthesize the new knowledge generated.<br />
Finally, I would like to thank IWMI, BOKU, ARC Sieberdorf, and Ethiopian Institutions such as<br />
Arba Minch University, Haramaya University and Ethiopian <strong>Institute</strong> <strong>of</strong> Agricultural Research<br />
and other collaborating institutions for the initiative that they have taken in support <strong>of</strong> irrigation<br />
development in general and conducting the related research. The Ministry <strong>of</strong> <strong>Water</strong> Resources<br />
would like to reiterate its commitment to collaborate and closely work with all stakeholders that<br />
are interested in promoting and developing the water resources <strong>of</strong> this country.<br />
Finally, for those <strong>of</strong> you who came from abroad wishing you a pleasant stay in Addis Ababa, I<br />
wish you all, success in your deliberation and I declare the workshop open.<br />
Good bless you<br />
I thank you<br />
xviii
Theme one:<br />
Status Quo Analysis, Characterization and Assessment <strong>of</strong><br />
Performance <strong>of</strong> Irrigation in Ethiopia<br />
Papers<br />
1. Status quo analysis, characterization and assessment <strong>of</strong> performance <strong>of</strong> irrigation in<br />
Ethiopia<br />
2. Comparison <strong>of</strong> irrigation performance based on management and cropping types<br />
3. Irrigated and rainfed crop production systems in Ethiopia<br />
4. Baseline survey <strong>of</strong> irrigation and rainfaid agriculture in Ethiopian part <strong>of</strong> Nile Basin
Statues quo analysis, Characterization and Assessment <strong>of</strong> Performance<br />
<strong>of</strong> Irrigation in Ethiopia<br />
Seleshi B. Awulachew and Aster Denekew Yilma<br />
<strong>International</strong> <strong>Water</strong> <strong>Management</strong> <strong>Institute</strong> for Nile Basin and East Africa<br />
s.bekele@cgiar.org<br />
Abstract<br />
This paper first looks in to the background<br />
on major challenges <strong>of</strong> Ethiopia with respect<br />
to poverty. It discuses the root cause <strong>of</strong><br />
poverty and its vicious cycle nature, the<br />
interlink <strong>of</strong> population growth, the scarcity<br />
<strong>of</strong> land and natural resources, the extension<br />
<strong>of</strong> agriculture in to marginal land, the<br />
decreasing productivity, inability to invest<br />
and deepening <strong>of</strong> poverty and further<br />
aggravation as a result <strong>of</strong> various shocks<br />
such as drought, flood, war, etc. The paper<br />
also looks in to the importance <strong>of</strong> the broad<br />
agricultural water management in general<br />
and irrigation in particular with respect to<br />
increasing productivity and capability to<br />
break the vicious cycle and opportunity to<br />
reverse in to virtuous cycle that can help<br />
eradicate poverty and develop the poor<br />
economy. The paper also looks in to how<br />
poor management <strong>of</strong> water resources and<br />
impacts <strong>of</strong> variability <strong>of</strong> rainfall and related<br />
drought affecting the socio-economy and the<br />
overall wellbeing <strong>of</strong> the country to the<br />
extent that significant population became<br />
dependent on imported food. Results <strong>of</strong><br />
broad assessment <strong>of</strong> water resources,<br />
database <strong>of</strong> irrigation development and<br />
potential, characterization by typology and<br />
major performance in Ethiopia are<br />
presented. Key water resources information<br />
related to each <strong>of</strong> the 12 river basins in<br />
Ethiopia is summarized. Details <strong>of</strong> existing<br />
irrigation and future potential are also<br />
captured in the paper. A geographic<br />
information system (GIS) database<br />
describing irrigation by typology, region and<br />
location, scheme size, type <strong>of</strong> structures,<br />
water source, number <strong>of</strong> beneficiaries,<br />
investment cost, etc, are some <strong>of</strong> the<br />
important attributes <strong>of</strong> the database. In<br />
addition, schemes that are operational and<br />
failed are identified in the database. Based<br />
on the broad database, performances <strong>of</strong> the<br />
schemes are highlighted. Furthermore, the<br />
various sites that are used in the detail study<br />
and the selection criteria for the impact <strong>of</strong><br />
irrigation on poverty and environment<br />
project and the specific characteristics <strong>of</strong><br />
these sites are described.<br />
Key words: poverty, water scarcity,<br />
database, GIS, irrigation, water resources.<br />
1. Introduction<br />
Ethiopia is mainly agrarian nation and the<br />
rainfed system has always played a central<br />
role in Ethiopian society. Dependency on<br />
rainfed system has put more than 80% <strong>of</strong> the<br />
society at the mercy <strong>of</strong> meteorological<br />
variability.<br />
Percentage <strong>of</strong> population<br />
90<br />
88<br />
86<br />
84<br />
82<br />
80<br />
78<br />
76<br />
Ethiopia's agricultural population<br />
1979-1981 1989-1991 1999-2001 2003 2004<br />
Figure 1: Ethiopia’s agricultural population<br />
(data extracted from the World Bank<br />
Development Indicator WB 2006b)<br />
Year<br />
2
Figure 1, shows the dependency <strong>of</strong><br />
Ethiopian population on agriculture and in<br />
25 years the agricultural population reduced<br />
only from 89% to 81%. Agriculture in<br />
Ethiopia is dominated by small holder<br />
production <strong>of</strong> cereals under rainfed<br />
condition, accounting a total area <strong>of</strong><br />
approximately 10 million hectares.<br />
According to Central Statistics Authority<br />
[CSA, 1995-1999], within agriculture, some<br />
60 percent <strong>of</strong> the output is from crops, with<br />
livestock and forestry producing 30 percent<br />
and 7 percent respectively. Crop production<br />
by area is predominantly cereals (84.55<br />
percent) followed by pulses (11.13 percent)<br />
and others (4.32 percent). Five crops<br />
account for almost all cereal production:<br />
maize (15.75 percent), teff (Eragrostis tef)<br />
(25.78 percent), barley (12.29 percent),<br />
sorghum (12.39 percent) and wheat (10.76<br />
percent). According to Mulat et al (Mulat et<br />
al 2004), agriculture remains the main<br />
activity in the Ethiopian economy. It is the<br />
most important contributor to the country’s<br />
GDP: accounted, on the average, 65.5%,<br />
52.7% and 47.1% <strong>of</strong> the GDP during 1960-<br />
1973, 1974-1991 and 1992-2002,<br />
respectively.<br />
Despite the above mentioned facts, there are<br />
a number <strong>of</strong> factors that led to failure <strong>of</strong><br />
achieving food security in Ethiopia. The<br />
major causes for food insecurity in Ethiopia<br />
can be associated to the following:<br />
- Population growth and associated<br />
inadequate resource base to support<br />
- Lack <strong>of</strong> growth <strong>of</strong> production and<br />
productivity<br />
- Vulnerability to climatic variability<br />
- Political instabilities and war<br />
- and poverty<br />
The main development objective <strong>of</strong> the<br />
Ethiopian Government is poverty<br />
eradication. Hence, the country's<br />
development policies and strategies are<br />
geared towards this end (MOFED: PASDEP<br />
2006). As Ethiopia’s economy and majority<br />
<strong>of</strong> people’s livelihood is dependent on<br />
Agriculture, to develop the socio-economy<br />
<strong>of</strong> Ethiopia and eradicate poverty, the policy<br />
and interventions should focus on<br />
Agriculture as entry point. The current rural<br />
development policy and strategy <strong>of</strong> the<br />
government clearly stipulates this as<br />
priority.<br />
Building further on the above factors, the<br />
poverty situation in Ethiopia is a vicious<br />
cycle in nature and requires key entry points<br />
for intervention. The following figure is a<br />
schematic example showing poverty is<br />
linked to and aggravated by various<br />
demographic, biophysical, production<br />
system, productivity and other socioeconomic<br />
factors.<br />
Inability to<br />
invest to<br />
or improve<br />
land<br />
productivity<br />
Population<br />
growth<br />
Poor health,<br />
malnutrition<br />
Scarcity <strong>of</strong> land<br />
in the<br />
settlement areas<br />
Deepening<br />
poverty<br />
Deforestation,<br />
land & water<br />
degradation<br />
Poor<br />
productivity,<br />
food insecurity<br />
Figure 2: The vicious cycle <strong>of</strong> poverty and<br />
aggravating factors in Ethiopia<br />
Agriculture<br />
pushed in to<br />
marginal land<br />
Socioeconomic development and<br />
civilization <strong>of</strong> human being is closely<br />
associated to ability to utilize and control<br />
water resources. <strong>Water</strong> serves as a positive<br />
input for many activities and play negative<br />
roles. Positively, it serves essential<br />
biological needs, as basic element <strong>of</strong> social<br />
and economic infrastructure, and as a natural<br />
amenity contributing psychological welfare.<br />
<strong>Water</strong> also serves in negative roles such as<br />
flooding and diseases transmission. In<br />
Ethiopia, as in all societies, there has always<br />
been a struggle to reduce the<br />
negative/destructive impacts <strong>of</strong> water and<br />
3
enhance its positive/productive impacts, but<br />
with limited focus and capacity. These<br />
efforts have been increased since the past<br />
three to four decades and more so during the<br />
last few years. However, the ability to use<br />
and enhance the positive role <strong>of</strong> water and to<br />
reduce its negative impacts, in Ethiopia in<br />
general has been low.<br />
2. The Importance <strong>of</strong> Agricultural <strong>Water</strong><br />
<strong>Management</strong> and Irrigation in Ethiopia<br />
It is essential to increase agricultural<br />
productivity in order to eradicate poverty,<br />
improve the economy, and reduce<br />
degradation. Irrigation and improved<br />
agricultural water management practice is<br />
important in Ethiopia for the following<br />
major reasons:<br />
- Population in Ethiopia is rapidly<br />
increasing (over 80,000,000 currently),<br />
land holding size particularly in<br />
highland areas is decreasing<br />
substantially. Intensification and<br />
increasing productivity <strong>of</strong> land and<br />
labour is essential to produce enough<br />
food, particularly from the limited<br />
available land.<br />
- Agriculture is primarily rain fed<br />
dependent. Unless the rain fed system is<br />
upgraded through improved water<br />
management, recurrent drought and dry<br />
spell continue to affect productivity and<br />
hamper agricultural production<br />
- Ethiopia’s economy is strongly<br />
dependent on rain fed based agriculture,<br />
and rainfall variability impact costs the<br />
economy significantly. Therefore, unless<br />
agriculture is de-linked from the strong<br />
linkage to rainfall variability, the<br />
economy <strong>of</strong> the country will continue to<br />
be severely affected. Particularly, this<br />
could be more severe under the strong<br />
impact <strong>of</strong> climate change and<br />
variability. WB (2006) and IWMI<br />
(2007) describe the impact <strong>of</strong> costs<br />
1/3rd <strong>of</strong> growth potential <strong>of</strong> Ethiopian<br />
economy. The impact <strong>of</strong> this can be<br />
shown from the recent information.<br />
According to MOFED (MoFED 2006),<br />
GDP Growth <strong>of</strong> Ethiopia in 2002/3 was<br />
-3.3% during the drought year while the<br />
previous and latter years were positive.<br />
In 2004/5, GDP growth was 11.9% and<br />
2005/6 was 10.6%, which brings the<br />
three year average down to 6.4%.<br />
- Improved agricultural water<br />
management and irrigation can increase<br />
productivity <strong>of</strong> land, water and labor.<br />
The following figure based on Central<br />
Statistical Authority data and Mulat et al<br />
(2004) shows the crop productivity and<br />
productivity growth for the period <strong>of</strong> the<br />
last two decades for major crops in<br />
Ethiopia. However, recent data <strong>of</strong><br />
2004/5 onwards and predicted<br />
productivity data according to MOFED<br />
(2006) shows there has been increase in<br />
productivity <strong>of</strong> cereals. The increase is<br />
mainly attributed to increased input use<br />
(seed, fertilizers, and pesticides) and<br />
improved water management for<br />
agriculture in certain areas. The strategy<br />
to achieve the future targeted result<br />
focuses to use intensification (irrigation,<br />
vertisol management, seed, fertilizer,<br />
pest control) and expansion.<br />
4
Yield in ton/ha<br />
Cereal Yields in Ethiopia (1980-2001)<br />
Cereal Yield t/ha<br />
Pulses yield in t/ha<br />
1.6<br />
Oilseed Yield t/ha)<br />
1.4<br />
1.2<br />
1<br />
0.8<br />
0.6<br />
0.4<br />
0.2<br />
0<br />
1980 1983 1986 1989 1992 1995 1998 2001<br />
Year<br />
Figure 3: Crop yield in Ethiopia for the period <strong>of</strong> 1980-2001 (Data source: Mulat 2004)<br />
Productivity (Q/ha) plan<br />
40<br />
35<br />
31.57<br />
34.84<br />
30<br />
25<br />
20<br />
15<br />
14 .3 5<br />
20.03<br />
22.91<br />
25.85<br />
10<br />
5<br />
0<br />
2004/05 2005/06 2006/07 2007/08 2008/09 2009/10<br />
Year<br />
Figure 4: Cereal productivity and productivity Plan <strong>of</strong> Ethiopia (Data source: MOFED, PASDEP<br />
2006)<br />
- Contrary to the first bullet above, there are<br />
considerable land and water resources in<br />
various relatively remote parts <strong>of</strong> the<br />
country. The constraining factors for<br />
development however are low infrastructure<br />
that includes accessibility such as roads, and<br />
communication; unregulated water<br />
resources; no settled people to develop the<br />
resources; lack <strong>of</strong> capital; and lack <strong>of</strong><br />
knowledge and capacity. Improving on these<br />
can enhance development <strong>of</strong> these resources.<br />
Particularly, the irrigation development<br />
through improved infrastructure is an<br />
important measure that may be pursued in<br />
Ethiopia to cope with complex problems<br />
leading to poverty and insufficient food<br />
production<br />
The major sources <strong>of</strong> growth for Ethiopia is<br />
still conceived to be the agriculture sector,<br />
as it is expected to be insulated from drought<br />
shocks through enhanced utilization <strong>of</strong> the<br />
water resource potential <strong>of</strong> the country<br />
(through development <strong>of</strong> small scale<br />
irrigation, water harvesting, and on-farm<br />
diversification), coupled with strengthened<br />
linkages between agriculture and industry<br />
5
(agro-industry), thereby creating demand for<br />
agricultural output (MOFED 2006).<br />
Irrigation development, including large and<br />
medium scale irrigation development, as<br />
public schemes, commercial farming and for<br />
small holders are getting importance under<br />
the current government, particularly since<br />
2004.<br />
3. Irrigation Status in Ethiopia<br />
3.1 History<br />
There is no documented history <strong>of</strong> water<br />
management for agriculture. Remnants <strong>of</strong><br />
millennium old water storage structures for<br />
non-agricultural use around Axum in Tigray<br />
show the oldest usage <strong>of</strong> water in a<br />
controlled manner. Certain, non-irrigation<br />
related technologies to conserve water and<br />
soil have been practiced by Konso people in<br />
the South, at least for the last four hundred<br />
years. However, there is no welldocumented<br />
resource material on water use<br />
for irrigation in Ethiopia. Modern irrigation<br />
development in Ethiopia is not having<br />
centuries old history. There is no written<br />
history on how Ethiopia has used irrigation<br />
technologies to secure agricultural<br />
production, as the vast country with small<br />
population had adequate natural resources<br />
base and rainfall to produce the food<br />
requirements without the need to develop<br />
irrigation.<br />
Private concessionaires who operated farms<br />
for growing commercial crops such as<br />
cotton, sugarcane and horticultural crops<br />
started the first formal irrigation schemes in<br />
the 1950s in the upper and lower Awash<br />
Valley. In the 1960s irrigated agriculture<br />
was expanded in all parts <strong>of</strong> the Awash<br />
Valley and in the Lower Rift Valley. The<br />
Awash valley saw the biggest expansion in<br />
view <strong>of</strong> the water regulation afforded by the<br />
construction <strong>of</strong> the Koka dam and reservoir<br />
that regulated flows with benefits <strong>of</strong> flood<br />
control, hydropower and assured irrigation<br />
water supply. In addition, the construction <strong>of</strong><br />
the tarmac Addis-Assab road opened the<br />
Awash Valley to ready markets in the<br />
hinterland as well as for export (Metaferia,<br />
2004). Although certain aspects <strong>of</strong> the<br />
development during the pre-Derge era have<br />
wrong doings in terms <strong>of</strong> property and land<br />
rights, there has been remarkable emergence<br />
<strong>of</strong> irrigation development and establishment<br />
<strong>of</strong> agro industrial centers. Teshome (2003)<br />
has reviewed and discussed the land tenure<br />
system in the various regimes in Ethiopia.<br />
These establishments were highly motivated<br />
private sectors, which are both export and<br />
domestic market oriented.<br />
During the Derge era, all private farms were<br />
nationalized to establish the so-called state<br />
farms, thereby ending the embryonic private<br />
sector. The government pursued the<br />
development <strong>of</strong> medium and large-scale<br />
irrigation schemes in a number <strong>of</strong> river<br />
basins in addition to expansion in the Awash<br />
Valley. The Amibara Irrigation Project in<br />
the Middle Awash, Alwero Irrigation Project<br />
in Gambella, Gode-West Irrigation near<br />
Gode town, the Omorrate Irrigation scheme<br />
in Southern Omo, the Tana Beles, the<br />
Fincha Suger State, etc are some <strong>of</strong> the<br />
expansions, most <strong>of</strong> which are suspended<br />
currently.<br />
Following the downfall <strong>of</strong> the Derge, the<br />
current government withdrew from the<br />
expansion <strong>of</strong> State Farms and further<br />
construction <strong>of</strong> medium and large-scale<br />
irrigation (Metaferia, 2004). This has been<br />
the trend until the aftermath <strong>of</strong> the 2002/3<br />
severe drought that has caused about 15<br />
Million population under extreme food<br />
shortage. Not only the government hesitated<br />
to expand medium and large scale irrigation<br />
but also it has interrupted finalization <strong>of</strong> the<br />
above 5 major irrigation projects started in<br />
the former regime. On the other hand, the<br />
government indeed provided certain<br />
attention on small scale irrigation mostly in<br />
the food insecure areas. Nevertheless, in the<br />
water sector development program (WSDP)<br />
it was identified to expand large and<br />
medium scale irrigation by about 147,000 ha<br />
6
and small scale irrigation by about 127,000<br />
ha. As strategy <strong>of</strong> developing irrigation<br />
sector, the plan <strong>of</strong> the government targets to<br />
develop a total <strong>of</strong> additional 274,612 ha <strong>of</strong><br />
land which brings the total irrigated area <strong>of</strong><br />
about 478,000 ha by 2015. Despite ignoring<br />
the medium and large-scale sector for a<br />
decade long, recently after the development<br />
<strong>of</strong> the water sector development program,<br />
there is a growing attention to the irrigated<br />
agricultural sector. The revised strategy even<br />
plans to put more irrigated land in short<br />
period <strong>of</strong> time.<br />
3.2 <strong>Water</strong> Resources, Irrigation Typology<br />
and Existing Schemes<br />
Ethiopia has 12 river basins. The total mean<br />
annual flow from all the 12 river basins is<br />
estimated at about 122 BMC (WRMP,<br />
1999); Figure 5 and <strong>Table</strong> 1 show the river<br />
basins and distributions <strong>of</strong> water resources<br />
in various basins. The water resources<br />
distribution shows slightly higher values as<br />
extracted from recent master plan studies.<br />
Figure 5: Ethiopia’s River Basins<br />
7
<strong>Table</strong> 1: <strong>Water</strong> resources distribution by river basins <strong>of</strong> Ethiopia<br />
Estimated ground<br />
River Basin Area (Km 2 ) Run<strong>of</strong>f (Bm 3 ) water potential<br />
(Bm 3 )<br />
Tekeze 82,350 8.2 0.20<br />
Abbay 199,812 54.8 1.80<br />
Baro-Akobo 75,912 23.6 0.28<br />
0.13 Rech/yr<br />
Omo-Ghibe 79,000 16.6 0.42<br />
(.10) Rech /yr<br />
Rift Valley 52,739 5.6 0.10<br />
Mereb 5,900 0.65 0.05<br />
Afar /Denakil 74,002 0.86 -<br />
Awash 112,696 4.9 0.14<br />
Aysha 2,223 - -<br />
Ogaden 77,121 - -<br />
Wabi-Shebelle* 202,697 3.16 0.07<br />
Genale-Dawa* 171,042 5.88 0.14<br />
Total 1,135,494 124.25 2.86<br />
Source: IWMI Working paper 123 (Awulachew et. al, 2007)<br />
In addition, Ethiopia has also 11 fresh and 9<br />
saline lakes, 4 crater lakes and over 12<br />
major swamps or wetlands. Majority <strong>of</strong> the<br />
Lakes are found in the Rift Valley Basin.<br />
For details refer Awulachew et al (2007).<br />
The total surface area <strong>of</strong> these natural and<br />
artificial lakes in Ethiopia is about 7,500<br />
km2, representing about 0.67% <strong>of</strong> area <strong>of</strong><br />
Ethiopia. Most <strong>of</strong> the lakes except Ziway,<br />
Tana, Langano, Abaya and Chamo have no<br />
surface water outlets, i.e. they are endhoric.<br />
Lakes Shala and Abiyata have<br />
concentrations <strong>of</strong> chemicals.<br />
3.2 Irrigation Typology<br />
The irrigation schemes in Ethiopia are<br />
divided according to the following typology:<br />
o Small scale: These are schemes less<br />
than 200ha. Two major categories<br />
under this are modern schemes<br />
which usually have fixed or<br />
improved water control/diversion<br />
structures and water users<br />
o<br />
o<br />
associations that have by laws and<br />
traditional schemes – developed and<br />
managed by community tradition<br />
and usually characterized by non<br />
fixed structures and practiced<br />
traditionally.<br />
Medium scale: Schemes exceeding<br />
200ha but less than 3,000ha<br />
Large scale: schemes exceeding<br />
3,000ha<br />
The latter two are mostly public schemes,<br />
owned and managed by the government, and<br />
in certain cases by large communities.<br />
There are also irrigation typologies that are<br />
not clearly captured in policy and strategy<br />
documents. These are<br />
o <strong>Water</strong> harvesting based irrigation;<br />
e.g. Household based minute<br />
irrigation;<br />
o Ground water irrigation;<br />
o In-situ Agricultural <strong>Water</strong><br />
<strong>Management</strong>.<br />
8
etc. For details refer Awulachew et al<br />
(2007).<br />
3.3 Existing Irrigation Schemes<br />
One <strong>of</strong> the objectives <strong>of</strong> impact <strong>of</strong> irrigation<br />
on poverty and environment project is to<br />
develop GIS database <strong>of</strong> irrigation schemes<br />
to understand the spatial distributions and<br />
their characteristics. Accordingly, a database<br />
have been developed for about 790 modern<br />
irrigation schemes having various attributes<br />
such as name, administrative locations,<br />
georefenece, type <strong>of</strong> irrigation, typology,<br />
Based on this the following map is one <strong>of</strong><br />
the products <strong>of</strong> the database, showing<br />
irrigation distribution in Ethiopia based on<br />
attribute <strong>of</strong> typology and regions. Note also<br />
that the map is not showing the complete list<br />
<strong>of</strong> the irrigation schemes, as some <strong>of</strong> the<br />
geo-referencing information is missing and<br />
the map represents 107 schemes <strong>of</strong> complete<br />
large and medium scale irrigation and some<br />
small-scale irrigation.<br />
BENISHANGUL<br />
-GUMUZ<br />
Angereb River<br />
Atbara River<br />
TIGRAY<br />
Abbay River<br />
Tekeze River<br />
AMHARA<br />
ADDIS ABEBA<br />
AFAR<br />
DIRE DAWA<br />
HARARI<br />
Irrigation Schemes<br />
Large Scale<br />
Medium Scale<br />
Small Scale<br />
Rivers<br />
Lakes<br />
Gibe River<br />
Baro River<br />
GAMBELLA<br />
Gojeb River<br />
OROMIA<br />
SOMALI<br />
SOUTHERN<br />
REGION<br />
Wabeshebele River<br />
·<br />
Awash River<br />
Genale River<br />
0 165 330 660<br />
Kilometers<br />
Figure 6: Existing Irrigation schemes distributed in the regional states <strong>of</strong> Ethiopia<br />
According to MOFED (2006), with respect<br />
to irrigation development, within the<br />
program period <strong>of</strong> PASDEP 2004/2005 to<br />
2009/2010, pre-design studies will be<br />
carried out for 17,988 hectares, full-fledged<br />
design studies will be undertaken on<br />
464,051 hectares, and construction works<br />
will be completed for 430,061 hectares.<br />
Currently, actual implementation projects at<br />
Tendaho and Kessem totaling about 90,000<br />
ha in the Awash Valley, 7,000ha Koga<br />
irrigation development in Blue Nile River<br />
Basin are actually near completion. There<br />
are also many additional scale development<br />
projects under construction invested by<br />
regional governments, donors and NGOs<br />
and private sector.<br />
3.4 Irrigation Potentials by River Basins<br />
In Ethiopia, under the prevalent rain fed<br />
agricultural production system, the<br />
progressive degradation <strong>of</strong> the natural<br />
resource base, especially in highly<br />
9
vulnerable areas <strong>of</strong> the highlands coupled<br />
with climate variability have aggravated the<br />
incidence <strong>of</strong> poverty and food insecurity.<br />
<strong>Water</strong> resources management for agriculture<br />
includes both support for sustainable<br />
production in rain fed agriculture and<br />
irrigation (Awulachew et al 2005).<br />
Currently, the MoWR has identified 560<br />
irrigation potential sites on the major river<br />
basins. The total potential irrigable land in<br />
Ethiopia is estimated to be around 3.7<br />
million ha (Awulachew et al 2007). <strong>Table</strong> 2<br />
and Figure 7 show the irrigation<br />
development potential by river basins in<br />
Ethiopia. Detail characterization <strong>of</strong> the<br />
potentials by basins is provided in<br />
Awualchew et al (2007).<br />
<strong>Table</strong> 2: Irrigation Potential in the River Basins<br />
Basin<br />
Catchment<br />
Area (Km 2 )<br />
Irrigation potentials (Ha)<br />
(Respective recent master plan studies)<br />
Small Medium Large Total<br />
scale scale scale<br />
WAPCOS, 1995<br />
Total<br />
Drainag<br />
e Area<br />
(km 2 )<br />
Irrigable<br />
Area<br />
(Ha)<br />
% Irrigable<br />
Area <strong>of</strong> the<br />
Country<br />
Abbay 198,890.7 45,856 130,395 639,330 815,581 201,346 1001000 27<br />
Tekeze 83,475.94 N/A N/A 83,368 83,368 90,001 317000 8.5<br />
Baro-Akobo 76,203.12 N/A N/A 1,019,523 1,019,523 74,102 985000 26.5<br />
Omo-Ghibe 79,000 N/A 10028 57900 67,928 78,213 445000 12<br />
Rift Valley 52,739 N/A 4000 45700 139,300 52,739 139000 3.7<br />
Awash 110,439.3 30,556 24,500 79,065 134,121 112,697 205000 5.5<br />
Genale-Dawa 172,133 1,805 28,415 1,044,500 1,074,720 117,042 423000 11.4<br />
Wabi-Shebele 202,219.5 10,755 55,950 171,200 237,905 102,697 200000 5.4<br />
Danakil 63,852.97 2,309 45,656 110,811 158,776 74,102 - -<br />
Ogaden 77,121 - 77,121 - -<br />
Ayisha (Gulf 2,000 - 2,000 - -<br />
<strong>of</strong> Aden)<br />
Total 1,118,074.53 3,731,222 982,060 3,715,000 100<br />
Note: The national water resources master plan (WAPCOS, 1995) was a desk study without<br />
significant field investigation.<br />
10
Figure 7: Irrigation Potentials in Ethiopia by River Basins<br />
11
The complete database is developed for<br />
existing irrigation development and irrigation<br />
potential. We trust that this database creates<br />
important information system and a foundation<br />
for complete and comprehensive database that<br />
can be updated continuously for irrigation<br />
development in Ethiopia. The database is also<br />
made available to regional irrigation<br />
development bureaus and federal institutions<br />
for use and further updating. This information<br />
system establishes a public good and any<br />
interested institution or individual can receive<br />
a copy. The available formats for sharing<br />
include GIS products, Micros<strong>of</strong>t Excel or<br />
Micros<strong>of</strong>t Access database categorized per<br />
typology, river basins and regions.<br />
4. General performance <strong>of</strong> the irrigated<br />
systems<br />
The performances <strong>of</strong> the existing irrigation<br />
schemes are highly variable. Some <strong>of</strong> the<br />
schemes from all typologies in terms <strong>of</strong> water<br />
use efficiency, productivity, sustainability are<br />
performing very well, while some are not<br />
performing efficiently, interrupted while under<br />
construction, abandoned after implementation,<br />
or transferred from public to private or<br />
community and their performances are not<br />
known. Many successful schemes are<br />
providing increased income, higher<br />
productivity, significant job opportunity and<br />
considerable contribution to the economy. The<br />
existing irrigated schemes are estimated at<br />
about 2% <strong>of</strong> the total agricultural land but<br />
contribute over 5% <strong>of</strong> the agricultural<br />
production. On the other hand, there are also a<br />
number <strong>of</strong> schemes with critical problems<br />
leading to complete abandonment or under<br />
performance, missing the targets <strong>of</strong><br />
performance in terms <strong>of</strong> land area developed,<br />
number <strong>of</strong> beneficiaries or sustainability. The<br />
assessment related to the database<br />
development, see also Awulachew et al (2007)<br />
reveals that 17% to 22% <strong>of</strong> schemes in the<br />
Amhara, SNNPR, Oromia and Tigray,<br />
particularly small scale irrigation schemes fall<br />
under this category.<br />
A number <strong>of</strong> medium and large irrigation<br />
schemes, with a total area <strong>of</strong> 44,050 hectares,<br />
that were under construction, during the<br />
previous government, were suspended by the<br />
present one. The underlying reason seems to<br />
be the policy <strong>of</strong> market economy precluding<br />
government involvement in such economic<br />
activities added with the complexity <strong>of</strong> the<br />
projects that were under establishment at<br />
remote areas with low infrastructure,<br />
insufficient labor and market linkage.<br />
However, the wisdom <strong>of</strong> the decision, for<br />
abandonment <strong>of</strong> development schemes on<br />
which hundreds <strong>of</strong> million have been invested,<br />
remains to be questionable. It might be wiser<br />
to finalize the schemes and settle smallholders<br />
<strong>of</strong> the area and/or encourage private operators<br />
to take over under an attractive/ acceptable<br />
arrangement. On the contrary, private<br />
initiatives to takeover and finish some <strong>of</strong> the<br />
schemes - Meki-Zeway, Belbela & Wedecha,<br />
Alwero - either have not been accepted or have<br />
failed <strong>of</strong> their own accord until recently<br />
whereby the former two have attracted the<br />
attention <strong>of</strong> flower farmers. According to<br />
MCE (2004) some <strong>of</strong> the schemes have been<br />
turned over to party affiliated companies with<br />
limited success. These projects represent<br />
priority schemes for rehabilitation and<br />
completion.<br />
Besides the suspended schemes a total <strong>of</strong><br />
26,347 ha are transferred from public to<br />
private or communal developers. The<br />
operation <strong>of</strong> this transferred schemes are<br />
variable. Some are successful, some are failed<br />
after transfer and the performances <strong>of</strong> some are<br />
not known. MCE (2004) and Awulachew et al<br />
(2007) discuss these.<br />
5. Conclusion<br />
This paper, which is related to the wider<br />
impact <strong>of</strong> irrigation on poverty and<br />
environment research project, provided<br />
information and database on the water<br />
resources <strong>of</strong> Ethiopia, potential <strong>of</strong><br />
development, extent <strong>of</strong> existing development<br />
focusing on irrigation development. It also<br />
discussed irrigation development categorized<br />
by various river basins and regions.<br />
Discussions were also made on schemes that<br />
are non-operational or transferred to<br />
community and private sector and their<br />
implication on performance.<br />
Specific database is also developed for existing<br />
irrigation schemes having a number <strong>of</strong><br />
attributes. The developed database has<br />
information about the existing irrigation<br />
12
schemes and potentials. The database under<br />
GIS environment, maps their spatial<br />
distribution using point maps from those<br />
schemes for which geo-refenced data is<br />
available.<br />
It is obvious that Ethiopia is extremly<br />
dependent on rain fed agriculture; its majority<br />
<strong>of</strong> population are dependent on agriculture<br />
without limit to move out <strong>of</strong> the sector,<br />
agriculture being at low productivity, rapid<br />
population growth and lack <strong>of</strong> innovation to<br />
maximize the benefit <strong>of</strong> the combination <strong>of</strong><br />
population, land and water. Hence, most <strong>of</strong> the<br />
population are poor and agriculture and overall<br />
economy is vulnerable and remains very weak<br />
against the shocks <strong>of</strong> the climatic variability.<br />
The last five years attentions towards<br />
development taking the rural development<br />
policy and strategy, the water sector policy, the<br />
irrigation development strategy, the PASDEP<br />
actions are encouraging and hoped to<br />
accelerate development endeavors. Ethiopia’s<br />
challenges towards development are immense<br />
and require significant actions and efforts<br />
addressing the various problems from various<br />
sectors that speed up rapid development.<br />
References<br />
Awulachew, S. B., Yilma, A. D., Loulseged,<br />
M., Loiskandl, W., Ayana, M. and<br />
Alamirew, T. 2007. <strong>Water</strong> Resources and<br />
Irrigation Development in Ethiopia. IWMI<br />
Working Paper 123<br />
Awulachew, S.B., Merrey, D.J, Kamara, A. B.,<br />
Van Koopen, B., De Vries, F. Penning,<br />
and Boelle, E., 2005. Experiences and<br />
Opportunities for Promoting Small-Scale<br />
/Micro Irrigation and Rainwater<br />
Harvesting for Food Security in Ethiopia,<br />
IWMI Working Paper 98, 2005<br />
MoFED (2006). Ethiopia: Building on<br />
Progress A Plan for Accelerated and<br />
Sustained Development to End Poverty<br />
(PASDEP) (2005/06-2009/10) Volume I:<br />
Main Text Ministry <strong>of</strong> Finance and<br />
Economic Development September, Addis<br />
Ababa.<br />
MoWR (Ministry <strong>of</strong> <strong>Water</strong> Resources). 1999.<br />
<strong>Water</strong> Resource <strong>Management</strong> Policy<br />
(WRMP), Addis Ababa: Ethiopia.<br />
MoWR (Ministry <strong>of</strong> <strong>Water</strong> Resources). 2002.<br />
<strong>Water</strong> Sector Development Program<br />
(WSDP), Addis Ababa: Ethiopia.<br />
Mulat Demeke, Fantu Guta and Tadelle Fered.<br />
2004 Agricultural Development In<br />
Ethiopia: Are There Alternatives To Food<br />
Aid? Department <strong>of</strong> economics, Addis<br />
Ababa University. Unpublished Report<br />
WAPCOS (<strong>Water</strong> & Power Consultancy<br />
Services (I) Ltd.). 1995. The National<br />
<strong>Water</strong> Resources Master Plan, Addis<br />
Ababa: Ethiopia.<br />
World Bank (WB) 2006a. Ethiopia:<br />
Managing <strong>Water</strong> Resources to Maximize<br />
Sustainable Growth: Country <strong>Water</strong><br />
Resources Assistance Strategy. The World<br />
Bank, Washington DC<br />
World Bank (WB) 2006b. Africa Development<br />
Indicators 2006. <strong>International</strong> Bank for<br />
Reconstruction and Development.<br />
Washington DC<br />
IWMI (<strong>International</strong> <strong>Water</strong> <strong>Management</strong><br />
<strong>Institute</strong>) 2007. Ethiopia: Agricultural<br />
<strong>Water</strong> <strong>Management</strong> Policy Briefs. Issue 1,<br />
2007<br />
MCE (Metaferia Consulting Engineers). 2004.<br />
The World Bank. Assessment <strong>of</strong><br />
experiences & opportunities on medium &<br />
large-scale irrigation in Ethiopia. Draft<br />
Report<br />
13
Comparison <strong>of</strong> irrigation performance based on management and<br />
cropping types<br />
Mekonen Ayana and Seleshi Bekele Awulachew<br />
Arba Minch University, Arbaminch, Ethiopia<br />
<strong>International</strong> <strong>Water</strong> management <strong>Institute</strong> for Nile Basin and East Africa<br />
meko_amu@yahoo.com<br />
Abstract<br />
Although performance evaluation <strong>of</strong><br />
irrigated agriculture has gained momentum<br />
since late 1980s worldwide such attempt is<br />
rarely carried out in Ethiopia. The aim <strong>of</strong><br />
this study was to assess the performance <strong>of</strong> 7<br />
irrigation schemes some <strong>of</strong> which are<br />
expected to contribute much to the national<br />
economy. Sugar cane is grown by three <strong>of</strong><br />
these schemes whereas cotton is grown by<br />
three schemes and the remaining single<br />
scheme grows tobacco. With regards to<br />
management types both government agency<br />
and community managed schemes are<br />
considered. The scheme level values <strong>of</strong><br />
water supply performance indicators show<br />
that there was no constraint <strong>of</strong> water<br />
availability and supply at scheme level. In<br />
general, schemes that grow sugar cane were<br />
found to have attained higher outputs per<br />
units <strong>of</strong> land and water used which ranges<br />
from 7794 – 10834US$/ha and 0.24 – 0.55<br />
US$/m 3 respectively. On the other hand,<br />
whether state farm or community managed,<br />
schemes that grow cotton have shown low<br />
output per units <strong>of</strong> land and water, i.e. 310 –<br />
385 US$/ha and 0.01 – 0.05 US$/m 3<br />
respectively. Large productivity<br />
performance differences have been observed<br />
between irrigation schemes with same<br />
cropping and management types. From<br />
scheme level performance values it is not<br />
simple to identify the area where and what is<br />
going wrong which is responsible for low<br />
performance. Generally, problems casing<br />
low productivity derive both in management<br />
and deterioration <strong>of</strong> physical structures.<br />
Hence investment on improvements <strong>of</strong><br />
physical structures, management and<br />
operation <strong>of</strong> the system at all levels will<br />
bring substantial improvement in the<br />
performances <strong>of</strong> cotton producing schemes.<br />
1. Introduction<br />
Irrigation is highly expected to play a major<br />
role in the realization <strong>of</strong> Ethiopian food<br />
security and poverty alleviation strategy.<br />
Irrigation enhances agricultural production<br />
and improves the food supply, income <strong>of</strong><br />
rural population, opening employment<br />
opportunities for the poor, supports national<br />
economy by producing industrial crops that<br />
are used as raw materials for value adding<br />
industries and exportable crops. From this<br />
important viewpoint irrigation projects are<br />
widely studied, planed and implemented<br />
throughout the country. However, little or no<br />
attention is given to the monitoring and<br />
evaluation <strong>of</strong> the performance <strong>of</strong> already<br />
established irrigation schemes. Whether<br />
traditional or modern, public agency or<br />
community managed many <strong>of</strong> the existing<br />
irrigation systems are deteriorating in their<br />
physical structures, operation and<br />
management.<br />
Performance assessment is used to identify<br />
the present status <strong>of</strong> the scheme with respect<br />
to the selected indicators and will help to<br />
identify ‘why the scheme is performing so’<br />
which in turn imply means <strong>of</strong> improvement.<br />
Of course performance evaluation needs<br />
relevant and reliable data which is rarely<br />
measured in Ethiopia.<br />
According to Clemmens, A.J. and Molden.<br />
D.J. (2007) two major approaches to<br />
performance evaluation are to consider, how<br />
well service is being delivered and the<br />
14
outcomes <strong>of</strong> irrigation in terms <strong>of</strong> efficiency<br />
and productivity <strong>of</strong> recourses use. To<br />
measure these performances a number <strong>of</strong><br />
indicators have been proposed and tested in<br />
different parts <strong>of</strong> the world (Molden, D. et<br />
al. 1998; Kloezen W.H., 1998; Burton, M. et<br />
al. 2000; Lorite, J. et al. 2004, Bos, M.G. et<br />
al. 2005, Vandersypen et al., 2006). IWMI’s<br />
minimum sets <strong>of</strong> performance indicators<br />
were used by many researchers to compare<br />
different irrigation schemes. Comparison<br />
helps to identify ‘who is doing what right’<br />
and what lesson can be learnt or who can be<br />
a benchmark for a particular activity. The<br />
objective <strong>of</strong> this study was to assess the<br />
performance <strong>of</strong> 7 irrigation schemes in<br />
Ethiopia based on management and<br />
cropping types using IWMI’s performance<br />
indicators.<br />
2. Technical background on<br />
performance assessment<br />
Performance can be simply defined as “the<br />
level <strong>of</strong> achievement <strong>of</strong> desired objectives”<br />
(Mohtadullah, K., 1993). Indicators are used<br />
to measure performance. An indicator is<br />
some number that describes the level <strong>of</strong><br />
actual achievement in respect <strong>of</strong> one <strong>of</strong> the<br />
objective <strong>of</strong> irrigation system. Indicators are<br />
used to simplify the otherwise complex<br />
internal and external factors affecting the<br />
performance <strong>of</strong> irrigated agricultural system.<br />
Performance can be measured from process<br />
and output points <strong>of</strong> view. Process measures<br />
<strong>of</strong> performance relate to a system’s internal<br />
operations and procedures whereas output<br />
measures <strong>of</strong> performance examine the<br />
quality and quantity <strong>of</strong> the system’s final<br />
output (Small, L. and M. Svendsen, 1990).<br />
While quoting the value <strong>of</strong> certain<br />
indicators, at a particular irrigation system<br />
and time, it means that all other factors and<br />
processes are ignored or neglected. The fact<br />
that an indicator services as a guideline for<br />
further decision making it should be<br />
carefully chosen, measured and interpreted.<br />
Irrigation performance, whether bad or<br />
good, is the result <strong>of</strong> verities <strong>of</strong> activities<br />
such as planning, design, construction,<br />
operation <strong>of</strong> facilities, maintenance and<br />
proper application <strong>of</strong> irrigation water and<br />
agronomic activities (Small L. and Svendsen<br />
M. 1990). Facilitation and execution <strong>of</strong> these<br />
activities requires proper coordination <strong>of</strong> six<br />
functional processes <strong>of</strong> irrigation, i.e.<br />
personnel management and support,<br />
equipment management, financial<br />
management and accounting, and resources<br />
mobilization. Planning, design and<br />
construction <strong>of</strong> irrigation schemes are<br />
mainly dealing with creation <strong>of</strong> physical<br />
infrastructure to facilitate the capturing <strong>of</strong><br />
water from its source and transportation up<br />
to the farm level. These physical facilities<br />
need to be properly operated to ensure the<br />
capturing, allocation and delivery <strong>of</strong> water at<br />
the right time and adequate quantity.<br />
Maintenance activities are designed to<br />
ensure the capabilities <strong>of</strong> physical<br />
infrastructure to deliver the intended amount<br />
<strong>of</strong> water over the project life time.<br />
Application <strong>of</strong> water to the field is the core<br />
activity <strong>of</strong> irrigation which is designed to<br />
disperse the incoming stream from higher<br />
level canal over the field thereby storing in<br />
the crop root zones. Substantial<br />
improvements in the performance <strong>of</strong> such a<br />
complex system is not possible by making<br />
big improvements at only one level within<br />
the system (Clemmens A.J. & Molden D.J.,<br />
2007). Physical or management<br />
improvements may need to be made at all<br />
levels before substantial improvements in<br />
the performance can result.<br />
Gorantiwar S.D. and I.K. Smout (2005) have<br />
summarized performance measures<br />
proposed by various researches into<br />
allocation type and scheduling types.<br />
Allocation types performance measures are<br />
those which need to be attained primarily<br />
during the allocation <strong>of</strong> the resources at the<br />
planning and operation stages. Productivity<br />
and equity are performance measures under<br />
allocation type category. Scheduling type<br />
performance measures consists <strong>of</strong> irrigation<br />
scheduling, i.e. temporal and spatial<br />
distribution <strong>of</strong> irrigation water to the users.<br />
This measures adequacy, reliability,<br />
flexibility, efficiency and sustainability.<br />
15
Scheduling should be such that water<br />
deliveries need to be adequate both in<br />
planning and operation, reliable, flexible and<br />
sustainable. The same authors grouped these<br />
two categories <strong>of</strong> performance measures<br />
into: economic (productivity), social<br />
(equity), environmental (sustainability) and<br />
management (reliability, adequacy,<br />
efficiency and flexibility).<br />
Conveyance efficiency is used to compare<br />
the amount <strong>of</strong> water delivered at the turnouts<br />
<strong>of</strong> the main irrigation conveyance network<br />
to the total amount <strong>of</strong> water delivered into<br />
the irrigation scheme. Its measurement is<br />
important in that water allocation plans are<br />
developed using estimated efficiencies <strong>of</strong><br />
water flow at various stages and time.<br />
Deterioration <strong>of</strong> efficiency over the years<br />
will reduce the performance <strong>of</strong> the irrigation<br />
scheme over this period. Gorantiwar and<br />
I.K. Smout (2005) categorized the<br />
importance <strong>of</strong> efficiency in two ways:<br />
Firstly, appropriate optimum allocation<br />
plans cannot be developed if proper<br />
consideration is not given to efficiency.<br />
Inaccurate or simplified estimates also have<br />
a major influence on other performance<br />
parameters such as productivity, adequacy,<br />
equity and reliability. Secondly, the<br />
inspection <strong>of</strong> efficiencies over space and<br />
time at different levels enables the irrigation<br />
authorities to learn which part <strong>of</strong> the scheme<br />
is inefficient, where it is inefficient and how<br />
it is deteriorating.<br />
Productivity is related to output from the<br />
system in response to the input added to the<br />
system and there are several indicators <strong>of</strong><br />
productivity. The primarily output <strong>of</strong> the<br />
scheme is the total crop yield or its<br />
economic equivalence per units <strong>of</strong> land or<br />
water used. Hence, most <strong>of</strong>ten the<br />
productivity is expressed in terms <strong>of</strong> land or<br />
water supplied to produce a certain level <strong>of</strong><br />
output. <strong>Water</strong> productivity deals with the<br />
amount <strong>of</strong> production (mass or monetary<br />
equivalent) per water supplied to the scheme<br />
during the season. Land productivity on the<br />
other hand is production per unit <strong>of</strong> land<br />
cultivated.<br />
3. Materials and Methods<br />
3.1. Description <strong>of</strong> the schemes<br />
This study uses six government owned<br />
irrigation schemes for detail investigations<br />
which are believed to have large<br />
contribution to national income and one<br />
community managed irrigation schemes.<br />
The schemes are geographically located in<br />
south, east and central parts <strong>of</strong> the country.<br />
<strong>Table</strong> 2 gives brief information on the<br />
schemes. For details on the characteristics <strong>of</strong><br />
the schemes, see Girma and Awulachew<br />
(2007).<br />
3.2. Performance indicators<br />
The performance indicators adopted in this<br />
study are:<br />
1. Irrigation water delivery<br />
performance<br />
a. Conveyance efficiency (E C )<br />
b. Annual relative water supply<br />
(ARWS)<br />
c. Annual relative irrigation supply<br />
(ARIS)<br />
d. <strong>Water</strong> delivery performance or<br />
water delivery ration (WDR)<br />
2. Output performance indicators<br />
a. Output per harvested area<br />
(tons/ha)<br />
b. Output per harvested area<br />
(US$/ha)<br />
c. Output per command area<br />
(US$/ha)<br />
d. Output per water supplied<br />
(US$/m 3 )<br />
16
These indicators were measured using the following mathematical descriptions:<br />
E C<br />
<strong>Water</strong> flowing out <strong>of</strong> the system<br />
=<br />
<strong>Water</strong> flowing into the system<br />
(1a)<br />
ARWS<br />
Total volume <strong>of</strong> water sup plied<br />
=<br />
Total volume <strong>of</strong> crop water demand<br />
(1b)<br />
Total volume <strong>of</strong> irrigation water diverted<br />
ARIS =<br />
Total volume <strong>of</strong> irrigation water demanded<br />
(1c)<br />
Volume <strong>of</strong> water actually delivered<br />
WDR =<br />
int ended volume <strong>of</strong> water tobe delivered<br />
(1d)<br />
Outpout per harvested area ( tons / ha)<br />
Pr oduction(<br />
tons)<br />
=<br />
Irrigated cropped area ( ha)<br />
(2a)<br />
Outpout per harvested area ( US$ / ha)<br />
Local value <strong>of</strong> production ( US$)<br />
=<br />
Irrigated cropped area ( ha)<br />
(2b)<br />
Outpout per command area ( US$ / ha)<br />
Local value <strong>of</strong> Pr oduction(<br />
US$)<br />
=<br />
Command area ( ha)<br />
2c)<br />
3 Local value <strong>of</strong> Pr oduction ( US$)<br />
Outpout per water sup plied ( US$ / m ) =<br />
3<br />
Diverted irrigation sup ply ( m )<br />
(2d)<br />
Data used in this study are emanating from different sources. Sugar estates have their own records<br />
regarding annual production, water diverted to the schemes and meteorological data.<br />
<strong>Table</strong> 1: Sources <strong>of</strong> important data<br />
Data<br />
Irrigation schemes<br />
Metahara Wonji Finchaa Hare Sille Bilate<br />
Metro Data Estate Estate Estate NMSA NMSA Tessema,<br />
2006<br />
Production Estate Estate Estate Belete, Aklilu, Tessema<br />
2006 2006<br />
<strong>Water</strong> supply Estate Estate Estate Belete Aklilu<br />
ARWS calculated calculated calculated Belete Aklilu Tessema<br />
ARIS calculated calculated calculated Belete Aklilu Tessema<br />
Efficiency measured measured Belete Aklilu<br />
17
<strong>Table</strong> 2: Characterization <strong>of</strong> selected irrigation schemes<br />
Scheme name Hare Sille Bilate Metahara Wonji Finchaa<br />
Latitude 6º 30´ to 6 º 38´ N 5º 49' to 5º 55' N 6 0 48’ to 6 0 50’N 8º 21' to 8º 29' N 8º 21' to 8º 29' N 9º 30' to<br />
9º 60' N<br />
Longitude 37 º 33´ to 37º 37´ E 37º 26' to 37º 29' E 38 0 4’ to 38 0 5’<br />
E<br />
39º 12' to 39º 18' E 39º 12' to<br />
39º 18' E<br />
37º 10' to<br />
37º 30' E<br />
Average annual rainfall 830.7 748 734 659.6 832 1300<br />
(mm)<br />
Average annual ET o (mm) 1651.2 1540 1958 1596.5<br />
Predominant soil types Sandy loam to clay soil Silty loam and clay<br />
loam<br />
Sandy to loam Sand to clay loam Clay, light soil black heavy<br />
clay<br />
<strong>Water</strong> source Hare River Sille River Bilate River Awash River Awash River Finchaa<br />
River<br />
<strong>Water</strong> availability Scarce in some periods Scarce in some sufficient abundant abundant abundant<br />
periods<br />
Irrigated area (ha) 1962 1082 870 11058 7279.8 8500<br />
Main crops<br />
Banana, cotton, maize, Banana, cotton, Tobacco, maize Sugar cane Sugar cane Sugar cane,<br />
fruit trees, sweet potato,<br />
vegetables<br />
maize<br />
horticultural<br />
crops<br />
Year first operational 1996 1957 1962 1966 1954 1991<br />
Type <strong>of</strong> management community government Government/ government government government<br />
private<br />
Land ownership private government Government government government government<br />
Method <strong>of</strong> water abstraction Gravity (inundation, Gravity<br />
Gravity Gravity (weir) Pump Gravity/ weir<br />
weir)<br />
(inundation) (barrage)<br />
<strong>Water</strong> delivery infrastructure Open channel Open channel Open channel/<br />
pipelines<br />
Open channel Open channel Open<br />
channel/pipe<br />
Predominant on-farm water<br />
application method<br />
Furrow, basin Furrow, basin furrow furrow Furrow Sprinkler/<br />
furrow<br />
18
4. Results and Discussions<br />
4.1. <strong>Water</strong> delivery performance<br />
<strong>Water</strong> delivery performances considered are<br />
conveyance efficiency, annual relative water<br />
supply, and annual relative irrigation supply<br />
and water delivery ratio. The results <strong>of</strong><br />
conveyance efficiency measurements given<br />
in Fig. 1 show that there is a high water loss<br />
especially in community managed Hare<br />
irrigation scheme. Through filed<br />
measurements it was evidenced that the<br />
canal losses more than 50% <strong>of</strong> water over 5<br />
km canal distance from the diversion point.<br />
As the physical conditions <strong>of</strong> canal in Hare<br />
irrigation scheme is bad, the losses are<br />
mainly attributed to seepage from the canals.<br />
Moreover, even if they are closed, points <strong>of</strong><br />
unauthorized water turnouts contribute also<br />
to low conveyance efficiency because <strong>of</strong><br />
leakages.<br />
Conveyance efficiency (%)<br />
120<br />
100<br />
80<br />
60<br />
40<br />
20<br />
0<br />
0 2000 4000 6000 8000<br />
Distance from headwork (m)<br />
Metahara<br />
Wonji<br />
Hare<br />
Fig. 1: Variation <strong>of</strong> conveyance efficiency along the canals <strong>of</strong> some schemes<br />
Conveyance efficiency underlies spatial<br />
variations based on the conditions <strong>of</strong> the<br />
canal and management system. Farm units<br />
which are located along the canal segment<br />
with low conveyance efficiency tend to<br />
suffer from unreliable and untimely supply<br />
<strong>of</strong> water.<br />
These problems have been observed in<br />
community managed irrigation schemes<br />
such as in Hare. To this effect, farmers<br />
located at tail-end <strong>of</strong> the canal (>7km) are<br />
limited in their crop diversification and<br />
forced to grow relatively water stress<br />
resistant crops such as cotton and sweet<br />
potato. Not only bad conditions <strong>of</strong> physical<br />
structures but also leakage through<br />
un<strong>of</strong>ficial points <strong>of</strong> water turnouts are<br />
observed to be reasons for rapid decline <strong>of</strong><br />
conveyance efficiency in Hare irrigation<br />
schemes<br />
Previous studies in Wonji indicated that<br />
seepage losses in the tertiary canals account<br />
to about 40% and contributed to rising <strong>of</strong><br />
groundwater level to 0.94m below the<br />
surface (Habib, 2005).<br />
The values <strong>of</strong> water delivery performance,<br />
i.e. annual relative water supply (ARWS)<br />
and annual relative irrigation supply (ARIS)<br />
are given in table 3. These indicators are<br />
evaluated as optimal if their values would be<br />
equal to one. Less or greater than one would<br />
mean under or over supply <strong>of</strong> water<br />
respectively. ARWS relates the total volume<br />
19
<strong>of</strong> water applied (irrigation plus total<br />
rainfall) to the volume <strong>of</strong> water required by<br />
the crops. It can also be used both as a<br />
measure <strong>of</strong> adequacy and seasonal timelines<br />
(Levine 1982 and Meinzen D., 1995, In:<br />
Kloezen W.H & G.-R. Carlos, 1998).<br />
The annual relative irrigation supply (ARIS)<br />
on the other hand is the ratio <strong>of</strong> the volume<br />
<strong>of</strong> irrigation water delivered to the volume<br />
<strong>of</strong> irrigation water demanded (net irrigation<br />
water requirement). It indicates also the<br />
extent to which the water supplied was<br />
adequate to satisfy the water demand. The<br />
value <strong>of</strong> this indicator is nearly unity in<br />
Wonji irrigation scheme and range from<br />
1.46 to 2.05 incase <strong>of</strong> other schemes<br />
indicating that the amount <strong>of</strong> water supplied<br />
at scheme level exceeded the estimated crop<br />
water requirement.<br />
<strong>Table</strong> 3: Values <strong>of</strong> water delivery<br />
performance indicators (2005/06)<br />
Scheme Values <strong>of</strong> water supply<br />
name performance<br />
ARWS ARIS WDR<br />
Hare 1.22 2.05 1.07<br />
Sille 1.66 1.46 0.95<br />
Bilate 1.86 2.00 1.30<br />
Metahara 1.45 1.59 1.03<br />
Wonji 1.11 0.95 0.62<br />
The water delivery ration (WDR) is an<br />
indicator that relates the amount <strong>of</strong> water<br />
delivered to the amount <strong>of</strong> water needed to<br />
be delivered, i.e. total water supplied to the<br />
scheme divided by gross irrigation water<br />
requirement. According to the values <strong>of</strong> this<br />
indicator, Wonji and Sille irrigation schemes<br />
were found to have delivered less amount <strong>of</strong><br />
water than theoretically forecasted. Wonji<br />
scheme is characterized by lower values <strong>of</strong><br />
all water supply and delivery performance<br />
indicators compared to other schemes. The<br />
cost involved in pump diversion might have<br />
contributed to efficiency <strong>of</strong> resources use in<br />
Wonji<br />
4.2. Production per unit area<br />
Values <strong>of</strong> crop production per units <strong>of</strong><br />
harvested land in the studied irrigation<br />
schemes are presented in <strong>Table</strong> 4 and figures<br />
2-4. As can be seen from table 4, production<br />
varies from 122 to 174 tons per hectare in<br />
sugar cane producing irrigation schemes and<br />
from 0.50 to 3.56 tons per hectare in cotton<br />
producing schemes. The productivity <strong>of</strong><br />
tobacco varied between 0.45 to 1.55 tons per<br />
hectare. The average sugar cane production<br />
in Metahara, Wonji and Finchaa is<br />
respectively 162.3, 147.1 and 136.5 tons per<br />
hectare. This shows that Metahara has<br />
produced more cane per units <strong>of</strong> area.<br />
With a standard deviation <strong>of</strong> 13.7, the<br />
productivity variation is higher in Finchaa<br />
followed by Metahara and Wonji sugar<br />
estates. Huge differences between minimum<br />
and maximum productions in table 4 show<br />
inconsistencies that exist in the management<br />
practices as well as practically attainable<br />
level <strong>of</strong> productivity under the existed<br />
condition. Compared to sugar cane<br />
producing schemes, large coefficients <strong>of</strong><br />
variation (Cv) in cases <strong>of</strong> cotton and tobacco<br />
producing schemes have been observed<br />
indicating high productivity variation from<br />
year to year. The reasons could be<br />
inconsistencies in the agricultural practices,<br />
management system and input supplies.<br />
20
<strong>Table</strong> 4: Output per units <strong>of</strong> harvested land (from 1998/99 – 2005/06 except for<br />
Hare scheme)<br />
Scheme Crop grown productivity (tons/ha)<br />
Cv<br />
name<br />
minimum maximum mean SD (%)<br />
Metahara Sugar cane 152.6 173.8 162.3 9.3 5.6<br />
Wonji Sugar cane 137.2 152.8 148.1 5.6 3.4<br />
Finchaa Sugar cane 123.5 169.0 138.3 13.4 9.7<br />
Average (sugar cane) 137.2 165.2 148.6 9.52 6.5<br />
Hare 1 Cotton 0.70 2.20 1.30 0.65 50<br />
Sille Cotton 0.50 2.40 1.09 0.79 72<br />
M. Sedi Cotton 1.57 3.56 2.51 0.67 26.7<br />
Average (cotton) 0.92 2.72 1.67 0.65 43<br />
Bilate Tobacco 0.47 1.55 0.90 0.33 36.9<br />
1. Compared between different villages in the scheme<br />
The productivity <strong>of</strong> cotton presented in this<br />
study, when compared to the optimum yield,<br />
i.e. 5.4 tons/ha (Aklilu, 2006), it is evident<br />
that there is a room for improvement. Melka<br />
Sedi was found to perform better than other<br />
cotton producing farms.<br />
To compare the outputs <strong>of</strong> schemes and<br />
productivity <strong>of</strong> different crops per units <strong>of</strong><br />
land and water supplied, monetary<br />
equivalents <strong>of</strong> the production during the<br />
season 2005/06 have been considered. This<br />
type <strong>of</strong> calculation was made taking into<br />
account the farm gate unit price <strong>of</strong> sugar,<br />
cotton and tobacco in the year 2005/06 as<br />
491.2, 1069.77 and 1962.79 US$ per tons<br />
respectively. The results presented in figures<br />
2 and 6 show that outputs per units <strong>of</strong> land<br />
and water are by far large in sugar producing<br />
schemes than cotton and tobacco farming<br />
schemes.<br />
12000<br />
10000<br />
Output per harvested area<br />
Output per cropped area<br />
9379<br />
10834<br />
Output (US$/ha)<br />
8000<br />
6000<br />
4000<br />
7794<br />
5697<br />
6104<br />
5314<br />
2000<br />
0<br />
310 385<br />
172<br />
2077<br />
1500<br />
376<br />
464<br />
Sille Hare M.Sedi Bilate Finchaa Metahara Wonji<br />
Scheme name<br />
Fig. 2: Output per units <strong>of</strong> harvested and irrigable area (2005/06)<br />
The difference between schemes in terms <strong>of</strong><br />
output per irrigable area is less compared to<br />
output per harvested area. In the year<br />
2005/06, the proportions <strong>of</strong> harvested to<br />
total cultivated area in Wonji, Metahara and<br />
Finchaa are 49, 65 and 73% respectively.<br />
21
Even if the cane production per harvested<br />
area in 2005/06 was higher in Metahara<br />
(Fig. 4) than other cane producing schemes<br />
output per units <strong>of</strong> harvested land (US$/ha)<br />
was higher in case <strong>of</strong> Wonji than Metahara<br />
(Fig. 2). This is because the end sugar<br />
productivity was higher in Wonji than<br />
others, i.e. 21.92, 15.98 and 15.77 tons <strong>of</strong><br />
sugar per hectare <strong>of</strong> harvested area<br />
respectively in Wonji, Metahara and<br />
Finchaa. Sugar produced per hectare per<br />
month was also greater in Wonji followed<br />
by Metahara and Finchaa which may be<br />
attributed to the differences in the cutting<br />
ages <strong>of</strong> the cane.<br />
Fig. 3 shows the relationships between the<br />
size <strong>of</strong> area harvested and the corresponding<br />
cane production during the last 8 years<br />
(1998/99 – 2005/06).<br />
1400<br />
Cane ( * 10 3 tons)<br />
1200<br />
1000<br />
800<br />
600<br />
400<br />
Wonji<br />
Metahara<br />
Finchaa<br />
200<br />
0<br />
0 1000 2000 3000 4000 5000 6000 7000 8000<br />
Area harvested (ha)<br />
Fig. 3: Comparison <strong>of</strong> harvested area and cane production (1998/99 – 2005/06)<br />
Annually harvested area and hence total<br />
cane production is greater in Metahara sugar<br />
estate followed by Finchaa and lowest in<br />
Wonji. The regression coefficients (r 2 ) <strong>of</strong> the<br />
relations given in figure 3 are 0.36, 0.004<br />
and 0.88 for Wonji, Metahara and Finchaa<br />
respectively. This shows that both harvested<br />
area and cane production was not<br />
significantly increased in Metahara and<br />
Wonji. In case <strong>of</strong> these schemes, the points<br />
showing the relationships between areas<br />
harvested and cane production are<br />
concentrated at almost same area. Within the<br />
period 1998/99 – 2005/06 the total cropped<br />
area has increase from 9911.5 ha to<br />
10145.9ha in Metahara. This is an increment<br />
<strong>of</strong> about 2.4%. However, the size <strong>of</strong><br />
harvested area was variable from year to<br />
year without showing linear increase.<br />
Figure 4 and 5 show the deviation <strong>of</strong> annual<br />
production <strong>of</strong> sugar cane and cotton from<br />
the overall average production <strong>of</strong> the<br />
schemes involved in producing the same<br />
crop during the last 9 years. While the<br />
productivity <strong>of</strong> Wonji is consistently close to<br />
the average line, the productivity <strong>of</strong><br />
Metahara scheme is greater than the average<br />
22
and that <strong>of</strong> Finchaa scheme is lower than the<br />
mean productivity <strong>of</strong> the schemes.<br />
From the two cotton producing schemes,<br />
Melka Sedi was found to consistently<br />
produce more than average production. On<br />
the contrary the productivity <strong>of</strong> Sille scheme<br />
is below average in all 9 years considered<br />
except in one year, i.e. 2001/02 (Fig. 5).<br />
Although both belongs to the state farms,<br />
government managed, the management<br />
setup and conditions <strong>of</strong> physical structures<br />
under which they are operating is different.<br />
The more than 40 years old irrigation<br />
infrastructure in Sille farm and less<br />
motivated and unskilled staff as well as low<br />
input services are contributed to low<br />
productivity <strong>of</strong> the farms.<br />
30<br />
Deviation from mean (tons/ha)<br />
20<br />
10<br />
0<br />
-10<br />
-20<br />
Metahara<br />
Wonji<br />
Finchaa<br />
-30<br />
1997/98 1998/99 1999/00 2000/01 2001/02 2002/03 2003/04 2004/05 2005/06<br />
Year<br />
Fig. 4: Deviation <strong>of</strong> annual sugar cane production from mean, i.e. 149 tons/ha<br />
2.0<br />
Deviation from mean (tons/ha)<br />
1.5<br />
1.0<br />
0.5<br />
0.0<br />
-0.5<br />
-1.0<br />
-1.5<br />
Sille<br />
Melka Sedi<br />
-2.0<br />
1996/97 1997/98 1998/99 1999/00 2000/01 2001/02 2002/03 2003/04 2004/05 2005/06<br />
Year<br />
Fig. 5: Deviation <strong>of</strong> annual cotton production from mean, i.e. 1.97 tons/ha<br />
23
Although adequate or more water than<br />
required is supplied to the scheme, the<br />
output obtained in Sille and Hare schemes<br />
are very low. It may not be the total amount<br />
<strong>of</strong> water diverted to the scheme which is so<br />
important to evaluate the influence <strong>of</strong><br />
irrigation water on production rather<br />
adequacy and uniformity <strong>of</strong> its distribution<br />
on the cropped field.<br />
4.3. Output per units <strong>of</strong> water supply<br />
<strong>Water</strong> productivity has been defined as the<br />
amount <strong>of</strong> output produced per unit <strong>of</strong> water<br />
involved in the production, or the value<br />
added to water in a given circumstance<br />
(Molden et al. 1998). It was calculated by<br />
dividing the value <strong>of</strong> agricultural production<br />
obtained from a unit area <strong>of</strong> land by volume<br />
<strong>of</strong> irrigation water supplied during the<br />
production season. Fig. 6 shows the<br />
productivity <strong>of</strong> water for different irrigation<br />
schemes.<br />
Productivity (US$/m 3 )<br />
0.7<br />
0.6<br />
0.55<br />
0.5<br />
0.48<br />
0.4<br />
0.3<br />
0.29<br />
0.24<br />
0.2<br />
0.1<br />
0.01<br />
0.05<br />
0<br />
Sille Hare M. Sedi Metahara Finchaa Wonji<br />
Scheme name<br />
Fig. 6: Output per unit water supplied<br />
Output (US$) per units <strong>of</strong> water supply (m 3 )<br />
varies between 0.01 in Sille, 0.05 in<br />
community managed scheme and 0.55 US$<br />
in government managed irrigated sugar cane<br />
farm. <strong>Water</strong> productivity in other areas was<br />
found to be 0.04 – 0.56 US$ (Merdun,<br />
2004), 0.03 – 0.91 US$ (Molden et al.<br />
1998). Differences have also observed not<br />
only between different schemes, cropping<br />
and management types but also between the<br />
same cropping and management type in<br />
different schemes. The results indicate that<br />
Wonji irrigation scheme was found to be<br />
efficient in economical use <strong>of</strong> irrigation<br />
water followed by Finchaa and Metahara. In<br />
terms <strong>of</strong> cane productivity Metahara was<br />
found to produce more. However, sugar<br />
gained is more in case <strong>of</strong> Wonji. This may<br />
be due to the differences in the cutting ages<br />
adopted by the schemes. Results given in<br />
Fig. 6 are also influenced by the value <strong>of</strong><br />
crops grown, irrigation management and<br />
weather conditions such as contribution <strong>of</strong><br />
rainfall. Proper irrigation scheduling that<br />
takes into account the contribution <strong>of</strong><br />
rainfall during growing season will have<br />
improving effect on water productivity. The<br />
difference in the water productivity between<br />
sugar cane producing scheme is attributed to<br />
the management practices. Despite adequate<br />
water deliveries at the scheme level (<strong>Table</strong><br />
3) in Sille and Hare irrigation schemes, both<br />
land and water productivity is low compared<br />
to Melka Sedi scheme, producing the same<br />
24
crop, i.e. cotton. It is not the total amount <strong>of</strong><br />
water diverted to the scheme which so<br />
important to influence the production, rather<br />
its adequacy, uniformity and proper<br />
spreading over the cropped field.<br />
5. Summary and Conclusion<br />
The assessment <strong>of</strong> irrigation performance in<br />
seven irrigation schemes using output and<br />
water supply performance showed that there<br />
is a tremendous difference between the<br />
schemes in their output performance. This is<br />
true even for the same cropping and<br />
management types. Government agency<br />
managed schemes that grow sugar cane have<br />
got higher productivity that ranges 123.5 -<br />
173.8 tons/ha, 7794 – 10834 US$ per<br />
harvested area and 0.24 – 0.55 US$/m 3 . On<br />
the other hand schemes that grow cotton<br />
have relatively low productivity that ranges<br />
from 310 US$/ha in community managed<br />
scheme to 385 US$/ha in state farm. The<br />
water productivity <strong>of</strong> these schemes is<br />
respectively 0.05 and 0.01 US$/m 3 . It is<br />
evident that as the management setup,<br />
staffing, capacity, and availabilities <strong>of</strong><br />
resources are different, not all schemes<br />
under similar management and cropping<br />
types have similar performance. Then, there<br />
is a huge difference in the attainment <strong>of</strong> the<br />
primary objective <strong>of</strong> irrigation, i.e.,<br />
increased outputs.<br />
The scheme level values <strong>of</strong> water supply<br />
performance indicators (ARWS and ARIS)<br />
revealed that there were no water supply<br />
constraints during the season. That means<br />
the water supplied during the season<br />
(2005/06) could meet the forecasted crop<br />
and irrigation water demand in all schemes<br />
considered. However, it should be noted that<br />
the scheme level values does not give any<br />
clue how efficiently, adequately, uniformly,<br />
timely and reliably the water was distributed<br />
within the farms. It is evident that measuring<br />
these indicators requires intensive field data<br />
which need to be generated from field level<br />
measurements.<br />
Government agency managed schemes that<br />
grow sugar cane have got higher<br />
productivity that ranges from 123.5 - 173.8<br />
tons per hectare <strong>of</strong> harvested area, 7794 –<br />
10834 US$ per harvested area (2005/06) and<br />
0.24 – 0.55 US$/m 3 <strong>of</strong> water supplied<br />
(2005/06). On the other hand schemes that<br />
grow cotton have relatively low productivity<br />
and high variations that ranges from 310 –<br />
2077 US$/ha in community managed and<br />
state farm. Output per units <strong>of</strong> water<br />
supplied varied from 0.01 – 0.29 US$/m 3 <strong>of</strong><br />
water supplied to the scheme.<br />
Cotton growing schemes are characterized<br />
by high productivity variations between<br />
seasons. This could be due to<br />
inconsistencies in the management systems,<br />
input services and inability to minimize the<br />
influences <strong>of</strong> climate conditions through<br />
adoption <strong>of</strong> effective irrigation scheduling.<br />
Huge variations between outputs <strong>of</strong> same<br />
crop type in different schemes reveal that<br />
there is a room for improvement in the<br />
productivity <strong>of</strong> land and water. However,<br />
answer to the question, ‘which one is doing<br />
what better and why?’ need the examination<br />
<strong>of</strong> internal process indicators.<br />
Low productivity <strong>of</strong> irrigated agriculture in<br />
schemes such as Hare and Sille is possibly<br />
attributed to poor conditions <strong>of</strong> the irrigation<br />
infrastructure, inadequate management<br />
capacity and skills, lack <strong>of</strong> proper operation<br />
and on-farm water management practices<br />
and procedures, lack <strong>of</strong> incentives and hence<br />
low motivation to improve performance.<br />
Investment on improvements <strong>of</strong> physical<br />
structures, management and operation <strong>of</strong> the<br />
system at all levels will bring substantial<br />
improvement <strong>of</strong> performances <strong>of</strong> these<br />
schemes.<br />
Scheme level values <strong>of</strong> water delivery and<br />
supply performance indicators presented in<br />
this paper are based on data sets <strong>of</strong> one year.<br />
It doesn’t show also how adequately,<br />
uniformly, efficiently and timely the water<br />
distributed over the field and field units<br />
throughout the season. Hence the scheme<br />
level performance indicators are <strong>of</strong> use for<br />
strategic thinking and don’t serve as such<br />
operational purpose, because they don’t<br />
indicate exactly where the problems<br />
25
esponsible for low performance <strong>of</strong> the<br />
system lie. The next study should focus on<br />
assessment <strong>of</strong> performance based on internal<br />
processes indicators such as adequacy,<br />
uniformity, reliability, efficiency and<br />
sustainability.<br />
References<br />
Aklilu Adagn. 2006. Assessment <strong>of</strong><br />
irrigation system at Sille state farm.<br />
MSc-thesis. Arba Minch University,<br />
Ethiopia<br />
Belete Bantero. 2006. Across-system<br />
comparative assessment <strong>of</strong> mediumscale<br />
irrigation system performance.<br />
MSc-thesis. Arba Minch University,<br />
Ethiopia.<br />
Bos, M.G., M.A. Burton and D.J. Molden<br />
(2005): Irrigation and Drainage<br />
Performance Assessment. Practical<br />
Guidelines. CABI Publishing, CAB<br />
<strong>International</strong>, Wallingford, UK<br />
Clemmens, A.J., D.J. Molden. 2007. <strong>Water</strong><br />
uses and productivity <strong>of</strong> irrigation<br />
system. Irrigation systems. 25, 247-261<br />
Gorantiwar, S.D., and I.K. Smout. 2005.<br />
Performance assessment <strong>of</strong><br />
irrigationwater management <strong>of</strong><br />
heterogeneous irrigation schemes: 1. A<br />
framework for evaluation. Irrigation and<br />
Drainage Systems. 19: 1-36.<br />
Habib D. 2005. Study on hydraulic<br />
performance <strong>of</strong> some irrigation canals at<br />
Wonji sugar state. Proceedings <strong>of</strong> 9th<br />
sysmposium on sustainable water<br />
resources development. Arba Minch<br />
University. 52-57.<br />
Kloezen, W.H. and C. Garce’s-Restrepo.<br />
1998. Assessing irrigation performance<br />
with comparative indicators: The case <strong>of</strong><br />
the Alto Rio Lerma irrigation District,<br />
Mexico. IWMI Research Report No 22.<br />
Colombo Sri Lanka.<br />
Mohtadullah K. (1993): performance <strong>of</strong><br />
irrigation systems. 15 th - congress on<br />
irrigation and drainage. ICID . CIID, 74<br />
– 83.<br />
Molden, D., R. Sakthivadivel, C.J. Perry, C.<br />
de Fraiture and WimH. Kloezen (1998):<br />
Indicators for comparing performance <strong>of</strong><br />
irrigated agricultural systems. IWMI<br />
Research Report No 20, Colombo, Sri<br />
Lanka<br />
Small, L., M. Svenddsen. 1990: A<br />
framework for assessing irrigation.<br />
Irrigation and Drainage system. 4, 283-<br />
312.<br />
Tessema B. 2006. Assessment <strong>of</strong> hydraulic<br />
performances and irrigation potential <strong>of</strong><br />
Bilate tobacco development irrigation<br />
scheme. MSc. Thesis. Arba Minch<br />
University, Ethiopia.<br />
Vandersypen, K., Bengaly, K., Keita, A.,<br />
Sidibe, S., Raes D., Jamin, J.-Y. 2006.<br />
Irrigation performance at tertiary level<br />
in the rice schemes <strong>of</strong> the Office du<br />
Niger (Mali): Adequate water delivery<br />
through over-supply. Agricultural water<br />
management, 83, 144-152.<br />
Yercan, M., M. Dorsan, M.A. Ul. 2004.<br />
Comparative analysis <strong>of</strong> performance<br />
criteria in irrigation schemes: a case<br />
study <strong>of</strong> Gediz river basin in Turkey.<br />
Agricultural <strong>Water</strong> management. 66,<br />
259 – 266.<br />
26
Irrigation and Rain-fed Crop Production System in Ethiopia<br />
Tilahun Hord<strong>of</strong>a 1 , Michael Menkir 2, Sileshi Bekele 2 , Teklu Erkossa 1<br />
1<br />
Ethiopian <strong>Institute</strong> <strong>of</strong> Agricultural Research, Addis Ababa, Ethiopia<br />
2<br />
<strong>International</strong> <strong>Water</strong> <strong>Management</strong> <strong>Institute</strong> (IWMI) Subregional Office for the Nile Basin and<br />
East Africa, Addis Ababa, Ethiopia<br />
tilahun_hord<strong>of</strong>a@yahoo.com<br />
Abstract<br />
Crop production is a function <strong>of</strong> water,<br />
nutrient, climate and soil environment.<br />
Provided that all other requirement are<br />
satisfactorily for proper growth and<br />
production, rainfall rarely meets the time<br />
with required amount <strong>of</strong> water application<br />
for plant growth. As a result average yield<br />
<strong>of</strong> agricultural crops under rain-fed<br />
agriculture is low compared to irrigated<br />
agriculture. This study assesses irrigation<br />
and rain-fed agriculture system in<br />
connection to its potential productivity<br />
under existing practice. While the rain-fed<br />
areas considered in this study are the<br />
aggregate at the national level, five<br />
systematically selected Medium and large<br />
scale irrigation schemes were selected based<br />
on cropping patter, geographic and agro<br />
ecological representation These are<br />
Fincha’a, MAAE, Metehara, Sille, and<br />
UAAIE which are located at three river<br />
basins, viz, Nile (Abbay), Awash and the<br />
Rift valley basins. Data were collected using<br />
pre-formulated checklists, through series <strong>of</strong><br />
interviews and discussions; and from<br />
published and unpublished documents. The<br />
result indicated that crop production was<br />
undulating under rain-fed agriculture and as<br />
a result the performance <strong>of</strong> rain-fed<br />
productivity remained low and stable for<br />
most crops. Although crops grown by smallholder<br />
private farmers are different, cereals<br />
occupy about 74 per cent followed by pulses<br />
and oil seeds with small proportion. During<br />
the last one decade, the maximum and<br />
minimum cultivated land by small-holder<br />
peasant farmers at the national level was<br />
10.7 and 6.6 M ha, respectively. Increased<br />
cultivable area by private small-holder<br />
farmers could not seem to contribute to the<br />
increased production. Total irrigated land by<br />
private peasant farmers ranged between 66<br />
and 147 thousand hectares for the last one<br />
decade. During the last decade the area<br />
under irrigation was steadily increasing for<br />
most <strong>of</strong> the large scale schemes. Particularly<br />
Fincha’a and Metehara farms are<br />
significantly increasing while MAAE farm<br />
has shown only a slight increase. At UAAIE<br />
farm, crop production shows a decreasing<br />
trend. Productivity <strong>of</strong> banana at Sille farm<br />
was decreasing despite its increasing in land<br />
area.<br />
Key words: Irrigation, Rain-fed, crop<br />
production, productivity, large scale scheme,<br />
private small-holder<br />
1. Introduction<br />
Crop production is a function <strong>of</strong> water,<br />
nutrient, climate and soil environment.<br />
Complex relationship existed between these<br />
factors and the crop as a consequence <strong>of</strong> the<br />
involvement <strong>of</strong> biological, physiological,<br />
physical and chemical processes. However,<br />
efficient crop production and optimum yield<br />
can be achieved only when the water supply<br />
is precisely in fine tune with the biological<br />
needs provided that the crop is well supplied<br />
with the required nutrients and well adapted<br />
to the prevailing environment. On the other<br />
27
hand, there is no crop without water, what so<br />
ever needs are in place. Therefore, timely<br />
supplied with an adequate amount <strong>of</strong><br />
precipitation and/or irrigation could play a<br />
major role in increasing agricultural crop<br />
production.<br />
Rainfall rarely meets the time with required<br />
amount <strong>of</strong> application for plant growth. As a<br />
result average yield <strong>of</strong> agricultural crops<br />
under rain-fed agriculture is low compared<br />
to irrigation, which is the application <strong>of</strong><br />
controlled amount <strong>of</strong> water at specified time<br />
<strong>of</strong> application. In Ethiopia, traditional rainfed<br />
agriculture is the dominant form <strong>of</strong><br />
farming in which the peasant farm<br />
households contribute the largest proportion<br />
<strong>of</strong> the total agricultural production. Out <strong>of</strong><br />
the total land area <strong>of</strong> 112.3 M ha, about 16.4<br />
M ha are suitable for the production <strong>of</strong><br />
annual and perennial crops. Of the estimated<br />
arable land, presently about 10 M ha is used<br />
annually for rain-fed crops (CSA, 2006).<br />
The pattern and intensity <strong>of</strong> rainfall in the<br />
country is quite variable in which most <strong>of</strong><br />
the highlands receive between 510 to<br />
1530mm <strong>of</strong> rain annually and in typical arid<br />
and semi-arid areas generally receive less<br />
than 500mm to about 750mm rain,<br />
respectively. However, rainfall in most cases<br />
is unreliable and erratic and moreover,<br />
productivity is constrained by several<br />
interlinked factors such as unpredictable<br />
climate (flood, frost, pest etc.) small and<br />
fragmented land holding, land degradation,<br />
limited technological inputs, etc. About 80<br />
percent <strong>of</strong> the population lives in the<br />
highlands. Over population in these area<br />
caused shortage <strong>of</strong> land and thereby pushing<br />
the farmers onto lands with fragile soils and<br />
steep slopes in which the land becomes<br />
exposed to erosion and eventually turns out<br />
to unproductive state. On the other hand<br />
there is a huge tract <strong>of</strong> arable land in the low<br />
lands which could be utilized for agricultural<br />
production. However, rainfall is either not<br />
sufficient or not dependable in amounts and<br />
timing. As a result, crops suffer from severe<br />
soil moisture stress and drought.<br />
The dependence on rain has significantly<br />
affected the life <strong>of</strong> the people in particular<br />
and economic development <strong>of</strong> the country in<br />
general. Improving this sector contributes to<br />
improve the productivity <strong>of</strong> agriculture and<br />
thus the generation <strong>of</strong> higher incomes,<br />
promotion food self-sufficiency and<br />
improving health condition <strong>of</strong> the people. It<br />
also increases and diversifies production <strong>of</strong><br />
raw materials for industries and promotion<br />
<strong>of</strong> export item.<br />
Irrigation is one means for a good farm<br />
husbandry, better land utilization and stable<br />
and higher crop production. Sustained<br />
growth and dynamism in agriculture is a<br />
fundamental necessity to meet the increasing<br />
demand for food and other products in view<br />
<strong>of</strong> the growing population. Irrigated<br />
agriculture will play a major role in reaching<br />
the broader development vision <strong>of</strong> the<br />
country in achieving food security, poverty<br />
alleviation and improvement in the quality<br />
<strong>of</strong> life. The main objective <strong>of</strong> irrigated<br />
agriculture is to provide plants with<br />
sufficient water to prevent stress that may<br />
cause reduced yields or poor quality <strong>of</strong><br />
harvest (Haise and Hagan, 1987; Tayler,<br />
1965).<br />
Ethiopia is one <strong>of</strong> the few African countries<br />
endowed with relatively abundant water<br />
resources, favorable climate and potentially<br />
huge irrigable land. The annual stream flow<br />
and groundwater resources are estimated<br />
around 122 and 2.6 billion m³, respectively.<br />
About 83 percent <strong>of</strong> the total run<strong>of</strong>f is found<br />
in the basins <strong>of</strong> large rivers such as the<br />
Abbay (Blue Nile), the Baro Akobo, the<br />
Omo Gibe and the Tekez (MoWR, 2002).<br />
While the potential benefits <strong>of</strong> irrigation are<br />
great, the actual achievement in many<br />
irrigated areas <strong>of</strong> the country is substantially<br />
less than the potential. According to MoWR<br />
(2005), Ethiopia is estimated to have 3.7 M<br />
ha <strong>of</strong> potentially irrigable area with the<br />
available surface water resources and the<br />
land irrigated through the development <strong>of</strong><br />
traditional and modern irrigation schemes<br />
are estimated to be about 386,603 hectares,<br />
28
which is about 10 per cent <strong>of</strong> potentially<br />
irrigable land. According to the report, in the<br />
modern irrigation there were 466 small, 102<br />
medium and 9 large irrigation schemes with<br />
the total area coverage <strong>of</strong> 28,939, 71,924<br />
and 49,675 ha, respectively have been<br />
developed by Government,<br />
nongovernmental organizations and private<br />
investors. However, the major crops<br />
produced with irrigation are industrial and<br />
cash crops with small proportion <strong>of</strong> food<br />
crops. The major part <strong>of</strong> food crops<br />
produced in the country come from rain-fed<br />
agriculture.<br />
This gross underdevelopment has spurred<br />
the Irrigation Development Program (IDP)<br />
to put additional hectares <strong>of</strong> land under<br />
irrigation within its 15-year plan period <strong>of</strong><br />
2002-2016 (MoFED, 2006 ). Therefore, a<br />
strategy that ensures economically<br />
pr<strong>of</strong>itable, ecologically sustainable and<br />
socially acceptable use <strong>of</strong> the available<br />
resources (land, water, climate, labor,<br />
finance) is <strong>of</strong> paramount importance. This<br />
presumes that the limited resources are<br />
efficiently used so that the benefits per unit<br />
out puts are optimized. Therefore, this study<br />
was aimed to assess irrigation and rain-fed<br />
agriculture system in connection to its<br />
potential productivity under existing<br />
practice.<br />
2. Study Area<br />
The study area encompasses rain-fed areas<br />
in the country in general and five<br />
systematically selected Medium and large<br />
scale irrigation schemes based on cropping<br />
patter, geographic and agro ecological<br />
representation These are Fincha’a, MAAE,<br />
Metehara, Sille, and UAAIE which are<br />
located at three river basins, viz, Nile<br />
(Abbay), Awash and the Rift valley basins.<br />
The main features <strong>of</strong> the study sites are<br />
presented in <strong>Table</strong> 1.<br />
<strong>Table</strong> 1 Main features <strong>of</strong> selected irrigation schemes<br />
Irrigation Schemes<br />
Features Fincha MAAI MSF UAAIE Sille SF<br />
River basin Abbay Awash Awash Awash Rift valley<br />
Latitude 9 o 18’N 9 o 46’N 8 o 52’N 8 o 37’N 6 o 1’N<br />
Longitude 37 o 14’E 40 o 38’E 39 o 54’E 39 o 43’E 37 o 37’E<br />
Altitude (m) 1450 750 950 1100-1200 1280<br />
Tmax ( 0 C) 24 34 33.1 32.6 32<br />
Tmin ( 0 C) 7.4 18 17.2 15.3 17<br />
Rainfall (mm) 1300 500 550 500 729.6<br />
Crops Sugarcane Cotton Sugar (fruits) vegetables<br />
and fruits<br />
cotton,<br />
maize and<br />
banana<br />
Source <strong>of</strong> water Fincha’a River Awash River Awash River Awash River Sille River<br />
Method <strong>of</strong> Sprinkler Surface Surface<br />
Surface<br />
irrigation<br />
(furrow) (furrow)<br />
(furrow)<br />
Surface<br />
(furrow and<br />
basin)<br />
29
3. Methodology<br />
In this study status <strong>of</strong> rain-fed and irrigated<br />
agriculture in terms <strong>of</strong> area, production and<br />
productivity will be assessed at national and<br />
River basin level. Primary data (crop<br />
production and productivity, irrigated and<br />
rain-fed area etc) were collected using preformulated<br />
checklists for time span <strong>of</strong> at<br />
least ten years. Series <strong>of</strong> interviews and<br />
discussions were held with different<br />
stakeholders including; representatives <strong>of</strong><br />
water user associations and beneficiaries,<br />
subject matter specialists from zonal and<br />
district BoARD (agronomists, irrigation and<br />
natural resource experts, extension<br />
personnel etc) for the small scale irrigation<br />
schemes and the corresponding rain-fed<br />
agriculture system. Similarly interviews and<br />
discussions were also held with enterprise,<br />
farm and unit managers <strong>of</strong> the selected large<br />
scale irrigation schemes. In addition,<br />
published and unpublished documents<br />
(series <strong>of</strong> agricultural sample survey reports<br />
(CSA) were reviewed and analyzed.<br />
4. Results and Discussion<br />
Rain-fed Farming System<br />
Ethiopian farming is mainly dependant on<br />
rain-fed smallholder agriculture system as a<br />
means <strong>of</strong> food and income for its population.<br />
Virtually all food crops come from rain-fed<br />
agriculture system. The farming societies are<br />
principally private peasant. Crops grown<br />
under rain-fed farming system were diverse<br />
and many within a cropping season.<br />
However, the agriculture system is<br />
dominated by cereal based productions since<br />
it was produced in large quantity as<br />
compared to other crops (Fig. 1). Pulses and<br />
oil seeds occupy small proportion in contrast<br />
to cereals. The major cereal crops gown<br />
were maize, sorghum, tef, wheat and barley.<br />
Oil seeds<br />
7%<br />
Fruits<br />
0.4%<br />
Root crops<br />
2%<br />
Vegetables<br />
1%<br />
Chat<br />
1%<br />
Hops<br />
0.2%<br />
Sugar cane<br />
0.2%<br />
C<strong>of</strong>fee<br />
2.6%<br />
Pulses<br />
12%<br />
5<br />
074%<br />
Fig. 1 Area coverage <strong>of</strong> rain-fed crops<br />
30
Cereal production and productivity under<br />
rain-fed agriculture is shown in figure 2. The<br />
crop production was undulating reaching<br />
low during 1995/96 and 2005/06; and pick<br />
during 2001/02. As shown in Fig. 3, area<br />
under rain-fed agriculture was highest<br />
during 2005/06 cropping season and where<br />
as production is low as compared to 200/01<br />
cropping season.<br />
During the last one decade, the maximum<br />
and minimum cultivated land by smallholder<br />
peasant farmers at the national level<br />
was 10.7 and 6.6 M ha, respectively (fig. 3).<br />
Agricultural production could be increased<br />
through increasing cultivable area or using<br />
improved seed and cultural practices<br />
(fertilizer, irrigation etc). The increased<br />
cultivable area during 2005/06 by private<br />
small-holder farmers could not seem to<br />
contribute to the increased production. The<br />
production rather seems to fall as the area<br />
increased. There can be several reasons for<br />
low production. Simple reason for increased<br />
crop production during 2001/02 could be<br />
due to an increase in cultivable area along<br />
with the favorable conditions including<br />
adequate rainfall that might have occurred<br />
during the cropping season. Moreover,<br />
visual observation elucidated that the<br />
occurrence <strong>of</strong> sufficient rainfall (adequacy<br />
and reliability) through-out the growing<br />
season enables the private peasant farmers to<br />
get bumper harvest, indicating rain-fed<br />
agriculture to depend strongly on rainfall<br />
availability. In absence <strong>of</strong> sufficient rainfall,<br />
there is always low agricultural production<br />
thereby creating food shortage and food<br />
insecurity for its population and also dipping<br />
poverty. Consequently, the performance <strong>of</strong><br />
rain-fed agricultural production and<br />
productivity remained low and stable for<br />
most <strong>of</strong> the years. The low level <strong>of</strong><br />
performance <strong>of</strong> rain-fed agriculture could<br />
not only be attributed to erratic nature <strong>of</strong><br />
rainfall but also deteriorating soil fertility<br />
and slow adoption and/or lack <strong>of</strong> appropriate<br />
technologies.<br />
3500.00<br />
35.00<br />
Production<br />
3000.00<br />
2500.00<br />
2000.00<br />
1500.00<br />
1000.00<br />
500.00<br />
0.00<br />
-500.00<br />
Barley<br />
maize<br />
sorghum<br />
Tef<br />
wheat<br />
Barley<br />
maize<br />
sorghum<br />
Tef<br />
wheat<br />
Barley<br />
maize<br />
sorghum<br />
Tef<br />
wheat<br />
Barley<br />
maize<br />
sorghum<br />
Tef<br />
wheat<br />
Barley<br />
maize<br />
sorghum<br />
Tef<br />
wheat<br />
Barley<br />
maize<br />
sorghum<br />
Tef<br />
wheat<br />
Barley<br />
maize<br />
sorghum<br />
Tef<br />
wheat<br />
Barley<br />
maize<br />
sorghum<br />
Tef<br />
wheat<br />
Barley<br />
maize<br />
sorghum<br />
Tef<br />
wheat<br />
Barley<br />
maize<br />
sorghum<br />
Tef<br />
wheat<br />
30.00<br />
25.00<br />
20.00<br />
15.00<br />
10.00<br />
5.00<br />
0.00<br />
Productivity<br />
1995/96 1996/97 1997/98 1998/99 1999/00 2000/01 2001/02 2003/04 2004/05 2005/06<br />
Year<br />
Production, '000 ton<br />
Productivity, q/ha<br />
Fig. 2 Production and productivity <strong>of</strong> rain-fed agriculture<br />
The above statements generally point out<br />
that those small-holder private farmers<br />
survived with uncertainty <strong>of</strong> rainfall and low<br />
level <strong>of</strong> technology aggravating the<br />
31
occurrence <strong>of</strong> poverty and food insecurity.<br />
With the existing rate <strong>of</strong> production and<br />
productivity, it is going to be a challenge<br />
and threat to the country to feed the ever<br />
rapidly growing population. Therefore, due<br />
attention should be given to improve the<br />
production system to alleviate poverty and<br />
secure food self-sufficiency.<br />
Irrigation Farming System<br />
Irrigation enables farmers to improve crop<br />
production and intensification thereby<br />
sustaining and improving livelihoods and<br />
food security. In Ethiopia, private peasant<br />
farmers use irrigation at small scale level to<br />
enable them increase crop production and as<br />
a means <strong>of</strong> raising income. Small scale<br />
irrigation not only increase crop production,<br />
but also improves cropping intensity and<br />
reduces the effect <strong>of</strong> erratic rainfall. The<br />
practice <strong>of</strong> irrigation may not be possible for<br />
every farmer and could not be possible to<br />
expand the area. As shown in figure 3,<br />
during the last one decade, the total irrigated<br />
land by private peasant farmers ranged<br />
between 63 and 175 thousand hectares<br />
which is 0.8 to 1.8 per cent <strong>of</strong> the total area<br />
covered under rain-fed agriculture,<br />
respectively.<br />
12000000<br />
Rainfed<br />
Irrigated<br />
Area (ha)<br />
10000000<br />
8000000<br />
6000000<br />
7948530<br />
8072360<br />
6649500<br />
8016310<br />
8210000<br />
10435370<br />
9892611<br />
9361560<br />
10268921<br />
10680886<br />
4000000<br />
2000000<br />
84640<br />
68210<br />
63640<br />
63170<br />
81140<br />
81690<br />
175736<br />
120643<br />
121493<br />
146871<br />
0<br />
95/96 96/97 97/98 98/99 99/00 00/01 01/02 03/04 04/05 05/06<br />
Year<br />
Fig. 3 Rain-fed and irrigated area under small-holders<br />
32
The area under small scale irrigation has<br />
been appreciably expanding, particularly<br />
after 2001/02 though apparently shown to<br />
decline during 2003/04.<br />
Year<br />
<strong>Table</strong> 2. Irrigated area under small-holder private farmers (ha)<br />
Cereals<br />
Permanent<br />
Teff Barley Wheat Maiz Sorghum Total Pulses Oil seeds Others crops<br />
e<br />
2005/06 7895 7441 6116 3558 15596 73509 3950 1740 30170 37502<br />
6<br />
2004/05 7756 7212 4614 2940 9756 59052 6832 1915 16143 34361<br />
7<br />
2003/04 7835 5647 3805 3257 11199 61406 5217 927 21578 31516<br />
3<br />
2001/02 1244 8016 4750 5383 12778 93615 9896 726 35855 33359<br />
7<br />
8<br />
2000/01 5650 3680 1330 1896 15910 45770 3880 290 9240 22500<br />
0<br />
1999/00 5230 4630 1780 1856 11510 42850 2890 430 13390 21580<br />
0<br />
1998/99 2890 3580 2570 1365 7240 30110 2660 ** 8830 21350<br />
0<br />
1997/98 1154 4230 2540 1214 3690 34560 1920 ** 7350 18860<br />
0<br />
0<br />
1996/97 4790 ** 800 1369 18970 39220 ** ** 3650 21470<br />
0<br />
1995/96 4490 1400 1890 2181 ** 55050 5300 ** 4890 1933<br />
0<br />
** not reported<br />
The main agricultural produces under small<br />
scale irrigation includes cereals, pulses, oil<br />
seeds and permanent crops like fruits, chat,<br />
c<strong>of</strong>fee, hopes and sugarcane. Permanent<br />
crops occupy the largest share next to<br />
cereals. Pulses and oil seeds occupy (5 %)<br />
insignificant part compared to permanent<br />
crops. The major irrigated pulse crops<br />
include field pea, horse bean, haricot bean<br />
and chick pea. Major irrigated oil seeds<br />
include neug, linseeds and sesame. Others<br />
like vegetables and root crops are produced<br />
in small proportion. Among cereals crops,<br />
maize covers the maximum area under small<br />
scale irrigation followed by sorghum, tef,<br />
barley and wheat (<strong>Table</strong> 2).<br />
In contrary to small scale irrigation, Medium<br />
and large scale irrigation schemes in the<br />
country has been found to produce mainly<br />
cash and industrial crops. The schemes<br />
considered this in study are government<br />
owned enterprises. Medium and large scale<br />
irrigation schemes are usually expected to<br />
contribute to the national economic growth<br />
and alleviation <strong>of</strong> poverty and food security.<br />
However, the contribution <strong>of</strong> these schemes<br />
to food crops production is almost none. The<br />
major crops grown under medium and large<br />
33
scale irrigation include Sugarcane, cotton,<br />
fruits and vegetables. Figures 4 to 6 show<br />
area, production and productivity <strong>of</strong><br />
Medium and large scale irrigated agriculture<br />
schemes. During the last one decade the area<br />
under irrigation was steadily increasing for<br />
most <strong>of</strong> medium and large scale schemes<br />
(Fig.4). Particularly Fincha’a and Metehara<br />
farms are significantly increasing while<br />
MAAE farm has shown only a slight<br />
increase. Mainly due to re-occupation <strong>of</strong><br />
part <strong>of</strong> the lands by the local people, Sille<br />
farm has shown a decline in irrigated land<br />
area. . Similarly, crop production, has shown<br />
an increasing trend for most <strong>of</strong> the irrigation<br />
schemes (Fig. 5). Sugar cane production is<br />
increasing significantly at Fincha’a and<br />
Metehara while banana production is<br />
increasing significantly at Sille farm.<br />
However at UAAIE farm, crop production<br />
shows a decreasing trend. At Sille farm<br />
cotton production shows a decreasing trend<br />
mainly the replacement <strong>of</strong> some <strong>of</strong> the<br />
cotton field by banana. This was attributed<br />
mainly to market problems since there are<br />
no competent purchasers <strong>of</strong> the products in<br />
the area, and transportation cost is too high<br />
to move to other areas. Consequently, the<br />
farm has become price recipient, instead <strong>of</strong><br />
negotiating for a reasonable price.<br />
Productivity is increasing better at MAAE<br />
farm only while at Metehara and sille farms<br />
the trend is stable. Productivity has been<br />
declining at UAAIE and Fincha farms, but<br />
attempts are made to compensate by<br />
increase in cultivated land area. While the<br />
productivity <strong>of</strong> banana at Sille farm was<br />
decreasing despite its increasing in land<br />
area, the overall productivity <strong>of</strong> Sille farm is<br />
unstable, which may be among the reasons<br />
for continuous change <strong>of</strong> crop types.<br />
12.00<br />
10.00<br />
Area in '000 ha<br />
8.00<br />
6.00<br />
MAAE<br />
Sille<br />
Fincha<br />
UAAIE<br />
Metehara<br />
4.00<br />
2.00<br />
0.00<br />
1993 1994 1995 1996 1997 1998 1999 2000 2001 2002 2003 2004 2005 2006<br />
Year<br />
Fig. 4 Trend <strong>of</strong> irrigated area under medium and large-scale irrigation schemes<br />
34
9000<br />
8000<br />
7000<br />
MAAE ('00 q)<br />
Sbanana (q)<br />
Scotton (q)<br />
Smaize (q)<br />
Fincha ('000 t)<br />
UAAIE ('00 q)<br />
Metehara ('000 t)<br />
6000<br />
Production<br />
5000<br />
4000<br />
3000<br />
2000<br />
1000<br />
0<br />
1993 1994 1995 1996 1997 1998 1999 2000 2001 2002 2003 2004 2005 2006<br />
Year<br />
Fig. 5 Trend <strong>of</strong> agricultural production under medium and large-scale irrigation schemes<br />
120.0<br />
Productivity<br />
100.0<br />
80.0<br />
60.0<br />
MAAE (q/ha)<br />
Sbanana (t/ha)<br />
SCotton (q/ha)<br />
Smaize (q/ha)<br />
Fincha (00q/ha)<br />
UAAIE (t/ha)<br />
Metehara (000q/ha)<br />
40.0<br />
20.0<br />
0.0<br />
1993 1994 1995 1996 1997 1998 1999 2000 2001 2002 2003 2004 2005 2006<br />
Year<br />
Fig. 6 Trend <strong>of</strong> productivity <strong>of</strong> irrigated agriculture under medium and large-scale schemes<br />
35
5. Conclusion<br />
In Ethiopia, crop production is dominated by<br />
traditional rain-fed agriculture. However,<br />
rainfall is unreliable and erratic in nature. As<br />
a result, production and productivity is low<br />
and stable. During the last one decade, the<br />
maximum and minimum cultivated land by<br />
small-holder peasant farmers at the national<br />
level was 10.7 and 6.6 M ha, respectively.<br />
Crops grown are mainly cereals occupying<br />
about 74 per cent followed by pulses and oil<br />
seeds in small proportion. The major cereal<br />
crops gown were maize, sorghum, tef, wheat<br />
and barley. However, rain-fed agriculture<br />
does not seem to meet the ever rising<br />
demand for food as population increased.<br />
Hence, requires special focus on ways <strong>of</strong><br />
increasing production and productivity.<br />
Private peasant farmers use irrigation at<br />
small scale level to enable them increase<br />
crop production and as a means <strong>of</strong> raising<br />
income. Area under small scale irrigation has<br />
been appreciably expanding, particularly<br />
after 2001/02. During the last one decade,<br />
the total irrigated land by private peasant<br />
farmers ranged between 63 and 175 thousand<br />
hectares which is 0.8 to 1.8 per cent <strong>of</strong> the<br />
total area covered under rain-fed agriculture,<br />
respectively. Cereals and permanent crops<br />
occupy the major part followed by<br />
vegetables and root crops.<br />
The contribution <strong>of</strong> medium and large scale<br />
irrigation to food crops is almost negligible.<br />
The schemes produce mainly industrial,<br />
exportable and cash crops <strong>of</strong> which<br />
sugarcane, cotton, fruits and vegetables are<br />
the major once. In most cases, the area under<br />
medium and large scale irrigation schemes<br />
was steadily increasing except at MAAE and<br />
Sille farm. At UAAIE production and<br />
productivity were declining while Sille farm<br />
production is generally declining and<br />
productivity was unstable. Crop productivity<br />
was declining at Fincha’a farm, better at<br />
MAAE farm and stable at Metehara.<br />
References<br />
CSA (Central Statistical Agency) 2006.<br />
Statistical Abstract. Federal Democratic<br />
Republic <strong>of</strong> Ethiopia Central Statistical<br />
Agency, Addis Ababa, Ethiopia.<br />
Haise, H.A. and Hagan, R.M. 1967. Soil,<br />
Plant and evaporative measurement as<br />
criteria for scheduling irrigation. Pp 577<br />
– 604. In: Irrigation <strong>of</strong> Agricultural<br />
lands. R. M. Hagan, H.R. haise and T.W.<br />
Edminster (ed), Monog. Am. Soc.<br />
Agron. Medison, WI.<br />
MoFED (Ministry <strong>of</strong> Finance and Economic<br />
Development). 2006. A plan for<br />
Accelerated and sustained Development<br />
to End poverty (PASDEP): Ethiopia,<br />
building in progress. Volume 1 main<br />
report. Federal Democratic Republic <strong>of</strong><br />
Ethiopia, Ministry <strong>of</strong> finance and<br />
economic development, Addis Ababa<br />
MoWR (Ministry <strong>of</strong> <strong>Water</strong> Resources).<br />
2002. <strong>Water</strong> sector development<br />
programme 2002-2016, Volume II: Main<br />
Report. Federal Democratic Republic <strong>of</strong><br />
Ethiopia, Ministry <strong>of</strong> <strong>Water</strong> Resources,<br />
Addis Ababa.<br />
MoWR (Ministry <strong>of</strong> <strong>Water</strong> Resources).<br />
2005. Irrigation (Potential) in Ethiopia.<br />
Irrigation and Drainage Development<br />
Studies Department, Federal Democratic<br />
Republic <strong>of</strong> Ethiopia, Ministry <strong>of</strong> <strong>Water</strong><br />
Resources, Addis Ababa.<br />
Taylor, S. A. 1965. Managing irrigation<br />
water on farm. Trans. ASAE; 8:433-436<br />
36
Basline Servey <strong>of</strong> Irrigation and Rainfed Agriculture in Blue Nile Basin<br />
Kebede Tsehayu<br />
FAO-Nile Project Entebbe, Uganda<br />
kebede-tsehayu@yahoo.co.uk<br />
Abstract<br />
This paper discusses issues and challenges<br />
<strong>of</strong> agricultural developments in the Blue<br />
Nile Basin <strong>of</strong> Ethiopia. The crop land in the<br />
basin can not sustain the population unless<br />
agricultural productivity increases. Due to<br />
climatic factors and low yield rainfed<br />
agriculture can not support the high<br />
population in the basin. Up to date the land<br />
under irrigation is very small. Like most<br />
Nile Basin countries though agriculture<br />
dominates the economy <strong>of</strong> Ethiopia much<br />
was not done in the irrigation agricultural<br />
resources development.<br />
Irrigated agriculture is the largest draw on<br />
the waters <strong>of</strong> the Nile in Egypt and Sudan.<br />
But the others 8 Nile countries agriculture<br />
is mainly rainfed and they are not using<br />
even 2% <strong>of</strong> Nile water. Ethiopia is<br />
contributing more than 85% <strong>of</strong> the Nile<br />
water annual discharge and yet is not using<br />
even 1 % <strong>of</strong> it. In near future the water<br />
scarcity in agricultural development <strong>of</strong> the<br />
Nile Basin can be affected by ever<br />
increasing population, unpredictable<br />
climate, soil infertility, uncertainty <strong>of</strong><br />
surface water allocations, unexplored<br />
groundwater resources, low water<br />
availability, infrastructure etc. Agriculture<br />
is by far the main user <strong>of</strong> water in the Nile<br />
basin and therefore requires due attention in<br />
future investments. Ethiopia does not<br />
achieve food security until it utilizes Nile<br />
water for irrigation.<br />
1. Background<br />
The Nile river basin covers an area <strong>of</strong><br />
approximately 3.1 million square<br />
kilometers and with a total population <strong>of</strong><br />
around 370 million people. The Nile basin<br />
countries are Burundi, the Democratic<br />
Republic <strong>of</strong> Congo, Egypt, Eritrea,<br />
Ethiopia, Kenya, Rwanda, Sudan, Tanzania<br />
and Uganda.<br />
The FAO-ITALY supported project<br />
“Information Products for Nile Basin <strong>Water</strong><br />
Resources <strong>Management</strong>” is implementing a<br />
basin wide survey <strong>of</strong> current and future water<br />
use in rainfed and irrigated agriculture. The<br />
Project “Information Products for Nile Basin<br />
<strong>Water</strong> Resources <strong>Management</strong>” is intended to<br />
strengthen the ability <strong>of</strong> the governments <strong>of</strong> the<br />
ten Nile countries to take informed decisions<br />
with regard to water resources policy and<br />
management in the Nile basin. The project is<br />
supported by the Government <strong>of</strong> Italy and<br />
carried out under the umbrella <strong>of</strong> the Nile Basin<br />
Initiative, <strong>of</strong> which Italy is a full partner. The<br />
project will make extensive use <strong>of</strong> regional<br />
expertise. It will also draw on the specific<br />
experience and knowledge residing at FAO,<br />
especially in the fields <strong>of</strong> agricultural water use<br />
and water productivity.<br />
2. Objectives<br />
The survey is intended to provide stakeholders<br />
and decision makers in the Nile Basin with a<br />
thorough assessment <strong>of</strong> the linkage between<br />
agriculture and water in the basin. The survey<br />
is expected to address the following issues:<br />
• What are the opportunities for enhancing<br />
productivity in agriculture?<br />
• Create Agricultural production database at<br />
district level providing information on area,<br />
yield, and production for the main<br />
commodities for a baseline year from<br />
(2000);<br />
• Analysis <strong>of</strong> the current agricultural<br />
productivity under rainfed and irrigated<br />
conditions;<br />
37
• Rapid export growth through production <strong>of</strong><br />
high value agricultural products;<br />
• Decentralization to shift decision making<br />
closer to community to improve<br />
responsiveness and service delivery;<br />
• Increase proper and modern water<br />
resources utilization.<br />
3. Rainfed Agriculture<br />
• A baseline survey (for the year 2000 and<br />
onwards) <strong>of</strong> agricultural water use covering<br />
all aspects <strong>of</strong> agriculture is in progress. The<br />
survey includes a detailed review and maps<br />
<strong>of</strong> population, land use, cropping patterns,<br />
estimate <strong>of</strong> water use in rainfed and<br />
irrigated agriculture, and an assessment <strong>of</strong><br />
current water development facilities.<br />
production is insignificantly low in these areas.<br />
different agro ecological considerations might<br />
lead to the improvement <strong>of</strong> agricultural<br />
production. the following map shows the main<br />
agro ecological zones <strong>of</strong> the basin. one can see<br />
clearly the topography in the east is not easy for<br />
farming (figure 1). regional specialization<br />
based on suitability and provisions <strong>of</strong><br />
compatible packages for the different agro<br />
ecologies that will lead to the improvement <strong>of</strong><br />
small-scale agricultural production are the basic<br />
development directions.<br />
• Projections for 2030 <strong>of</strong> demand for food<br />
and other produce in the basin, with<br />
estimates <strong>of</strong> arable land expansion in<br />
irrigated and rainfed agriculture, yields <strong>of</strong><br />
major crops, cropping patterns, and<br />
cropping intensities will be executed.<br />
Results <strong>of</strong> a set <strong>of</strong> scenarios on water<br />
development for agriculture will be based<br />
on analysis by administrative units.<br />
• The study will focus at national and subnational<br />
levels with particular attention to<br />
the main crop production systems.<br />
Agricultural water productivity will be<br />
analyzed at district level. Results will be<br />
aggregated to country level with the aim to<br />
build up a comparable picture <strong>of</strong> water<br />
productivity in rainfed and irrigated<br />
agriculture across the basin.<br />
rain fed agriculture is the major livelihood <strong>of</strong><br />
the country, which is characterized by low<br />
productivity associated with underdeveloped,<br />
low input systems and highly degraded natural<br />
resources. peasant agricultural lands on the<br />
plateaus <strong>of</strong> the northern and south-central part<br />
<strong>of</strong> ethiopia have been degraded because <strong>of</strong><br />
over-utilization for centuries. one cannot hope<br />
that ethiopia can maintain her food production<br />
through the traditional farming method <strong>of</strong><br />
highland agriculture. absolute dependence on<br />
rainfed agriculture and low productivity<br />
associated with underdeveloped, low input<br />
systems <strong>of</strong> production and degraded natural<br />
resources base has rendered these areas highly<br />
vulnerable to even minor shocks. irrigated crop<br />
Figure 1. Agroecological Zone <strong>of</strong> the Blue<br />
Nile Basin<br />
Production and productivity are very low in<br />
the basin and the use <strong>of</strong> improved<br />
productivity enhancing inputs and<br />
technologies is extremely low. The<br />
expansion <strong>of</strong> irrigated agriculture is among<br />
other factors is constrained by the rugged<br />
topography and terrain. Most <strong>of</strong> the regions<br />
have poor market access due to<br />
underdevelopment <strong>of</strong> infrastructure as<br />
whole and agricultural markets in<br />
particular. Natural resources degradation<br />
(soil erosion and deforestation) are<br />
extremely sever in the basin, which makes<br />
it a necessity for all development<br />
interventions to be oriented towards<br />
38
sustainable natural resources management<br />
as a matter <strong>of</strong> priority.<br />
3.1 Crop yield distribution <strong>of</strong> Blue Nile<br />
Basin<br />
Crop data from rain fed and irrigated<br />
agriculture was collected from Nile<br />
Countries through national consultants.<br />
Major crops were provided in terms <strong>of</strong> crop<br />
production, acreage and yield.<br />
The only district based agricultural survey<br />
was carried out in the year 2001/02 (1994<br />
Ethiopian Calendar). However the survey<br />
data from 1994 (1987 Ethiopian calendar)<br />
provides also useful information on area,<br />
production and productivity even if this<br />
survey was zone based.<br />
The crop production data is for both<br />
seasons ("Meher" and "Belg") for all<br />
holdings. The "Meher" is the major season<br />
while the "Belg" is the small season. Crops<br />
harvested between the months <strong>of</strong><br />
September and February are considered<br />
"Meher" crops while those harvested<br />
between the months <strong>of</strong> March and August<br />
are considered "Belg". Private peasant<br />
holding is predominant while large-scale<br />
commercial production is negligibly very<br />
little. In this rainfed production dominated<br />
small scale farming system, the share <strong>of</strong><br />
irrigated agriculture is also very little. The<br />
distribution <strong>of</strong> some major crops yield was<br />
displayed on (Figure 2,3,4). Countries like<br />
Egypt, Kenya have higher yield than<br />
Ethiopia. Especially Egypt which has used<br />
all its crop land for irrigation agriculture<br />
attains the highest yield in the Nile Basin.<br />
The yield for Blue Nile <strong>of</strong> Ethiopia is quite<br />
low in the range <strong>of</strong> 0.3 ton/hectare to 1.5<br />
ton/hectare for major cereal crops.<br />
control, data were eventually selected as per the<br />
principle “best data source so far available<br />
around the reference year 2000”. All data are<br />
presented as they are and occasionally represent<br />
different time periods. It is to expresses types<br />
and distribution <strong>of</strong> cropping systems. Map <strong>of</strong><br />
major crops (teff, wheat, maize etc).<br />
Figure 2. Wheat distribution <strong>of</strong> the Blue<br />
Nile Basin<br />
The following maps present the spatial<br />
distribution <strong>of</strong> the dominant crops found in the<br />
Basin. It aims to provide insight in the cropping<br />
distribution <strong>of</strong> the farming systems, in<br />
particular in relation to the natural conditions<br />
determined by topography and climate.<br />
The data presented are the result <strong>of</strong> an intensive<br />
database compilation on reported cropping<br />
statistics. As such they combine findings from<br />
multiple data sources. After a process <strong>of</strong> quality<br />
39
Figure 3. Teff Distribution <strong>of</strong> the Blue Nile<br />
Basin<br />
Blue Nile <strong>of</strong> Ethiopia covers an area <strong>of</strong><br />
about 367,000km2 and a population <strong>of</strong> 31<br />
millions according to 2005 UNPD figure.<br />
The Nile Basin in Ethiopia stretches over a<br />
very wide geographic area with diverse<br />
agro ecological conditions. The Nile basin<br />
comprises <strong>of</strong> the following contributing<br />
basins:<br />
The Abay river basin<br />
The Tekeze river basin<br />
The Baro Akobo river basin<br />
The Mereb river basins (partially)<br />
The Nile Basin <strong>of</strong> Ethiopia known as Blue<br />
Nile contributes more than 85% <strong>of</strong> the<br />
annual discharge <strong>of</strong> the Nile being a big<br />
contributor, Ethiopia to date use only 1% <strong>of</strong><br />
it.<br />
Figure 4. Maize Distribution <strong>of</strong> the Blue<br />
Nile Basin<br />
According to the Master Plan Studies <strong>of</strong><br />
Ministry <strong>of</strong> <strong>Water</strong> Resources, Blue Nile<br />
Basin has 165 Potential irrigation sites with<br />
total area <strong>of</strong> 2,126,700ha. The existing<br />
irrigation schemes have been collected as<br />
point data and it is difficult to calculate the<br />
area.<br />
4. Potential and Existing Irrigation<br />
Schemes<br />
The fundamental goal <strong>of</strong> achieving<br />
sustainability irrigation Agricultural system<br />
is complex and initiates many new<br />
questions that require further studies, which<br />
in turn requires multi-disciplinary<br />
collaboration and funding. The<br />
investigation and further study programs<br />
would be essential for development <strong>of</strong><br />
improved methods and technology for<br />
improving agricultural productivity, and to<br />
alleviate future scarcity <strong>of</strong> water. The<br />
assessment <strong>of</strong> methodologies for<br />
sustainable development is also quiet<br />
essential. In addition, the goal requires<br />
continuing research and gathering field data<br />
to assess management approaches. So this<br />
project output supports and benefit the Nile<br />
Countries to some extent.<br />
4.1 Blue Nile and GIAM<br />
According to Global Irrigated Area Map<br />
(GIAM) most irrigation lands are situated<br />
in Egypt and Sudan. The rest upper Basin<br />
countries have minor land under irrigation.<br />
Ethiopia Blue Nile land under irrigation is<br />
so small compared to its potential area.<br />
According to the Master Plan Studies <strong>of</strong><br />
Ministry <strong>of</strong> <strong>Water</strong> Resources, Existing<br />
irrigation is 57,561 ha and the potential is<br />
1,774,676 ha. Ethiopia in order to feed her<br />
fast growing population the irrigation<br />
potential <strong>of</strong> the country has to be<br />
developed.<br />
40
Figure 5. Potential and Existing Irrigation<br />
Schemes <strong>of</strong> the Blue Nile Basin<br />
<strong>Table</strong> 1. Existing and potential irrigation Summary in the basin<br />
Sub-basin Administrative Units Area<br />
(km2)<br />
Mean <strong>Water</strong><br />
Resources<br />
(*106 m3/yr)<br />
Blue Nile Amhara, Benishangul<br />
(Abbay)<br />
Baro<br />
Akobo<br />
Gumuz, Oromia<br />
SNNPR, Oromia,<br />
Gambella, Benishangul<br />
Gumuz<br />
Existing<br />
Irrigation<br />
(ha)<br />
Potential<br />
Irrigation<br />
(ha)<br />
199,812 49,000 37,347 719,088<br />
75,912 23,237 12,315 486,299<br />
Tekeze/At Tigray, Amhara 86,510 8,191 7,899 569,289<br />
bara<br />
Total 362,234 80,428 57,561 1,774,676<br />
topography. But there are some pocket<br />
areas which have potential for irrigation.<br />
The irrigation potential <strong>of</strong> Ethiopia is<br />
estimated between 1.8 (Blue Nile Basin)<br />
and 3.7 (for the whole country) million<br />
hectares out <strong>of</strong> which only 5% is under<br />
irrigation (Irrigation in Africa by Food &<br />
Agriculture <strong>of</strong> the UN programme latter<br />
called AQUASTAT). As it is displayed in<br />
(Figure 5) Evapotranspiration map in<br />
general the west marginal area which is in<br />
reddish brown color though it is flat and<br />
convenient for irrigation, it has high<br />
evaporation. The eastern and central part <strong>of</strong><br />
the basin with bluish color is characterized<br />
by low evapotranspiration and rugged<br />
41
income exports. A stronger performing<br />
agricultural sector is fundamental for<br />
Africa's overall economic growth. A<br />
constantly growing agricultural sector is<br />
crucial for addressing hunger, poverty and<br />
inequality. More than 70 percent <strong>of</strong> the<br />
total population and the majority <strong>of</strong> the<br />
extreme poor and undernourished live in<br />
rural areas. A healthy agriculture sector<br />
means more jobs, more income and more<br />
food for the poor.<br />
Figure 6. Evapotranspiration Map <strong>of</strong> the<br />
Blue Nile Basin<br />
5. Agricultural Trade <strong>of</strong> Nile Basin<br />
countries<br />
Nile Countries mainly depend on export <strong>of</strong><br />
primary agricultural products. The gross<br />
domestic product (GDP) <strong>of</strong> Nile Countries<br />
is very low as compared to other<br />
developing countries. Among the Nile<br />
Countries Egypt has a GDP <strong>of</strong> greater than<br />
80 billion USD while the rest have a GDP<br />
<strong>of</strong> less than 20 billion USD according to<br />
African Development Report (Graph 1).<br />
When we see the composition <strong>of</strong> the GDP<br />
for countries like Democratic republic <strong>of</strong><br />
Congo, Brundi, Tanzania, Ethiopia and<br />
Rwanda agriculture contributed above 40%<br />
<strong>of</strong> the GDP (Graph 2).<br />
Agriculture dominates the economies <strong>of</strong><br />
most African countries, providing jobs,<br />
Gross Domestic Product (GDP), 2003<br />
100<br />
80<br />
84.4<br />
60<br />
US $ billion<br />
40<br />
20<br />
0.6<br />
5.7<br />
0.8<br />
6.7<br />
14.4<br />
1.7<br />
17.8<br />
10.3<br />
6.3<br />
0<br />
Burundi<br />
DRC<br />
Egypt<br />
Eriteria<br />
Ethiopia<br />
Kenya<br />
Rwanda<br />
Sudan<br />
Tanzania<br />
Uganda<br />
42
Graph 1 Gross Domestic Product (GDP)<br />
Composition <strong>of</strong> GDP, 2003<br />
Services<br />
Share<br />
Industrial<br />
Share<br />
Agricultural<br />
Share<br />
100%<br />
80%<br />
60%<br />
40%<br />
20%<br />
0%<br />
Burundi<br />
32<br />
19<br />
49<br />
DRC<br />
24<br />
17<br />
57<br />
Egypt<br />
49.2<br />
34.6<br />
16.1<br />
Eriteria<br />
61.4<br />
24.7<br />
13.9<br />
Ethiopia<br />
47.4<br />
10.7<br />
41.8<br />
Kenya<br />
64.7<br />
19.6<br />
15.8<br />
Rwanda<br />
36.5<br />
21.9<br />
41.6<br />
Sudan<br />
39.7<br />
24.8<br />
35.5<br />
Tanzania<br />
38.6<br />
16.4<br />
45<br />
Uganda<br />
46.4<br />
21.2<br />
32.4<br />
Graph 2 Composition <strong>of</strong> GDP<br />
For Egypt, Eritrea, DRC and Rwanda the<br />
import <strong>of</strong> agricultural commodities is<br />
higher than export <strong>of</strong> agricultural<br />
commodities. For Countries like Ethiopia<br />
and Sudan the difference between export<br />
and import <strong>of</strong> agricultural commodities is<br />
not so much even though import is a little<br />
bit high. For Kenya, Uganda, Tanzania and<br />
Brundi their export <strong>of</strong> agricultural<br />
commodities is higher than importing<br />
(Figure 7).<br />
43
Graph 3. African Countries are highly<br />
dependant on single agricultural<br />
commodity<br />
Figure 7. Agricultural trades in the Nile<br />
countries<br />
At present, a characteristic <strong>of</strong> too many<br />
African countries is a relatively<br />
undiversified economy with little industry<br />
and manufacturing and exports dominated<br />
by one or two raw commodities (Graph 3).<br />
Often a single, primary agricultural<br />
commodity is the major source <strong>of</strong> export<br />
earnings, creating a source <strong>of</strong> uncertainty<br />
because <strong>of</strong> their low income elasticity <strong>of</strong><br />
demand and their declining and volatile<br />
terms <strong>of</strong> trade. Overall, Africa's agricultural<br />
sector accounts for about 20 percent <strong>of</strong> total<br />
merchandise exports, declining from more<br />
than 50 percent in the 1960s<br />
Over the past 30 years, agricultural imports<br />
have outstripped agricultural exports,<br />
making the region a net agricultural<br />
importer since 1980, Indeed, as population<br />
growth in Africa outpaces food production,<br />
imports and food aid are required to make<br />
up the difference In the mid-1990s, out <strong>of</strong><br />
the world total <strong>of</strong> 32 million victims <strong>of</strong><br />
disasters receiving relief assistance from<br />
the World Food Programme (WFP), 21.5<br />
million were living in Africa. In 2000<br />
Africa received 2.8 million tones <strong>of</strong> food<br />
aid, which is more than a quarter <strong>of</strong> the<br />
world total. In 2001, the number <strong>of</strong> people<br />
suffering from food emergencies ranged<br />
between 23 and 28 million.<br />
44
0.85%<br />
0.21%<br />
2.03%<br />
Ethiopia export Value<br />
8.93%<br />
43.14%<br />
44.40%<br />
Africa<br />
Americas<br />
Asia<br />
Australia<br />
Europe<br />
Nile country<br />
Oceanic<br />
044%<br />
Graph 4. Ethiopian agricultural import is mainly from America and Europe. The import from<br />
Africa and within Nile Countries is insignificant<br />
Ethiopia_ Import Value<br />
1.42%<br />
34.41%<br />
0.51%<br />
5.47%<br />
0.00%<br />
1.10%<br />
57.08%<br />
Africa<br />
Americas<br />
Asia<br />
Australia<br />
Europe<br />
Nile country<br />
Oceanic<br />
Graph 5. Ethiopian agricultural export is mainly to America and Europe. The export to Africa<br />
and within Nile Countries is insignificant<br />
45
Increasing trade and market opportunities<br />
locally, regionally and internationally<br />
contribute to agriculture's ability to grow<br />
expand incomes and reduce poverty and<br />
food insecurity. Trade <strong>of</strong>ten introduces<br />
new, more productive and more<br />
sustainable production technologies,<br />
processing systems and related services.<br />
Trade provides opportunities to produce<br />
higher value products. For many<br />
producers, expanding agricultural trade<br />
opportunities locally and within the<br />
region is an important first step for taking<br />
advantage <strong>of</strong> potential new access<br />
international markets. However,<br />
according to a recent paper, 1 trade<br />
continues to be marked by overwhelming<br />
dependence on traditional overseas<br />
markets in industrial countries, although<br />
(admittedly from a low base), there has<br />
been substantial growth in intra-regional<br />
trade within Africa. If we exclude<br />
unrecorded, <strong>of</strong>ten informal-sector, trade<br />
across the porous borders, on average,<br />
only 10 percent <strong>of</strong> exports <strong>of</strong> countries<br />
belonging to each African Regional<br />
Economic Organization are destined<br />
within itself.<br />
6. Recommendations<br />
Unless the level <strong>of</strong> food production<br />
increases it will be hard to sustain the<br />
ever increasing population<br />
• Increase export growth through<br />
production <strong>of</strong> high value agricultural<br />
products to get foreign earnings<br />
Rather than depending on single<br />
commodity it is advantages to diversify<br />
raw commodities.<br />
The potential area in the Blue Nile Basin<br />
need to be developed before water<br />
shortage becomes an issue.<br />
7. Major sources <strong>of</strong> information and<br />
data for the survey<br />
7.1 Irrigation (potential) in Ethiopia both<br />
existing and possible schemes,<br />
FDRE, Ministry <strong>of</strong> water resources,<br />
September 2005, Addis Ababa<br />
7.2 Tana Beles Integrated rural<br />
development project rehabilitation<br />
and restructuring study, December<br />
1993<br />
7.3 Tekeze basin integrated development<br />
master plan project second phase<br />
report, vol. No. 4, June 1997<br />
7.4 Ethiopian Agricultural sample<br />
enumeration 2001/2002 (1994 E.c),<br />
Federal democratic republic <strong>of</strong><br />
Ethiopia, central, Agricultural Census<br />
commission (Amhara, Tigray,<br />
Oromia & Benishangul gumuz<br />
regions)<br />
7.5 Abby River basin master plan study.<br />
7.6 Tekeze river basin master plan study.<br />
7.7 Baro Akobo river basin master plan<br />
study<br />
7.8 National statistical survey 1994/95<br />
(1987 Eth. Cal.)(Estimates <strong>of</strong> area,<br />
production and yield)<br />
7.9 Agro ecological zones Ministry <strong>of</strong><br />
Agriculture and natural resources ----<br />
7.10 Woody biomass inventories and<br />
strategic planning project (WBISPP)<br />
Community based irrigation projects<br />
should be encouraged by the government<br />
46
Assessment <strong>of</strong> Design Practices and Performance <strong>of</strong> Small Scale<br />
Irrigation Structures in South Region<br />
Robel Lambisso<br />
World Vision Ethiopia<br />
robelwam2@yahoo.com<br />
Abstract<br />
Uneven distribution <strong>of</strong> rainfall in the country<br />
in general and in South region in particular<br />
makes irrigation the best way to enhance<br />
food production. Development <strong>of</strong> smallscale<br />
irrigation schemes is the best<br />
alternative as they require minimum<br />
investment & their gestation period is<br />
comparatively low. The southern region as<br />
part <strong>of</strong> the country has been implementing<br />
such schemes. Despite remarkable<br />
achievements, some <strong>of</strong> the implemented<br />
schemes have totally failed and some are<br />
performing below their capacity. A case<br />
study considering 26 existing small scale<br />
irrigation works (about 1/3 rd <strong>of</strong> the total<br />
schemes) in the south region is carried out<br />
for this research work and attempt is made<br />
to understand the causes <strong>of</strong> the major<br />
problems that are related to the design<br />
consideration <strong>of</strong> the different components <strong>of</strong><br />
the structure and identify the gap in<br />
knowledge between the current design<br />
practices and performance <strong>of</strong> the structures.<br />
The pre and post construction institutional<br />
aspects, planning aspects, social aspects,<br />
economic aspects, operation & utilization<br />
aspects are also given due attention. Some <strong>of</strong><br />
the physically observed problems <strong>of</strong> the<br />
existing irrigation structures considered for<br />
analysis are: main canal siltation (50%),<br />
sedimentation <strong>of</strong> the headwork (42%),<br />
problem <strong>of</strong> seepage through foundation<br />
(4%), main canal seepage (33%), scouring<br />
<strong>of</strong> downstream bank (8%), drying <strong>of</strong> rivers<br />
(12%), damage on impervious and flexible<br />
apron(19%), change <strong>of</strong> river course(12%),<br />
damage <strong>of</strong> under sluices(27%) and damage<br />
on CD works(4%). Likewise, some <strong>of</strong> the<br />
planning, institutional & operation problems<br />
are lack <strong>of</strong> adequate community<br />
participation, water right conflict among up<br />
streamers and down streamers (12%),<br />
market outlet problems (8%), proper<br />
handing over problem (31%), lack <strong>of</strong> proper<br />
training and the like. During the time <strong>of</strong> the<br />
study, 18 % the irrigation schemes <strong>of</strong> the<br />
region were not operational because <strong>of</strong><br />
aforementioned and related reasons.<br />
Key Words: Small scale irrigation;<br />
Performance <strong>of</strong> Structures; Design Practices<br />
1. Introduction<br />
The majority <strong>of</strong> population <strong>of</strong> Ethiopia is<br />
dependent on rain fed agricultural<br />
production for its livelihood. However,<br />
estimated crop production is not close to<br />
fulfill the food requirements <strong>of</strong> the country.<br />
One <strong>of</strong> the best alternatives to consider for<br />
reliable and sustainable food security<br />
development is expanding irrigation<br />
development on various scales (whether<br />
small, medium or large) and options<br />
(diversion, storage, gravity, pumped, etc).<br />
For countries like Ethiopia where the<br />
principal component <strong>of</strong> project development<br />
(finance) is a constraint to incur huge<br />
investment for irrigation, small scale<br />
irrigation can be an alternative solution to<br />
enhance food production. This is <strong>of</strong> course<br />
without undermining the strategic<br />
importance <strong>of</strong> developing medium to large<br />
scale irrigation schemes to feed the<br />
expanding population in the foreseeable<br />
future. Development <strong>of</strong> small scale irrigation<br />
through river diversion, constructing micro<br />
dams, water harvesting structures, etc may<br />
47
e considered as pragmatic approach in the<br />
contemporary Ethiopia for ensuring food<br />
self-sufficiency.<br />
Small scale irrigation structures, owing to<br />
their relatively small investment cost, ease<br />
<strong>of</strong> construction, simplicity <strong>of</strong> operation &<br />
maintenance have been a strategic target <strong>of</strong><br />
the country for achieving sustainable food<br />
security and self sufficiency. A number <strong>of</strong><br />
such schemes have been designed and<br />
constructed in the previous years. However,<br />
while some schemes are performing<br />
successfully, it has been observed in various<br />
reports that some <strong>of</strong> the schemes have failed<br />
to serve the purpose for which they are<br />
intended. In line with this, recent study<br />
report for the Amhara region (Asfaw, 2004)<br />
has been used as a bench mark to conduct<br />
related study in the southern region.<br />
To this end, this research aims to evaluate<br />
the design practices and performances <strong>of</strong><br />
small scale irrigation structures in Southern<br />
Nations Nationalities and Peoples Regional<br />
Government. In addition to the hardware<br />
problems, institutional, planning, social and<br />
economic problems contributing to the<br />
failure are also highlighted.<br />
The out puts <strong>of</strong> the research are believed to<br />
highlight the problems <strong>of</strong> the existing<br />
irrigation schemes and show future direction<br />
for planning, design and operation <strong>of</strong><br />
irrigation projects.<br />
2. Objectives<br />
2.1 General objective<br />
The primary objective is to investigate the<br />
cause <strong>of</strong> failure <strong>of</strong> existing small scale<br />
irrigation schemes <strong>of</strong> the region to learn a<br />
lesson and generate knowledge on practices<br />
and performances for future practical<br />
application and compile set <strong>of</strong><br />
recommendations for planning, design,<br />
implementation and operation <strong>of</strong> irrigation<br />
schemes.<br />
2.1.1 Specific objectives<br />
♦ To conduct inventory on the success and<br />
failure cases <strong>of</strong> small scale irrigation<br />
schemes in the region.<br />
♦ To categorize irrigation structures based<br />
on different problem parameters<br />
♦ Investigate the causes <strong>of</strong> failure for<br />
selected structures in the region with<br />
regard to hydrologic, hydraulic design,<br />
structural design & implementation<br />
aspect.<br />
♦ Investigate the existing schemes with<br />
reference to planning, institutional and<br />
operational problems<br />
♦ Formulate a systematic database on<br />
attributes <strong>of</strong> irrigation structures in the<br />
region using dBASE format and Arc<br />
View GIS s<strong>of</strong>tware. The database is<br />
basically important for efficient follow<br />
up, evaluation <strong>of</strong> projects and to assess<br />
what has been done in the subject so far.<br />
♦ Investigate selected successful structures<br />
in the region and draw lessons from<br />
their success (i.e. whether any unique<br />
design practice had been adopted or not)<br />
♦ Investigate failed structures and draw<br />
lessons to devise better design practices<br />
and suggest methods <strong>of</strong> rehabilitation.<br />
3. Methodology <strong>of</strong> data collection and<br />
analysis<br />
In this research, desk study is made on<br />
existing small scale irrigation systems and<br />
practical field visits were conducted to<br />
15(Fifteen) sites found in the region. In the<br />
desk study, the available relevant data on<br />
11(eleven) existing irrigation structures and<br />
post implementation review reports on the<br />
status <strong>of</strong> existing schemes in the south<br />
region is collected from the regional<br />
irrigation authority. From the study and<br />
design reports, the current design practice<br />
for irrigation structures is examined and<br />
from the practical visits undertaken on 15<br />
sites, the extent and frequency <strong>of</strong> hardware<br />
and s<strong>of</strong>tware problems on the schemes is<br />
assessed. In the analysis, the frequency <strong>of</strong><br />
each problem among the sites, type <strong>of</strong><br />
problem in each site and problem ranking<br />
48
has been done. Better insights on hardware<br />
and s<strong>of</strong>tware aspects <strong>of</strong> the problems have<br />
been acquired via interviews with<br />
community and technical personnel using<br />
relevant structured questionnaire.<br />
To help build the geographic database,<br />
inventory is made, missing coordinates were<br />
recorded using GPS instrument, inserted in<br />
spreadsheets as dBASE (dbf-IV) and<br />
imported to the drainage and rainfall maps<br />
4. Results and Discussion<br />
4.1 Main Canal Siltation<br />
Out <strong>of</strong> the 26 sites considered for the<br />
analysis, 13 are observed to have main<br />
canals highly charged with sediment. In<br />
other words, 50% <strong>of</strong> the sites are seen to<br />
suffer from the problem. The problem<br />
prevalence indicates the level <strong>of</strong> attention to<br />
be given. The silt load is observed to come<br />
either along with the river water (suspended<br />
and bed load) or as a run <strong>of</strong>f from upstream<br />
nearby catchement.<br />
The figure below shows a lined canal<br />
completely filled with sediment.<br />
<strong>of</strong> the region geo-referenced and digitized<br />
for the same purpose.<br />
Some canals like the one shown in the figure<br />
do not have proper design. In this case, the<br />
canal does not have a sustaining bed slope<br />
and it also does not have side berms.<br />
Fig-1 Silted main canal <strong>of</strong> Satame<br />
irrigation project<br />
Sustaining bed slopes should be provided by<br />
conducting proper pr<strong>of</strong>ile leveling activities.<br />
The soil bank immediately beside the canal<br />
is frequently washed by the rain water and<br />
deposited in to the canal. Hence, deposition<br />
<strong>of</strong> large soil mass should not be allowed<br />
beside the canals and adequate berms should<br />
be provided.<br />
As additional solutions to the problem,<br />
proper procedures <strong>of</strong> design <strong>of</strong> de-silting<br />
basins are also forwarded along with<br />
FORTRAN program written for the same<br />
purpose. Vortex vanes and excluder tunnels<br />
are also recommended in the context <strong>of</strong><br />
experimentation and further research.<br />
4.2 Headwork Sedimentation<br />
This was observed at 11 <strong>of</strong> the 26 sites.<br />
Accordingly, some 42% <strong>of</strong> the sites are<br />
affected with this problem. Headwork<br />
sedimentation refers to the overall<br />
submergence <strong>of</strong> the weir proper, wing walls<br />
and appurtenant structures such as gates due<br />
to settlement <strong>of</strong> sediment and the bed level<br />
rise <strong>of</strong> the river channel. Since the<br />
phenomenon results in the course change <strong>of</strong><br />
rivers, in some cases like Hao diversion it is<br />
seen that the main canal is completely<br />
washed away by the river water changing its<br />
course.<br />
To minimize the problem with headwork<br />
sedimentation especially with high flow<br />
conditions and movement <strong>of</strong> sediment laden<br />
water, provision <strong>of</strong> simple intakes <strong>of</strong> gabion<br />
or rock fill may provide a solution (Novak et<br />
al, 2001). Similar recommendation has been<br />
forwarded in the study at Amhara region<br />
49
(Asfaw, 2004). Despite the failure, the<br />
Lenda project <strong>of</strong> Bilate river is an example<br />
characterized by bends, locating the intake<br />
at the external bend will give better<br />
performance (Arved et. al, 1993). This is<br />
mainly owing to the reason that the inner<br />
sides <strong>of</strong> bends are liable to deposition <strong>of</strong><br />
sediment. The figure below illustrates the<br />
case:<br />
Fig-2 Failed Hao diversion weir<br />
4.3 Main Canal Seepage<br />
The problem <strong>of</strong> main canal seepage is<br />
observed on 9 <strong>of</strong> the 26 schemes considered<br />
for the purpose <strong>of</strong> the analysis. This means<br />
that the problem is prevalent on 35% <strong>of</strong> the<br />
schemes.<br />
The seeping water is seen to ooze through<br />
the underneath <strong>of</strong> the soil and hence<br />
significant quantity <strong>of</strong> irrigation water is lost<br />
prior to arriving to the distributing<br />
watercourses. Besides the loss <strong>of</strong> valuable<br />
diverted water, the seepage moisture in the<br />
vicinity houses is also a serious problem in<br />
the area. According to the key informants <strong>of</strong><br />
Gidabo and Gelana irrigation schemes, the<br />
schemes have never been meaningfully used<br />
for irrigation since their construction 10<br />
years back. This is mainly because <strong>of</strong> the<br />
reason that community members living<br />
along side <strong>of</strong> the main canals do not allow<br />
diversion <strong>of</strong> water due to the excessive<br />
seepage flow in to their living houses.<br />
<strong>of</strong> side intake with simple masonry<br />
obstruction across the river. If the stream is<br />
It is recommended to practice use <strong>of</strong> clay<br />
lining and plastic lining to reduce the<br />
seepage <strong>of</strong> irrigation water at the canal.<br />
However, this may not always be successful<br />
as it has been tried and failed in Wamole<br />
irrigation project <strong>of</strong> Sidama Zone.<br />
The issue <strong>of</strong> canal seepage can be managed<br />
by giving due emphasis to the properties <strong>of</strong><br />
the soil along the canal route & command<br />
area. In line with this, proper techniques <strong>of</strong><br />
clay lining and plastic lining should be tried<br />
to reduce seepage problems in irrigation<br />
canals.<br />
The coefficient <strong>of</strong> permeability is the most<br />
important factor that should be taken in to<br />
consideration. According to the USBR<br />
recommendation, canal lining should be<br />
carried out for soils with permeability<br />
coefficient value greater than 0.8m/day<br />
(EVDSA, 1990).<br />
4.4 Seepage through Foundation<br />
The foundation seepage is also observed in<br />
the region as being one <strong>of</strong> notable problems.<br />
The analysis <strong>of</strong> water seepage under the<br />
foundation is very important and must be<br />
given due attention. Failure to apply the<br />
proper sub- surface flow theories and<br />
practices may result in complete failure <strong>of</strong><br />
the structure (Garg, 1989). During the<br />
survey, 1 <strong>of</strong> the 26 sites (4%) is seen to fail<br />
due to this problem. At the observed site, the<br />
water is totally flowing beneath the<br />
foundation <strong>of</strong> the structure resulting in the<br />
total failure <strong>of</strong> the scheme. As physically<br />
observed, the structure does not even have<br />
up stream and downstream cut <strong>of</strong>fs to<br />
control the sub surface flow which induce<br />
failure due to uplift pressure or failure due to<br />
piping or undermining. The figure below<br />
shows the situation:<br />
50
Fig-3 Failed Hazembara diversion weir<br />
4.5 Damage on Intake gate and Sluice<br />
gates<br />
Out <strong>of</strong> the 26 sites considered for the<br />
analysis, 8 are observed to have highly<br />
damaged and broken intake gates. In other<br />
words, around 31% <strong>of</strong> the sites are seen to<br />
suffer from the problem. Similarly, 7 <strong>of</strong> the<br />
26 sites (27%) have damaged sluice gates.<br />
The figures possibly indicate how the<br />
schemes are performing under difficult<br />
condition. The cause for the problem <strong>of</strong><br />
gates can be mainly attributed to improper<br />
scheme operation. Provision <strong>of</strong> adequate<br />
training, proper handing over and follow up<br />
<strong>of</strong> the users is indispensable. In addition,<br />
users organized in water user association<br />
should take initiatives to generate some<br />
resource to carry out some maintenance<br />
works <strong>of</strong> this sort.<br />
4.6 Damage on Headwork<br />
Damage <strong>of</strong> the weir proper is observed in 1<br />
<strong>of</strong> the 26 sites that is Lenda (4%) and 2 sites<br />
(8%) are observed to have damaged wings<br />
and eroded banks.<br />
The following figure taken from Lenda<br />
irrigation project constructed across the<br />
Bilate river may depict the phenomena.<br />
Fig-4 Failed Side intake constructed on<br />
Bilate River<br />
The stability <strong>of</strong> the weir proper can be<br />
ensured by correctly following the proper<br />
procedures <strong>of</strong> the structural analysis after<br />
51
identifying the various forces acting on the<br />
In some cases like Lenda, it was observed<br />
that irrigation structures with in earth quake<br />
prone areas are designed with out<br />
considering the earth quake forces. The<br />
force due to earthquake should be<br />
considered where necessary for the stability<br />
analysis.<br />
The most important forces to consider are:<br />
Forces due to surface flows, forces due to<br />
sub surface flows, forces due to self weight<br />
and external forces like earth quake and silt<br />
pressure.<br />
The downstream wing walls can be failed<br />
due to excessive downstream bed and bank<br />
erosion which results because <strong>of</strong> excessive<br />
energy carried by the water coming from<br />
upstream. In addition, as seen at Lenda<br />
project, outflanking <strong>of</strong> protection structures<br />
can also cause failure <strong>of</strong> wing walls. Hence<br />
proper estimation <strong>of</strong> the magnitude <strong>of</strong> flood,<br />
proper geological investigation and proper<br />
protection measures are vital in this case.<br />
4.7 Damage on Downstream Bed<br />
This problem is observed on 5 <strong>of</strong> the 26<br />
(19%) <strong>of</strong> the surveyed sites and it is<br />
attributed to improper hydraulic design that<br />
arises from poor knowledge <strong>of</strong> the energy<br />
dissipation and impact <strong>of</strong> sediment on the<br />
structure (Baban, 1995 & Novak et. al,<br />
2001). The impervious floor is designed in<br />
all cases to reduce the surface flow action<br />
that causes scouring due to unbalanced<br />
pressure in the hydraulic jump trough.<br />
Generally speaking, except very few sites,<br />
end sills are not seen at the constructed<br />
structures. These could have played<br />
significant role in controlling receding<br />
jumps and hence reducing erosive power <strong>of</strong><br />
the flowing water (Chow, 1959). In the<br />
diversion schemes where this problem<br />
prevails, abrasion and scouring <strong>of</strong> the<br />
impervious floor is commonly observed. In<br />
addition, flexible aprons are seen to be<br />
completely washed away by the energy <strong>of</strong><br />
flowing water. The prolonged occurrence <strong>of</strong><br />
abrasion and scouring <strong>of</strong> downstream<br />
structure.<br />
portion <strong>of</strong> the structure may end up in the<br />
total collapse <strong>of</strong> the structures.<br />
Accordingly, proper design <strong>of</strong> both<br />
impervious and pervious aprons are required<br />
to control the excessive upstream energy and<br />
control structures should be provided to<br />
manage the problem <strong>of</strong> receding jump. The<br />
figure below shows the phenomena:<br />
Fig-5 Failed Goche diversion weir<br />
4.8 Drying <strong>of</strong> River Flows<br />
Drying out <strong>of</strong> flow was observed at the 3 <strong>of</strong><br />
the 26 sites considered for the analysis. In<br />
other words, about 12% <strong>of</strong> the schemes were<br />
seen having no water in their river channels.<br />
Some <strong>of</strong> the sites such as Balle have got<br />
seasonal rivers. One <strong>of</strong> the reasons causing<br />
drying out <strong>of</strong> flows is improper estimation<br />
<strong>of</strong> lean flows. The current design practice<br />
follows the procedure <strong>of</strong> float method to<br />
estimate the lean flow. It may not be wrong<br />
to use the method for preliminary works.<br />
However, the method is approximate enough<br />
to over estimate the actual flow in the river<br />
and is not reliable for important works with<br />
considerable investment. In case <strong>of</strong> over<br />
estimation, the actual flow may not be<br />
obtained to satisfy the CWR and<br />
downstream water demands which may<br />
result in complete diversion <strong>of</strong> water in to<br />
irrigation canals letting the downstream dry.<br />
The case<strong>of</strong> Ufute may be taken as a good<br />
example for this situation. During the<br />
survey, people living downstream <strong>of</strong> the<br />
scheme were seen complaining because <strong>of</strong><br />
52
shortage <strong>of</strong> water for their livestock.<br />
However, interviews revealed that some<br />
other sites like Jelaka became dry due to<br />
significant water use far upstream from the<br />
irrigation scheme. This situation has created<br />
some level <strong>of</strong> conflict among the far up<br />
streamers & irrigators and the phenomena<br />
showed lack <strong>of</strong> adequate social work during<br />
feasibility study and follow up. The river<br />
drying problem can be observed in the<br />
following figure:<br />
Fig-7 Scouring problem on an aqueduct<br />
at Lenda Project<br />
The features <strong>of</strong> design <strong>of</strong> cross drainage<br />
works can be summarized in the following<br />
main categories (Arora, 1996):<br />
Fig-6 Jelaka Diversion Weir<br />
4.9 Damage on CD Works<br />
CD- works are structures carrying<br />
discharges <strong>of</strong> a natural stream across a<br />
canal intercepting the stream. When a<br />
canal is to be taken to the watershed, it<br />
crosses a number <strong>of</strong> natural streams in the<br />
distance between the headwork and<br />
command area. As one <strong>of</strong> CD structures,<br />
an aqueduct is observed at Lenda project<br />
site. However, design was not prepared<br />
for the structure and was just constructed<br />
based on experience <strong>of</strong> masons. Hence<br />
serious scouring is observed both at up<br />
stream and downstream bed and bank <strong>of</strong><br />
the structure. The following figure depicts<br />
the case:<br />
A. Hydraulic Design<br />
This usually involves the following:<br />
♦ Determination <strong>of</strong> the maximum<br />
flood discharge and high flood level<br />
♦ Fixation <strong>of</strong> water way <strong>of</strong> the drain<br />
♦ Determination <strong>of</strong> canal water ways<br />
♦ Determination <strong>of</strong> uplift pressure on<br />
the floor <strong>of</strong> drain<br />
♦ Design <strong>of</strong> bank connections<br />
B. Structural Design<br />
This usually involves the following:<br />
♦ Design <strong>of</strong> the cross section <strong>of</strong> the<br />
aqueduct trough<br />
♦ Design <strong>of</strong> piers and abutments<br />
♦ Design <strong>of</strong> foundations<br />
At Lenda, the calculation <strong>of</strong> the adequate<br />
water way is not carried out to allow safe<br />
passage <strong>of</strong> the drainage water beneath the<br />
main canal. This could be carried out using<br />
the formula forwarded by Lacey. For large<br />
drains, the wetted perimeter may be taken<br />
equal to the width <strong>of</strong> the river; however, for<br />
small drains like that <strong>of</strong> Lenda a contraction<br />
<strong>of</strong> up to 20% can be allowed (Arora, 1996).<br />
However, failure to carryout the calculation<br />
<strong>of</strong> the waterway may endanger the entire<br />
structure and in extreme case may even<br />
flood the nearby areas.<br />
53
In the case <strong>of</strong> Lenda, determination <strong>of</strong><br />
waterway, protection works <strong>of</strong> bed and<br />
bank, design <strong>of</strong> foundation and<br />
consideration <strong>of</strong> scour conditions are totally<br />
ignored resulting in serious erosion<br />
problems as indicated in figure-7 above.<br />
Accordingly, it is recommended to do detail<br />
hydraulic and structural design <strong>of</strong> cross<br />
drainage works rather than simply deploying<br />
masons to build the structure.<br />
5. Planning, Institutional, Social &<br />
Economic Problems<br />
The above problems with such schemes are<br />
not only attributed to problems <strong>of</strong> design<br />
and construction. The s<strong>of</strong>tware aspects <strong>of</strong><br />
planning, institutional social & operational<br />
and economic problems are also crucially<br />
important. In the following section the<br />
highlights <strong>of</strong> each problem are presented:<br />
5.1 Planning Problems<br />
The planning process in the development <strong>of</strong><br />
irrigation projects can be viewed in the light<br />
<strong>of</strong> community willingness and participation.<br />
Accordingly, good performance <strong>of</strong> the<br />
schemes is directly related to the level <strong>of</strong><br />
involvement <strong>of</strong> community members in the<br />
planning process.<br />
In line with this, the schemes in the region<br />
can be categorized in to two:<br />
♦ Schemes implemented with due<br />
involvement <strong>of</strong> stakeholders<br />
♦ Schemes implemented with out(less)<br />
participation <strong>of</strong> stakeholders<br />
As observed during field visits, strong<br />
community participation was involved at<br />
Ufute and Doje schemes that are<br />
implemented by WVE in Kembata zone.<br />
The schemes are functioning satisfactorily<br />
and users are also happy with them.<br />
Community interview revealed that the<br />
beneficiaries clean silt from main canals<br />
with out the orders given by leaders <strong>of</strong> user<br />
association. From the very beginning, the<br />
beneficiaries adequately involved in the<br />
implementation process by providing labour<br />
and local materials and have already<br />
developed sense <strong>of</strong> ownership.<br />
On the other hand, the situation at Goche<br />
scheme <strong>of</strong> Hadiya zone is the opposite <strong>of</strong><br />
what has been discussed. Practically, the<br />
users had no involvement with the<br />
implementation <strong>of</strong> the project and a sort <strong>of</strong><br />
induced development or top down<br />
development is observed there. The intended<br />
beneficiaries did not show any interest with<br />
the scheme mainly because it is not<br />
addressing their real problem. They were<br />
requesting for development <strong>of</strong> a nursery at<br />
the place where the major portion <strong>of</strong> the<br />
command area <strong>of</strong> the scheme is found.<br />
Accordingly, the scheme has now failed to<br />
fulfill the purpose to which it is intended and<br />
simply the structure is located there.<br />
Similarly, less participation <strong>of</strong> intended<br />
beneficiaries is also observed at Ameka<br />
irrigation scheme in Hadiya zone. The<br />
beneficiaries could not participate<br />
adequately in all the phases <strong>of</strong> planning,<br />
implementation and operation mainly for<br />
reasons <strong>of</strong> location <strong>of</strong> the command area far<br />
away from their village and unsuitability <strong>of</strong><br />
the command area soil. The location <strong>of</strong> the<br />
command area at distant place and high<br />
plasticity <strong>of</strong> the command area soil<br />
developed reluctance among intended users<br />
<strong>of</strong> the scheme. Hence, although the project<br />
is completed, no one in the area is interested<br />
to use it. The implementing government<br />
agency should have repeatedly consulted the<br />
local people starting from the project<br />
inception and site selection rather than<br />
implementing the scheme with out their<br />
involvement. In addition to this, suitability<br />
<strong>of</strong> the command area soil should have been<br />
tested in laboratory during the feasibility<br />
study.<br />
5.2 Institutional Problems<br />
In the implementation <strong>of</strong> irrigation schemes,<br />
various institutions are involved in the<br />
process <strong>of</strong> planning, design, implementation<br />
and operation & evaluation.<br />
However, in some <strong>of</strong> the schemes built by<br />
NGOs and GOs the expected level <strong>of</strong><br />
participation <strong>of</strong> various institutions is not<br />
54
observed. Schemes <strong>of</strong> Satame, Hazembara,<br />
Lezembara, Hao, Jelaka & Goche can be<br />
cited as projects having no design and<br />
handing over documents. Preparation <strong>of</strong><br />
proper design is the due responsibility <strong>of</strong> the<br />
implementing institution (WVE) and the<br />
regional irrigation authority. The absence <strong>of</strong><br />
proper design document also resulted in<br />
creating problem to proper completion and<br />
handing over <strong>of</strong> the schemes to concerned<br />
stakeholder institutions. At this point, it is<br />
worth to mention that the main reason not to<br />
handover irrigation schemes built by WVE<br />
at Omosheleko wereda in Kembata zone is<br />
absence <strong>of</strong> proper design documents. The<br />
implementing institution may phase out<br />
from the area up on completion <strong>of</strong><br />
agreement period and if the schemes are not<br />
handed over to the stakeholders, they may<br />
totally abandon.<br />
It is clearly seen that the handing over<br />
problem largely results because <strong>of</strong> failure <strong>of</strong><br />
concerned institutions to discharge their due<br />
responsibilities.<br />
Like wise, the cooperative promotion <strong>of</strong>fice<br />
as an institution at zone or wereda level has<br />
a responsibility to properly organize the<br />
irrigation water users and follow up the<br />
collection <strong>of</strong> periodic contributions by users<br />
to conduct maintenance works and help<br />
sustain the project. However, almost in all<br />
the visited projects irrigation water users are<br />
just aware <strong>of</strong> this but have not yet started<br />
contributions.<br />
The institutional problem is also manifested<br />
by the absence <strong>of</strong> follow up during the<br />
operational phase <strong>of</strong> the implemented<br />
schemes. The performance evaluation <strong>of</strong><br />
irrigation projects built by NGOs is the duty<br />
<strong>of</strong> zonal disaster prevention and<br />
preparedness <strong>of</strong>fice and the woreda council.<br />
In addition to periodic reports given to these<br />
<strong>of</strong>fices, these government institutions should<br />
observe the field level situation <strong>of</strong> individual<br />
schemes and should try to curb problems<br />
prior to total failure <strong>of</strong> the projects.<br />
5.3 Social and Operational Problems<br />
The planning and institutional problems can<br />
also be reflected in the proper operation and<br />
utilization <strong>of</strong> the implemented schemes.<br />
Establishing WUA is a task to be carried out<br />
during the planning process or right at the<br />
beginning <strong>of</strong> implementation. This<br />
important activity is carried out by the<br />
implementing institution and the respective<br />
cooperative promotion <strong>of</strong>fice. Failure to<br />
establish legally instituted WUA and elect<br />
leaders results in problem <strong>of</strong> proper<br />
operation <strong>of</strong> schemes. Some older projects<br />
implemented by LWF & WVE can be cited<br />
as examples where strong WUA is not<br />
established. At such schemes, activities <strong>of</strong><br />
silt cleaning from main canal and minor<br />
maintenance on gates could not be carried<br />
out because <strong>of</strong> lack <strong>of</strong> community and<br />
resource mobilization in organized manner.<br />
In some projects like Jelaka, social problems<br />
like conflict were also observed due to water<br />
rights. In the following sections, the issue <strong>of</strong><br />
conflict is discussed in general and specific<br />
terms.<br />
Conflicts due to water rights are <strong>of</strong> two<br />
types:<br />
♦ Conflict among irrigators, which is not<br />
common in the region<br />
♦ Conflict among irrigators and up stream<br />
settlers or down stream settlers. The<br />
conflict with up stream settlers is mainly<br />
due to diversion <strong>of</strong> same river or<br />
tributary for other irrigation or some<br />
other purpose as seen at Jelaka scheme.<br />
The riparian law that says ’first come<br />
first served’ does not seem to work well<br />
in such conditions. The conflict with<br />
down stream settlers mainly occurs<br />
during low flow seasons when irrigators<br />
completely divert the stream flow to<br />
fields. This case is observed in Ufute<br />
scheme.<br />
The issue <strong>of</strong> downstream water rights is<br />
something that should be discussed in detail<br />
during the feasibility study and failure <strong>of</strong><br />
doing these results in creating operation and<br />
utilization problems discussed above.<br />
5.4 Economic Problems<br />
Most users <strong>of</strong> visited irrigation schemes in<br />
the region are characterized by low income<br />
condition at household level. Users are<br />
usually heard <strong>of</strong> complaining against the<br />
55
high rates <strong>of</strong> costs <strong>of</strong> production inputs such<br />
as fertilizers and seeds. As indicated in the<br />
table below, 25 schemes <strong>of</strong> the 26<br />
considered in the analysis generate no<br />
resource to help sustainability <strong>of</strong> schemes by<br />
conducting minor maintenance and<br />
rehabilitation activities. The reason for this<br />
is partly economic problem. However, this<br />
does not mean that irrigation schemes are<br />
not changing the life <strong>of</strong> beneficiary<br />
households. As an example, in cash crop<br />
producing areas <strong>of</strong> the region such as<br />
Sidama, users are observed to fetch<br />
considerable amount <strong>of</strong> money. During<br />
interview with beneficiaries <strong>of</strong> kedoboga<br />
irrigation scheme, it was revealed that an<br />
individual is earning up to Birr 2000 per<br />
quarter <strong>of</strong> a hectare <strong>of</strong> land per one season<br />
<strong>of</strong> cash crop.<br />
Generally speaking, the country’s food<br />
situation is characterized by food insecurity<br />
at both micro and macro levels. The major<br />
area <strong>of</strong> concern is the availability <strong>of</strong> food at<br />
household level. The country is even not<br />
able to produce most <strong>of</strong> its food<br />
requirements in normal years.<br />
Ethiopia's national target is to achieve food<br />
security both at national and household<br />
levels. To achieve this, specific programmes<br />
are needed to address the two sides <strong>of</strong> the<br />
food security equation: availability <strong>of</strong> food<br />
through increased production and storage,<br />
and access to food through family<br />
production, purchasing on the market and<br />
through effective food transfer programme.<br />
Small scale irrigation can lead to availability<br />
<strong>of</strong> food at household level through increased<br />
productivity, stable production and hence<br />
increases income leading to alleviation <strong>of</strong><br />
economic problems at household level. It<br />
also appears that development <strong>of</strong> small scale<br />
irrigation schemes helps the country attain<br />
food self sufficiency at national level<br />
6. Inventory and GIS based database<br />
building<br />
Regional level inventory has been made to<br />
collect the information on existing schemes.<br />
The information is collected from field<br />
survey & study and design reports and other<br />
reports concerning the topic. All the<br />
information pertaining to the irrigation<br />
projects are inserted in spreadsheet as<br />
dBASE and then attached to regional maps<br />
using Arc-View GIS [Fig-8 below].<br />
The most important advantage <strong>of</strong> the<br />
digitized maps is that they can be used as<br />
tools to store and retrieve information in<br />
Arc-View GIS windows. Information <strong>of</strong> an<br />
individual scheme can be easily accessed by<br />
clicking on the point theme representing the<br />
scheme. Like wise, any additional<br />
information can be stored in the<br />
spreadsheets attached with the point themes.<br />
Fig-8 Distribution <strong>of</strong> irrigation schemes and drainage basin<br />
56
7. Overall Conclusion<br />
In the past, a considerable effort has been<br />
exerted by government and various agencies<br />
to promote irrigation development in the<br />
south region. However, what this research<br />
has revealed is that a considerable number <strong>of</strong><br />
schemes (18%) have already totally failed<br />
because <strong>of</strong> the various problems discussed in<br />
the preceding sections & a significant<br />
number are performing below their capacity.<br />
Accordingly, the government and various<br />
other agencies involved in the subject need<br />
to revise the approach towards irrigation<br />
development by:<br />
♦ Integrating local research with modern<br />
irrigation development by creating<br />
mutual relationship between research<br />
and irrigation development<br />
♦ Promoting irrigation development<br />
activities based on local knowledge and<br />
community participation<br />
♦ Building the capacity <strong>of</strong> the technical<br />
personnel involved in the subject so that<br />
better skills can be gained in planning,<br />
design and implementation <strong>of</strong> projects<br />
♦ Integrating s<strong>of</strong>tware and hardware<br />
aspects <strong>of</strong> irrigation schemes rather than<br />
focusing largely on design and<br />
construction alone as hardware<br />
components<br />
Failure to consider these elements may result<br />
in subsequent failure <strong>of</strong> other schemes.<br />
References<br />
Arora, K.R. (1996) Irrigation <strong>Water</strong> Power<br />
and <strong>Water</strong> Resources Engineering.<br />
Standard Publishers and Distributors,<br />
Delhi<br />
Arved J. Raudkivi (1993) Exclusion and<br />
Removal <strong>of</strong> Sedimentation fromDiverted<br />
<strong>Water</strong>, Volume 6. A.A Balkema<br />
Publishers, USA<br />
Asfaw Afera (2004) Appraisal <strong>of</strong> Current<br />
Design Practices <strong>of</strong> River Diversion<br />
Structures in the Amhara Region. Addis<br />
Ababa<br />
Asit K., Biswas (1997) <strong>Water</strong> Resources:<br />
Environmental Planning, <strong>Management</strong><br />
and Development. Mc Graw Hill,<br />
Newyork<br />
Chow, V.T. (1959) Open channel hydraulics.<br />
McGraw Hill<br />
Daniel P., Jery R. and Douglas A. (1981)<br />
<strong>Water</strong> Resource Systems Planning and<br />
Analysis. Prentice Hall Inc. Englewood<br />
cliff, New Jersey<br />
Ethiopian Valley Development Studies<br />
Authority (1990) Preliminary <strong>Water</strong><br />
Resource Development Master Plan for<br />
Ethiopia. Volume 2, <strong>Water</strong> and Power<br />
Consultancy Services, Addis Ababa<br />
Garg, S.K. (1989) Irrigation engineering and<br />
Hydraulic structures. Khanna Publishers<br />
Delhi<br />
Henry, M. and James, M.W. (1980) Applied<br />
Hydraulics in Engineering.<br />
Hartmut K (1995) <strong>Water</strong> <strong>Management</strong>, Use<br />
and Conflict in Small ScaleIrrigation.<br />
Nairobi, Kenya<br />
IWMI (2004) Experiences and Opportunities<br />
for Promoting Small Scale Irrigation and<br />
Rain <strong>Water</strong> Harvesting for Food Security<br />
in Ethiopia. Addis Ababa<br />
Kinori, B.Z and Mevorach, J. (1984) Manual<br />
<strong>of</strong> Surface Drainage Engineering.<br />
Volume2, Elsevier edition, Amsterdam<br />
Novak P., M<strong>of</strong>fat B., Nalluri C. and<br />
Narayanan R. (2001) Hydraulic<br />
Structures. Third Edition, SPON PRESS,<br />
London and Newyork<br />
Nagar A.L, Das R.K. (1997) Basic Statistics.<br />
Third Edition, Oxford University Press,<br />
Delhi<br />
Punmia B.C, Pande B.B. Lal (1992)<br />
Irrigation and <strong>Water</strong> Power Engineering<br />
Mehra <strong>of</strong>fset press, New Delhi<br />
Rozgar, B. (1995) Design <strong>of</strong> Diversion<br />
Weirs. John Wiley and Sons, England<br />
Ramachandra Rao A. and Khaled, H. (2000)<br />
Flood Frequency Analysis. CRC Press,<br />
Newyork<br />
Co-SAERSAR (2000) Headwork, Main<br />
canal and Reservoir Pond Design Report<br />
for Lasho Small Scale Irrigation Project.<br />
Awassa<br />
Co-SAERSAR (1998) A Review on<br />
Irrigation Performance. Awassa<br />
Co-SAERSAR (2000) Maintenances and<br />
Rehabilitation Strategies forSmall Scale<br />
Irrigation Projects. Awassa<br />
Co- SAERSAR (1996) Study Report and<br />
Design <strong>of</strong> Diversion Weir for Eballa<br />
Small Scale Irrigation Scheme. Awassa<br />
Co-SAERASAR (2004) Inventory report<br />
on the status <strong>of</strong> 24 irrigationSchemes.<br />
Awassa<br />
Co-SAERAR (1998) Design Report <strong>of</strong> Lamo<br />
Small Scale Irrigation Project. Awassa<br />
WVE-Shone ADP (2001) Study and Design<br />
Report <strong>of</strong> Lenda IrrigationScheme.<br />
Hosaina<br />
57
Across System Comparative Assessment <strong>of</strong> irrigation performance <strong>of</strong><br />
community managed scheme in Southern Ethiopia<br />
Belete Bantero 1 , Mekonen Ayana 2 and Seleshi Bekele 3<br />
1 UNIDO,<br />
2 AMU and<br />
3 IWMI-NBEA<br />
bele2080@yahoo.com<br />
Abstract<br />
The water users located at the upstream <strong>of</strong><br />
the irrigation system have more access to<br />
water than those located at the downstream<br />
<strong>of</strong> the system. Moreover, the irrigation<br />
activity <strong>of</strong> tail-enders is seriously affected in<br />
both water scarce and water abundant<br />
periods due to under and over irrigation<br />
respectively. Not only water but also the<br />
situation <strong>of</strong> landholding affects the<br />
productivity and income <strong>of</strong> the farming<br />
community. The goal <strong>of</strong> this study was to<br />
assess the spatial variation <strong>of</strong> irrigation<br />
performance and to evaluate its effects in<br />
terms <strong>of</strong> performance <strong>of</strong> agricultural<br />
production (intensification and<br />
productivity), income and resources base as<br />
well as the environment. Across-system<br />
performance assessment study sponsored by<br />
<strong>International</strong> <strong>Water</strong> <strong>Management</strong> <strong>Institute</strong><br />
(IWMI) was done on the basis <strong>of</strong> simple<br />
illustration <strong>of</strong> the approach followed for the<br />
assessment and different levels <strong>of</strong> water<br />
accessibility along the canal reaches. The<br />
level <strong>of</strong> availability <strong>of</strong> irrigation water or<br />
accessibility to the farm is affected by the<br />
proximity <strong>of</strong> the farm to the water source or<br />
to the water carrying canals. The study<br />
confirmed that as one gets away from both<br />
the water source and the canal the<br />
accessibility <strong>of</strong> water becomes less and less,<br />
unless proper system for water allocation is<br />
in place and practiced. In view <strong>of</strong> that, six<br />
zones can be differentiated based on the<br />
condition <strong>of</strong> water accessibility. These are<br />
highly accessible, moderately accessible,<br />
less accessible, very less accessible, poorly<br />
accessible and water scarce zones.<br />
Sometimes the tail-end, which is<br />
characterized by water scarce zone, is also<br />
found to be affected by water logging.<br />
Since, available water and demand for water<br />
are not continuously monitored and<br />
managed, the situation outlined paves the<br />
path for potential conflicts among water<br />
users in response to visible livelihood<br />
differences. Despite disruption <strong>of</strong><br />
downstream users from irrigating their field,<br />
significant loss <strong>of</strong> scarce resource by the<br />
upstream users have resulted in detectable<br />
environmental threat such as water logging,<br />
sodicity (10.44meq/l, k (H.C.) 0.00279cm/hr<br />
) and salinity problems in the area.<br />
1. Introduction<br />
There is a common perception that water<br />
users located at the upstream <strong>of</strong> the<br />
irrigation system have more access to water<br />
than those located at the downstream <strong>of</strong> the<br />
system. Moreover, the irrigation activity <strong>of</strong><br />
tail-enders is seriously affected in both water<br />
scarce and water abundant periods due to<br />
under and over irrigation respectively. In<br />
Hare irrigation scheme there are three<br />
diversion sites very close to each other<br />
which are planned to serve a wide range <strong>of</strong><br />
users. Before the establishment <strong>of</strong> the<br />
scheme, only limited numbers <strong>of</strong> farmers<br />
which are close to the water source were<br />
using traditional methods to irrigate their<br />
59
lands. It is common that after the<br />
establishment <strong>of</strong> irrigation scheme the<br />
number <strong>of</strong> population in the command area<br />
increases through migration <strong>of</strong> peoples from<br />
elsewhere. Intended is to get the benefit <strong>of</strong><br />
irrigation that the early settlers are enjoying.<br />
Land acquisition <strong>of</strong> new comers is most<br />
likely possible at downstream <strong>of</strong> the canal<br />
reaches in the system. Not only these late<br />
settlers will become the victims <strong>of</strong> water<br />
shortage but also the whole irrigation system<br />
will get under pressure because initially<br />
designed capacity may not met the increased<br />
demand through time. Unless the available<br />
water and demand for water are<br />
continuously monitored and managed, the<br />
situation outlined above could be one <strong>of</strong> the<br />
potential causes <strong>of</strong> conflict among water<br />
users.<br />
There are complaints among four involved<br />
Kebeles regarding unequal distribution <strong>of</strong><br />
water among the users in the scheme.<br />
Especially, during dry seasons Kolla Shara<br />
Kebele which is served by the upstream<br />
diversion structure is diverting water<br />
without considering the share <strong>of</strong> three other<br />
Kebeles (Chano Dorga, Chano Chalba and<br />
Chano Mile) that are feed by the rest two<br />
downstream diversions. There are visible<br />
livelihood differences among the<br />
beneficiaries <strong>of</strong> the scheme. On the other<br />
hand there are poor and food selfinsufficient<br />
households living in the system.<br />
Not only water but also the situation <strong>of</strong><br />
landholding affects the productivity and<br />
income <strong>of</strong> the farming community. Provided<br />
that water is sufficiently available, the direct<br />
benefits <strong>of</strong> irrigation, in terms <strong>of</strong> increased<br />
farm output, will tend to accrue in<br />
proportion to the size <strong>of</strong> landholdings, with<br />
large holders benefiting more than<br />
smallholders, and smallholders benefiting<br />
more than the landless.<br />
The objective <strong>of</strong> this study was to assess the<br />
spatial variation <strong>of</strong> irrigation performance in<br />
Hare community managed irrigation scheme<br />
in southern region <strong>of</strong> Ethiopia. The specific<br />
objectives are:<br />
o to assess the water distribution<br />
performance <strong>of</strong> the scheme<br />
<strong>Table</strong> 1: Mean monthly values <strong>of</strong> hydro-meteorological parameters<br />
o<br />
to evaluate the effect <strong>of</strong> being at the<br />
upstream, midstream or downstream<br />
regions <strong>of</strong> irrigation canal system in<br />
terms <strong>of</strong> performance <strong>of</strong> agricultural<br />
production (intensification and<br />
productivity), income and resources<br />
base<br />
2. Description <strong>of</strong> the irrigation scheme<br />
2.1. Hydrometeorology <strong>of</strong> the area<br />
The climate <strong>of</strong> the area is characterized by<br />
mean maximum and minimum temperature<br />
<strong>of</strong> 30.3 and 17.4 0 C respectively, annual<br />
rainfall <strong>of</strong> 843mm and potential<br />
evapotranspiration <strong>of</strong> about 1644mm. Mean<br />
monthly distribution <strong>of</strong> these parameters are<br />
shown in <strong>Table</strong> 1. The rainfall distribution<br />
pattern is bimodal with first and maximum<br />
peak in April to March and second peak in<br />
October. The area is characterized by high<br />
potential evapotranspiration rate that ranges<br />
from 112mm in July to 180mm in March.<br />
Consequently, except in April and May, the<br />
evaporative demand <strong>of</strong> the area is greater<br />
than the amount <strong>of</strong> natural rain. This means<br />
that there is a negative climatic water<br />
balance in the area. This calls for<br />
supplementary water application to the crop<br />
fields through irrigation to sustain crop<br />
production. The warmest months <strong>of</strong> the year<br />
are February and March while the coldest<br />
are November and December.<br />
The maximum flow hydrograph <strong>of</strong> Hare<br />
River which is the source <strong>of</strong> water for the<br />
scheme shows also two distinct peaks that<br />
occur in May (5.60m 3 / s ) and October<br />
(4.53m 3 /s ). The low flow hydrograph<br />
between the two peak rainfall periods, i.e.<br />
from May to October, is almost consistent<br />
ranging from 1.26 to 1.62m 3/ s. The low flow<br />
declines during the months from December<br />
to April.<br />
60
Rainfall PET Temperature ( 0 C ) Hare River Flow (m 3 /s)<br />
(mm) (mm) Maximum Minimum Maximum Low flow<br />
January 28.1 139.5 31.7 16.3 1.31 0.69<br />
February 27.9 140.0 32.9 17.1 1.49 0.64<br />
March 64.0 179.8 33.0 18.3 1.95 0.63<br />
April 144.1 141.0 30.8 18.2 4.06 0.85<br />
May 140.5 136.4 28.9 17.9 5.59 1.33<br />
June 63.1 120.0 28.1 17.9 3.79 1.25<br />
July 43.4 111.6 27.7 17.9 3.81 1.26<br />
August 53.2 124.0 28.5 18.0 3.54 1.31<br />
September 78.1 135.0 30.1 17.8 4.26 1.33<br />
October 110.6 136.4 29.8 17.7 4.53 1.62<br />
November 59.3 138.0 30.6 16.0 2.65 1.16<br />
December 31.1 142.6 31.1 15.7 2.13 0.93<br />
Total/Mean 843.2 1644.3 30.3 17.4 3.26 1.09<br />
To see the relationship between demand and<br />
available water two scenarios have been<br />
considered; (i) with 75% dependable<br />
diversion and (ii) with 100% diversion <strong>of</strong><br />
the available water. The results are<br />
presented in Fig.1. In both scenarios the<br />
available water cannot meet the water<br />
demand for irrigation during seven<br />
consecutive months <strong>of</strong> the year viz. from<br />
late September to March. Feedback from the<br />
users also revealed that these identified<br />
periods to be water scarce times. Total<br />
diversions <strong>of</strong> water from the river course to<br />
the canals have been observed in the months<br />
<strong>of</strong> December and January. The available<br />
water in these months can only irrigate an<br />
area which is 24% <strong>of</strong> actually irrigable land<br />
(2224 ha). As the river pass through<br />
diversified bushes to end in Abaya Lake<br />
which is located downstream <strong>of</strong> the scheme<br />
(Fig. 2), its total diversion will likely have<br />
negative effects on these ecosystems. The<br />
water balance (water supply minus demand)<br />
is positive from April to August.<br />
Fig. 1: Mean decade water balance (water<br />
demand minus available water from the<br />
source) from September to August.<br />
2.2. Background <strong>of</strong> Hare irrigation<br />
scheme<br />
2.2.1 Irrigation Scheme<br />
Hare irrigation scheme encompasses three<br />
diversion systems the upstream diversion<br />
with control gate, the midstream traditional<br />
diversion and downstream diversion weir.<br />
These diversion points are respectively<br />
designated as D1, D2 and D3 (Fig. 1).<br />
The upstream and midstream diversions and<br />
<strong>Water</strong> balance (liter/s)<br />
3000<br />
2000<br />
1000<br />
0<br />
-1000<br />
-2000<br />
-3000<br />
I-S<br />
II-S<br />
III-S<br />
I-O<br />
II-O<br />
III-O<br />
I-N<br />
II-N<br />
III-N<br />
I-D<br />
II-D<br />
III-D<br />
I- J<br />
II- J<br />
III-J<br />
I-F<br />
II-F<br />
III-F<br />
I-M<br />
II-M<br />
III-M<br />
I-A<br />
II-A<br />
III-A<br />
I-M<br />
II-M<br />
III-M<br />
I- J<br />
II- J<br />
III-J<br />
I- J<br />
II-J<br />
III-J<br />
I-A<br />
II-A<br />
III-A<br />
Growing season<br />
75% Diversion <strong>of</strong> available water 100% Diversion <strong>of</strong> available water<br />
61
their delivery systems were established in<br />
the year 1993 while the downstream<br />
diversion weir was implemented in 1996. It<br />
was meant to serve four villages which are<br />
locally called “Kebele”, viz. Kola Shara,<br />
Chano Dorga, Chano Chelba and Chano<br />
Mille. Fig. 2 shows the diversion points and<br />
the canal systems delivering water to the<br />
respective Kebeles.<br />
Fig. 2: Layout <strong>of</strong> Hare Irrigation Scheme<br />
The upstream diversion (D1) <strong>of</strong> water is<br />
accomplished by simple concrete intake<br />
structure. The earthen unlined canal is<br />
receiving water from the intake structure to<br />
irrigate Kolla Shara command area. The<br />
6km long main canal was initially<br />
trapezoidal in shape and now it is irregular.<br />
The canals pass through villages and are<br />
subjected to damages by human and animals<br />
which resulted in bank breaks, overtopping,<br />
weed growth, accumulation <strong>of</strong> silt and<br />
wastes in the canals.<br />
Downstream <strong>of</strong> D1 is D2 the point at which<br />
traditional diversion <strong>of</strong> water is practiced.<br />
That means there is no headwork and water<br />
diversion is accomplished by a simple open<br />
cut in to the river bank which is supported<br />
by diagonally arranged temporary barrier<br />
(stones, plant rests) and act as divide wall.<br />
Unlined earthen canal which is running on<br />
the left bank <strong>of</strong> the river takes water from<br />
this diversion point to irrigate Chano Dorga<br />
area. The main canal runs over 7.1 km<br />
distance and has got irregular shapes. In<br />
some areas the canal bed has developed to<br />
gorges while in other locations shallow<br />
depth and wide surface areas are the<br />
characteristics <strong>of</strong> the canal. There is not as<br />
such well designed secondary canal. Hence<br />
field channels arranged by the community<br />
take <strong>of</strong> water which is directly used to<br />
62
irrigate the corresponding fields. There are<br />
about more than 60 major outlet points<br />
along the main canal. Since there is not<br />
control structure at the head some farm<br />
fields are affected by flood during rainy<br />
seasons.<br />
Downstream <strong>of</strong> the above mentioned intake<br />
points (D2) there is a diversion weir (at D3)<br />
to convey water it to a partially masonry<br />
type lined main canal. The structure was<br />
provided with a flow control mechanism<br />
though its performance has deteriorated<br />
from time to time. The weir and its delivery<br />
infrastructure were constructed by technical<br />
and financial support <strong>of</strong> Chinese<br />
government. It was planned to serve large<br />
portion <strong>of</strong> Chano Mille and some part <strong>of</strong><br />
Chano Chalba irrigable areas. The<br />
construction <strong>of</strong> the weir was started without<br />
feasibility study and awareness <strong>of</strong> the users.<br />
Hence it was accompanied by complaints<br />
from the users and even from local and<br />
regional authorities. The reasons were luck<br />
<strong>of</strong> awareness, imbalanced weir location, and<br />
demand for small dam that could ensure the<br />
balance between water supply and demand<br />
over the growing season. During<br />
construction phase the communities have<br />
realized that the implementation <strong>of</strong> the<br />
system will bring about the dissections <strong>of</strong><br />
their farming field for delivery systems and<br />
for the access roads etc. and became more<br />
reluctant. In spite <strong>of</strong> these resistances the<br />
Chinese contractors have implemented the<br />
diversion weir.<br />
While the construction work was under final<br />
phase, some parts had started to give partial<br />
services but the discontented farmers partly<br />
started destroying the irrigation channels,<br />
particularly plowing over the secondary and<br />
tertiary canal systems and dismantling <strong>of</strong> the<br />
structures. But gradually the community<br />
realized that they have made a lot <strong>of</strong><br />
mistakes during construction while they<br />
have observed a lot <strong>of</strong> positive impacts in<br />
their life due to the intervention.<br />
Particularly, the primary user <strong>of</strong> this weir,<br />
Chano Chalba, is the leading Kebele with<br />
respect to their production competence as<br />
well as the significant change in their<br />
standard <strong>of</strong> living.<br />
Those who complained and protected the<br />
irrigation canal from reaching their field at<br />
that time are now the one who are straggling<br />
to bring the water to their field are still<br />
relatively poorer.<br />
The main canal taking <strong>of</strong> water from the<br />
weir is <strong>of</strong> two types. A certain length is<br />
masonry rectangular canal and the major<br />
portion <strong>of</strong> the main canal is trapezoidal<br />
pitching. The other irrigation infrastructures<br />
such as the turn outs, the division boxes, the<br />
road crossings, the drops, the head and cross<br />
regulators are all constructed with masonry<br />
and reinforced concrete, all are lined and<br />
plastered except in some area pointing work.<br />
The main canal has got a length <strong>of</strong> 5.33 km.<br />
There are 7 secondary canals which when<br />
totally summed have got a length <strong>of</strong> 12.95<br />
km. The longitudinal slope <strong>of</strong> the canal<br />
alignment is 0.1 % which was ensured<br />
through 13 drops.<br />
Group <strong>of</strong> farmers take water from secondary<br />
canals to their field plots through the outlet<br />
structures prepared for same purpose. The<br />
excess water from the canals and from the<br />
run<strong>of</strong>f joins the main drainage system. Part<br />
<strong>of</strong> the drainage water joins the Hare River<br />
and the remaining flows in to Lake Abaya. It<br />
is only the main drainage canal which is<br />
functional at present and serves to remove<br />
immense amount <strong>of</strong> excess water at the<br />
down stream section <strong>of</strong> the irrigation<br />
scheme.<br />
As far as water allocation is concerned there<br />
is a water users committee (WUC) which is<br />
responsible for fair distribution <strong>of</strong> water<br />
among the users. WUC also organizes<br />
maintenance activities. Whenever irrigation<br />
is required, each water users group submit<br />
request for water to the WUC. Once the<br />
request is made to the WUC, then this<br />
committee prepares a tentative time<br />
schedule up on which irrigation can be<br />
made.<br />
63
2.2.2 Socioeconomics<br />
Prior to construction <strong>of</strong> irrigation scheme in<br />
the area local farmers used to irrigate their<br />
lands on their own traditional ways. This<br />
accounts to only some 300 hectares. After<br />
the implementation <strong>of</strong> first and second phase<br />
construction in 1993 1996 respectively more<br />
than 1031 ha and 1336 ha <strong>of</strong> land have been<br />
developed. The number <strong>of</strong> beneficiaries has<br />
also increased from time to time.<br />
The principal crops grown in the command<br />
area are banana, maize, mango, avocado,<br />
sweet potato and also cotton. Those farmers<br />
who have better access to water have<br />
preference <strong>of</strong> growing banana mainly due to<br />
its marketability on central market. As it is<br />
suitable for fruits trees the area is known for<br />
the provision <strong>of</strong> fruits such as mango,<br />
avocado, papaya to the central market.<br />
Farmers grow crops such maize and sweet<br />
potato for own consumption. Cotton is an<br />
alternative crop for tail-enders as it<br />
withstands water stress conditions.<br />
<strong>Table</strong> 2: Demographic feature <strong>of</strong> Hare irrigation scheme<br />
Name <strong>of</strong> Villages<br />
Number <strong>of</strong> Households<br />
Number <strong>of</strong> Population<br />
Male Female Total Male Female Total<br />
Kola Shara 800 164 964 2358 2474 4832<br />
Chano Dorga 413 20 433 1403 1363 2766<br />
Chano Chalba 751 175 926 2339 2713 5052<br />
Chano Mile 821 102 923 3950 3074 7024<br />
Total 2785 461 3246 10050 9624 19,674<br />
As per the information in 2006 the total<br />
number <strong>of</strong> beneficiary households is about<br />
3246 out <strong>of</strong> which 14% are female headed.<br />
The relative proportion <strong>of</strong> female and male<br />
<strong>of</strong> the total population in the command area<br />
is almost equal. More female households<br />
are found in the command areas <strong>of</strong> upstream<br />
and modern diversion canals viz. in Kola<br />
Shara and Chano Chalba commands. The<br />
number <strong>of</strong> households is almost equally<br />
distributed in the three <strong>of</strong> the Kebeles except<br />
in Chano Dorga which has the least number<br />
<strong>of</strong> households (Tab. 2).<br />
<strong>Table</strong> 3 shows the land use patterns <strong>of</strong> the<br />
command area. From the total irrigable area<br />
<strong>of</strong> 2224ha in the scheme the highest<br />
proportion is in Chano Mille (32.2%)<br />
followed by Chano Chalba (29.2%), Kola<br />
Shara (27.7%) and Chano Dorga (10.9%).<br />
64
<strong>Table</strong> 3: Land use patterns in the command area<br />
Type <strong>of</strong> land use<br />
Kola Chano Chano Chao Total<br />
Shara Dorga Chalba Mille<br />
Total area, ha 800 745 799 900 3244<br />
Cropped area (annual), ha 251 282 199 496 1228<br />
Cropped area (perennial), ha 391 120 450 400 1361<br />
Total cropped area, ha 642 402 649 716 2409<br />
Irrigable area at the moment, ha 617 242 649 716 2224<br />
Irrigated area at the moment, ha 617 242 649 454 1962<br />
Area occupied by infrastructures, ha 100 43 90 164 489<br />
Forest area, ha 20 200 40 10 270<br />
Grassland, ha 38 100 20 10 188<br />
Average landholding, ha 0.97 1.50 1.50 1.25 1.42<br />
Except in Chano Dorga Kebele, the largest<br />
proportion <strong>of</strong> cropped area is covered by<br />
Perennial crops such as Banana and other<br />
fruit trees. Irrigable areas in the first three<br />
Kebeles have already been developed under<br />
irrigation. However in Chano Mille which is<br />
relatively far from the headwork, the<br />
irrigated area is only 63% <strong>of</strong> irrigable land.<br />
2. Methodology<br />
Like other schemes in the country, there is<br />
no any kind <strong>of</strong> record available in Hare<br />
community managed irrigation scheme.<br />
Hence, useful information for the execution<br />
<strong>of</strong> this study was generated through<br />
measurements, observations and interviews.<br />
Discussions have been held with water<br />
development committee, community elder<br />
groups Kebele administration member,<br />
development agent/extension agent, farmers,<br />
female headed households etc. The scheme<br />
has been frequently visited to examine the<br />
operations, the conditions and functions <strong>of</strong><br />
irrigation systems, agronomic practices <strong>of</strong><br />
farmers, cropping patterns etc. These visits<br />
were conducted with the accompany <strong>of</strong><br />
different water users and operators group,<br />
viz. water development committee members,<br />
administrators, local elders, model farmers,<br />
male and female farmers. An attempt was<br />
made to understand the system and collect<br />
data necessary to measure the performance<br />
indicators.<br />
The main canal and the secondary canal,<br />
tertiary canals and field canals including the<br />
drainage lines <strong>of</strong> all the three schemes have<br />
been inspected. The capacities <strong>of</strong> the canal<br />
systems have been measured at different<br />
reaches.<br />
More than 800 GPS points has been taken<br />
for evaluating the scheme performance with<br />
respect to its proximity to the watercourse<br />
and main canal reach.<br />
Measurements <strong>of</strong> flows in the canals have<br />
been conducted after the canals are<br />
maintained, i.e. after the removal <strong>of</strong><br />
sediments, weeds and other barriers in the<br />
canals. Since this study was conducted<br />
during the out set <strong>of</strong> the rainy season right<br />
after they maintained the canal section to<br />
start irrigation, while they were not yet<br />
opened their many illegal outlets particularly<br />
the canal <strong>of</strong> traditional diversion to Chano<br />
Dorg. Accordingly, the measurements for<br />
this diversion have been only taken along<br />
the canal at 5 points (300, 1804, 3802, 5390<br />
& 6730 m). Then again, for the other two<br />
diversions, measurements have been taken<br />
safely in both directions along the canal and<br />
laterally at several points. For instance, for<br />
the u/s diversion, Kola Shara along the canal<br />
at 370, 1600, 3290, 4190 & 4889 m<br />
positions, while for modern diversion 334,<br />
1100, 2230, 2810, 3860, 4030, 5560 &<br />
5890m. For the lateral flow performance<br />
investigation, the traditional diversion was<br />
not considered as it has no as such properly<br />
managed or working secondary canals.<br />
Thus, the other two diversions lateral canal<br />
performance was evaluated in two<br />
categories that is comparison between the<br />
secondary lined canal and the secondary<br />
earthen canal <strong>of</strong> the Modern versus the<br />
65
secondary earthen canal <strong>of</strong> the Modern Cum<br />
Traditional.<br />
It is common to measure the discharge at<br />
the intake and the application point to<br />
estimate the losses. Even though such<br />
method is capable <strong>of</strong> giving the general<br />
nature <strong>of</strong> the water conveying structures<br />
performance, by this study we assumed such<br />
methods are really less important as it hardly<br />
locate the apparent position <strong>of</strong> the<br />
significant loss. In contrast the method we<br />
applied here, measuring within short interval<br />
and projecting the loss per unit length found<br />
to be a relevant technique to get the desired<br />
result. Accordingly by linking the actual<br />
efficiency and the distance from the intake<br />
point the linear correlation coefficients have<br />
been obtained.<br />
Across-system performance assessment was<br />
done on the basis <strong>of</strong> illustration given in<br />
figures 3 and 4. The level <strong>of</strong> irrigation water<br />
availability or accessibility to the farm is<br />
affected by the proximity <strong>of</strong> the farm to the<br />
water source or to the water carrying canals.<br />
As one gets away from both the water<br />
source and the canal the accessibility <strong>of</strong><br />
water becomes less and less unless proper<br />
system for water allocation is in place and<br />
practiced. According to figure 4, seven<br />
zones can be differentiated based on the<br />
condition <strong>of</strong> water accessibility. These are<br />
highly accessible zone, moderately<br />
accessible, less accessible, very less<br />
accessible, poorly accessible and water<br />
scarce area. Some times the tail-end which<br />
is characterized by water scarce zone can<br />
also be affected by water logging.<br />
Distance from MC (m)<br />
4000<br />
3500<br />
3000<br />
2500<br />
2000<br />
1500<br />
1000<br />
500<br />
<strong>Water</strong> source (0)<br />
500<br />
1000<br />
1500<br />
2000<br />
2500<br />
3000<br />
3500<br />
4000<br />
SC - 1<br />
Turnout<br />
Distance along MC from <strong>Water</strong> Source (km)<br />
0.5 1.0 1.5 2.0 2.5 3.0 3.5 4.0 4.5 5.0 5.5 6.0 6.5 7.0<br />
SC - 2<br />
Fig. 3: Simple illustration <strong>of</strong> the approach followed for the assessment<br />
All relevant data were collected along main<br />
canal (MS) and secondary canals (SC) that<br />
are functional during the season.<br />
Accessibility <strong>of</strong> water to a farm unit which<br />
is measured in amount and timely delivery is<br />
defined in this case with respect to<br />
proximity to water source that decreases<br />
from the head to tail end <strong>of</strong> the canal<br />
systems. The assessment was carried out<br />
following two directions (Fig. 3), i.e., (i)<br />
66
along the main canal that receives water<br />
from the main source and (ii) along<br />
secondary canals that take<strong>of</strong>f from the main<br />
canal. The hypothesis here is that the<br />
secondary canal 1 (SC-1) have more access<br />
to water than secondary canal 2 (SC-2) due<br />
to its relative closeness to the water source<br />
along the main canal. Likewise there are<br />
differences along the secondary canal itself<br />
as one goes from head to tail.<br />
<strong>Table</strong> 3: Summary <strong>of</strong> information in Fig. 4<br />
Zones<br />
Distance ranges (m) along<br />
<strong>Water</strong> accessibility<br />
Main canal<br />
Secondary canal<br />
1 0 - 500 0 - 250 high<br />
2 500-1000 500-750 moderate<br />
3 1000-1500 570-1000 less<br />
4 1500-2000 1000-1250 Very less<br />
5 2000-2500 1250-1500 Poorly accessible<br />
6 2500-3000 1500-1750 <strong>Water</strong> scarce<br />
Areas that fall in the regions <strong>of</strong> poorly<br />
available and water scarce zone are<br />
characterized by critically limited water<br />
availability and hence depend more on<br />
rainfall. <strong>Water</strong> logged areas are located at<br />
end <strong>of</strong> the systems. The owners <strong>of</strong> such<br />
lands are suffering from shortage <strong>of</strong> water<br />
during irrigation and flooding during <strong>of</strong>firrigation<br />
periods. These areas are covered<br />
by cotton which is relatively water stress<br />
resistant compared to common crops grown<br />
in the area.<br />
Fig. 4: Simple illustration for different levels <strong>of</strong> water accessibility along the canal reaches<br />
67
4. Results and Discussions<br />
4.1. General Practices<br />
One <strong>of</strong> the most important problems that<br />
exist in and around the small- and mediumscale<br />
irrigation schemes in the country is<br />
discrepancies between design specifications<br />
<strong>of</strong> the systems and expectations from the<br />
same. No reference is usually made, if at all<br />
available, to the design documents while<br />
operating and managing the schemes.<br />
With increasing number <strong>of</strong> population the<br />
size <strong>of</strong> the landholdings in an area becomes<br />
smaller and smaller. This is exactly what is<br />
observed around successful irrigation<br />
schemes. The main advantages <strong>of</strong> irrigation<br />
practice lay on provision <strong>of</strong> opportunity for<br />
intensification <strong>of</strong> cropping. Under<br />
decreasing size <strong>of</strong> landholdings in irrigated<br />
agriculture, intensification <strong>of</strong> cropping<br />
coupled with productivity improvement is<br />
the way to enhance food production. No<br />
doubt that better access to inputs and<br />
technologies contribute to improvement <strong>of</strong><br />
productivity. Intensification <strong>of</strong> cropping is<br />
mainly determined by the type <strong>of</strong> crops<br />
selected and availability <strong>of</strong> water.<br />
Cropping Intensity (ha/yr)<br />
12<br />
10<br />
8<br />
6<br />
4<br />
2<br />
0<br />
Kola Shara<br />
Chano Dorga<br />
Chano Chalba<br />
SC-1 SC-2<br />
SC-3<br />
SC-4<br />
Distance along SC (km)<br />
Distance along MC (km)<br />
0-0.50<br />
0.5-1.0<br />
1.0-1.5<br />
1.5-2.0<br />
0-0.50<br />
0.5-1.0<br />
1.0-1.5<br />
1.5-2.0<br />
0-0.50<br />
0.5-1.0<br />
1.0-1.5<br />
1.5-2.0<br />
0-0.50<br />
0.5-1.0<br />
1.0-1.5<br />
1.5-2.0<br />
0-1.5 1.5-3.0 3.0-4.0 4.0-6.0<br />
Fig. 4.1: Cropping intensity along the canal reaches (the product <strong>of</strong> average area cultivated per<br />
season and frequency <strong>of</strong> harvest per season)<br />
Figure 4.1 shows the spatial variation <strong>of</strong><br />
mean cropping intensity that was practiced<br />
by one household. It is evident that the<br />
intensity <strong>of</strong> cropping decreases along the<br />
main canals from upstream to downstream<br />
incase <strong>of</strong> communities in Kola Shara and<br />
Chano Dorga which are served by the<br />
upstream and midstream diversions<br />
respectively. On the contrary, there is slight<br />
decreasing trend <strong>of</strong> intensity as one goes<br />
down along the secondary canals. Under<br />
Chano Chalba condition, the trend <strong>of</strong> the<br />
curve coincides with the previous two up to<br />
a certain distance beyond which rapid raise<br />
is taking place. Farmers located here, i.e., 4<br />
– 6 km away from the diversion point along<br />
this canal, are practicing higher crop<br />
intensification compared to those located in<br />
the middle and head regions <strong>of</strong> the canal.<br />
These framers are trying to convert the<br />
challenges <strong>of</strong> flooding and shallow<br />
groundwater depths in the tail regions <strong>of</strong> the<br />
canals to opportunities in that they are<br />
68
adopting multi-cropping system or intercropping.<br />
140<br />
Irrigation Interval (days)<br />
120<br />
100<br />
80<br />
60<br />
40<br />
20<br />
0<br />
Kola Shara<br />
Chano Dorga<br />
Chano Chalba<br />
SC-1 SC-2 SC-3 SC-4<br />
Distance along SC (km)<br />
0-0.50<br />
0.5-1.0<br />
1.0-1.5<br />
1.5-2.0<br />
0-0.50<br />
0.5-1.0<br />
1.0-1.5<br />
1.5-2.0<br />
0-0.50<br />
0.5-1.0<br />
1.0-1.5<br />
1.5-2.0<br />
0-0.50<br />
0.5-1.0<br />
1.0-1.5<br />
1.5-2.0<br />
Distance along MC (km)<br />
0-1.5 1.5-3.0 3.0-4.0 4.0-6.0<br />
Fig. 4.2: Irrigation Interval (days the users have to wait until the arrival <strong>of</strong> the next irrigation<br />
water)<br />
As can be viewed from Fig. 4.2 the<br />
frequency <strong>of</strong> getting water by the users<br />
decreases from head to tail-ends <strong>of</strong> all canal<br />
systems. It varies from 7 – 30 days, from 7 –<br />
90 days and from 15 – 120 days in Chao<br />
Dorga, Chano Chalba and Kola Chara<br />
respectively. Irrespective <strong>of</strong> the location <strong>of</strong><br />
diversion point with respect to each other,<br />
those users close to water source get<br />
frequent access to water. The communities<br />
using traditional diversion get frequently<br />
water compared to Kola Shara and Chano<br />
Chalba that use respectively simple<br />
diversion structure and diversion weir.<br />
4.2. <strong>Water</strong> delivery performance<br />
The values <strong>of</strong> some performance indicators<br />
are given in the table 4.1. As far as most <strong>of</strong><br />
these indicators are concerned, Chano Dorga<br />
which is served by traditional diversion (D2)<br />
is found to perform better than others. The<br />
productivity <strong>of</strong> land and water is higher in<br />
Kola Shara followed by Chano Dorga. The<br />
later is characterized by greater values <strong>of</strong><br />
water supply performance indicators, i.e.<br />
RIS, RWS and WDR.<br />
<strong>Table</strong> 4.1: Values performance indicators<br />
Performance Indicators Kola Shara Chano<br />
Dorga<br />
Chano<br />
Chelba<br />
Output per water consumed (birr/m 3 ) 0.56 0.44 0.35<br />
Output per cropped area (birr/ha) 4400 3464 2736<br />
<strong>Water</strong> delivery ratio (WDR) 0.56 1.09 0.71<br />
Relative irrigation supply (RIS) 1.40 2.70 1.78<br />
Relative water supply (RWS) 1.18 1.79 1.36<br />
69
Community in Kola Shara, Chano Dorga<br />
and Chano Chalba are served by the<br />
upstream, midstream and downstream<br />
diversions respectively.<br />
4.3. Output performance<br />
According to figure 4.3 the productivity <strong>of</strong><br />
banana decreases from upstream to<br />
midstream rapidly in Kola Shara and Chano<br />
Dorga command areas. From midstream to<br />
downstream no decreasing trend both along<br />
main canal and secondary canals rather<br />
variation among the canals in terms <strong>of</strong><br />
productivity is visible. The lower areas <strong>of</strong><br />
tail ends are usually characterized by<br />
shallow groundwater tables (o.6 – 2m below<br />
the surface) which are likely to contribute to<br />
the water requirements <strong>of</strong> perennial crops.<br />
Banana yield (qt/ha)<br />
100<br />
90<br />
80<br />
70<br />
60<br />
50<br />
40<br />
30<br />
20<br />
Kola Shara<br />
Chano Dorga<br />
Chano Chalba<br />
10<br />
0<br />
Distance along SC (km)<br />
Distance along MC (km)<br />
0-0.50<br />
0.5-1.0<br />
SC-1 SC-2<br />
SC-3<br />
SC-4<br />
1.0-1.5<br />
1.5-2.0<br />
0-0.50<br />
0.5-1.0<br />
1.0-1.5<br />
1.5-2.0<br />
0-0.50<br />
0.5-1.0<br />
1.0-1.5<br />
1.5-2.0<br />
0-0.50<br />
0.5-1.0<br />
1.0-1.5<br />
0-1.5 1.5-3.0 3.0-4.0 4.0-6.0<br />
1.5-2.0<br />
Fig. 4.3: Productivity variation <strong>of</strong> banana along the canal reaches<br />
70
100<br />
90<br />
Yield performance (%)<br />
80<br />
70<br />
60<br />
50<br />
40<br />
30<br />
20<br />
Kola Shara<br />
Chano Dorga<br />
Chano Chalba<br />
10<br />
0<br />
SC-1<br />
SC-2<br />
SC-3<br />
SC-4<br />
Distance along SC (km)<br />
Distance along SC (km)<br />
0-0.50<br />
0.5-1.0<br />
1.0-1.5<br />
1.5-2.0<br />
0-0.50<br />
0.5-1.0<br />
1.0-1.5<br />
1.5-2.0<br />
0-0.50<br />
0.5-1.0<br />
1.0-1.5<br />
1.5-2.0<br />
0-0.50<br />
0.5-1.0<br />
1.0-1.5<br />
1.5-2.0<br />
0-1.5 1.5-3.0 3.0-4.0 4.0-6.0<br />
Fig. 4.4: Yield performance (actual yield/potential yield) irrigation along the canal reaches<br />
Yield performance which is the ratio <strong>of</strong><br />
actually harvested yield to potentially<br />
harvestable yield <strong>of</strong> crop varieties can be an<br />
indication for how agronomic practices and<br />
other inputs (water and agrochemicals) were<br />
effective to exploit the yielding potentials <strong>of</strong><br />
the crops selected. The indicator shows also<br />
a decreasing tendency towards midstream.<br />
Almost equal yield performance is observed<br />
in Chao Dorga which is located in the<br />
command area <strong>of</strong> traditional diversion. It<br />
shows more variation between upstream,<br />
midstream and downstream in Chano<br />
Chalba that is found in command area <strong>of</strong><br />
modern weir diversion. Except Chano<br />
Chelba the yield performance <strong>of</strong> the other<br />
villages is the reflection <strong>of</strong> irrigation<br />
intervals (Fig. 4.2). Those villages that have<br />
got water in shorter intervals have registered<br />
better yield performed than villages with<br />
longer irrigation intervals.<br />
71
Annual income <strong>of</strong> a HH (birr)<br />
80000<br />
70000<br />
60000<br />
50000<br />
40000<br />
30000<br />
20000<br />
10000<br />
0<br />
Kola Shara<br />
Chano Dorga<br />
Chano Chalba<br />
Distance along SC (km)<br />
Distance along SC (km)<br />
0-0.50<br />
0.5-1.0<br />
1.0-1.5<br />
1.5-2.0<br />
0-0.50<br />
0.5-1.0<br />
1.0-1.5<br />
1.5-2.0<br />
0-0.50<br />
0.5-1.0<br />
1.0-1.5<br />
1.5-2.0<br />
0-0.50<br />
0.5-1.0<br />
1.0-1.5<br />
1.5-2.0<br />
0-1.5 1.5-3.0 3.0-4.0 4.0-6.0<br />
Fig. 4.5: Average annual income <strong>of</strong> Household along the canal reaches<br />
The ultimate goal <strong>of</strong> irrigation development<br />
is to improve the livelihood <strong>of</strong> the farming<br />
community. Its achievement is largely<br />
depends on integration and coordinated<br />
operation <strong>of</strong> nested systems <strong>of</strong> irrigation<br />
which was indicated by Small and Svendsen<br />
(1992). As the production increases the<br />
income <strong>of</strong> the farmers is likely to increase.<br />
Other factors such marketability <strong>of</strong> the<br />
produce and market access influences the<br />
total income <strong>of</strong> the households. The annual<br />
income <strong>of</strong> households which have year<br />
round access to water be it from canal or<br />
groundwater is greater than farmers with<br />
limited access to water (Fig. 4.5). Annual<br />
income <strong>of</strong> households in Kola Shara and<br />
Chano Dorga command areas is variable<br />
irrespective <strong>of</strong> proximity to the canal. Most<br />
<strong>of</strong>ten, resources are efficiently and<br />
effectively utilized when they become<br />
scarce. Similarly households that have less<br />
access to water tend to use it more<br />
efficiently than those having access to<br />
abundant water resources.<br />
72
160000<br />
140000<br />
Resources base (birr)<br />
120000<br />
100000<br />
80000<br />
60000<br />
40000<br />
20000<br />
0<br />
0 10000 20000 30000 40000 50000 60000 70000 80000<br />
Annual income (Birr)<br />
Kola Shara Chano Dorga Chano Chalba<br />
Fig. 4.6: Relationship between annual income from agricultural production and resources base<br />
(monetary values <strong>of</strong> important possessions; example house, chattels etc.)<br />
Improved agricultural production coupled<br />
with remunerative selling <strong>of</strong> the production<br />
will result in improved income <strong>of</strong> the<br />
farming community. This together with<br />
better social facilities enhances the<br />
betterment <strong>of</strong> farmers’ welfare. Fig. 4.6<br />
shows how the resources base <strong>of</strong> a<br />
household improves with the level <strong>of</strong><br />
income. There are farmers who have<br />
managed to construct house in the nearby<br />
towns, buy taxis and small transporters etc.<br />
<strong>Table</strong>: Chemical properties <strong>of</strong> the soil <strong>of</strong> different Kebeles<br />
EC PH SAR ESR ESP (%) Texture K cm/hr<br />
(μmohs/cm) (meq/l) (meq/l) (meq/l)<br />
Kola<br />
Shara<br />
2060.8 8.35 10.44 5.87 85.44 Clay 0.00279<br />
Chano<br />
Dorga<br />
Chano<br />
Chalba<br />
Chano<br />
Mile(D)<br />
166.4 7.82 6.94 6.94 71.61 Sandy<br />
Clay<br />
Loam<br />
0.015<br />
147.2 7.69 5.3 1.63 61.94 Loam 0.0882<br />
170.24 7.47 0.5 0.49 32.7 Clay 0.00576<br />
73
4.5. Environmental Indicators<br />
From suitability aspect based on FAO frame<br />
work, the soil <strong>of</strong> Kola Shara with its SAR,<br />
10.44meq/l value and the soil <strong>of</strong> traditional<br />
irrigation users, SAR value <strong>of</strong> 8.84 both<br />
appear within 8 to 18meq/l hence<br />
characterized in moderately suitable range<br />
(i.e. class 2 level). However, along with its<br />
clayey nature and very small hydraulic<br />
conductivity value calculated, that is<br />
0.00279cm/hr, which is quite less than<br />
threshold level <strong>of</strong> 5cm/hr, hence the soil<br />
category as per critical limit for sodium<br />
tolerance could be n2 (that is permanently<br />
not suitable range). Nevertheless, salinity<br />
level (EC, 2060.8 μmohs/cm) that is<br />
sufficiently less than10, 000 μmohs/cm)<br />
preserved the area soil in the moderate<br />
suitability range. Still, the soil is categorized<br />
under good to injurious, suitable only<br />
permeable soils and moderate leaching<br />
coupled. The extent with in this range is<br />
harmful to more sensitive crops. This has<br />
been also confirmed from the actual survey<br />
done in the area; they grow mostly cotton<br />
which is salt tolerant crop. From acidity and<br />
alkalinity point <strong>of</strong> view also, the soil <strong>of</strong> Kola<br />
Shara is categorized under alkaline category<br />
as its pH value, 8.35 is greater than 8, which<br />
has a potential to cause depletion <strong>of</strong> the<br />
important micro nutrients such as iron,<br />
manganese, and zinc<br />
4.6. Social Problems<br />
Although there are <strong>of</strong>ficial rules and<br />
agreements that regulate water distribution<br />
among the users, there exist un<strong>of</strong>ficial<br />
diversions, unauthorized use <strong>of</strong> water,<br />
vandalism and stealing <strong>of</strong> water by the<br />
upstream user kebeles particularly by Kola<br />
Shara as the controlling mechanisms are the<br />
local river materials that can easily be<br />
subjected for deviation. Non-permanent<br />
control materials instead they use stones and<br />
plant rests, as they are easily shifted from<br />
their initial position (see figure 4.14) along<br />
with the absence <strong>of</strong> observers assigned to<br />
oversee the proper functioning <strong>of</strong> the<br />
delivery system aggravated the disruption <strong>of</strong><br />
the downstream users from irrigating their<br />
field. Such problem <strong>of</strong> unlawful diversion<br />
also exists by Chano Chalba KA, the one<br />
using the modern diversion, because <strong>of</strong> such<br />
gateway mentioned above the downstream<br />
users Chano Mile KA are highly disrupted to<br />
irrigate their field.<br />
74
Arrangements <strong>of</strong> Stone,<br />
gravels, plant rests to<br />
facilitate diversion <strong>of</strong><br />
water<br />
Diversion canal<br />
River Flow<br />
A<br />
Main River Course<br />
B<br />
C<br />
Fig. Simple illustration showing how farmers manipulate the arrangements <strong>of</strong><br />
traditional water diversions based on the conditions <strong>of</strong> water availability (with<br />
decreasing availability <strong>of</strong> water in the rivers and increasing demand for water the<br />
adopted diversion arrangement by farmers shift from A to B and to C<br />
75
5. Conclusion<br />
At Hare irrigation scheme, it has been<br />
identified that the availability <strong>of</strong> water, the<br />
poor water management and high demand<br />
are the main actors. From the water<br />
availability versus demand analysis<br />
undertaken within ten days interval for the<br />
whole year, out <strong>of</strong> P=38, f (D>Q, 0.00)= 20<br />
times, s (D
Analysis <strong>of</strong> irrigation systems using comparative performance indicators:<br />
A case study <strong>of</strong> two large scale irrigation systems in the upper Awash basin<br />
Abdu Beshir 1 and Sileshi Bekele 2<br />
1 Oromia <strong>Water</strong> Works Design and Supervision Enterprise, 2 IWMI-NBEA<br />
abdubeshir@yahoo.com<br />
Abstract<br />
This research was conducted to introduce the<br />
concept <strong>of</strong> evaluating the countries large scale<br />
irrigation systems and using the IWMI’s minimum<br />
set <strong>of</strong> indicators for the same purpose. This was<br />
done by selecting two irrigation systems in the<br />
Upper Awash Basin. NuraEra state and Wonji<br />
estate farm were selected for their relatively better<br />
organization and management, nearness to weather<br />
station and their representative nature <strong>of</strong> the large<br />
scale irrigation systems in the country.<br />
The necessary primary and secondary data to<br />
calculate the nine indicators were collected which<br />
are measurement <strong>of</strong> canal capacity and pump<br />
capacity, and total yields, farm gate prices <strong>of</strong><br />
irrigated crops, area irrigated per crop per season or<br />
per year, crop types, production per season or per<br />
year, incomes generated from water fee and<br />
cropping pattern.<br />
The indicators used are output per cropped area,<br />
output per command area, output per irrigation<br />
diverted, output per water consumed, relative water<br />
supply, relative irrigation supply, water delivery<br />
capacity, financial self sufficiency and gross return<br />
on investment.<br />
The result <strong>of</strong> the analysis shows that the ratio <strong>of</strong><br />
RWS, RIS and WDC for NuraEra are 4.8, 6.6 and<br />
1.4, for Wonji estate 1.36, 1.4 and 0.77<br />
respectively. The four agricultural indicators;<br />
output per cropped area, output per command,<br />
output per irrigation supply and output per water<br />
consumed are in the order <strong>of</strong> 21017.44, 23791.21,<br />
0.74 and 2.3 for NuraEra and 20074.97, 13916.03,<br />
1.4 and 1.2 for Wonji, respectively. .<br />
NuraEra spent 0.36 percent <strong>of</strong> its income in the<br />
year <strong>of</strong> analysis and that <strong>of</strong> Wonji is 0.17 percent<br />
for operation and maintenance <strong>of</strong> the delivery<br />
system. FSS was 100% for both <strong>of</strong> the farms. And<br />
gross return on investment was 84.7% for NuraEra<br />
and 76.8% for Wonji.<br />
Background<br />
Rapid increases in the world's population have<br />
made the efficient use <strong>of</strong> irrigation water vitally<br />
important, particularly in poorer countries, where<br />
the greatest potential for increasing food production<br />
and rural incomes is <strong>of</strong>ten to be found in irrigated<br />
areas. It has therefore become a matter <strong>of</strong> serious<br />
concern in recent years that, despite their very high<br />
costs, the performance <strong>of</strong> many irrigation schemes<br />
has fallen far short <strong>of</strong> expectations (FAO, 1986).<br />
The country’s irrigation efficiencies are generally<br />
low, <strong>of</strong> the order <strong>of</strong> 25 to 50%, and problems with<br />
rising water tables and soil salinisation are now<br />
emerging. As is usually the case, these problems<br />
only emerge some 10 to 15 years after project<br />
inception. More detailed information on the longterm<br />
operational behavior <strong>of</strong> the existing schemes<br />
<strong>of</strong>ten results in optimum design at the planning<br />
stage <strong>of</strong> the new schemes, leading to lower capital<br />
and lower overall costs, the avoidance <strong>of</strong> costly<br />
77
emedial works in the long term and achieving<br />
maximum returns on water (Woodro<strong>of</strong>e, 1993).<br />
State run farms, which include large-scale irrigation<br />
systems, were reiterated as major components <strong>of</strong><br />
efforts to develop the country’s agricultural sector,<br />
notably in the Awash Valley. However,<br />
productivity <strong>of</strong> these top–down managed systems<br />
over the decades has been disappointing—the farms<br />
have been beset by a number <strong>of</strong> environmental,<br />
technical and socio-economic constraints. The large<br />
scale systems in the Awash basin and elsewhere<br />
suffer from water management practices that have<br />
resulted in rising ground water tables and secondary<br />
soil salinisation where large tracts <strong>of</strong> land have<br />
gone out <strong>of</strong> production (EARO 2001; Paulos).<br />
Even if evaluating the existing irrigation systems is<br />
an old phenomenon in the other parts <strong>of</strong> the world;<br />
it has not been tried in Ethiopian large-scale farms.<br />
Hence, this study attempts to introduce the concept<br />
<strong>of</strong> comparative performance indicators as a tool to<br />
evaluate the performance <strong>of</strong> large-scale irrigations<br />
in the Upper Awash valley.<br />
The indicators<br />
consumption, where total consumption includes<br />
water depletion from the hydrologic cycle through<br />
process consumption (ET), other evaporative losses<br />
(from fallow land, free water surfaces, weeds,<br />
trees), flows to sinks (saline groundwater and seas),<br />
and through pollution.<br />
We are interested in the measurement <strong>of</strong> production<br />
from irrigated agriculture that can be used to<br />
compare across systems. If only one crop is<br />
considered, production could be compared in terms<br />
<strong>of</strong> mass. The difficulty arises when comparing<br />
different crops, say wheat and tomato, as 1 kg <strong>of</strong><br />
tomato is not readily comparable to 1 kg <strong>of</strong> wheat.<br />
When only one irrigation system is considered, or<br />
irrigation systems in a region where prices are<br />
similar, production can be measured as net value <strong>of</strong><br />
production and gross value <strong>of</strong> production using<br />
local values.<br />
Output per cropped area<br />
Pr oduction<br />
=<br />
Irrigated Cropped area<br />
(1)<br />
Nine indicators are developed related to the<br />
irrigation and irrigated agricultural system. The<br />
main output considered is crop production, while<br />
the major inputs are water, land, and finances.<br />
Indicators <strong>of</strong> Irrigated Agricultural Output<br />
The four basic comparative performance indicators<br />
relate output to unit land and water. These<br />
“external” indicators provide the basis for<br />
comparison <strong>of</strong> irrigated agriculture performance.<br />
Where water is a constraining resource, output per<br />
unit water may be more important, whereas if land<br />
is a constraint relative to water, output per unit land<br />
may be more important.<br />
Output per unit <strong>of</strong> irrigation water supplied and<br />
output per unit <strong>of</strong> water consumed are derived from<br />
a general water accounting framework (Molden et<br />
al, 1998). The water consumed in equation 4 on<br />
page 21 is the volume <strong>of</strong> process consumption, in<br />
this case evapotranspiration. It is important to<br />
distinguish this from another important water<br />
accounting indicator—output per unit total<br />
Output per unit command area<br />
Pr oduction<br />
=<br />
Command area<br />
Output per irrigation supply<br />
Pr oduction<br />
=<br />
Diverted irrigtion supply<br />
Output per unit water consumed<br />
Pr oduction<br />
=<br />
Volume <strong>of</strong> water consumed by ET<br />
Where,<br />
(2)<br />
(3)<br />
(4)<br />
78
Production is the output <strong>of</strong> the irrigated area<br />
in terms <strong>of</strong> gross or net value <strong>of</strong> production<br />
measured at local or world prices,<br />
Irrigated cropped area is the sum <strong>of</strong> the areas<br />
under crops during the time period <strong>of</strong><br />
analysis,<br />
Command area is the nominal or design area<br />
to be irrigated,<br />
Diverted irrigation supply is the volume <strong>of</strong><br />
surface irrigation water diverted to the<br />
command area, plus net removals from<br />
groundwater, and<br />
Volume <strong>of</strong> water consumed by ET is the<br />
actual evapotranspiration <strong>of</strong> crops.<br />
Five additional indicators were identified in this<br />
minimum set for comparative purposes. These are<br />
meant to characterize the individual system with<br />
respect to water supply and finances.<br />
Relative water supply and relative irrigation supply<br />
are used as the basic water supply indicators:<br />
Re lative water supply<br />
Total water supply<br />
=<br />
Crop demand<br />
Where:<br />
Total water supply<br />
(5)<br />
(6)<br />
= Surface diversions plus net ground water draft<br />
plus rainfall.<br />
Crop demand<br />
= Potential crop ET, or the ET under well-watered<br />
conditions.<br />
Irrigation supply<br />
= only the surface diversions and net groundwater<br />
draft for irrigation.<br />
Irrigation demand<br />
= the crop ET less effective rainfall.<br />
Relative irrigation supply is the inverse <strong>of</strong> the<br />
irrigation efficiency Molden et al (1998). The term<br />
relative irrigation supply was presented to be<br />
consistent with the term relative water supply, and<br />
to avoid any confusing value judgments inherent in<br />
the word efficiency.<br />
Both RWS and RIS relate supply to demand, and<br />
give some indication as the condition <strong>of</strong> water<br />
abundance or scarcity, and how tightly supply and<br />
demand are matched. Care must be taken in the<br />
interpretation <strong>of</strong> results: an irrigated area upstream<br />
in a river basin may divert much water to give<br />
adequate supply and ease management, with the<br />
excess water providing a source for downstream<br />
users. In such circumstances, a higher RWS in the<br />
upstream project may indicate appropriate use <strong>of</strong><br />
available water, and a lower RWS would actually<br />
be less desirable. Likewise, a value <strong>of</strong> 0.8 may not<br />
represent a problem; rather it may provide an<br />
indication that farmers are practicing deficit<br />
irrigation with a short water supply to maximize<br />
returns on water.<br />
<strong>Water</strong> delivery capacity(%)<br />
Canal capacity to deliver water at system head<br />
=<br />
Peak consumptive demand<br />
Where:<br />
Capacity to deliver water at the system head<br />
(7)<br />
= the present discharge capacity <strong>of</strong> the canal at the<br />
system head, and<br />
Peak consumptive demand<br />
= the peak crop irrigation requirements for a<br />
monthly period expressed as a flow rate at the<br />
head <strong>of</strong> the irrigation system.<br />
<strong>Water</strong> delivery capacity is meant to give an<br />
indication <strong>of</strong> the degree to which irrigation<br />
infrastructure is constraining cropping intensities by<br />
79
comparing the canal conveyance capacity to peak<br />
consumptive demands. Again, a lower or higher<br />
value may not be better, but needs to be interpreted<br />
in the context <strong>of</strong> the irrigation system, and in<br />
conjunction with the other indicators.<br />
Financial Indicators<br />
The two financial indicators are:<br />
Gross return on Investment (%)<br />
production<br />
=<br />
Cost <strong>of</strong> irrigation structure<br />
Where,<br />
(8)<br />
Financial self sufficiency<br />
Revenue<br />
from irrigation service fee<br />
=<br />
Total O & M expenditure<br />
(9)<br />
Cost <strong>of</strong> irrigation infrastructure considers the<br />
cost <strong>of</strong> the irrigation water delivery system<br />
referenced to the same year as the SGVP,<br />
Revenue from irrigation, is the revenue<br />
generated, either from fees, or other locally<br />
generated income, and<br />
Total O & M expenditure is the amount<br />
expended locally through operation and<br />
management<br />
Description <strong>of</strong> the Study Area<br />
The mean annual rainfall <strong>of</strong> Awash Basin varies<br />
from about 1600mm at Ankober; in the highlands<br />
north east <strong>of</strong> Addis Ababa top 160mm at Asayta on<br />
the northern limit <strong>of</strong> basin. Addis Ababa receives<br />
90% <strong>of</strong> its annual rainfall during the rainy period<br />
March to September. At Dubti the same over all<br />
proportion is received during the two rainy periods,<br />
distributed 30% and 60% respectively. The mean<br />
annual rainfall over the entire western catchment<br />
is 850mm and over the head waters <strong>of</strong> Awash, as<br />
gauged at Melka Hombole it is 1216mm.The<br />
annual and monthly rainfall are characterized by<br />
high variability (Halcrow, 1989).<br />
Wenji Estate farm<br />
The estate was constructed by HVA in the early<br />
1960s .It comprises 5925ha <strong>of</strong> sugar and is operated<br />
by the ESC (Halcrow, 1989). The estate is located<br />
in the central east part <strong>of</strong> the main Ethiopia rift<br />
system, 107 km southeast <strong>of</strong> Addis Ababa. It is<br />
found between 8 0 30’ to 8 0 35’N and 39 0 20’E grid<br />
and at an altitude <strong>of</strong> 1540 m a.s.l Average<br />
Maximum and Minimum temperature are 27.6 0 C<br />
and 15.30C, respectively. The surrounding<br />
topography is steep on all sides north and east being<br />
bound by river awash the west and the south by the<br />
border drain which protects the estate from the run<br />
<strong>of</strong>f and sedimentation from those steep slopes<br />
(Mukherji, 2000). Irrigation supplies are provided<br />
by continuous electrical pumping from the Awash<br />
into a settling basin at the head <strong>of</strong> the main canal.<br />
Night storage reservoirs cover a surface area <strong>of</strong><br />
60ha (Halcrow, 1989).<br />
80
Nuraera state farm<br />
The farm is found in the eastern showa<br />
administration zone. It is divided in three sub<br />
farms. From the total land owned by the farm<br />
which is 3,277ha, 3,069 ha is covered by crops the<br />
remaining 208 ha by infrastructures. The farm has<br />
been developed on an adhoc basis over several<br />
years and water abstraction is by gravity.<br />
Canals and irrigation layouts have not been<br />
formally designed so that their capacities are not<br />
listed.<br />
<strong>Water</strong> use efficiencies would appear to be in the<br />
range <strong>of</strong> 20%-30% (Halcrow, 1989). Irrigation <strong>of</strong><br />
citrus is generally by small basin around tree bases.<br />
Main gate on the main canal at Nuraera<br />
Diversion Weir at Nuraera<br />
Abstraction is measured by staff gauges in the main<br />
canal from gravity <strong>of</strong>ftakes irrigation is generally<br />
undertaken 24 hours a day. Wastage <strong>of</strong> water is<br />
inevitable but it appears that little, if any flow is<br />
returned to Awash. The northern end <strong>of</strong> the canal<br />
used to outfall into Lake Beseka. This has been<br />
stopped by a cut-<strong>of</strong>f-drain which is partly<br />
81
constructed with the objective <strong>of</strong> leading the flows<br />
back to Awash.<br />
Methodology<br />
After reconnaissance survey and consulting the<br />
<strong>of</strong>ficials <strong>of</strong> the Upper Awash agro-industry<br />
enterprise, one farm was selected among the three<br />
farms <strong>of</strong> the enterprise. NuraEra farm was selected<br />
for its nearness to the weather station, relatively<br />
better organization and management and<br />
availability <strong>of</strong> secondary data. Moreover the other<br />
two farms are medium scale farms.<br />
decided to measure the discharge at various gage<br />
heights and take the average discharge to calculate<br />
the amount diverted for each season.<br />
Maintaining the abandoned BOC took much <strong>of</strong> our<br />
time before engaging in the measurement.<br />
The other farm selected for its attributes <strong>of</strong> nearness<br />
to Addis Ababa and wheather station and the<br />
availability <strong>of</strong> data were Wonji sugare estate.<br />
Secondary data collections were started in February<br />
2005 in collaboration with the farm <strong>of</strong>ficials.<br />
Primary data collection<br />
The job <strong>of</strong> primary data collection which is<br />
measurement <strong>of</strong> canal capacity and pump capacity<br />
was started in April 2005 in collaboration with the<br />
department <strong>of</strong> hydrology in the Ministry <strong>of</strong> <strong>Water</strong><br />
Resources.<br />
The upper Awash <strong>Water</strong> Administration center<br />
installed a BOC on the main canal at around 200m<br />
from the diversion weir for the purpose <strong>of</strong> updating<br />
its rating curve for the reason that the flow<br />
characteristics changes due to high rate <strong>of</strong><br />
sedimentation resulting in change <strong>of</strong> canal<br />
morphology.<br />
Preparation for work at Nuraera<br />
In the case <strong>of</strong> Wonji showa estate farm, the pumps<br />
in the main pump station are more than 40 years<br />
old. Their Design capacity went on reducing<br />
through these years. Therefore the current capacity<br />
<strong>of</strong> each pump should be measured. That can be<br />
done either by measuring the water depth over the<br />
cippoleti weir and use the formula to calculate the<br />
discharge or by measuring the flow on site.<br />
The measurement was taken at 0.2*the depth <strong>of</strong><br />
water over the weir crest measured from the surface<br />
<strong>of</strong> the water and the width <strong>of</strong> the crest was divided<br />
by 0.2m interval( see appendix B).<br />
The plotted rating curve was used to find out the<br />
total water diverted using the daily records <strong>of</strong> the<br />
gauge height taken by main gate operator who is an<br />
employee <strong>of</strong> the center.<br />
But due to the shortage <strong>of</strong> material and manpower,<br />
the center has been using<br />
the old rating curve for the purpose <strong>of</strong> knowing the<br />
total amount <strong>of</strong> water diverted. Due to the high<br />
siltation rate and the changing nature <strong>of</strong> the<br />
hydraulic condition in the main canal , it will be<br />
hard to get a reliable data using a rating curve<br />
plotted two years ago. For this reason it was<br />
82
good number <strong>of</strong> years record <strong>of</strong> the production and<br />
prices<br />
<strong>of</strong> crops. For instance, wonji have a 50 year data <strong>of</strong><br />
production.<br />
The only problem in the case <strong>of</strong> the needed<br />
secondary data was the record <strong>of</strong> money spent for<br />
operation and maintenance <strong>of</strong> the irrigation systems<br />
Results and Discussion<br />
Measuring discharge from cippoleti weir at Wonji<br />
Secondary data collection<br />
The Secondary data included total yields, farm gate<br />
prices <strong>of</strong> irrigated crops, area irrigated per crop per<br />
season or per year, crop types, production per<br />
season or per year, incomes generated from water<br />
fee and cropping pattern.<br />
Climatic data <strong>of</strong> Wonji farm were collected from<br />
the nearby station at wonji while that <strong>of</strong> NuraEra<br />
were collected from the head <strong>of</strong>fice <strong>of</strong> Ethiopian<br />
National Meteorological Agency in Addis Ababa.<br />
Since both farms have a planning and program<br />
department run by skilled manpower, they kept<br />
Nuraera<br />
After measuring the discharge at various working<br />
gauge heights, the average discharge was estimated<br />
to be 3.1 m 3 /s. And this discharge was used to<br />
estimate the amount <strong>of</strong> water diverted in the year<br />
2003/04.<br />
Based on the collected data <strong>of</strong> planting and harvest<br />
<strong>of</strong> each crop for the year <strong>of</strong> analysis, the<br />
agricultural practice <strong>of</strong> the farm is divided into two<br />
seasons. The first season <strong>of</strong> cropping goes from<br />
January to July, the amount diverted in these<br />
months was.<br />
Season A 3.1*212*24*60*60 = 56,782,080 m 3<br />
Season B 3.1*153*24*60*60 = 40,979,520 m 3<br />
Total amount <strong>of</strong> water diverted for the year 2003/04<br />
= 97,761,600m 3<br />
Total output <strong>of</strong> NuraEra farm for the year 2003/04<br />
Crop<br />
Production in Unit price in Total Output<br />
Area (ha)<br />
Qt.<br />
birr/Qt. in Birr<br />
Orange 772 254,580.6 112 28,497,753.48<br />
Manderine 181 35,844 87.50 3,133,836.55<br />
Guava 55 1,307.2 32.20 42,038.27<br />
grape Vine 11.18 538.3 400 215,304.00<br />
Mango 40.35 9,395 117.75 1,106,250.65<br />
Tomato 224.53 35,115 40.60 1,424,968.73<br />
Onion 54.12 4,790 136.50 653,925.34<br />
Green chilies 5.30 182. 134.60 24,494.91<br />
Cabbage 0.55 23.6 40.60 959.31<br />
Carrot 0.30 22.2 40 889.64<br />
Beet root 0.45 36 40.00 1,444.40<br />
Beans(local) 2.00 1,463.8 61 89,323.52<br />
83
Bobbybeans(export) 149.50 6,221.8 1,383 8,604,265.49<br />
Okra 0.60 3 172 532.92<br />
Maize 350.00 17,002.6 120.20 2,043,368.86<br />
Pop corn 58.60 385.7 483.30 186,411.74<br />
Cotton 735.00 18,061.8 1,494.30 26,989,446.28<br />
Total 2,640.5 384,973 73,015,214<br />
As it is clearly seen the farm used wider cropping pattern. And based on the planting and harvesting dates <strong>of</strong><br />
each crop, the whole year is divided into two seasons and their CWR and irrigation requirement was calculated<br />
using CROPWAT 4.2. The result is as shown below:<br />
CWR and IR <strong>of</strong> each crop<br />
SEASON A<br />
SEASON B<br />
Crop water Net irrigation<br />
Crop water Net irrigation<br />
Crop Area(ha) requirement<br />
(mm/season)<br />
requirement<br />
(mm/season)<br />
Area(ha) requirement<br />
(mm/season)<br />
requirement<br />
(mm/season)<br />
Tomato 220.5 760.68 613.44 224.53 712.92 446.05<br />
Onion 47 490.79 389.56 54.12 489.76 243.78<br />
Vegetables 8.15 515.89 413.39 7 493.45 242.48<br />
Beans 150 427 330.55 151 424.51 178.94<br />
Maize 408.6 684.37 495.58 408.6 537.53 416.32<br />
Cotton 735 999.13 634.58<br />
Citrus* 1008 1334.31 873.46<br />
Mango* 40.35 1973.22 1512.36<br />
Grape<br />
wine*<br />
11.18 1057.43 596.58<br />
Total 2628.78 845.25<br />
* Perennial crops<br />
To calculate the first four indicators grose<br />
production was taken instead <strong>of</strong> SGVP because <strong>of</strong><br />
the fact that there is no price difference in the two<br />
irrigation systems and no common crop is grown in<br />
both the farms. Sugarcane is not grown in NuraEra<br />
farm but it is the only crop in Wonji sugar estate.<br />
1.<br />
=<br />
Output per croppedarea<br />
production<br />
Irrigatedcroppedarea<br />
= 73,015,214.08 / (2628.78+ 845.25)<br />
= 73,015,214.08 / 3474.03<br />
= 21,017.44 birr/ha<br />
2. Output per unit command<br />
production<br />
=<br />
Command cropped area<br />
Out put per unit command area<br />
= 73,015,214.08 / 3,069<br />
= 23,791.21 birr/ha<br />
3. Output per irrigation sup ply<br />
production<br />
=<br />
Diverted irrigation sup ply<br />
= 73,015,214.08 /97,761,600<br />
= 0.75 birr/m 3<br />
area<br />
84
Then, the net crop water requirement and the net<br />
irrigation requirement (IR) are computed for each<br />
irrigated crop and for each growing season (option<br />
2 in CROPWAT main menu). The crop coefficients<br />
provided with CROPWAT program are used (input:<br />
planting dates and growth length in days). The<br />
outcomes were:<br />
The total net crop demand for season A is (refer<br />
table 4.2):<br />
CWR tomato * (area tomato / area total ) + CWR onion *<br />
(area onion / area total ) + etc. =<br />
760.68* (220.5/2628.78) + 490.79* (47/2628.78) +<br />
515.89* (8.15/2628.78) + etc.<br />
= 1,030.70 mm/season<br />
In the same way, the total net irrigation<br />
requirements are computed. The efficiency used is<br />
40%. This percent was set basing the estimation <strong>of</strong><br />
Halcrow(1989) and allowing for the improvements<br />
<strong>of</strong> the years between the year <strong>of</strong> study and the year<br />
<strong>of</strong><br />
analysis.<br />
SEASON NCWR* NIR**<br />
A(Jan-July) 1,030.70 693.7<br />
B(Aug.-Jan) 560.5 369.3<br />
Total 1591.2 1063<br />
*Net crop water requirement<br />
**Net irrigation requirement<br />
Output per unit water consumed<br />
Pr oduction<br />
=<br />
Volume <strong>of</strong> water consumed by<br />
ET<br />
Where Volume <strong>of</strong> water consumed by ET is the actual evapotranspiration <strong>of</strong> crops.<br />
= 73,015,214.08 / (1,030.70*2628.78+ 560.5*845.25)*10 -3 *10 4<br />
= 2.3 birr/m3<br />
5. Relative water supply<br />
= (Irrigation derived + total precipitation) / CWR<br />
Diverted irrigation in mm<br />
Season A = 56,782,080 / 2628.78*10 = 2160 mm<br />
Season B = 41,247,360 /845.25*10 = 4879.9<br />
Total = 7039.9<br />
RWS = (7039.9+566.9)/1591.2<br />
= 4.8<br />
6. Relative irrigation supply<br />
= Irrigation applied / irrigation requirements<br />
= 7039.92/1063<br />
= 6.6<br />
The scheme irrigation requirement was calculated with CROPWAT (option 4 in main menu) using the climate<br />
data, cropping pattern, planting dates, and area.<br />
For 2003/04, the scheme irrigation requirements were:<br />
85
Scheme irrigation requirement <strong>of</strong> NuraEra farm<br />
Jan. Feb. March April May June Jul. Aug. Sept. Oct. Nov. Dec.<br />
IR in<br />
l/s/ha 0.37 0.39 0.69 1.13 1.2 0.77 0.75 0.73 1.47 1.4 1.17 0.59<br />
Peak irrigation requirements occur in September, 1.47 l/s/ha.<br />
Peak demand is 1.47 * cropped area for that month =1.47 *2639.78= 3880.48 l/s.<br />
As explained above the canal capacity was measured using bank operated cable. The result was 5.4 m 3 /s<br />
7. <strong>Water</strong> delivery capacity: 5,400 lit. / 3,880.48 lit. = 1.4 or 140%<br />
8. Gross return on investment =Production / cost <strong>of</strong><br />
irrigation infrastructure<br />
The cost <strong>of</strong> the distribution system can either be<br />
estimated from original costs, or estimated by using<br />
present costs <strong>of</strong> similar types <strong>of</strong> infrastructure<br />
development. Since it was not possible to get the<br />
design documents <strong>of</strong> the two projects, the document<br />
<strong>of</strong> other projects with more or less similar structural<br />
condition were taken. After studying the documents<br />
<strong>of</strong> the similar irrigation projects in Awash Basin,<br />
the Angelele and Bolhamo design document were<br />
used for their better similarity and nearness to<br />
NuraEra and Wonji to estimate the cost <strong>of</strong><br />
distribution system per hectare.<br />
All the delivery system <strong>of</strong> the NuraEra farm is earth<br />
canals .Therefore the cost <strong>of</strong> earth canals per<br />
hectare in these documents is found to be 1497.9 4<br />
birr<br />
The formula to calculate the present worth is.<br />
Pr esent Net Worth(<br />
PNW )<br />
= ( Initial cos t / ha)<br />
× (1 + r)<br />
n<br />
Where: r is interest rate, which is taken from the<br />
design document <strong>of</strong> Angelele Irrigation Project<br />
and n is years from construction time.<br />
PNW = 1497.94(1+0.1) 30<br />
= 26138.2birr/ha<br />
The cost <strong>of</strong> delivery system <strong>of</strong> NuraEra<br />
= 26138.2 birr/ha *3069 ha<br />
= 80,218,006 birr<br />
Therefore Gross return on investment<br />
= 73,015,214.08 birr/ 80,218,006birr<br />
= 91%<br />
9. Financial self-sufficiency<br />
= Revenue from irrigation/Total O&M expenditure<br />
Where, Revenue from irrigation, is the revenue<br />
generated, either from fees, or other locally<br />
generated income, and Total O&M expenditures are<br />
the amount expended locally through O&M plus<br />
outside subsidies from the government.<br />
Even if the Upper Awash <strong>Water</strong> Administration<br />
Center collects water fee at the rate <strong>of</strong> 3 birr per<br />
1000 m 3 <strong>of</strong> water, no money was spent for<br />
maintenance and operation in the year <strong>of</strong> analysis.<br />
Rather the farms perform some clearing and<br />
maintenance work whenever they feel necessary.<br />
Thus the income generated from the farms doesn’t<br />
go to the purpose <strong>of</strong> operation and maintenance.<br />
However the intent <strong>of</strong> IWMI indicator number 9 is<br />
to see how much <strong>of</strong> the cost <strong>of</strong> operation and<br />
maintenance work is generated locally. In this<br />
context we can say that both farms are 100 % self<br />
sufficient. It was learnt from the farm record that<br />
the amount <strong>of</strong> money spent for operation and<br />
maintenance <strong>of</strong> the delivery systems for the year<br />
2003/’04 was 260,317.23 birr.<br />
= 260,317.23/260,317.23<br />
= 100%<br />
In this respect, the management <strong>of</strong> these two farms<br />
is a little bit different to that <strong>of</strong> normally practiced.<br />
In order to have additional information for<br />
evaluating that part which is related to maintenance<br />
and operation, one more indicator is developed and<br />
86
added in this paper. This indicator atleast will give<br />
us additional insight on the relative focus given to<br />
the delivery systems.<br />
Percent<br />
Total<br />
=<br />
allocated to O & M<br />
O & M exp enditure<br />
Pr oduction<br />
= 260,317.23/ 73,015,214.08<br />
= 0.36 %<br />
Wonji Sugar estate<br />
The only crop grown in this farm is sugarcane. The<br />
kind <strong>of</strong> irrigation practiced at Wonji may be termed<br />
‘’blocked end furrow irrigation system’’. <strong>Water</strong><br />
Production and area <strong>of</strong> Wonji estate for the year 2003/04<br />
Command Irrigated<br />
Farm gate<br />
area(ha) area(ha) Production(qtl.) price(birr/qtl.) Income (birr)<br />
5,929 4,110 7,446,581 11.08 82,508,117.5<br />
applied each furrow is cut <strong>of</strong>f as it reaches the end<br />
<strong>of</strong> the furrow ,which is blocked ,and ponds up<br />
within the furrow .The furrow length for the part <strong>of</strong><br />
the field (anjir ) depends on the gradient available<br />
and three lengths 32m,48m,and 64m are being used<br />
currently. The advantages <strong>of</strong> this system are that<br />
there is no run <strong>of</strong>f and the entire water applied to<br />
the field incorporated into the soil. As such, in<br />
addition to the infiltration characteristics <strong>of</strong> the soil,<br />
the size <strong>of</strong> the inflow stream and the gradient <strong>of</strong> the<br />
furrow become important variables to control the<br />
rate <strong>of</strong> advance <strong>of</strong> water front to the end <strong>of</strong> the<br />
furrow, which determines the cut<strong>of</strong>f time for the<br />
inflow. (Mukherij, 2000)<br />
The main pump station at Wonji has a total <strong>of</strong> eight<br />
pumps with a design discharge <strong>of</strong><br />
(6*750+2*500)5500 lps .According to Mukherji the<br />
two vertical shaft pumps are working with overall<br />
efficiency <strong>of</strong> 68% and the other six horizontal shaft<br />
pumps with an efficiency <strong>of</strong> 50% <strong>of</strong> their designed<br />
capacity.<br />
Crop water Irrigation<br />
requirement<br />
mm/year<br />
requirement<br />
mm/year<br />
1,667.1 1,054.33<br />
The result <strong>of</strong> our measurement almost agrees with<br />
that <strong>of</strong> Mukherji, The current capacity <strong>of</strong> the two<br />
vertical shaft pumps is 240.3 lps and the horizontal<br />
shaft pumps are with a capacity <strong>of</strong> 488 lps.<br />
Therefore the maximum discharge that can be<br />
pumped for irrigation purpose is 3,165.34 lps<br />
allowing 10% for factory use.<br />
1. Out put per cropped area<br />
= Out put / irrigated cropped area<br />
= 82,508,117.48 / 4,110<br />
= 20,074.97 birr/ha<br />
2. Out put per command area<br />
= Out put / command area<br />
= 82,508,117.48/5929<br />
= 13,916.03 birr/ha<br />
3. Out put per irrigation supply<br />
= Out put / irrigation diverted<br />
= 82,508,117.48/75320000<br />
= 1.1 birr/m 3<br />
4. Out put per unit water consumed<br />
=out put/Volume water consumed by ET<br />
Volume <strong>of</strong> water consumed by ET<br />
= 1667.1*4110*10 m 3<br />
= 68,517,810 m 3<br />
Out put per unit <strong>of</strong> water consumed<br />
= 82,508,117.48/68,517,810<br />
= 1.2 birr/m 3<br />
5. Relative water supply<br />
= (Irrigation derived + total precipitation) /<br />
CWR<br />
= (1,466.08 + 817.3)/1667.1<br />
87
= 1.36<br />
6. Relative irrigation supply<br />
= Irrigation applied/ irrigation requirements<br />
= 1,466.08/1,054.33<br />
= 1.4<br />
For 2003/04, the scheme irrigation requirements were:<br />
IR in Jan. Feb. March April May June July Aug. Sept. Oct. Nov. Dec.<br />
l/s/ha 0.4 0.58 0.94 0.93 0.87 0.65 0.31 0.23 0.73 1 0.94 0.85<br />
Peak irrigation requirements occur in October, 1 l/s/ha.<br />
Peak demand is 1 * cropped area for that month = 1 * 4110 = 4110 l/s.<br />
7. <strong>Water</strong> delivery capacity: 3,165.34/4110<br />
= 0.77 or 77%<br />
8. The same procedure was applied to Wonji to<br />
calculate gross return on investment except that<br />
irrigation structure costs are included since all<br />
the necessary structures are found in Wonji<br />
estate farm. The present initial cost per hectare<br />
<strong>of</strong> the delivery system is found to be 26137.5<br />
birr.<br />
Gross return on investment<br />
= 82,508,117.5 birr / 235,727,927.5 birr<br />
= 35%<br />
Comparative analysis <strong>of</strong> the two irrigation systems<br />
The four basic comparative performance indicators<br />
relate output to unit land and water. These<br />
“external” indicators provide the basis for<br />
comparison <strong>of</strong> irrigated agriculture performance<br />
(Molden, 1998).<br />
The values <strong>of</strong> the four indicators for the respective<br />
farms are as tabulated below.<br />
9. Percent allocated to O&M<br />
= 139,330.46/ 82,508,117.48<br />
= 0.17%<br />
summary <strong>of</strong> the four indicators<br />
Site<br />
Output per<br />
Output per<br />
Output per<br />
Output per water<br />
cropped area,<br />
irrigation<br />
command, birr/ha<br />
birr /ha<br />
supply,birr/m 3 consumed birr/m 3<br />
NuraEra 21,017.44 23,791.21 0.75 2.3<br />
Wonji 20,074.97 13,916.03 1.4 1.2<br />
25,000.00<br />
20,000.00<br />
15,000.00<br />
10,000.00<br />
output per cropped and command area<br />
Output per irrigation supply and water consummed<br />
2.5<br />
2<br />
1.5<br />
1<br />
5,000.00<br />
0.5<br />
0.00<br />
Output per cropped<br />
area, birr/ha<br />
Output per command,<br />
0<br />
birr/ha NuraEra Wonji<br />
Output per irrigation<br />
supply,birr/m3<br />
Output per w ater<br />
consumed birr/m3<br />
88
As clearly seen in the first table and chart, NuraEra<br />
is higher in output per cropped area and output per<br />
command. This is attributed to the high value and<br />
export crops grown in the farm and also the higher<br />
cropping intensity.<br />
In the case <strong>of</strong> output per irrigation supply Wonji<br />
has the higher value (1.4) implying that Wonji is<br />
better in effective utilization <strong>of</strong> water. But as the<br />
indicators are comparative we can’t say that Wonji<br />
achieved the required performance. NuraEra show a<br />
generous supply <strong>of</strong> water. Using the rainfall in a<br />
better way than that <strong>of</strong> the NuraEra contributes for<br />
this higher value <strong>of</strong> output per irrigation in Wonji.<br />
In other words NuraEra is better in land<br />
productivity and Wonji show better performance in<br />
water productivity.<br />
Result <strong>of</strong> RWS and RIS<br />
Relative water Relative irrigation <strong>Water</strong><br />
Site supply supply<br />
capacity<br />
NuraEra 4.8 6.6 1.4<br />
Wonji 1.36 1.4 0.77<br />
delivery<br />
7<br />
6<br />
5<br />
4<br />
3<br />
2<br />
1<br />
0<br />
RWS,RIS and WDC<br />
RWS RIS WDC<br />
NuraEra<br />
Wonji<br />
89
Higher values <strong>of</strong> RWS and RIS indicate a<br />
more generous supply <strong>of</strong> water (Molden,<br />
1998). In our case, NuraEra show this fact<br />
which means productivity to land is more<br />
important. In the Wonji farm we have more<br />
constrained supply <strong>of</strong> water so that<br />
productivity per unit <strong>of</strong> water is more<br />
important. These two values can be minimized<br />
by adjusting the release <strong>of</strong> water from storage<br />
or diversion with the available rainfall.<br />
The lower values <strong>of</strong> RWS and RIS <strong>of</strong> Wonji<br />
estate farm is not mainly the result <strong>of</strong> good<br />
management rather the decreasing capacity <strong>of</strong><br />
the pumps limiting the supply. As the result <strong>of</strong><br />
the measurement conducted showed, 35 and 52<br />
percent decrease in the capacity <strong>of</strong> the<br />
horizontal and vertical pumps has been<br />
witnessed respectively. With this capacity,<br />
the pumps are not enough to satisfy peak<br />
irrigation demand. This will get worse unless a<br />
major rehabilitation work <strong>of</strong> the pump house is<br />
done.<br />
On the other hand high value <strong>of</strong> RWS and RIS<br />
is <strong>of</strong> for NuraEra. This result was expected by<br />
the researcher at the end <strong>of</strong> reconnaissance<br />
survey <strong>of</strong> the area because <strong>of</strong> two main<br />
reasons: one the 34 km main canal is not well<br />
maintained and the absence <strong>of</strong> the necessary<br />
irrigation structures in the line <strong>of</strong> the canal<br />
expose the system for very low efficiency,<br />
second the farmers around the state farm steal<br />
water from the main canal. Consequently much<br />
water is lost through its way to the field.<br />
Unauthorized diversion from the main canal<br />
at NuraEra<br />
A high value <strong>of</strong> financial self-sufficiency does<br />
not automatically indicate a sustainable system<br />
as the O&M expenditures might be too low to<br />
meet the actual maintenance needs (Molden,<br />
1998).Thus the high value <strong>of</strong> FSS <strong>of</strong> the two<br />
farms doesn’t show that the expenditure<br />
satisfies the operation and maintenance needs.<br />
Rather as Molden et al. (1989) explained<br />
financial self-sufficiency tells us what percent<br />
<strong>of</strong> expenditures on O&M is generated locally.<br />
If government subsidizes O&M heavily,<br />
financial self-sufficient would be low, whereas<br />
if local farmers through their fees pay for most<br />
<strong>of</strong> the O&M expenditures, financial selfsufficiency<br />
would be high.<br />
NuraEra and Wonji are 100% self sufficient<br />
meaning all the expenditures for operation and<br />
maintenance generated locally from the<br />
income <strong>of</strong> these two farms. Interms <strong>of</strong> percent<br />
allocated to operation and maintenance NurEra<br />
is better. This is because <strong>of</strong> high silt deposit<br />
rate in the delivery systems. With out frequent<br />
clearing <strong>of</strong> the system normal operation <strong>of</strong> the<br />
farm can’t be carried out.<br />
GRI <strong>of</strong> the NuraEra and Wonji are 84.7% and<br />
76.8% respectively. NuraEra show a higher<br />
rate <strong>of</strong> return. This is mainly because <strong>of</strong> the<br />
lower investment cost and higher productivity<br />
<strong>of</strong> the farm. But it is hard to say that this<br />
system is better than that <strong>of</strong> Wonji because it is<br />
taking much money for its maintenance.<br />
Consequently its sustainability is in big<br />
question <strong>of</strong> such systems<br />
Conclusion<br />
The higher values in RWS and RIS combined<br />
with the lower ratio <strong>of</strong> output per water<br />
consumed in NuraEra shows that the<br />
availability <strong>of</strong> water is not a problem. In<br />
addition it can be inferred that the issue <strong>of</strong><br />
water management is in jeopardy. The main<br />
reasons for this problem are the meager<br />
attention given by the farm for irrigation water<br />
management, the low water rate and the effect<br />
<strong>of</strong> unregistered users.<br />
As to Wonji farm the low value <strong>of</strong> WDC can<br />
be early warning indicator. This is meant to<br />
say that the pump capacity is deteriorating and<br />
is not in position to satisfy peak irrigation<br />
demand. This problem may manifest itself by<br />
reducing production in near future. This has<br />
big implication on the production <strong>of</strong> sugar.<br />
WDC <strong>of</strong> NuraEra farm seems in a better<br />
position but the increasing sedimentation and<br />
the absence <strong>of</strong> silt excluders put its<br />
sustainability in question.<br />
90
Both farms spent less than one percent <strong>of</strong> their<br />
income for operation and maintenance <strong>of</strong><br />
delivery systems. This by itself shows the very<br />
low attention given to the irrigation systems.<br />
But in relative terms NuraEra was better.<br />
The rate <strong>of</strong> gross return on investment is high<br />
for both <strong>of</strong> the farms.<br />
Furthermore, as explained in the literature<br />
review part, there are varies types <strong>of</strong><br />
institutional designs <strong>of</strong> the irrigation systems<br />
adopted in different part <strong>of</strong> the world. This part<br />
has not been given the proper attention in our<br />
country. As a result, the irrigation delivery<br />
systems are left unattended for many years.<br />
The case <strong>of</strong> the two irrigation systems is not an<br />
exception. The management <strong>of</strong> the farms,<br />
having their main objective on productivity,<br />
didn’t give the proper attention for their<br />
irrigation delivery systems. This can be seen<br />
by the fact that the two farms have no separate<br />
irrigation department despite being very<br />
pr<strong>of</strong>itable ones. Moreover no permanent<br />
budget is allocated for irrigation system<br />
maintenance.<br />
This research managed to show some <strong>of</strong> the<br />
problems that our large scale irrigation systems<br />
are in. The lack <strong>of</strong> awareness in the farm<br />
<strong>of</strong>ficials on one side and policy problem in the<br />
other left the irrigation systems with lots <strong>of</strong><br />
problems. <strong>Water</strong> logging, deterioration <strong>of</strong><br />
canal capacity and salinity are coming faster.<br />
References<br />
Admasu, (2002). Integrated water<br />
management and land management<br />
research and capacity building priorities for<br />
Ethiopia. Proceedings <strong>of</strong><br />
MoWR/EARO/IWMI. <strong>International</strong> <strong>Water</strong><br />
<strong>Management</strong> institute. Addis Ababa.<br />
Clarke D. 1998. CropWat for Windows: User<br />
Guide. Version 4.2. University <strong>of</strong><br />
Southampton, UK.<br />
Clyma, W., Latimon, D.L and Reddy, M.N.<br />
(1982). Irrigation water management<br />
around the world. Paper prepared for<br />
presentation at the ninth technical<br />
conference on irrigation, drainage and<br />
flood control. Jackson, Mississippi.<br />
Douglas L. V., Juan A. S. (1999). Transfer <strong>of</strong><br />
Irrigation <strong>Management</strong> Services.<br />
Guideline: Irrigation and Drainage Paper.<br />
No.58. FAO, Rome.<br />
Ethiopian Agricultural Research Organization<br />
(2001). Agricultural water management:<br />
Brief Pr<strong>of</strong>ile. (Unpublished document)<br />
Food and Agriculture Organization<br />
(1996).CROPWAT and CLIMWAT<br />
s<strong>of</strong>tware packages: Irrigation and drainage<br />
paper No 49.FAO, Rome.<br />
Food and Agriculture Organization<br />
(2002).Crops and Drops. FAO working<br />
paper, Rome.<br />
Food and Agriculture Organization (1989).<br />
Guidelines for designing and evaluating<br />
surface irrigation systems. FAO Irrigation<br />
and drainage paper no 45.Rome.<br />
Food and Agriculture (1986).Organization,<br />
operation and maintenance <strong>of</strong> irrigation<br />
schemes .FAO irrigation and drainage<br />
paper 40,Rome.<br />
Food and Agriculture (1999). Modern water<br />
control and management practices in<br />
irrigation. <strong>Water</strong> report 19, Rome<br />
Food and Agriculture (1998). Crop<br />
evapotrinspiration-guidelines for<br />
computing crop water requirements. FAO<br />
irrigation and drainage paper 56,Rome.<br />
Halcrow and Partners(1989).Master plan for<br />
the development <strong>of</strong> surface water resources<br />
in the Awash basin. Government <strong>of</strong><br />
Ethiopia, Addiss Ababa.<br />
Hunt, Robert C. 1988. Size and the<br />
structure <strong>of</strong> authority in canal irrigation<br />
systems. Journal <strong>of</strong> Anthropological<br />
Research 44:335–355.<br />
Majumdar,D.K.(2002).Irrigation water<br />
management .Prentice-Hall <strong>of</strong> India.New<br />
Delhi.<br />
Manz, David, H. (1992). Performance<br />
evaluation <strong>of</strong> irrigation conveyance<br />
systems using dynamic simulation models.<br />
Canada.<br />
Molden,D.J,Sakthivadivel,R,perry,C.J,andCha<br />
rlotte de Fraiture(1998). Indicators for<br />
comparing performance <strong>of</strong> irrigated<br />
Agricultural systems. Research report 20.<br />
<strong>International</strong> <strong>Water</strong> <strong>Management</strong> <strong>Institute</strong>.<br />
Sri Lanka. Mrema, G. C. (1984).<br />
Development <strong>of</strong> small-holder irrigation in<br />
Tanzania: Problems and prospects. In<br />
Proceedings <strong>of</strong> African Regional<br />
Symposium on Small Holder Irrigation, 5–<br />
7 September 1984, Harare, Zimbabwe.<br />
91
Mukherji, Jp. (2000). Rehablitation,<br />
Optimization, and expansion <strong>of</strong> Agriculture<br />
and Factory. Interim report. Vol. 1,<br />
Ethiopian Sugar Industry Sh.Co., Wonji-<br />
Shoa sugare Factory<br />
Mrray-Rust, D. H., and W. B. Snellen. (1993).<br />
Irrigation system performance assessment<br />
and diagnosis. (Jointly published by IIMI,<br />
ILRI, IHE), Colombo, Sri Lanka:<br />
<strong>International</strong> Irrigation <strong>Management</strong><br />
<strong>Institute</strong>.<br />
Oad, R., Mcorrik, P.G, and Clyma, W.<br />
(1988).Methodologies for interdisciplinary<br />
diagnosis <strong>of</strong> irrigation systems. Project<br />
report 93.Colorado state university,<br />
Colorado.<br />
Pery,C.,J.(2001). Charging for irrigation<br />
water: The issue and the options, with a<br />
case study from Iran. Research report<br />
52.<strong>International</strong> water management<br />
institute.Sri Lanka.<br />
Shanan, Leslie. (1992). Planning and<br />
management <strong>of</strong> irrigation systems in<br />
developing countries. Agricultural <strong>Water</strong><br />
<strong>Management</strong>. The Netherlands: Elsevier.<br />
Sharma, D.N, Ramchard Oad, and Sampath,<br />
R.k.(1991).Performance measures for<br />
irrigation water delivery systems.ICID<br />
Bulletine 40:21-37.<br />
Small, L. E., and M. Svendsen (1992). A<br />
framework for assessing irrigation<br />
performance. <strong>International</strong> Food Policy<br />
Research <strong>Institute</strong> Working Papers on<br />
Irrigation Performance No. 1.<br />
<strong>International</strong> Food Policy Research<br />
<strong>Institute</strong>. Washington, D. C.<br />
Withers, B.; and Vipond S. (1974). Design<br />
and practices. London: BT Batsford<br />
Limited.<br />
Woodro<strong>of</strong>e,R. (1993). Monitoring and<br />
evaluation <strong>of</strong> irrigation projects.<br />
Technical manual.Ministry <strong>of</strong> water<br />
resources. Addis Ababa<br />
WORLD BANK/UNDP (1990). A proposal<br />
for an internationally –supported program<br />
to enhance research on irrigation and<br />
drainage technology in developing<br />
countries. Irrigation and drainage volume1<br />
Yesuf, K. (2004). Assessment <strong>of</strong> small-scale<br />
irrigation using comparative performance<br />
indicators on two selected schemes in<br />
upper Awash river valley. A thesis<br />
submitted to the school <strong>of</strong> graduate studies.<br />
Alemaya University.<br />
92
Discussion on Theme 1: Status Quo Analysis, Characterization, and<br />
Assessment <strong>of</strong> Performance <strong>of</strong> Irrigation in Ethiopia<br />
Chair person: Dr. Deboorah Bossio<br />
Rapporture: Makonnen Loulseged<br />
The chairman for this session introduced the theme and the floor was opened for questions, comments<br />
and suggestions.<br />
Questions and Discussions<br />
Marginal environments are means <strong>of</strong> living<br />
for people who are habitats <strong>of</strong> the area. Unless<br />
there are other means <strong>of</strong> income we can not<br />
avoid (stop them) growing crops on marginal<br />
lands. The environment has not been benefited<br />
from technologies promoted under optimum<br />
conditions. Then, how can we say agriculture in<br />
marginal environment causes poverty?<br />
Ans: Marginal lands with steep slopes<br />
are being farmed, on the other hand<br />
there is plenty <strong>of</strong> irrigation potential in<br />
low land areas where communities can<br />
make use <strong>of</strong> it.<br />
The data base is organized for modern<br />
irrigation schemes. Do we have a plan to set up a<br />
data base for traditional irrigation schemes in<br />
Ethiopia? Please give attention in collecting GIS<br />
data for the traditional irrigation systems.<br />
Ans:IWMI is willing and interested to<br />
collaborate with other institutions in<br />
setting up the database for traditional<br />
irrigation.<br />
When we talk about challenges in irrigation<br />
schemes, the impact <strong>of</strong> land degradation is not<br />
captured in the study? Why irrigation projects<br />
only focuses on the dam and command area but<br />
not the upper catchment; so also the research<br />
results?<br />
Ans: There are many intrinsic problems<br />
associated with irrigation and drainage.<br />
In SNNP alone there are about<br />
seventeen schemes that have failed. In<br />
line with the policy statement, future<br />
irrigation development should be<br />
undertaken in an integrated manner in<br />
order to ensure its sustainability.<br />
Why the presenter did not see with respect<br />
to integrated watershed management.<br />
Ans: Irrigation schemes are operating<br />
within the environment <strong>of</strong> complex<br />
watershed activities. Sedimentation is<br />
the cause <strong>of</strong> failure in many schemes as<br />
a result <strong>of</strong> poor watershed management.<br />
Therefore, due attention should be given<br />
to sound watershed management<br />
practices.<br />
Do you have bench marks from other<br />
countries for your comparison <strong>of</strong> performances<br />
<strong>of</strong> irrigation schemes in Ethiopia?<br />
Ans: As the conditions <strong>of</strong> irrigation<br />
schemes are different it will be un fare<br />
to compare their performance with other<br />
countries; for example a scheme in<br />
Ethiopia bench marked with a scheme<br />
located somewhere in US. Instead we<br />
can bench mark better performing<br />
schemes with in the country. For<br />
example Methara under the same<br />
environment with other scheme located<br />
somewhere in Ethiopia<br />
The scope <strong>of</strong> irrigation development is<br />
beyond putting physical assets on the ground.<br />
This is about 25% <strong>of</strong> the tasks. The remaining<br />
75% covers a complex and wide range <strong>of</strong> tasks<br />
that we need to put in place and achieves<br />
production and income objectives. The<br />
experience in the last 2-3 decades shows<br />
irrigation schemes are not fully or properly<br />
93
utilized due to inadequate attention being given<br />
to skill in O&M, skill in irrigation water and<br />
irrigation extension, markets, credit services,<br />
input supply, institutional arrangement in<br />
managing schemes, catchment treatment, etc.<br />
These issues were discussed in the past.<br />
However, policy makers and practitioners are<br />
not responsive to these complex issues. Now<br />
thanks to researchers (IWMI) and others that we<br />
have good evidence to feed into an informed<br />
decision to focus on the issues beyond<br />
construction. Future success in irrigation<br />
development will depends on willingness to<br />
draw lessons from our experiences and<br />
proactively engage in rectifying the issues<br />
mentioned above.<br />
Ans: Acceptable suggestion<br />
Attempt has been made to compare Melka<br />
Sedi irrigation scheme with Sile and perhaps<br />
with others. Because <strong>of</strong> differences in Climatic<br />
factors (rainfall, etc), soil salinity, age <strong>of</strong> the<br />
scheme. How about issues <strong>of</strong> management?<br />
Ans: The performance <strong>of</strong> each scheme<br />
is identified in terms <strong>of</strong> its technical<br />
performance. However, the evaluation<br />
and establishment <strong>of</strong> indicators on the<br />
internal management process at scheme<br />
level has been found difficult. As a<br />
result comparison between schemes has<br />
not been easy.<br />
Rainfed agriculture has low production and<br />
productivity due to erratic nature <strong>of</strong> rainfall in<br />
Ethiopia. But some downstream water users<br />
argue that poor farming practice and<br />
management is the main cause for low water<br />
productivity <strong>of</strong> rainfed agriculture in Ethiopia.<br />
The contribution <strong>of</strong> rainfall variability and poor<br />
farming practices to the low productivity <strong>of</strong><br />
rainfed agriculture should be studied<br />
comparatively such study would have paramount<br />
contribution towards water allocation among<br />
competing water users.<br />
Ans: Climate variability has a seasonal<br />
impact on the agricultural production<br />
depending on the timing and amount <strong>of</strong><br />
rainfall in each season. Poor farming<br />
practice has also a negative impact on<br />
agricultural production. However their<br />
relative impact has not been studied in<br />
this project as it is beyond the scope <strong>of</strong><br />
this study.<br />
Why factors that are responsible for the<br />
performance at scheme level were not<br />
identified? What was the purpose <strong>of</strong> comparing<br />
number <strong>of</strong> irrigation schemes unless these<br />
factors are identified?<br />
Ans: Factors that have contributed to<br />
low performances <strong>of</strong> community<br />
managed irrigation scheme (Hare) and<br />
state farm (Sille) are mainly<br />
management and deterioration <strong>of</strong><br />
physical infrastructures. It is however,<br />
hardly possible to identify the details <strong>of</strong><br />
indicators <strong>of</strong> external performance<br />
indicators such as output and water<br />
supply at scheme level. Instead we need<br />
to consider on farm process indicators<br />
(accepted international indicators).<br />
94
Theme two:<br />
Irrigation Impact on Poverty and Economy<br />
Papers<br />
1. Rural poverty in Ethiopia: Does small scale irrigation make a difference<br />
2. An assessment <strong>of</strong> the financial viability and income impact <strong>of</strong> SSI in Ethiopia<br />
3. Importance <strong>of</strong> irrigated agriculture to the Ethiopian Economy: Capturing the direct net benefits <strong>of</strong><br />
irrigation<br />
4. Investment in irrigation as a poverty reduction strategy: The case <strong>of</strong> SSI and its impact on poverty<br />
in Tigray, Ethiopia<br />
95
Rural poverty and inequality in Ethiopia: does access to<br />
small-scale irrigation make a difference?<br />
Regassa E. Namara, Godswill Makombe, Fitsum Hagos, Seleshi B. Awulachew<br />
<strong>International</strong> <strong>Water</strong> <strong>Management</strong> <strong>Institute</strong><br />
r.namara@cgiar.org<br />
Abstract<br />
Ethiopia is an agrarian society in a land <strong>of</strong><br />
drought and floods. Agricultural production,<br />
which is the source <strong>of</strong> livelihood for eight out <strong>of</strong><br />
ten Ethiopians, is extremely vulnerable to<br />
climatic conditions. The causes <strong>of</strong> rural poverty<br />
are many including wide fluctuations in<br />
agricultural production as a result <strong>of</strong> drought,<br />
ineffective and inefficient agricultural marketing<br />
system, under developed transport and<br />
communication networks, underdeveloped<br />
production technologies, limited access <strong>of</strong> rural<br />
households to support services, environmental<br />
degradation and lack <strong>of</strong> participation by rural<br />
poor people in decisions that affect their<br />
livelihoods. However, the persistent fluctuation<br />
in the amount and distribution <strong>of</strong> rainfall is<br />
considered as a major factor in rural poverty.<br />
Cognizant <strong>of</strong> this reality the successive<br />
Ethiopian governments and farmers have made<br />
investments in small scale irrigation schemes.<br />
This paper aims to assess the efficacy <strong>of</strong> these<br />
investments in reducing poverty based on data<br />
obtained from a survey <strong>of</strong> 1024 farmers drawn<br />
from four major regional states <strong>of</strong> Ethiopia. The<br />
Foster, Greer and Thorbecke poverty measures<br />
were used to compare the incidence, depth and<br />
severity <strong>of</strong> poverty among groups <strong>of</strong> farmers<br />
defined by relevant policy variables including<br />
access to irrigation. In order to explore the<br />
correlates <strong>of</strong> rural poverty and their quantitative<br />
significance, logistic regression model was<br />
estimated. The main conclusion <strong>of</strong> the study is<br />
that the incidence, depth and severity <strong>of</strong> poverty<br />
is affected more by the intensity <strong>of</strong> irrigation use<br />
(as measured by the size <strong>of</strong> irrigated area) than<br />
mere access to irrigation. Alternatively, there<br />
seems to be an economy <strong>of</strong> scale in the povertyirrigation<br />
relationship.<br />
Key words: Rural poverty, FGT indices, Small<br />
scale irrigation<br />
1. Introduction<br />
Farmers in rural Ethiopia live in a shock-prone<br />
environment. Agricultural production, which is<br />
the source <strong>of</strong> livelihood for eight out <strong>of</strong> ten<br />
Ethiopians, is extremely vulnerable to climatic<br />
conditions. The causes <strong>of</strong> rural poverty are many<br />
including wide fluctuations in agricultural<br />
production as a result <strong>of</strong> drought, ineffective and<br />
inefficient agricultural marketing system, under<br />
developed transport and communication<br />
networks, underdeveloped production<br />
technologies, limited access <strong>of</strong> rural households<br />
to support services, environmental degradation<br />
and lack <strong>of</strong> participation by rural poor people in<br />
decisions that affect their livelihoods. However,<br />
the persistent fluctuation in the amount and<br />
distribution <strong>of</strong> rainfall is considered as a major<br />
factor in rural poverty. Small-scale farmers are<br />
the largest group <strong>of</strong> poor people in Ethiopia.<br />
Their average land holdings are smaller, their<br />
productivity is low and they are vulnerable to<br />
drought and other adverse natural conditions.<br />
Cognizant <strong>of</strong> this reality the successive<br />
Ethiopian governments and farmers have made<br />
investments in small scale irrigation schemes.<br />
Despite efforts to reduce poverty in the country<br />
over the past decade, farmers, herders and other<br />
rural people remain poor. Poor people in rural<br />
areas face an acute lack <strong>of</strong> basic social and<br />
economic infrastructure such as health and<br />
educational facilities, veterinary services and<br />
access to safe drinking water. Households<br />
headed by women are particularly vulnerable.<br />
Women are much less likely than men to receive<br />
an education or health benefits, or to have a<br />
voice in decisions affecting their lives. For them,<br />
97
poverty means high numbers <strong>of</strong> infant deaths,<br />
undernourished families, lack <strong>of</strong> education for<br />
children and other deprivations (IFAD).<br />
The impact <strong>of</strong> drought on the overall macroeconomy<br />
<strong>of</strong> Ethiopia is very significant. There<br />
is very strong correlation between hydrology<br />
and Ethiopia’s GDP performance. It is widely<br />
accepted that the Ethiopian economy is taken<br />
hostage to hydrology due to the so far<br />
insignificant infrastructural development in the<br />
water sector (World Bank, 2006). Oftentimes,<br />
Ethiopia is ravaged by droughts, leading to<br />
dramatic slow downs in economic growth. The<br />
development <strong>of</strong> water storage facilities which<br />
could be used, among other things, to develop<br />
irrigation is seen as a way <strong>of</strong> reducing Ethiopia’s<br />
dependence on the annual availability <strong>of</strong> rainfall<br />
(UNPD, 2006; World Bank, 2006).<br />
In Ethiopia, the persistent correlation between<br />
rainfall and GDP growth is striking and<br />
troubling. The effects <strong>of</strong> hydrological variability<br />
emanate from the direct impacts <strong>of</strong> rainfall on<br />
the landscape, agricultural output, waterintensive<br />
industry and power production. These<br />
impacts are transmitted through input, price and<br />
income effects onto the broader economy, and<br />
are exacerbated by an almost complete lack <strong>of</strong><br />
hydraulic infrastructure to mitigate variability<br />
and market infrastructure that could mitigate<br />
economic impacts by facilitating trade between<br />
deficit and surplus regions <strong>of</strong> the country.<br />
Evidences from elsewhere indicate that initial<br />
investments in water resources management and<br />
multipurpose hydraulic infrastructure had<br />
massive regional impacts with very large<br />
multiplier effects on the economy. Therefore, it<br />
is possible that irrigation investments in Ethiopia<br />
may have contributed to poverty reductions<br />
among other people than the irrigators, who are<br />
direct beneficiaries <strong>of</strong> the investment. However,<br />
in this paper we limit ourselves to the poverty<br />
impact <strong>of</strong> small-scale irrigation development on<br />
the direct beneficiaries or farmers.<br />
Definition <strong>of</strong> concepts<br />
Before addressing the rural poverty and<br />
irrigation nexus, it is important to clarify the<br />
meaning <strong>of</strong> poverty. There is great variation in<br />
the manner in which poverty is being defined<br />
and measured in developing countries<br />
(May,2001). Poverty is a persistent feature <strong>of</strong><br />
socioeconomic stratification through out the<br />
world. Over the last twenty five years the<br />
understanding <strong>of</strong> poverty has advanced and<br />
become more holistic. From having been<br />
understood almost exclusively as inadequacy <strong>of</strong><br />
income, consumption and wealth, multiple<br />
dimensions <strong>of</strong> poverty and their complex<br />
interactions are now widely recognized. These<br />
include isolation, deprivation <strong>of</strong> political and<br />
social rights, a lack <strong>of</strong> empowerment to make or<br />
influence choices, inadequate assets, poor health<br />
and mobility, poor access to services and<br />
infrastructure, and vulnerability to livelihood<br />
failure.<br />
Often distinction is made between absolute and<br />
relative poverty. Relative poverty measures the<br />
extent to which a household’s income falls<br />
below an average income threshold for the<br />
economy. Absolute poverty measures the<br />
number <strong>of</strong> people below a certain income<br />
threshold or unable to afford certain basic goods<br />
and services. Absolute poverty is a state in<br />
which one’s very survival is threatened by lack<br />
<strong>of</strong> resources. Consideration is also necessary <strong>of</strong><br />
the dynamics <strong>of</strong> both chronic 1 and transient<br />
poverty, and <strong>of</strong> the processes which lead people<br />
to escape from or fall into and remain trapped in<br />
poverty (Carter et al. 2007). Another related<br />
concept is equity, which is usually understood<br />
as the degree <strong>of</strong> equality in the living<br />
conditions <strong>of</strong> people, particularly in income<br />
and wealth, that a society deems desirable or<br />
tolerable. Thus equity is broader than poverty<br />
and is defined over the whole distribution, not<br />
only below a certain poverty line. The meaning<br />
<strong>of</strong> equity encapsulates ethical concepts and<br />
statistical dispersion, and encompasses both<br />
relative and absolute poverty. Hence, ideally any<br />
1 Chronic poverty is an individual experience <strong>of</strong><br />
deprivation that lasts for a long period <strong>of</strong> time. In this<br />
sense the chronic poor are those with per capita<br />
income or consumption levels persistently below the<br />
poverty line during a long period <strong>of</strong> time. Transient<br />
poverty is associated with a fluctuation <strong>of</strong> income<br />
around the poverty line.<br />
98
assessment <strong>of</strong> how irrigation can affect poverty<br />
must consider impacts on these varied<br />
dimensions <strong>of</strong> poverty and their interactions. For<br />
example, it must consider whether changes are<br />
in absolute or relative terms, and whether they<br />
are long lasting or transient. Similarly, it must<br />
encompass the other dimensions <strong>of</strong> poverty<br />
beyond income, consumption and wealth. In<br />
order to understand the dynamics <strong>of</strong> poverty,<br />
one can draw on the notions <strong>of</strong> ‘capabilities’ and<br />
‘entitlements’ that have received a good deal <strong>of</strong><br />
attention (Sen 2000). Sen’s work belies the idea<br />
that income shortfalls are the main attribute <strong>of</strong><br />
poverty. He emphasises the importance <strong>of</strong> the<br />
bundle <strong>of</strong> assets or endowments held by the<br />
poor, as well as the nature <strong>of</strong> the claims attached<br />
to them, as critical for analyzing poverty and<br />
vulnerability.<br />
Nevertheless, while recognizing that poverty is a<br />
multidimensional phenomenon consisting <strong>of</strong><br />
material, mental, political, communal and other<br />
aspects, the material dimensions <strong>of</strong> poverty<br />
expressed in monetary values is too important an<br />
aspect <strong>of</strong> poverty to be neglected (Lipton 1997).<br />
Given the fact that there is ‘a lack <strong>of</strong> consensus<br />
regarding the measurement <strong>of</strong> other forms <strong>of</strong><br />
deprivation’, the approach followed in this paper<br />
is ultimately grounded on the notion <strong>of</strong> some<br />
minimum threshold below which the poor are<br />
categorized (Lipton 1997). There is growing<br />
recognition that poverty may adequately be<br />
defined as private consumption that falls below<br />
some absolute poverty line. This is best<br />
measured by calculating the proportion <strong>of</strong> the<br />
population who fall below a poverty line (the<br />
headcount) and the extent <strong>of</strong> shortfall between<br />
actual income level and poverty line (the depth<br />
or severity <strong>of</strong> poverty). The poverty line is<br />
usually based on an estimated minimum dietary<br />
energy intake, or an amount required for<br />
purchasing a minimum consumption bundle.<br />
This paper analyses the state <strong>of</strong> poverty and<br />
inequality among sample farm households with<br />
and without access to irrigation. It also analyses<br />
the correlates <strong>of</strong> poverty. Section two presents<br />
the data collection and analytical methods.<br />
Section three shows the results <strong>of</strong> poverty<br />
pr<strong>of</strong>iling, while section four assesses the<br />
determinants <strong>of</strong> poverty and their quantitative<br />
significance in predicting poverty. Section fives<br />
gives some policy conclusions and implications.<br />
2. Methodological Issues<br />
Data sources<br />
This study is part <strong>of</strong> a comprehensive study on<br />
the impacts <strong>of</strong> irrigation on poverty and<br />
environment run between 2004 and 2007 in<br />
Ethiopia implemented by the <strong>International</strong> <strong>Water</strong><br />
<strong>Management</strong> <strong>Institute</strong> (IWMI) with support from<br />
the Austrian government. The socio-economic<br />
survey data on which this paper is based is<br />
gathered from a total <strong>of</strong> 1024 households from<br />
eight irrigation sites in 4 Regional states<br />
involving traditional, modern and rain fed<br />
systems. The total sample constitutes 397<br />
households practicing purely rainfed agriculture<br />
and 627 households (382 modern and 245<br />
traditional) practice irrigated agriculture. These<br />
households operate a total <strong>of</strong> 4953 plots (a<br />
household operating five plots on average). Of<br />
the total 4953 plots covered by the survey, 25<br />
percent (1,250 plots) are under traditional<br />
irrigation, 43 percent (2,137 plots) are under<br />
modern while the remaining 32 percent (1,566<br />
plots) are under rainfed agriculture. The data<br />
was collected for the 2005/2006 cropping<br />
season.<br />
Poverty indices<br />
When estimating poverty using monetary<br />
measures, one may have a choice between using<br />
income or consumption as the indicator <strong>of</strong> wellbeing.<br />
Most analysts argue that, provided the<br />
information on consumption obtained from a<br />
household survey is detailed enough,<br />
consumption will be a better indicator <strong>of</strong> poverty<br />
measurement than income for many reasons<br />
(Coudouel et al. 2002). One should not be<br />
dogmatic, however, about using consumption<br />
data for poverty measurement. The use <strong>of</strong><br />
income as a poverty measurement may have its<br />
own advantages. In this paper we estimate<br />
poverty using income adjusted for differences in<br />
household characteristics.<br />
As for the poverty measures, we will be<br />
concerned with those in the Foster-Greer-<br />
Thorbecke (FGT) class. The FGT class <strong>of</strong><br />
99
poverty measures have some desirable properties<br />
(such as additive decomposibility), and they<br />
include some widely used poverty measures<br />
(such as the head-count and the poverty gap<br />
measures). Following Duclos et al. (2006), the<br />
FGT poverty measures are defined as<br />
P<br />
( z; )<br />
0<br />
( p ; z )<br />
1<br />
⎛ g ⎞<br />
α = ∫ ⎜ ⎟<br />
⎝ z ⎠<br />
α<br />
dp<br />
(1)<br />
where z denotes the poverty line, and α is a<br />
nonnegative parameter indicating the degree <strong>of</strong><br />
sensitivity <strong>of</strong> the poverty measure to inequality<br />
among the poor. It is usually referred to as<br />
poverty aversion parameter. Higher values <strong>of</strong> the<br />
parameter indicate greater sensitivity <strong>of</strong> the<br />
poverty measure to inequality among the poor.<br />
The relevant values <strong>of</strong> α are 0, 1 and 2.<br />
At α =0 equation 1 measures poverty incidence<br />
or poverty head count ratio. This is the share <strong>of</strong><br />
the population whose income or consumption is<br />
below the poverty line, that is, the share <strong>of</strong> the<br />
population that cannot afford to buy a basic<br />
basket <strong>of</strong> goods.<br />
At α =1 equation 1 measures depth <strong>of</strong> poverty<br />
(poverty gap). This provides information<br />
regarding how far <strong>of</strong>f households are from the<br />
poverty line. This measure captures the mean<br />
aggregate income or consumption shortfall<br />
relative to the poverty line across the whole<br />
population. It is obtained by adding up all the<br />
shortfalls <strong>of</strong> the poor (assuming that the nonpoor<br />
have a shortfall <strong>of</strong> zero) and dividing the<br />
total by the population. In other words, it<br />
estimates the total resources needed to bring all<br />
the poor to the level <strong>of</strong> the poverty line (divided<br />
by the number <strong>of</strong> individuals in the population).<br />
Note also that, the poverty gap can be used as a<br />
measure <strong>of</strong> the minimum amount <strong>of</strong> resources<br />
necessary to eradicate poverty, that is, the<br />
amount that one would have to transfer to the<br />
poor under perfect targeting (that is, each poor<br />
person getting exactly the amount he/she needs<br />
to be lifted out <strong>of</strong> poverty) to bring them all out<br />
<strong>of</strong> poverty (Coudouel et al. 2002).<br />
At α = 2 equation 1 measures poverty severity<br />
or squared poverty gap. This takes into account<br />
not only the distance separating the poor from<br />
the poverty line (the poverty gap), but also the<br />
inequality among the poor. That is, a higher<br />
weight is placed on those households further<br />
away from the poverty line.<br />
We calculated these indices using DAD4.4<br />
(Duclos, J-Y et al., 2006)<br />
Inequality indices<br />
To assess the income inequality among the<br />
different farm household groups, we calculate<br />
the Gini coefficient <strong>of</strong> inequality and Decile<br />
ratios. Gini coefficient <strong>of</strong> inequality is the<br />
most commonly used measure <strong>of</strong> inequality. The<br />
coefficient varies between 0, which reflects<br />
complete equality, and 1, which indicates<br />
complete inequality (one person has all the<br />
income all others have none). The decile<br />
dispersion ratio presents the ratio <strong>of</strong> the average<br />
consumption or income <strong>of</strong> the richest 10 percent<br />
<strong>of</strong> the population divided by the average income<br />
<strong>of</strong> the bottom 10 percent. This ratio is readily<br />
interpretable by expressing the income <strong>of</strong> the<br />
rich as multiples <strong>of</strong> that <strong>of</strong> the poor.<br />
In summary the analysis <strong>of</strong> poverty and<br />
inequality followed four steps. First, we have<br />
chosen household income as a welfare measure<br />
and this was adjusted for the size and<br />
composition <strong>of</strong> the household. Second, a poverty<br />
line is set at 1075 Birr (1USD=9.07Birr), a level<br />
<strong>of</strong> welfare corresponding to some minimum<br />
acceptable standard <strong>of</strong> living in Ethiopia<br />
(reference). The poverty line acts as a threshold,<br />
with households falling below the poverty line<br />
considered poor and those above the poverty line<br />
considered non-poor. Third, after the poor has<br />
been identified, poverty measures such as<br />
poverty gap and squared poverty gap were<br />
estimated. Fourth, we constructed poverty<br />
pr<strong>of</strong>iles showing how poverty varies over<br />
population subgroups (example irrigators Vs<br />
non-irrigators) or by characteristics <strong>of</strong> the<br />
household (for example, level <strong>of</strong> education, age,<br />
etc.). The poverty pr<strong>of</strong>iling is particularly<br />
important as what matters most to many<br />
100
policymakers is not so much the precise location<br />
<strong>of</strong> the poverty line, but the implied poverty<br />
comparison across subgroups or across time.<br />
Lastly, we analyzed income inequality among<br />
sample households.<br />
3. Household income distribution<br />
The income distribution differentiated by access<br />
to irrigation and irrigation use intensity is shown<br />
in table 1. A close scrutiny <strong>of</strong> the table shows<br />
the following interesting results:<br />
• The mean per capita income <strong>of</strong> rainfed<br />
farmers is below the poverty line.<br />
Interestingly also the mean per capita income<br />
values up to the eighth income decile is lower<br />
than the assumed poverty line. However, the<br />
mean per capita income for irrigators and the<br />
overall sample is higher than the poverty line<br />
and the gap between mean per capita income<br />
and poverty line widens in proportion to the<br />
size <strong>of</strong> irrigated area.<br />
• Comparison <strong>of</strong> the mean per capita income<br />
for the richest 10% <strong>of</strong> irrigators and nonirrigators<br />
shows that the mean per capita<br />
income for the former is almost doubles that<br />
<strong>of</strong> the latter group. The income difference<br />
widens with the size <strong>of</strong> irrigated area.<br />
• Comparison <strong>of</strong> the per capita income for the<br />
lower 10% <strong>of</strong> income distribution for<br />
irrigators and non-irrigators shows that the per<br />
capita income for the irrigators is three times<br />
that <strong>of</strong> non-irrigators. This difference is also<br />
influenced by the size <strong>of</strong> cultivated area<br />
• The gap in mean per capita income between<br />
poor and non-poor households is substantial<br />
irrespective <strong>of</strong> access to irrigation. Even<br />
though the mean per capita income <strong>of</strong> poor<br />
people with access to irrigation is higher than<br />
that <strong>of</strong> the poor without access to irrigation,<br />
the difference seems to be insignificant.<br />
• The Gini index <strong>of</strong> income inequality values<br />
suggests that income inequality is higher<br />
among households with access to irrigation as<br />
compared to those with no access. The values<br />
for the decile ratios also indicate that income<br />
inequality is lower among the rain-fed<br />
farmers.<br />
<strong>Table</strong> 1. Distribution <strong>of</strong> per capita income by income deciles for irrigators and non-irrigators<br />
Deciles Rainfed Irrigators Overall 1 st<br />
quartile a<br />
2 nd<br />
quartile<br />
3 rd<br />
quartile<br />
4 th<br />
quartile<br />
First 38.5 114.5 72.6 90.8 80.4 116.5 233.4<br />
Second 166.8 331.0 236.4 274.6 242.6 362.9 520.0<br />
Third 285.6 503.0 391.0 385.5 466.7 538.9 708.2<br />
Fourth 401.6 648.2 526.8 509.3 584.3 658.8 960.2<br />
Fifth 514.2 850.9 651.5 673.4 813.8 864.0 1268.3<br />
Sixth 617.0 1127.9 842.0 827.0 1035.8 1270.1 1641.1<br />
Seventh 774.2 1507.0 1099.5 1112.8 1245.2 1766.1 2295.2<br />
Eighth 984.5 2067.9 1542.5 1481.8 1729.0 2506.7 3294.9<br />
Ninth 1379.2 3231.7 2425.7 2033.6 2374.8 3889.2 4796.6<br />
Tenth 4152.5 8736.3 7096.5 6395.6 7447.2 9352.3 10212.0<br />
Mean 930.7 1908.3 1487.3 1369.6 1613.7 2230.9 2492.7<br />
Poverty line 1075 1075 1075 1075 1075 1075 1075<br />
poor 486.2 498.5 492.8 503.4 527.0 525.2 602.9<br />
non-poor 2688.4 3497.1 3290.5 2980.4 3123.2 3998.4 3718.5<br />
% poor 77.1 58.5 65.7 66.3 58.9 53.9 41.8<br />
Gini coefficient 0.499 0.546 0.547 0.507 0.515 0.537 0.503<br />
Deciles ratio 11.6 26.9 20.7 14.8 20.1 22.6 16.4<br />
Given the assumed poverty line, the proportion<br />
<strong>of</strong> poor households among those households<br />
with no access to irrigation is higher than those<br />
who have access to irrigation. The poverty<br />
reduction impact <strong>of</strong> access to irrigation is very<br />
much influenced by the size or irrigated area.<br />
The relationship between poverty and irrigation<br />
101
and other relevant factors will be analyzed in<br />
more detail in the succeeding sections.<br />
4. Poverty pr<strong>of</strong>ile<br />
Rural poverty and irrigation<br />
<strong>Table</strong> 2 shows the incidence, depth and severity<br />
<strong>of</strong> poverty by access to irrigation, irrigation<br />
typology, and extent <strong>of</strong> irrigated area owned by<br />
those who have access to irrigation. As expected<br />
the poverty incidence, depth and severity values<br />
are lower for farmers that have access to<br />
irrigation. While the interpretation <strong>of</strong> the<br />
incidence values is straight forward (i.e., it<br />
indicates the proportion <strong>of</strong> poor people in the<br />
sample), that <strong>of</strong> the depth and severity is not.<br />
The depth <strong>of</strong> poverty for irrigators is about 0.322<br />
as compared to 0.425 for those without access to<br />
irrigation. The interpretation is that the per<br />
capita income <strong>of</strong> farmers with access to<br />
irrigation needed to be increased on average by<br />
32.2% to lift their per capita income level to the<br />
poverty line or alternatively to move them out<br />
<strong>of</strong> absolute poverty, while the income <strong>of</strong> rain-fed<br />
poor farmers should be increased by 42.5% to<br />
lift them out <strong>of</strong> poverty. The higher poverty<br />
severity value for rain-fed poor farmers also<br />
indicates that inequality among the poor rainfed<br />
farmers is higher when compared to irrigating<br />
poor farmers. Similar interpretations hold for<br />
tables 3 through 6 as well.<br />
However, note that the incidence <strong>of</strong> poverty<br />
among the sample households is still higher<br />
irrespective access to irrigation. When<br />
comparing irrigation scheme types, the poverty<br />
situation is worse among irrigators belonging to<br />
traditional scheme. Poverty indices are also<br />
responsive to the size <strong>of</strong> irrigated area. Poverty<br />
incidence for households belonging to the first<br />
quartile <strong>of</strong> irrigated area is about 65.8%, which<br />
decreases to 40.3% for those in the fourth<br />
quartile.<br />
<strong>Table</strong> 2.The effect <strong>of</strong> irrigation on incidence, depth and severity <strong>of</strong> poverty<br />
Variables<br />
Incidence ( α = 0 ) Depth ( α = 1) Severity ( α = 2 )<br />
value SD Value SD Value SD<br />
Access to irrigation<br />
Irrigators 0.585 0.0197 0.322 0.0140 0.226 0.0125<br />
Non-irrigators 0.771 0.0211 0.425 0.0161 0.283 0.0144<br />
Irrigation Scheme Type<br />
Traditional Schemes 0.661 0.0303 0.404 0.0234 0.297 0.0216<br />
Modern Schemes 0.537 0.0255 0.270 0.0169 0.181 0.0148<br />
Size <strong>of</strong> Irrigation area<br />
No irrigation 0.792 0.0191 0.466 0.0160 0.333 0.0154<br />
1 st quartile (0.66) 0.658 0.0374 0.351 0.0259 0.230 0.0220<br />
2 nd quartile (1.87) 0.586 0.0436 0.299 0.0298 0.203 0.0254<br />
3 rd quartile (3.56) 0.524 0.0390 0.268 0.0246 0.171 0.0209<br />
4 th quartile (7.92) 0.403 0.0450 0.177 0.0246 0.104 0.0181<br />
It is true that the exact magnitude <strong>of</strong> the<br />
calculated poverty incidence, depth and severity<br />
values is influenced by the level <strong>of</strong> the chosen<br />
poverty line. This is particularly true when one<br />
considers the fact that the different regions <strong>of</strong><br />
Ethiopia are expected to differ in the magnitude<br />
incidence values 1 and the results are shown in Figure 1 and 2.<br />
<strong>of</strong> poverty line due to several reasons (Coudouel<br />
et al.2002). To avoid the potential bias that<br />
might be created due to the use <strong>of</strong> in appropriate<br />
poverty line, we have plotted a graph depicting<br />
the relationship between all the realized income<br />
per capita and the corresponding poverty<br />
Figure 1 shows that baring the results for the extreme low values <strong>of</strong> income per capita, at all <strong>of</strong> the<br />
realized per capita income (plausible poverty lines), the poverty incidence is higher among farmers with<br />
no access to irrigation. The vertical line indicates the assumed poverty line (1075 Birr).<br />
102
Figure 1. Poverty incidence curves for irrigators and non-irrigators under different poverty line<br />
assumptions.<br />
1. We have used DAD 4.4 to generate these curves.<br />
Figure 2 Shows poverty incidence for different irrigated area categories. The figure indicates that poverty<br />
incidence is very responsive to the size <strong>of</strong> irrigated area.<br />
103
Poverty, farm size and livestock holding<br />
The effect <strong>of</strong> farm size and livestock holding on<br />
the incidence, depth and severity <strong>of</strong> poverty is<br />
shown in table 3. The incidence depth and<br />
severity <strong>of</strong> poverty among farmers in the higher<br />
farm size category is significantly lower.<br />
However, it should be noted that the room for<br />
expanding farm size is limited in most parts <strong>of</strong><br />
Ethiopia due to population pressure. Any farther<br />
expansion is possible only in fragile lands or<br />
important natural resources enclaves. The<br />
relationship between livestock holding and<br />
poverty is generally as expected: poverty<br />
incidence is lower among farmers with highest<br />
livestock<br />
holding.<br />
<strong>Table</strong> 3. The effect <strong>of</strong> farm size and livestock holding on poverty incidence, depth and severity<br />
Variables Incidence ( α = 0 ) Depth ( α = 1) Severity ( α = 2 )<br />
Value SD Value SD Value SD<br />
Farm Size<br />
1 st quartile 0.789 0.0249 0.524 0.0216 0.400 0.0211<br />
2 nd quartile 0.700 0.0288 0.360 0.0204 0.235 0.0181<br />
3 rd quartile 0.600 0.0313 0.291 0.0201 0.183 0.0164<br />
4 th quartile 0.531 0.0312 0.260 0.0194 0.163 0.0157<br />
Livestock holding<br />
1 st quartile 0.657 0.0230 0.407 0.0231 0.299 0.0217<br />
2 nd quartile 0.669 0.0295 0.383 0.0212 0.260 0.0182<br />
3 rd quartile 0.654 0.0299 0.353 0.0205 0.231 0.0172<br />
4 th quartile 0.607 0.0308 0.272 0.0190 0.164 0.0155<br />
104
Poverty and cropping pattern<br />
<strong>Table</strong> 4 depicts the influence <strong>of</strong> cropping pattern<br />
on poverty indices. It is interesting to note that<br />
as the proportion <strong>of</strong> cultivated area devoted to<br />
cereals increases the value <strong>of</strong> the FGT poverty<br />
indices increases. This is particularly important<br />
because most <strong>of</strong> the sample farmers grow low<br />
value staple cereal crops. On the other hand, the<br />
incidence, severity and depth <strong>of</strong> poverty is<br />
significantly lower among farmers whose<br />
substantial proportion <strong>of</strong> cultivated area is<br />
devoted to vegetables and root crops. This<br />
suggests that poverty among smallholders can be<br />
reduced through diversifying crop production by<br />
including high value crops such as vegetables.<br />
However, it is also important to note that most<br />
<strong>of</strong> the farmers who grow vegetables and root<br />
crops had access to irrigation.<br />
<strong>Table</strong> 4. The effect <strong>of</strong> cropping pattern on poverty incidence, depth and severity<br />
Variables Incidence ( α = 0 ) Depth ( α = 1) Severity ( α = 2 )<br />
Value SD Value SD Value SD<br />
Crop area shares: cereals<br />
0.0 - 0.25 0.575 0.0319 0.385 0.0257 0.307 0.0239<br />
0.25-0.50 0.630 0.0290 0.334 0.0196 0.218 0.0170<br />
0.50-0.75 0.641 0.0303 0.290 0.0190 0.175 0.0152<br />
0.75-1.0 0.780 0.0259 0.441 0.0203 0.299 0.0185<br />
Crop area shares: vegetables<br />
No vegetables 0.766 0.0158 0.440 0.0126 0.308 0.0117<br />
0.0 - 0.25 0.455 0.0399 0.178 0.0195 0.091 0.0130<br />
0.25-0.50 0.368 0.0495 0.179 0.0313 0.125 0.0291<br />
0.50-0.75 0.263 0.1011 0.096 0.0528 0.062 0.0440<br />
0.75-1.0 0.258 0.0786 0.181 0.0603 0.145 0.0537<br />
Crop area share: root crops<br />
No root crops 0.661 0.0161 0.366 0.0117 0.252 0.0105<br />
0.0 - 0.25 0.645 0.0435 0.329 0.0291 0.210 0.0239<br />
0.25-0.50 0.667 0.0786 0.411 0.0592 0.295 0.0518<br />
0.50-0.75 0.0 0.0 0.0 0.0 0.0 0.0<br />
0.75-1.0 0.0 0.0 0.0 0.0 0.0 0.0<br />
Crop area shares: fruits<br />
No fruits 0.671 0.0176 0.351 0.0120 0.233 0.0109<br />
0.0-0.25 0.523 0.0377 0.296 0.0257 0.203 0.0217<br />
0.25-0.50 0.738 0.0480 0.471 0.0383 0.345 0.0351<br />
0.50-0.75 0.625 0.1211 0.398 0.0930 0.297 0.0855<br />
0.75-1.0 0.903 0.0531 0.668 0.0647 0.675 0.0672<br />
Poverty and geographic characteristics<br />
<strong>Table</strong> 5 shows poverty indices by geographic<br />
location <strong>of</strong> the sample households. The poverty<br />
incidence is generally higher in all <strong>of</strong> the<br />
Ethiopian regional states. It is relatively lower in<br />
Oromia and Tigray regional states and higher in<br />
Southern Nations Nationalities and Peoples<br />
states 2 . When comparing the zones included in<br />
2 However note the regional differences in poverty<br />
line and the non-representative ness <strong>of</strong> the sample<br />
the study, the lowest poverty incidence was<br />
observed in East Shewa and the highest in North<br />
Omo. The observed low poverty incidence rate<br />
in East Shewa is not surprising given the fact<br />
that the zone is relatively well developed in<br />
terms <strong>of</strong> services and infrastructure, thus<br />
providing relatively better marketing conditions<br />
and employment opportunities. We have also<br />
assessed poverty according to which basin the<br />
sample irrigation schemes or farm households<br />
105
elong. It was found that poverty is significantly<br />
lower in Awash and Denakil basins.<br />
<strong>Table</strong> 5. Headcount, depth and severity <strong>of</strong> poverty among sample households<br />
Variable Incidence ( α = 0 ) Depth ( α = 1) Severity ( α = 2 )<br />
value SD Value SD Value SD<br />
Sample total 0.657 0.0148 0.362 0.0107 0.248 0.0010<br />
Zones<br />
North Omo 0.871 0.0285 0.626 0.0286 0.506 0.0302<br />
Arsi 0.648 0.0460 0.268 0.0261 0.145 0.0222<br />
Awi 0.717 0.0438 0.390 0.0325 0.264 0.0279<br />
Raya Azebo 0.565 0.0351 0.299 0.0227 0.193 0.0178<br />
East Shewa 0.455 0.0387 0.177 0.0192 0.092 0.0132<br />
West Shewa 0.727 0.0347 0.417 0.0260 0.286 0.0227<br />
West Gojam 0.664 0.0418 0.330 0.0277 0.207 0.0231<br />
Basins<br />
Abay 0.707 0.0227 0.388 0.0166 0.262 0.0145<br />
Awash 0.535 0.0301 0.219 0.0162 0.120 0.0127<br />
Denakil 0.444 0.0500 0.272 0.0362 0.204 0.0310<br />
Rift Valley 0.871 0.0284 0.626 0.0286 0.506 0.0302<br />
Tekeze 0.704 0.0440 0.369 0.0302 0.235 0.0256<br />
Region<br />
Amara 0.693 0.0299 0.368 0.0215 0.236 0.0188<br />
SNNP 0.871 0.0285 0.626 0.0286 0.506 0.0302<br />
Oromia 0.607 0.0233 0.293 0.0148 0.182 0.0123<br />
Tigray 0.580 0.0343 0.323 0.0237 0.220 0.0200<br />
The incidence <strong>of</strong> and severity <strong>of</strong> poverty is<br />
higher in rural than urban areas (52 per cent and<br />
36 per cent, respectively). Poverty is uniformly<br />
distributed throughout the country’s rural areas.<br />
An exception is the region <strong>of</strong> Oromiya, where<br />
the level and intensity <strong>of</strong> poverty is significantly<br />
lower.<br />
Poverty and household demographic and<br />
socioeconomic characteristics<br />
<strong>Table</strong> 6 presents the state <strong>of</strong> poverty among<br />
sample farmers by their demographic and<br />
socioeconomic characteristics. Education had a<br />
pr<strong>of</strong>ound effect on poverty. In fact there are no<br />
poor people with post secondary education.<br />
Poverty is also highly associated with family<br />
size . The poverty incidence is almost 90%<br />
among households having 10 members or more.<br />
Contrary to our expectation, the poverty<br />
incidence is relatively lower among female<br />
headed households. Poverty incidence is also<br />
lower among younger households.<br />
106
<strong>Table</strong> 6. Household socioeconomic and demographic characteristics<br />
Variables<br />
Incidence ( α = 0 ) Depth ( α = 1) Severity ( α = 2 )<br />
value SD Value SD Value SD<br />
Education<br />
No education 0.677 0.0186 0.364 0.0132 0.243 0.0114<br />
Elementary 0.649 0.0295 0.356 0.0209 0.241 0.0182<br />
Secondary 0.539 0.0465 0.295 0.0333 0.215 0.0311<br />
Post secondary 0.0 NA 0.0 NA 0.0 NA<br />
Household Size<br />
1 person 0.348 0.0703 0.177 0.0445 0.122 0.0390<br />
2-4 persons 0.529 0.0278 0.277 0.0181 0.183 0.0153<br />
5-9 persons 0.727 0.0183 0.399 0.0139 0.275 0.0126<br />
10 + persons 0.885 0.0408 0.581 0.0401 0.435 0.0411<br />
Gender<br />
Male 0.664 0.0162 0.368 0.0118 0.254 0.0105<br />
Female 0.626 0.0370 0.330 0.0257 0.221 0.0220<br />
Household age group<br />
15 through 24 0.561 0.0658 0.301 0.0463 0.212 0.0419<br />
25 through 34 0.592 0.0347 0.310 0.0239 0.211 0.0215<br />
35 through 44 0.665 0.0292 0.359 0.0412 0.245 0.0187<br />
45 through 54 0.710 0.0320 0.315 0.0225 0.315 0.0225<br />
55 through 64 0.680 0.0381 0.359 0.0268 0.236 0.0232<br />
65 through 74 0.686 0.0460 0.358 0.0322 0.233 0.0278<br />
75 + 0.646 0.0691 0.364 0.0491 0.248 0.0430<br />
5. Determinants <strong>of</strong> rural poverty: the role <strong>of</strong><br />
access to irrigation<br />
Poverty and poverty changes are affected by<br />
both microeconomic and macroeconomic<br />
variables. Within a microeconomic context, the<br />
simplest method <strong>of</strong> analyzing the correlates <strong>of</strong><br />
poverty is to use regression analysis to see the<br />
effect on poverty <strong>of</strong> a specific household or<br />
individual characteristic while holding constant<br />
all other characteristics, which is the focus <strong>of</strong><br />
this section. In these regressions, the logarithm<br />
<strong>of</strong> consumption or income (possibly divided by<br />
the poverty line) is typically used as the left<br />
hand variable (Qiuqiong et al.2005). An<br />
alternative framework transforms the continuous<br />
income variable into binary variable using<br />
poverty line as a cut<strong>of</strong>f value (Anyanwu 2005).<br />
The resulting dummy variable indicates whether<br />
a household is poor (i.e., the household’s income<br />
is less than the poverty line) or non-poor (i.e.,<br />
household’s income is more than the poverty<br />
line). In this paper we follow the later approach.<br />
The right-hand explanatory variables span a<br />
large array <strong>of</strong> possible poverty correlates, such<br />
as education <strong>of</strong> different household members,<br />
number <strong>of</strong> income earners, household<br />
composition and size, and geographic location.<br />
The regressions will return results only for the<br />
degree <strong>of</strong> association or correlation, not for<br />
causal relationships.<br />
Empirical Model<br />
The discussion in section 3 has relied largely on<br />
descriptive results, exploring relationships<br />
between variables without holding the effect <strong>of</strong><br />
other factors constant. However, correlations<br />
among key variables potentially could obscure<br />
the relationship between poverty and a single<br />
factor <strong>of</strong> interest. Consequently it is useful to<br />
analyze the impact <strong>of</strong> the relevant variables on<br />
poverty holding all other factors constant. This<br />
implies the need to separate the effects <strong>of</strong><br />
correlates. We approach this problem through<br />
the application <strong>of</strong> multivariate analysis, using<br />
logistic regression. The dependent variable is a<br />
discrete variable which takes a value equal to 0<br />
for non-poor, if a household had per capita<br />
income equal to or more than 1075 Birr and 1<br />
for poor if a household had a per capita income<br />
107
less than 1075 Birr (which is considered her as a<br />
poverty line).<br />
The explanatory variables considered in the<br />
model were household heads’ personal<br />
characteristics (age, gender, educational<br />
achievement, etc), household demographic<br />
characteristics (household size and its square),<br />
household wealth (farm size, livestock holding),<br />
the nature <strong>of</strong> farming system (share <strong>of</strong> grains in<br />
the total cultivated area, size <strong>of</strong> irrigated area),<br />
and location (zones to which the household<br />
belong). See table 7 for details <strong>of</strong> the variables<br />
included in the model.<br />
the conditional probabilities are calculated for<br />
each sample household, the partial effects <strong>of</strong> the<br />
continuous individual variables on household<br />
poverty can be calculated using<br />
( β ' X )<br />
∂Λ<br />
∂X<br />
i<br />
i<br />
= Λ<br />
( β ' X )[ 1− Λ( β ' X )]<br />
i<br />
The partial effects <strong>of</strong> the discrete variables will<br />
be calculated by taking the difference <strong>of</strong> the<br />
mean probabilities estimated for respective<br />
discrete variables at values 0 and 1.<br />
i<br />
In the model, the response variable is binary,<br />
taking only two values, 1 if the rural household<br />
is poor, 0 if not. The probability <strong>of</strong> being poor<br />
depends on a set <strong>of</strong> variables listed above and<br />
denoted as X so that:<br />
Prob<br />
Prob<br />
'<br />
( Y = 1) = F( β x)<br />
( Y = 0) = 1−<br />
F( β ' x) (1)<br />
Using the logistic distribution we have:<br />
Prob<br />
β ' x β ' x<br />
( Y = 1) = ( e 1+<br />
e ) = Λ( β ' x) (2)<br />
Where Λ represents the logistic cumulative<br />
distributions function. Then the probability<br />
model is the expression:<br />
E<br />
Alternatively, we present the change <strong>of</strong> the odds<br />
ratios as the dependant variables change. The<br />
odds ratio is defined as the ratio <strong>of</strong> the<br />
probability <strong>of</strong> being poor divided by the<br />
probability <strong>of</strong> not being poor. This is computed<br />
β<br />
as the exponents <strong>of</strong> the logit coefficients ( e )<br />
β<br />
and can be expressed in percentage as [100( e -<br />
[ y x] = 0[ 1−<br />
F( β ' x)<br />
] + 1[ F( β ' x)<br />
] (3)<br />
1)].<br />
Before presenting the model results we wish to<br />
give a brief description <strong>of</strong> the variables included<br />
in the model (See table 7). There is significant<br />
association between poverty and access to<br />
irrigation. Irrigating households have also<br />
significantly higher farm size, family size, and<br />
years <strong>of</strong> schooling. They also devote<br />
significantly lower area to the cultivation <strong>of</strong> food<br />
grains than the non-irrigators. The proportion <strong>of</strong><br />
female headed households is relatively higher<br />
among farmers without access to irrigation.<br />
Since the logistic model is not linear, the<br />
marginal effects <strong>of</strong> each independent variable on<br />
the dependent variable are not constant but are<br />
dependent on the values <strong>of</strong> independent<br />
variables. Thus, to analyze the effects <strong>of</strong> the<br />
independent variables upon the probability <strong>of</strong><br />
being poor, we calculated the conditional<br />
probabilities for each sample household. Once<br />
108
<strong>Table</strong> 7. Description <strong>of</strong> variables included in the model<br />
Variables Irrigators Non-irrigators t-statistic 2<br />
χ<br />
Proportion <strong>of</strong> poor (Y=1=poor, 0 other 56.8 76.6 NA 41.578***<br />
wise) (%)<br />
Proportion <strong>of</strong> female (%) (X1) 14.8 19.6 NA 4.051*<br />
Zones (Number) (X2)<br />
North Omo 55 55 NA NA<br />
Arsi 109 30 NA NA<br />
Awi 55 53 NA NA<br />
Raya Azebo 107 100 NA NA<br />
East Shewa 108 57 NA NA<br />
West Shewa 110 55 NA NA<br />
West Gojam 83 47 NA NA<br />
Irrigated area (Timmad) (X3) 3.02 NA NA NA<br />
Farm Size (Timmad) (X4) 6.87 5.90 8.321*** NA<br />
Area share <strong>of</strong> grains (%) (X5) 64.33 91.21 234.085*** NA<br />
Livestock holding in TLU (X6) 3.78 4.20 2.708 NA<br />
Family Size (number) (X7) 5.63 5.34 3.569* NA<br />
Age <strong>of</strong> household head (years) (X8) 45.99 44.84 1.386 NA<br />
Years <strong>of</strong> schooling (X9) 2.34 1.65 11.389*** NA<br />
The logistic regression analysis is fitted to<br />
strengthen and clarify the descriptive results <strong>of</strong><br />
the preceding descriptive sections.<br />
Empirical results<br />
The model results are summarized in table 8.<br />
2<br />
The likelihood ratio χ statistic is used to test<br />
the dependence <strong>of</strong> rural poverty on the variables<br />
included in the model. Under the null hypothesis<br />
(Ho) where we have only one parameter, which<br />
is the intercept ( β<br />
o<br />
), the value <strong>of</strong> the restricted<br />
log likelihood function is -666.39, while under<br />
the alternative hypothesis ( H<br />
1<br />
) where we have<br />
all the parameters, the value <strong>of</strong> the unrestricted<br />
log likelihood function is -453.64. The model<br />
2<br />
χ statistic is highly significant, indicating that<br />
the log odds <strong>of</strong> household poverty is related to<br />
the model variables. With regard to the<br />
predictive efficiency <strong>of</strong> the model, <strong>of</strong> the 1024<br />
sample households included in the model, 822 or<br />
80.3% are correctly predicted.<br />
The results <strong>of</strong> the parameter estimates <strong>of</strong><br />
determinants <strong>of</strong> poverty generally agree with the<br />
descriptive results <strong>of</strong> the preceding section. Of<br />
the twelve variables included in the model, nine<br />
were found to have a significant impact on<br />
poverty. Increases in farm size, irrigated area<br />
and years <strong>of</strong> schooling significantly reduce the<br />
probability <strong>of</strong> being poor, while increases in<br />
family size and area share <strong>of</strong> food grains in the<br />
total cultivated area significantly increases the<br />
probability <strong>of</strong> being poor. The relationship<br />
between poverty and family size is non-linear.<br />
Family size increases the probability <strong>of</strong> being<br />
poor up to a certain point beyond which any<br />
successive addition <strong>of</strong> a family member<br />
contributes to the reduction <strong>of</strong> poverty. This<br />
confirms the usual inverse U relationship<br />
between poverty and family size (World Bank<br />
1991, 1996; Lanjouw and Ravallion 1994;<br />
Cortes 1997; Szekely 1998, Gang et al. 2004).<br />
Livestock holding size, which is usually<br />
regarded as a measure <strong>of</strong> wealth (Shiferaw et<br />
al.2007), had the expected sign but not<br />
statistically significant. Contrary to our<br />
expectation female headed households had lower<br />
chance <strong>of</strong> being poor as compared to male<br />
headed households. Concerning location effects,<br />
the probability being poor for sample<br />
households from North Omo and West Shewa is<br />
significantly higher, whereas the probability <strong>of</strong><br />
being poor for households from East Shewa and<br />
Raya Azebo zones is significantly lower.<br />
We assess the magnitude <strong>of</strong> the effect <strong>of</strong><br />
changes in statistically significant and policy<br />
109
elevant variables on household poverty based<br />
on the partial effects <strong>of</strong> the respective variables<br />
on conditional probabilities (<strong>Table</strong> 9). The<br />
partial effects <strong>of</strong> continuous variables were<br />
calculated using equation 4, while those <strong>of</strong> the<br />
discrete variables were calculated by taking the<br />
difference between the mean probabilities<br />
estimated at the respective values (0 and 1) <strong>of</strong><br />
the discrete variables. The partial effects thus<br />
calculated from the logistic model show the<br />
effect <strong>of</strong> change in an individual variable on the<br />
probability <strong>of</strong> being poor when all other<br />
exogenous variables are held constant.<br />
<strong>Table</strong> 8. Parameter estimates <strong>of</strong> determinants <strong>of</strong><br />
poverty model<br />
Variables Estimate a SE β<br />
probability <strong>of</strong> being poor by 0.41% or a 1%<br />
increase in the proportion β<br />
e <strong>of</strong> 100( area e devoted -1) to<br />
Constant -1.018 grain crops 0.913 increase 0.361 the probability -63.9 <strong>of</strong> being<br />
Size <strong>of</strong> irrigated area -0.354*** poor by 0.44%. 0.117 This 0.702 implies -29.8 that changing the<br />
Area share <strong>of</strong> grains cultivation 1.942*** crop mix managed 0.433 6.970 by farmers 597 towards high<br />
Irrigated area-by-area share <strong>of</strong> grain 0.291* value crops 0.156 such as 1.338 vegetables 33.8 would have a<br />
Farm size -0.202*** pr<strong>of</strong>ound effect 0.026 on 0.817 rural poverty. -18.3 Irrigation<br />
Livestock holding in TLU -0.039 technology 0.025 facilitates 0.961 the cropping -3.9 pattern shift<br />
Family size 0.724*** process. A one 0.146 timmad 2.064 increase 106.4 in irrigated area<br />
Square <strong>of</strong> family size -0.022* would reduce 0.012 the probability 0.979 -2.1 <strong>of</strong> being poor by<br />
Age <strong>of</strong> household head -0.050 0.075% . In 0.035 other 0.951 words, a -4.9 1% increase in<br />
Square <strong>of</strong> age <strong>of</strong> household head 0.001 irrigated area 0.000 would 1.001 reduce the 0.1 probability <strong>of</strong><br />
Level <strong>of</strong> education <strong>of</strong> HH head -0.116*** being poor 0.032 by 0.2%. 0.890 Increasing -11 the household<br />
Sex <strong>of</strong> the household head(=Male) 0.438* member by 0.246 one person 1.549 would 54.9 increase the<br />
Zones:<br />
probability <strong>of</strong> being poor by 0.15%.<br />
North Omo 2.248*** Alternatively 0.440 a 1% 9.470 increase in 847 the family size<br />
Arsi 0.663* would increase 0.378 the probability 1.940 94 <strong>of</strong> being poor by<br />
Awi -0.161 1.21%. 0.353 0.852 -14.8<br />
Raya Azebo -0.569* Another significant 0.296 0.566 policy relevant -43.4 variable is<br />
East Shewa -1.353*** years <strong>of</strong> schooling. 0.309 0.258 An unit increase -74.2 in year <strong>of</strong><br />
West Shewa 1.107*** schooling decreases 0.357 3.026 the probability 202.6 <strong>of</strong> being<br />
West Gojam (reference)<br />
poor by 0.0245.<br />
Note:<br />
Restricted log likelihood value [Log(L0)]=-<br />
666.3848<br />
Unrestricted log likelihood value [Log (L1)]=-<br />
453.6428<br />
Log likelihood value<br />
(<br />
( df = 9) = −2[ log( L0) − ( − log( L ))] = 425. 4841<br />
)<br />
1<br />
2<br />
χ<br />
***<br />
% <strong>of</strong> correct prediction=80.3<br />
Number <strong>of</strong> observation=1024<br />
a<br />
The parameters were estimated using maximum<br />
likelihood methods. They are un-weighted<br />
***Statistically significant at p
<strong>Table</strong> 9. Marginal effects <strong>of</strong> the significant<br />
variables<br />
Determinants Marginal Elasticity<br />
effects<br />
Irrigated area in -0.0747 -0.20<br />
Timmad<br />
Area share <strong>of</strong> 0.4089 0.44<br />
grain crops<br />
Farm size in -0.0426 -0.40<br />
Timmad<br />
Family size 0.1526 1.21<br />
Years <strong>of</strong> -0.0245 -0.07<br />
schooling<br />
Gender (Male) 0.0865 0.02<br />
Zones<br />
North Omo 0.3113 0.06<br />
Arsi 0.1240 0.02<br />
Awi -0.0346 -0.01<br />
Raya Azebo -0.1268 -0.04<br />
East Shewa -0.3156 -0.07<br />
West Shewa 0.1948 0.05<br />
The interesting results contained in table 10 can<br />
be graphically depicted. Poverty is more<br />
responsive to the size <strong>of</strong> irrigated area than mere<br />
access to irrigation (See panel a and b <strong>of</strong> Figure<br />
3). In the past due mainly to the demand for<br />
irrigated land exceeding the supply and due to<br />
also partly to the egalitarian policies followed<br />
for rural development, the irrigated land is<br />
rationed in Ethiopia. In an effort to reach many<br />
people the irrigated plots distributed to farmers<br />
are <strong>of</strong>ten far below an economic size that is<br />
sufficient to warrant the full engagement <strong>of</strong><br />
farmers in irrigated production business.<br />
Consequently, irrigated farming is considered as<br />
a second best option by farmers.<br />
Rural poverty is also very responsive to<br />
cropping pattern changes (see panel c and d <strong>of</strong><br />
Figure 3). Reductions in area share <strong>of</strong> food<br />
grains and increases in the area share <strong>of</strong> high<br />
value crops such as vegetables significantly<br />
reduces rural poverty. Two major variables that<br />
allow the change to high value crops are access<br />
to irrigation and proximity to the demand centers<br />
thus allowing easy marketing. Figure 4 ( panel a<br />
and b)show that poverty is highly related to<br />
family size and level <strong>of</strong> education <strong>of</strong> the<br />
household head.<br />
111
Predicted probability <strong>of</strong> being poor<br />
1<br />
0.9<br />
0.8<br />
0.7<br />
0.6<br />
0.5<br />
0.4<br />
0.3<br />
0.2<br />
0.1<br />
0<br />
No<br />
irrigation<br />
1st<br />
quartile<br />
2nd<br />
quartile<br />
3rd<br />
quartile<br />
Size <strong>of</strong> irrigated land<br />
4th<br />
quartile<br />
Probabilitity <strong>of</strong> being poo<br />
1<br />
0.9<br />
0.8<br />
0.7<br />
0.6<br />
0.5<br />
0.4<br />
0.3<br />
0.2<br />
0.1<br />
0<br />
Irrigators<br />
Access to irrigation<br />
Non-irrigators<br />
Panel a<br />
Panel b<br />
Probability <strong>of</strong> being poo<br />
1<br />
0.9<br />
0.8<br />
0.7<br />
0.6<br />
0.5<br />
0.4<br />
0.3<br />
0.2<br />
0.1<br />
0<br />
No vegetable<br />
1st quartile<br />
2nd quartile<br />
3rd quartile<br />
Area share <strong>of</strong> vegetables<br />
4th quartile<br />
Probability <strong>of</strong> being poor<br />
1<br />
0.9<br />
0.8<br />
0.7<br />
0.6<br />
0.5<br />
0.4<br />
0.3<br />
0.2<br />
0.1<br />
0<br />
Panel d<br />
No grains 0-0.25 0.25-0.5 0.5-0.75 0.75-1.0<br />
Area share <strong>of</strong> grains<br />
Panel c<br />
Figure 3. Irrigation, cropping pattern and poverty<br />
112
Probability <strong>of</strong> being poo<br />
0.9<br />
0.8<br />
0.7<br />
0.6<br />
0.5<br />
0.4<br />
0.3<br />
0.2<br />
0.1<br />
0<br />
probability <strong>of</strong> being poo<br />
1<br />
0.9<br />
0.8<br />
0.7<br />
0.6<br />
0.5<br />
0.4<br />
0.3<br />
0.2<br />
0.1<br />
0<br />
1 Person 2-4<br />
Persons<br />
5-9<br />
Persons<br />
10+<br />
Persons<br />
No<br />
education<br />
Elementary Secondary<br />
Post<br />
secondary<br />
Household Size<br />
Education status<br />
Panel a<br />
Panel b<br />
Figure 4. A graphical illustration <strong>of</strong> the influence <strong>of</strong> education and household size on poverty.<br />
113
6. Conclusions and policy implications<br />
In Ethiopia agriculture and even the<br />
performance <strong>of</strong> macro-economy is taken<br />
hostage by the amount and distribution <strong>of</strong><br />
rainfall (Reference).The unreliable rainfall<br />
pattern in many parts <strong>of</strong> the country forced<br />
the farming population to adopt a risk-averse<br />
behavior, the behavior that limits the<br />
capacity <strong>of</strong> farmers to innovate and adopt<br />
farming technologies with potential <strong>of</strong><br />
boosting yield and income. For instance, the<br />
successive Ethiopian governments have tried<br />
to enhance the productivity <strong>of</strong> agriculture<br />
through modest investments in agricultural<br />
research and extension, mainly focused on<br />
seed and fertilizer technologies 3 . Several<br />
evaluation studies <strong>of</strong> these programs have<br />
underlined that the seed and fertilizer<br />
technologies were mostly successful in areas<br />
endowed with relatively ample moisture<br />
(reference). It was based on this revelation<br />
that the government, NGOs and farmers have<br />
made investments in agricultural water<br />
management such as small-scale irrigation<br />
schemes to extricate the agricultural sector<br />
and the economy at large form the shackles<br />
<strong>of</strong> unreliable rainfall. The main goals <strong>of</strong><br />
these investments in small-scale irrigation<br />
schemes were reducing food insecurity and<br />
incidence <strong>of</strong> rural poverty. This paper<br />
assessed whether the developed irrigation<br />
schemes have lived up to the expectation <strong>of</strong><br />
significantly reducing rural poverty and also<br />
inequality.<br />
The study was based on the extensive data<br />
set generated form a total <strong>of</strong> 11 small-scale<br />
irrigation schemes (i.e., 7 modern schemes<br />
and 4 traditional schemes), sampled from<br />
four major regional states <strong>of</strong> Ethiopia. For<br />
comparison purposes a sample <strong>of</strong> adjacent<br />
villages with no access to irrigation was also<br />
sampled. All in all 1024 farming households<br />
were randomly sampled from the selected<br />
irrigation schemes and rain-fed villages. It<br />
consisted <strong>of</strong> 627 irrigating households (<strong>of</strong><br />
which 382 are modern scheme irrigators and<br />
245 are traditional schemes irrigators) and<br />
397 purely rain-fed farmers. It is to be noted<br />
that even those households with access to<br />
irrigation do manage rain-fed plots. Only few<br />
farmers were found to be purely irrigators.<br />
From the results presented in this paper, the<br />
following conclusions may be made:<br />
• There is significant difference in<br />
incidence, depth and severity <strong>of</strong> poverty<br />
between households with access to<br />
irrigation and those without. However,<br />
the poverty incidence among the sample<br />
households is still unacceptably high<br />
irrespective <strong>of</strong> access to irrigation,<br />
indicating that poverty deeply entrenched<br />
in rural Ethiopia.<br />
• Poverty indices are responsive to<br />
irrigation typology and irrigation<br />
intensity. Among the irrigation the two<br />
irrigation typologies studied the poverty<br />
situation is relatively milder among<br />
modern irrigation scheme users.<br />
• Poverty indices were found also to be<br />
responsive to the irrigation intensity as<br />
measured by the size <strong>of</strong> irrigated area.<br />
Poverty incidence is significantly lower<br />
among households with higher irrigated<br />
area size. Due to demand outstripping the<br />
limited supply <strong>of</strong> irrigation service and<br />
due to considerations for equity, irrigation<br />
plots are rationed in Ethiopia. The limited<br />
differentiation observed in the size <strong>of</strong><br />
irrigated land among sample farmers is<br />
due to the prevalence <strong>of</strong> informal irrigable<br />
land markets. This calls for an<br />
investigation to determine a minimum<br />
irrigated area that needed to be allotted to<br />
a household for sustained poverty<br />
reduction and food insecurity eradication.<br />
• Poverty incidence is also related to the<br />
cropping pattern, indicating that mere<br />
access to irrigation would not bring the<br />
desired results. Poverty situation is more<br />
sever among farmers devoting significant<br />
proportion <strong>of</strong> their cropping land to food<br />
grains (cereals, oil seeds and pulses)<br />
irrespective <strong>of</strong> access to irrigation.<br />
Vegetable growers are better <strong>of</strong>f in terms<br />
<strong>of</strong> poverty situation. The implication is<br />
that irrigation project planners should<br />
consider the crop mix in future irrigation<br />
development plans.<br />
• Income inequality among households<br />
with access to irrigation is worse than that<br />
<strong>of</strong> those with out access. The implication<br />
is that even though accesses to irrigation<br />
moves up the mean income, farmers have<br />
different capacity in making better use <strong>of</strong><br />
the available irrigation water and<br />
therefore irrigation widens the income<br />
3 See for instance the evaluation reports <strong>of</strong> the<br />
recent Extension Package Projects<br />
114
gap 4 . However, the main policy concern<br />
in Ethiopia is reducing absolute poverty at<br />
this moment.<br />
• Finally, our study confirms that while the<br />
income inequalities among households<br />
without access to irrigation are lower, it<br />
was found that inequality among rainfed<br />
poor farmers is higher than those with<br />
access to irrigation!!!<br />
References<br />
Anyanwu, JC. 2005. Rural poverty in<br />
Nigeria: pr<strong>of</strong>ile, Determinats and Exit<br />
Paths. African Development Review,<br />
Vol 17(3): 435-460<br />
Carter M.R., Little D., Tewodaj Mogues,<br />
Workneh Negatu. 2007. Poverty Traps<br />
and natural Disasters in Ethiopia and<br />
Honduras.<br />
Coudouel, A. , Hentschel, J., Wodon, Q.<br />
2002. Poverty Measurement and<br />
Analysis, in the PRSP<br />
Sourcebook, World Bank, Washington<br />
D.C.<br />
Cortes, F.1997. Determinants <strong>of</strong> poverty in<br />
in Hogares, Mexico, 1992, Revista<br />
Mexicana de Sociologia, Vol(59)2: 131-<br />
160.<br />
Duclos J-Y, Abdelkrim Araar and Fortin, C.<br />
2006. DAD: a s<strong>of</strong>t ware for distributive<br />
analyses.<br />
Duclos J-Y, Abdelkrim Araar.2006. Poverty<br />
And Equity: Measurement, Policy And<br />
Estimation With Dad. Springer 233<br />
Spring Street New York, Ny 10013 &<br />
<strong>International</strong> Development Research<br />
Centre Po Box 8500, Ottawa, On,<br />
Canada K1g 3h9.<br />
Gang, I.N. K.Sen, Yun, M-S. 2004. Caste,<br />
Ethinicity and poverty in rural<br />
India(see:www.wm.edu/economics/semi<br />
nar/papers/gang.pdf)<br />
Jyotsna, J., Ravallion M, 2002. Does Piped<br />
<strong>Water</strong> Reduce Diarrhea for Children in<br />
Rural India? Journal <strong>of</strong> Econometrics<br />
4 See which studies agree with our findings and<br />
which ones do not?<br />
Lipton, M., and M. Ravallion. 1995. Poverty<br />
and policy. In Handbook <strong>of</strong> development<br />
economics, Vol. III, ed. J. Behrman and<br />
T. N. Srinivasan. Amsterdam: Elsevier.<br />
Lanjouw, P., Ravallion M.1994. Poverty and<br />
household size , policy research working<br />
paper 1332, World Bank, Washington<br />
DC.<br />
May J. 2001. An elusive consensus:<br />
definitions, measurement and analysis <strong>of</strong><br />
poverty. In: choices for the poor.<br />
Lessons from National Poverty<br />
Strategies, Grinspum, A. (ed.). UNDP.<br />
Qiuqiong H., Scott R, David D., Jikun H.<br />
2005. Irrigation, Poverty and Inequality<br />
in Rural China" . Australian Journal <strong>of</strong><br />
Agricultural and Resource Economics,<br />
Vol. 49( 2): 159-175<br />
Ravallion M. 2003. “Assessing the Poverty<br />
Impact <strong>of</strong> an Assigned Program.” In<br />
Francois Bourguignon and Luiz A.<br />
Pereira da Silva (eds.) The Impact <strong>of</strong><br />
Economic Policies on Poverty and<br />
Income Distribution: Evaluation<br />
Techniques and Tools, Volume 1. New<br />
York: Oxford University Press.<br />
Sen A. 2000. Social exclusion: concept,<br />
application, and scrutiny. Social<br />
Development Papers No. 1. Office <strong>of</strong><br />
Environment and Social Development,<br />
Asian Development Bank<br />
Szekely, M. 1998. The economics <strong>of</strong><br />
poverty, inequality and wealth<br />
accumulation in Mexico, St.Antony’s<br />
Series, Macmillan, New Yrok.<br />
Tarp F, Simler K, Matusse C, Heltberg R,<br />
Dava G.2002.The Robustness <strong>of</strong> Poverty<br />
Pr<strong>of</strong>iles Reconsidered<br />
UNDP. 2006. Human Development Report<br />
2006. Beyond scarcity: Power, poverty<br />
and the global water crisis. New York.<br />
World Bank. 2006. Ethiopia: Managing<br />
water resources to maximize sustainable<br />
growth. A World Bank <strong>Water</strong> Resources<br />
Assistance Strategy for Ethiopia. The<br />
World Bank Agriculture and Rural<br />
Development Department. Report NO.<br />
36000-ET. Washington D.C.<br />
115
World Bank 2005. <strong>Water</strong> Resources, Growth<br />
and Development. A working paper for<br />
discussion prepared by the World Bank<br />
for the Panel <strong>of</strong> Finance Ministers. The<br />
U.N. Commission on Sustainable<br />
Development 18 April 2005.<br />
World Bank. 1991. Assistance strategies to<br />
reduce poverty: a policy paper, World<br />
BankWashington DC.<br />
116
An Assessment <strong>of</strong> the financial viability and income impact <strong>of</strong> small<br />
scale irrigation in Ethiopia<br />
Godswill Makombe 1 , Fitsum Hagos 1 , Regassa E. Namara 2 and Seleshi Bekele Awulachew 1<br />
1<br />
<strong>International</strong> <strong>Water</strong> <strong>Management</strong> <strong>Institute</strong> (IWMI) Subregional Office for the Nile Basin and<br />
East Africa, Addis Ababa, Ethiopia<br />
2 <strong>International</strong> <strong>Water</strong> <strong>Management</strong> <strong>Institute</strong> (IWMI), Africa Regional Office. Accra, Ghana.<br />
g.makombe@cgiar.org<br />
Abstract<br />
Recently, there has been very little irrigation<br />
development in sub-Saharan Africa. The<br />
main reasons cited for this lack <strong>of</strong> interest in<br />
developing irrigation in sub-Saharan Africa<br />
is that irrigation projects are expensive and<br />
perform poorly compared to projects from<br />
other regions. However, when classified<br />
into success and failure projects, the sub-<br />
Saharan Africa success projects’ investment<br />
costs are not significantly higher than from<br />
other regions. African countries like<br />
Ethiopia, which has embarked on an<br />
agricultural led development program,<br />
aspire to use irrigation as a development<br />
strategy with small scale irrigation playing a<br />
key role in rural development. This study<br />
evaluates the financial performance <strong>of</strong> small<br />
scale irrigation using O & M and investment<br />
recovery, and the ability to replicate the<br />
investments. It is concluded that the<br />
systems are financially viable and provide a<br />
low cost development option for rural areas.<br />
1. Introduction<br />
Recently, there has been very little irrigation<br />
development in sub-Saharan Africa (SSA).<br />
The main reasons cited for this lack <strong>of</strong><br />
interest in developing irrigation in SSA is<br />
that it was believed that irrigation projects in<br />
SSA are expensive and perform poorly<br />
compared to projects from other regions<br />
(Inocencio et al., 2007). In a study <strong>of</strong> 314<br />
schemes <strong>of</strong> which 45 were from SSA, 51<br />
from Middle East and North Africa, 41 from<br />
Latin America and the Caribbean, 91 from<br />
South Asia, 68 from South East Asia and 18<br />
from East Asia, Innocencio et al (2007)<br />
showed that when average costs are<br />
considered, establishment costs for irrigation<br />
projects in SSA were significantly higher at<br />
an estimated USD14, 455 per ha compared<br />
to USD6, 590 for non-SSA projects. They<br />
further analyzed establishment costs by<br />
defining “Success” and “Failure” projects.<br />
In defining these they used 10 percent<br />
economic internal rate <strong>of</strong> return as a cut <strong>of</strong>f<br />
point. Those projects that achieved less than<br />
10 percent economic internal rate <strong>of</strong> return<br />
were classified as “Failure’ projects. The<br />
justification for using 10 percent was that<br />
this is the cut <strong>of</strong>f point used for evaluating<br />
public projects.<br />
After applying this classification, they found<br />
that for the “Failure” projects in SSA the<br />
establishment costs averaged USD 23,184<br />
compared to USD 10,624 for non-SSA<br />
projects, whereas for the SSA “Success”<br />
projects the average was USD 5,726<br />
compared to USD 4,603 for non-SSA<br />
projects. This difference was not<br />
117
statistically significant showing that for<br />
“Success” projects, the SSA projects are not<br />
more expensive than their non SSA<br />
counterparts. Their analysis also shows that<br />
the performance <strong>of</strong> both non SSA and SSA<br />
projects has improved over time.<br />
Commenting on this performance<br />
improvement, they conclude that: “The<br />
degree and speed <strong>of</strong> improvements have<br />
been deeper and faster in SSA than in non-<br />
SSA, so that the difference in unit cost and<br />
project performance between SSA and non-<br />
SSA, which used to be significant in earlier<br />
decades, has been reduced to the extent that<br />
there is no significant difference in the latest<br />
decade”. (Inocencio et al, 2007; pp 42)<br />
Some countries in Africa, have a renewed<br />
interest and some like Ethiopia have recently<br />
become interested in the role that irrigation<br />
can play in the development process.<br />
Agriculture plays a major role in Ethiopia<br />
contributing more than 44 percent to GDP<br />
over the period 1996 to 2006 (Government<br />
<strong>of</strong> the Republic <strong>of</strong> Ethiopia, 2006 a ). Most <strong>of</strong><br />
agriculture’s contribution is based on<br />
smallholders who produce cereals under<br />
rainfed production. This leaves the<br />
performance <strong>of</strong> the Ethiopian economy<br />
exposed to the vagaries <strong>of</strong> nature by<br />
depending on how good the rainfall season<br />
is (World Bank, 2006). The Ethiopian<br />
government, in its agricultural led<br />
development program, aspires to use<br />
irrigation as a major development<br />
component. Currently less than 5 percent <strong>of</strong><br />
the potentially 3.5 million ha <strong>of</strong> irrigable<br />
land is developed. The government <strong>of</strong><br />
Ethiopia aspires to develop about 430,061<br />
ha within the planning period <strong>of</strong> the Plan for<br />
Accelerated and Sustained Development to<br />
End Poverty (PASDEP) which spans the<br />
years 2005/05 to 2009/10 (Government <strong>of</strong><br />
the Republic <strong>of</strong> Ethiopia, 2006 b ). This<br />
planning document aspires to strongly<br />
develop and support small scale irrigation<br />
(SSI).<br />
Irrigation development in Ethiopia is<br />
classified using two systems. The first<br />
classification system uses the size <strong>of</strong><br />
command area irrigated as follows:<br />
1. Small scale irrigation systems 3000)<br />
The second classification uses a mix <strong>of</strong> the<br />
history <strong>of</strong> establishment, time <strong>of</strong><br />
establishment, management system and<br />
nature <strong>of</strong> the structures as follows:<br />
1. Traditional schemes: These are SSI<br />
systems which usually use diversion<br />
weirs made from local material which<br />
need annual reconstruction or from<br />
small dams. The canals are usually<br />
earthen and the schemes are managed<br />
by the community. Many are<br />
constructed by local community effort<br />
and have been functional for very long<br />
periods <strong>of</strong> time, some were recently<br />
constructed with the aid <strong>of</strong> NGOs and<br />
government.<br />
2. Modern schemes: These are SSI<br />
systems with more permanent<br />
diversion weirs made from concrete<br />
hence no need for annual<br />
reconstruction and small dams. The<br />
primary and sometimes secondary<br />
canals are made <strong>of</strong> concrete. They are<br />
community managed and have<br />
recently been constructed by<br />
government.<br />
3. Public: These are large scale<br />
operations constructed and managed<br />
by government. Sometimes, public<br />
schemes have out growers whose<br />
operations are partially supported by<br />
the large scheme.<br />
4. Private: These are privately owned<br />
systems that are usually highly<br />
intensive operations.<br />
Given our interest in SSI, which is<br />
distinguished from large scale irrigation by<br />
the farm level scale <strong>of</strong> operation, we<br />
therefore prefer to identify SSI irrigation<br />
systems using the second classification<br />
system and we study the first and second<br />
categories <strong>of</strong> this classification. Werfring<br />
(2004) describes the typology <strong>of</strong> SSI in<br />
Ethiopia in detail.<br />
118
Given the strong support envisaged for SSI<br />
development during the PASDEP planning<br />
period, it is important to provide insights<br />
into the viability <strong>of</strong> SSI investment in order<br />
to inform investment decisions.<br />
2. Objectives<br />
The main objective <strong>of</strong> the study is to provide<br />
a contribution that can be used to partially<br />
answer the question whether investment in<br />
SSI is a viable option for the proposed<br />
agricultural led industrialization<br />
development strategy by assessing the<br />
financial viability <strong>of</strong> existing SSI.<br />
Supplementary to the main objective we also<br />
estimate the importance <strong>of</strong> agriculture to<br />
rural smallholders by estimating how much<br />
income is derived from agriculture<br />
compared to <strong>of</strong>f farm sources. PASDEP<br />
aspires to develop and support SSI but the<br />
current farm level contribution <strong>of</strong> irrigation<br />
to the rural households is not known. This<br />
paper also aims to estimate the income<br />
impact <strong>of</strong> irrigation to smallholder producers<br />
3. Methodology<br />
The methodology we use is partially based<br />
on that used by Huang et al (2006) to<br />
evaluate benefits and costs <strong>of</strong> irrigation<br />
systems in China. We use gross margin<br />
analysis to estimate agricultural income for<br />
irrigators and non irrigators. Based on the<br />
gross margins, we estimate the income<br />
contribution <strong>of</strong> agriculture in general and<br />
irrigation in particular to the household.<br />
In order to assess the financial viability <strong>of</strong><br />
SSI we define three indices;<br />
1. O & M index = GMI / O & M.<br />
2. Financial performance index = GMI /<br />
(I + O& M.).<br />
3. Replicability index = GMI – (I + O &<br />
M) / (I + O & M).<br />
Where: GMI = Gross margin from irrigated<br />
production, O & M = Operation and<br />
maintenance costs, I = annual replacement<br />
cost all on a per ha basis. Annual<br />
replacement cost is computed as initial<br />
investment divided by project lifetime.<br />
Project lifetime is assumed to be 30 years<br />
(Innocencio, 2007). Verdier (1992) gives<br />
estimates <strong>of</strong> O & M for earth work (canals,<br />
drains, feeder roads with no tarmac) as 2<br />
percent <strong>of</strong> investment, and concrete<br />
structures (river diversion, weir and inlet)<br />
as 1 percent <strong>of</strong> initial investment. In this<br />
study O & M is assumed to be 10 percent <strong>of</strong><br />
annual replacement cost.<br />
The first index shows farm level ability to<br />
recover O & M costs. If farmers cannot<br />
recover O & M, it renders the scheme nonfinancially<br />
viable. The second index shows<br />
whether farmers recover both initial<br />
investment and operation and maintenance<br />
costs. Ideally, in a financially viable<br />
scheme, both investment and O & M should<br />
be recovered. The third index shows<br />
whether farmers can recover both initial<br />
investment and operation and maintenance<br />
costs and still have the potential financial<br />
capacity to reinvest in a similar SSI system,<br />
in other words, could the schemes<br />
potentially financially perpetuate<br />
themselves.<br />
4. Data collection<br />
Data were collected on the initial investment<br />
or establishment costs for the small scale<br />
irrigation systems. During the growing<br />
season May 2005 to March 2006, plot level<br />
data were collected from ten SSI schemes.<br />
Data were collected on cropping patterns,<br />
areas under crops, yields, marketed output,<br />
inputs, and input and output prices. Since<br />
farmers usually grow at least two crops,<br />
sometimes three on the irrigated plots, the<br />
cropped area is summed across seasons. On<br />
each <strong>of</strong> the schemes, a random sample <strong>of</strong> 50<br />
farmers was selected. A random sample <strong>of</strong><br />
50 non irrigating farmers was also selected<br />
from each site as a control. Data were also<br />
collected on non-agricultural income so as to<br />
estimate the contribution <strong>of</strong> agriculture and<br />
irrigation to household income.<br />
During the summer most <strong>of</strong> SSI systems<br />
grow cereals like teff, maize and barley<br />
under supplementary irrigation given that it<br />
rains during the summer. During the winter<br />
farmers grow a variety <strong>of</strong> vegetables<br />
including onions, tomatoes, and leafy green<br />
119
vegetables like spinach under full irrigation.<br />
Rainfed farmers’ production is primarily<br />
based on the staple cereals teff, wheat,<br />
barley and sorghum. Both rainfed and<br />
irrigating farmers also grow perennial crops<br />
like mango, banana, sugar cane which are<br />
sometimes intercropped with seasonal crops.<br />
Data were collected on all crops grown on a<br />
sampled farm.<br />
During data collection we took cognizance<br />
<strong>of</strong> the fact that most <strong>of</strong> the cereal production<br />
is kept for home consumption. The<br />
computation <strong>of</strong> gross margins was based on<br />
data collected on yields and the prices <strong>of</strong><br />
marketed output. For instance, if a farmer<br />
sold half <strong>of</strong> the wheat yield, we assumed<br />
that the prices realized in the market would<br />
have also been realized by the farmer if the<br />
rest had been sold. Although it is possible<br />
that if more produce is put on the market,<br />
prices tend to reduce we also argue that the<br />
shadow price attached to the retained output<br />
by the farmer has to be higher than the<br />
market price, assuming a rational farmer<br />
would sell if their shadow price is lower<br />
than the market price.<br />
Most farmers, both irrigating and rainfed<br />
mainly grow seasonal crops but some do<br />
grow perennial crops. Data on the inputoutput<br />
relationships <strong>of</strong> seasonal crops were<br />
easier to collect than those <strong>of</strong> perennial<br />
crops. For instance, there could be some<br />
perennial crops intercropped and spaced<br />
within a seasonal crop. The area was better<br />
estimated for the seasonal crop than for the<br />
perennial crop. Even though in some cases<br />
<strong>of</strong> modern irrigation schemes where most<br />
the area was under a perennial crop like<br />
banana, the input-output relationships were<br />
still much easier and accurate for seasonal<br />
crops since the operations on the perennials<br />
are not as regular and consistent as on the<br />
seasonal crops. Based on these two<br />
observations, this analysis only includes the<br />
sites with seasonal crops.<br />
5. Challenges in data collection<br />
During the process <strong>of</strong> collecting the data on<br />
establishment costs, we realized that the data<br />
on small scale irrigation systems is not<br />
systematically collected and kept in a central<br />
location. The data, if available, could be<br />
found for different schemes in different<br />
locations, for instance in different ministries.<br />
Sometimes data were found in one location,<br />
like a ministry, but different departments.<br />
Furthermore, some data is kept at federal<br />
level, whereas other data are kept at regional<br />
and sometimes district level. Some regional<br />
authorities pass information to the federal<br />
level, for instance to the Ministry <strong>of</strong> <strong>Water</strong><br />
Resources, but some simply do not. If a<br />
donor is involved in the project<br />
establishment, sometimes the donor keeps<br />
the records, if at all. This made the process<br />
<strong>of</strong> collecting establishment costs for even a<br />
small sample <strong>of</strong> SSI systems quite an<br />
arduous and time consuming task. Given<br />
this, even though we started <strong>of</strong>f with 10<br />
schemes, three traditional and 7 modern, we<br />
could only collect accurate investment<br />
information on all the modern schemes and<br />
only one traditional system. The Hare<br />
modern scheme was excluded from the<br />
sample for the reason <strong>of</strong> perennial crops as<br />
mentioned earlier so the final sample, for the<br />
financial viability analysis, was made up <strong>of</strong><br />
one traditional and six modern schemes.<br />
Even though the data is still not centralized<br />
for modern schemes, the likelihood that it<br />
exists and that it can be accessed is higher<br />
for modern schemes than for traditional ones<br />
since the modern schemes are usually built<br />
with some form <strong>of</strong> government involvement<br />
at regional or federal level. The data for<br />
most traditional schemes is very difficult to<br />
come by. Bruns (1991) notes that there is a<br />
serious lack on information on SSI.<br />
6. Income levels and dependence on<br />
agriculture and irrigation<br />
<strong>Table</strong> 2 summarizes the cropped area and<br />
incomes for the sample farmers. The<br />
average irrigated area for all the sample<br />
irrigated systems is 0.71 ha, but is slightly<br />
higher for modern schemes at 0.76 ha while<br />
it averages 0.58 ha for traditional systems.<br />
The highest irrigated area is at Endris<br />
modern irrigation system at 1.07 ha while<br />
the lowest is at Haiba modern irrigated<br />
120
system at 0.35 ha. Average cropped area for<br />
the rainfed farmers is 1.41 ha.<br />
<strong>Table</strong> 2 also shows the extent to which the<br />
sample households depend on agriculture for<br />
income. In table 1, total income is the sum<br />
<strong>of</strong> agricultural income, irrigated and non<br />
<strong>Table</strong> 1. Income dependence on irrigation for sample schemes. 1<br />
Region Site name Site type<br />
Area (ha)<br />
(Irrigation/Rainfed)<br />
Oromia<br />
Endris<br />
Modern<br />
[n=42]<br />
Traditional<br />
[n=41]<br />
Rainfed<br />
(n=55)<br />
Irrigated 2<br />
Rainfed<br />
1.07<br />
(1.20)<br />
1.88<br />
(1.46)<br />
0.65 1.40<br />
(0.81) (1.19)<br />
N/A 2.75<br />
(1.47)<br />
Income<br />
Total 3<br />
(USD)<br />
603<br />
(975)<br />
471<br />
(1198)<br />
360<br />
(288)<br />
Agricultural income<br />
% <strong>of</strong> total<br />
Rainfed Irrigated<br />
+<br />
irrigate<br />
d<br />
83 36<br />
90 38<br />
90 N/A<br />
Amhara<br />
Tigray<br />
Wedecha<br />
Belbella<br />
system<br />
Gologota<br />
Zengeny<br />
Tikurit<br />
Haiba<br />
Golgol<br />
Raya<br />
(Kara<br />
Adishu)<br />
Modern<br />
[n=51]<br />
0.46<br />
(0.35)<br />
1.13<br />
(0.68)<br />
771<br />
(493)<br />
92 44<br />
Traditional<br />
Filitino<br />
[n=52]<br />
0.56<br />
(0.41)<br />
0.94<br />
(0.47)<br />
570<br />
(404)<br />
98 45<br />
Rainfed<br />
N/A 1.36 468 99 N/A<br />
[n=57]<br />
(0.59) (315)<br />
Modern<br />
0.96 N/A 713 88 86<br />
[n=52]<br />
(0.41)<br />
(721)<br />
Rainfed<br />
N/A 1.39 304 71 N/A<br />
[n=55]<br />
(1.21) (203)<br />
Modern<br />
0.85 0.76 552 91 58<br />
[n=49]<br />
(0.77) (0.39) (633)<br />
Rainfed<br />
N/A 0.81 261 90 N/A<br />
[n=47]<br />
(0.46) (326)<br />
Traditional 0.47 0.90 576 95 55<br />
[n=55]<br />
(0.49) (0.86) (639)<br />
Rainfed<br />
N/A 1.18 277 96 N/A<br />
[n=42]<br />
(0.76) (164)<br />
Modern<br />
0.35 0.73 346 82 34<br />
[n=47]<br />
(0.28) (0.43) (297)<br />
Rainfed<br />
N/A 0.72 240 80 N/A<br />
[n=53]<br />
(0.37) (251)<br />
Modern<br />
1.03 1.86 1100 80 52<br />
[n=26]<br />
(0.60) (1.15) (1071)<br />
Rainfed<br />
N/A 1.59 247 100 N/A<br />
[n=22]<br />
(0.89) (320)<br />
All Modern 0.76 1.16 650 87 53<br />
[n=42]<br />
(0.71) (0.96) (728)<br />
All Traditional 0.58 1.09 536 95 45<br />
[n=42]<br />
(0.59) (0.87) (806)<br />
All Irrigated 0.71 1.13 616 89 50<br />
121
[n=42] (0.68) (0.93) (753)<br />
All rainfed N/A 1.41 318<br />
[n=42]<br />
(1.12) (278)<br />
1 ( ) = sdev; 2 = Gross irrigated area summed over the cropping seasons. 3= Total income (agricultural + non agricultural)<br />
irrigated plus non agricultural income.<br />
Income from agriculture and that from<br />
irrigation is expressed as a percentage <strong>of</strong><br />
total income to show the income dependence<br />
on agriculture and irrigation. For instance,<br />
the average annual income at Endris modern<br />
irrigation scheme is 603U SD. On average<br />
83 percent <strong>of</strong> the 603 USD is derived from<br />
agriculture (irrigated and non-irrigated) and<br />
36 percent <strong>of</strong> the 603 USD is derived from<br />
irrigated agriculture. Agricultural income at<br />
Endris modern irrigated system is about 500<br />
USD and income from irrigated production<br />
is about 217 USD, meaning irrigated<br />
agriculture contributes slightly more than 43<br />
percent <strong>of</strong> agricultural income, even though<br />
gross irrigated area is less than rainfed area.<br />
This makes agriculture a highly significant<br />
contributor to income for the smallholders,<br />
much more so than the dependence on<br />
agriculture depicted at national level. It also<br />
shows that irrigation, when made available,<br />
can play a significant role in contributing to<br />
the income <strong>of</strong> rural households particularly<br />
if we take into cognizance the small areas <strong>of</strong><br />
irrigation developed per household.<br />
For all irrigated systems, agricultural income<br />
constitutes about 90 percent <strong>of</strong> income,<br />
while it appears to contribute a slightly<br />
higher proportion on traditional irrigation<br />
systems. The lowest contribution <strong>of</strong><br />
agricultural income is at Gologota rainfed<br />
system at 71 percent while it is highest for<br />
Golgol Raya rainfed farmers at 100 percent.<br />
This may be explained by the fact that<br />
Golgota is close to the capital city, several<br />
towns and public schemes which <strong>of</strong>fer<br />
employment opportunities whereas Golgol<br />
Raya is several kilometers from the capital<br />
city and also has neither towns nor public<br />
schemes in its proximity, hence has limited<br />
<strong>of</strong>f farm employment.<br />
Irrigation contributes significantly to income<br />
at an average 50 percent for the whole<br />
88 N/A<br />
irrigated sample while it appears to be<br />
slightly lower at traditional irrigated<br />
schemes at 45 percent. Given the significant<br />
contribution <strong>of</strong> irrigated agriculture to<br />
income, it is essential to establish if the<br />
systems are financially viable both in the<br />
long and short term.<br />
One <strong>of</strong> the concerns raised by the World<br />
Bank (2006) is that, given the national<br />
dependence on rainfed agriculture, the<br />
performance <strong>of</strong> the economy is directly<br />
related to the quality <strong>of</strong> the rainfall season.<br />
We have demonstrated that this statement is<br />
even truer for rural smallholders whose<br />
incomes are a direct function <strong>of</strong> the quality<br />
<strong>of</strong> the rainfall season, given their high<br />
income dependence on agriculture.<br />
Irrigation, if it uses stored water, can be used<br />
to de-link the performance <strong>of</strong> the national<br />
economy, and more so the incomes <strong>of</strong> the<br />
rural poor smallholders from the quality <strong>of</strong><br />
the rainfall season.<br />
7. Investment levels for sample<br />
schemes<br />
<strong>Table</strong> 2 summarizes the investment levels<br />
for the sample SSI schemes. Constant 2006<br />
prices were used to make the figures<br />
comparable since the cropping data came<br />
from 2005/2006 growing season and the<br />
schemes were established at different times.<br />
The exchange rate <strong>of</strong> 1USD = 8.69 Birr<br />
which prevailed in 2006 (CIA, 2007) was<br />
used to convert the expenditures in Birr to<br />
USD. The average per ha initial investment<br />
cost is estimated at 2090 USD per ha. This<br />
estimate does not include possible<br />
contribution by the community on the form<br />
<strong>of</strong> labor and other materials. The data show<br />
that the systems are low financial investment<br />
irrigation projects as this is slightly under 40<br />
percent <strong>of</strong> the figure quoted by Inocencio et<br />
al (2007) for success projects in SSA.<br />
Annual O & M costs were estimated as 10<br />
percent <strong>of</strong> annual replacement costs.<br />
122
<strong>Table</strong> 2. Investment levels for small scale irrigation schemes in constant 2006 prices<br />
Region Scheme<br />
name<br />
Scheme<br />
type<br />
Year<br />
established<br />
Command<br />
area (ha)<br />
Investment (USD/ha)<br />
Initial<br />
Investment<br />
Annual<br />
replacement<br />
Modern 2003 104 3864.52 128.82 12.88<br />
Oromia Indris 1 Modern 1980 4 382 744.96 6 24.83 2.48<br />
Gologota 1 Modern 1962 4 850 870.53 7 29.02 2.90<br />
Wedecha Modern 1990 5 150 3436.89 8 114.56 11.46<br />
Belbella Traditional 1990 5 85 2544.65 9 84.82 8.48<br />
system 2 Filitino<br />
Amhara Zengeny 1 Modern 1997 4 270 1071.80 10 35.73 3.57<br />
Tigray Haiba 2 Modern 1997 4 250 2087.52 11 69.58 6.96<br />
Gol Gol<br />
Adishu) 3<br />
Raya<br />
(Kara<br />
<strong>Water</strong> source and delivery system: 1 River diversion and gravity, 2 Small dam and gravity, 3 Deep well and pressurized drip and sprinkler.<br />
Year established: 4= actual, 5=based on feasibility study<br />
Sources <strong>of</strong> Investment figures: 6. Indris Irrigation project. RID-OFFICE for C.Z. 1991. Porject proposal report. Information Brochure. Idris Irrigation<br />
Development project, 7. Average <strong>of</strong> sample modern schemes, 8. East Shoa <strong>Water</strong> Mineral and Energy Resources Department (1998). Goa Worka Small<br />
Scale irrigation Project Proposal Final Draft , 9. East Shoa <strong>Water</strong> Mineral and Energy Resources Department (1998). Filtino Small Scale irrigation<br />
Project Proposal Final Draft , 10. Personal communication Yenew Desalegn, Irrigation expert. Zengeny irrigation scheme, 11. Co-SAERT (1993).List <strong>of</strong><br />
irrigation sites constructed by Co-SAERT from 1987-1992 E.C. Unpublished., 12. Raya Valley ground water Development report. Unpublished.<br />
Note: Investment data for the traditional schemes at Endris and Tikurit t which are included in the income analysis, table 1, were not available.<br />
Investment costs differ by site and region. It<br />
is beyond this paper to establish the reasons<br />
for the variations but this might partly<br />
depend on the water source and delivery<br />
system. The scheme with the highest<br />
establishment cost, Gol Gol Raya, has deep<br />
wells as water source and uses a pressurized<br />
drip and sprinkler system. We also note that<br />
for the two Wedecha Belbella systems,<br />
which are close to each other, the traditional<br />
system investment is lower, most likely<br />
reflecting less concrete infrastructure<br />
installed on the traditional system.<br />
8. Assessing the financial viability <strong>of</strong><br />
SSI<br />
<strong>Table</strong> 3 summarizes the results <strong>of</strong> the<br />
financial viability analysis. Based on the<br />
three indices defined above we get some<br />
insights into the financial viability <strong>of</strong><br />
irrigated schemes. At the onset, we have to<br />
point out that this analysis only provides<br />
insights into the financial viability <strong>of</strong> these<br />
systems because it is based on one year’s<br />
data. Given the variation <strong>of</strong> agricultural<br />
performance from year to year, ideally more<br />
than one year’s data on gross margins would<br />
provide better insights. If more than one<br />
year’s data is available, one could do many<br />
scenario analyses, one <strong>of</strong> which could be to<br />
use both the performance and replicability<br />
indices with a flow <strong>of</strong> gross margins and<br />
investment costs.<br />
O&<br />
M<br />
123
<strong>Table</strong> 3. Performance ratios for small scale irrigation systems<br />
Region Scheme name<br />
Distribution within Performance Indices (%)<br />
Index<br />
Category<br />
O & M Financial Replicability<br />
Oromia<br />
Amhara<br />
Tigray<br />
Indris<br />
Gologota<br />
Wedecha<br />
Belbella<br />
system<br />
Zengeny<br />
Haiba<br />
Modern<br />
Traditional<br />
Gol Gol Raya (Kara<br />
Adishu)<br />
All Modern<br />
All<br />
that takes into account the time value <strong>of</strong><br />
money for both costs and returns flows in<br />
computing either an Internal Rate <strong>of</strong> Return<br />
and or Net Present Value. Alternatively,<br />
instead <strong>of</strong> computing an internal rate <strong>of</strong><br />
return, one could also assume that farmers<br />
could borrow money at a certain interest rate,<br />
for instance the rate at which the government<br />
borrows for development projects, annualize<br />
the cost flows by the interest rate and then<br />
evaluate whether the farmers earn a return<br />
higher than the interest rate. We do<br />
understand that such analyses would be more<br />
informative than the one done here.<br />
However, we believe that in the absence <strong>of</strong><br />
data to achieve such, our analysis is<br />
informative, even though at best, it gives us<br />
the performance <strong>of</strong> the systems for one year,<br />
say emulating the first year <strong>of</strong> the project.<br />
In our suite <strong>of</strong> indices, the first index shows<br />
whether the systems recover operation and<br />
maintenance costs. If it is negative, irrigated<br />
income is less than O & M, if it lies between<br />
0 and 1, O & M is only partially recovered<br />
and if it is greater than 1 O & M is fully<br />
recovered. The same interpretation applies<br />
for the financial performance ratio where<br />
instead <strong>of</strong> O & M the sum <strong>of</strong> annual<br />
replacement cost and O & M is used to<br />
determine cost recovery. The means for<br />
these indices shown in table 3 show that<br />
most <strong>of</strong> the schemes recover O & M. It is<br />
possible that we may have underestimated O<br />
& M, at 10 percent <strong>of</strong> investment, however,<br />
the degree to which most <strong>of</strong> the schemes<br />
recover O & M leaves a lot <strong>of</strong> room for O &<br />
M to increase substantially but still being<br />
recovered. The lowest O & M index mean<br />
value is 39 for Golgol Raya and the highest<br />
is 245 for Gologota. The low O & M index<br />
at Gologol Raya can be explained by the fact<br />
that the deep well water source combination<br />
with drip and sprinklers requires more<br />
maintenance than the diversion weir and<br />
gravity flow used in the other systems.<br />
Of importance is also the percentage<br />
distribution <strong>of</strong> farmers between the ratios<br />
across systems. For instance, at Endris<br />
modern irrigation scheme, 95 percent <strong>of</strong><br />
farmers fully cover their O & M costs, and<br />
90 percent cover both investment and O & M<br />
costs. In comparison at Golgol Raya 96<br />
percent fully cover O & M costs while 81<br />
percent cover investment plus O & M costs.<br />
In general, at all the schemes, 90 percent or<br />
more cover O & M costs while the lowest<br />
percentage covering investment costs is at<br />
Golgol Raya at 81 percent. This shows that<br />
farmers have the ability to pay for both O &<br />
M and investment costs.<br />
The replicability index asks the question if<br />
farmers were to pay for the current scheme<br />
and to concurrently invest in a similar one,<br />
could they manage it, in other words, could<br />
the systems potentially financially perpetuate<br />
themselves. The answer to this question is<br />
yes they could manage. The lowest<br />
percentage <strong>of</strong> farmers with this ratio greater<br />
than one is at Haiba with 60 percent,<br />
followed by Golgol Raya with 62 percent.<br />
We do understand that this analysis evaluates<br />
what could happen; otherwise the income<br />
earned from irrigation is subject to many<br />
competing family needs which generally do<br />
not include reinvestment. This is just a<br />
simple way <strong>of</strong> evaluating financial viability.<br />
From this simple analysis, the SSI systems<br />
are financially viable and could also<br />
potentially financially perpetuate themselves.<br />
Adams (1990) notes that, if they can be<br />
viable, SSI provide a low cost, low<br />
technology alternative to development.<br />
9. Conclusions<br />
The financial analysis shows that SSI<br />
projects in Ethiopia are very low investment<br />
ventures. From the three indices we used,<br />
we conclude that the systems are financially<br />
viable. However, it is important to note that<br />
only one year’s data has been used in this<br />
analysis and therefore is missing the<br />
variability in returns that is characteristic <strong>of</strong><br />
agricultural production. The financial<br />
viability performance is in line with the<br />
observations made by Inocencio et al (2007)<br />
<strong>of</strong> improved performance <strong>of</strong> recent irrigation<br />
projects in SSA. This makes investment in<br />
SSI a potentially viable low investment,<br />
development alternative.<br />
We show the degree to which Ethiopian<br />
farmers depend on agricultural income, and<br />
specifically on irrigated income and how this<br />
varies by location. The analysis shows that<br />
SSI development has potential for improving<br />
the well being <strong>of</strong> the poor farmers through its<br />
significant impact on incomes.<br />
It is important to note that all <strong>of</strong> the schemes<br />
evaluated in this study use diversion weirs,<br />
except one which uses underground water<br />
125
and another using a small dam, thus their<br />
performance dependends on the quality <strong>of</strong><br />
the rainfall season. The schemes using<br />
diversion weirs although cheap to establish,<br />
cannot achieve one <strong>of</strong> the government’s<br />
objectives <strong>of</strong> de-linking national economic<br />
performance and farmers’ incomes from the<br />
quality <strong>of</strong> the rainfall season. The financial<br />
viability <strong>of</strong> these SSI systems however,<br />
provides insights into the fact that stored<br />
water could also be potentially used for SSI<br />
to de-link irrigation performance for the<br />
quality <strong>of</strong> the season. However, this needs to<br />
be evaluated against the investment costs for<br />
the stored water.<br />
Finally, given the experience <strong>of</strong> collecting<br />
data on establishment costs for SSI, we<br />
conclude that data management and<br />
centralized systematic data collection <strong>of</strong> SSI<br />
investment and production data is definitely<br />
one area where there could be significant<br />
improvement in Ethiopia. Well organized<br />
data collection assists analyses that help<br />
inform decision making for policy makers.<br />
References<br />
Adams, W.M., (1990). “How beautiful is<br />
small? Scale Control and Success in<br />
Kenya Irrigation”, World development 18<br />
(10):1039-1323.<br />
Central Inteligence Agency (CIA) (2007)<br />
World Fact Book.<br />
Bruns, B. (1991). Intervention in Small<br />
Scale Irrigation: Some principles in<br />
Assessment.<br />
Paper presented at the Irrigation Studies<br />
center at Andalas University, West<br />
Sumatra, October 24, 1990. Published in<br />
Indonasian as “Intervensi pada Irigasi<br />
Slala Kecil: Beberapa Prinsip Penilaian”:<br />
pp 6-13.<br />
https://www.cia.gov/library/publications/<br />
the-world-factbook/geos/et.html<br />
Accessed July 12, 2007.<br />
Government <strong>of</strong> the Republic <strong>of</strong> Ethiopia.,<br />
2001a . <strong>Water</strong> Sector Strategy, Ministry<br />
<strong>of</strong> <strong>Water</strong> Resources, <strong>Water</strong> Sector<br />
Development Programme, 2002-<br />
2016. Irrigation Development<br />
Programme.<br />
Government <strong>of</strong> the Republic <strong>of</strong> Ethiopia.,<br />
2001b. Ethiopian <strong>Water</strong> Sector Strategy<br />
Government <strong>of</strong> the Republic <strong>of</strong> Ethiopia.,<br />
2006. National Accounts Statistics <strong>of</strong><br />
Ethiopia. National Economic Accounts<br />
Department. Ministry <strong>of</strong> Finance and<br />
Economic Development. November,<br />
2006a.<br />
Government <strong>of</strong> the Republic <strong>of</strong> Ethiopia.,<br />
2006. A Plan for Accelerated and<br />
Sustained Development to End Poverty.<br />
Ministry <strong>of</strong> Finance and Economic<br />
Development. November, 2006b.<br />
Huang, Q., Rozelle, S., Lohmar, B., Huang,<br />
J., and Wang, J. (2006). Irrigation,<br />
agricultural performance and poverty<br />
reduction in China. Food Policy (31) 30-<br />
52<br />
Inocencio, A., Kikuchi, M., Tonosaki, M.,<br />
Maruyama, A., Merrey, D., Sally, H., de<br />
Jong, I., (2007). Costs and performance<br />
<strong>of</strong> irrigation projects: A comparison <strong>of</strong><br />
sub-Saharan Africa and other developing<br />
regions. Colombo, Sri Lanka:<br />
<strong>International</strong> <strong>Water</strong> <strong>Management</strong><br />
<strong>Institute</strong>. 81 pp. (IWMI Research Report<br />
109).<br />
Verdier,Jean.1992. Maintenance des<br />
Périmètres irrigués. Ministère de la<br />
coopération et du développement, Paris.<br />
Werfring, A., 2004. Typology <strong>of</strong> Irrigation in<br />
Ethiopia. A thesis submitted to the<br />
University <strong>of</strong> Natural Resources and<br />
Applied Life Sciences Vienna. <strong>Institute</strong><br />
<strong>of</strong> Hydraulics and Rural <strong>Water</strong><br />
<strong>Management</strong> in partial fulfillment <strong>of</strong> the<br />
degree <strong>of</strong> Diplomingeieur.<br />
World Bank., 2006. Ethiopia: Managing<br />
water resources to maximize sustainable<br />
growth. A World Bank <strong>Water</strong> Resources<br />
Assistance Strategy for Ethiopia. The<br />
World Bank Agriculture and Rural<br />
Development Department. Report NO.<br />
36000-ET. Washington D.C.<br />
126
Importance <strong>of</strong> Irrigated Agriculture to the Ethiopian Economy:<br />
Capturing the direct net benefits <strong>of</strong> irrigation<br />
Fitsum Hagos 1 , Godswill Makombe 1 , Regassa E. Namara 2 , and Seleshi Bekele Awulachew 1<br />
1 <strong>International</strong> <strong>Water</strong> <strong>Management</strong> <strong>Institute</strong> (IWMI) Subregional Office for the Nile Basin and<br />
East Africa, Addis Ababa, Ethiopia<br />
2 <strong>International</strong> <strong>Water</strong> <strong>Management</strong> <strong>Institute</strong> (IWMI), Africa Regional Office. Accra, Ghana.<br />
f.hagos@cgiar.org<br />
Abstract<br />
Irrigation development is seen as one <strong>of</strong> the<br />
means to reduce poverty and promote<br />
economic growth. While a lot <strong>of</strong> effort is<br />
exerted towards irrigation development,<br />
little attempt is done to quantify the<br />
contribution <strong>of</strong> irrigation to national income<br />
in Ethiopia. This study is an attempt to<br />
quantify the actual and expected<br />
contribution <strong>of</strong> irrigation to the Ethiopian<br />
national economy for 2005/06 cropping<br />
season and 2009/10 using adjusted net gross<br />
margin analysis.<br />
Our results show that irrigation in the study<br />
sites generates an average income <strong>of</strong> about<br />
USD 323/ ha. This compares to the<br />
calculated gross margin for rainfed which is<br />
USD 147/ha. This indicates that after<br />
accounting for annual investment<br />
replacement cost net gross margin from<br />
irrigation is more than twice higher than<br />
gross margin from rainfed agriculture. On<br />
the contribution <strong>of</strong> irrigation to national<br />
economy, in 2005/06 smallholder irrigated<br />
agriculture contributed about 262.3 million<br />
USD. This accounts for about 4.46 percent<br />
<strong>of</strong> the agricultural GDP in 2005/2006 and<br />
1.97 percent <strong>of</strong> the total overall GDP. The<br />
total income earned from large scale<br />
schemes is estimated to be about 74.0<br />
million USD. This accounts for about 1.26<br />
percent <strong>of</strong> the agricultural and 0.5 percent <strong>of</strong><br />
the total GDP respectively. Overall, the<br />
contribution <strong>of</strong> irrigation to agricultural and<br />
total national GDP was about 5.7 and 2.5<br />
percent during the 2005/06 cropping season.<br />
As a result <strong>of</strong> expansion, by the year<br />
2009/2010 the expected contribution <strong>of</strong><br />
smallholder managed irrigation to national<br />
economy, assuming that exiting cropping<br />
pattern, and the average gross margin values<br />
for different crop categories are still valid, is<br />
expected to increase from USD 262.3<br />
million in 2005/2006 to about USD 414.2<br />
million in 2009/2010, which accounts to<br />
about 5.5 percent <strong>of</strong> the agricultural GDP<br />
and 2.3 <strong>of</strong> the overall GDP for the same<br />
year. On the other hand, the contribution<br />
coming from the large scale sugar growing<br />
estates in 2009/2010 is estimated to be USD<br />
217.5 million which amounts to 2.9 and 1.2<br />
percent <strong>of</strong> the agricultural and overall GDP<br />
respectively. Similarly the contribution<br />
coming from large scale commercial farms<br />
growing crops other than sugar cane is<br />
expected to increase to USD 35.8 million in<br />
2009/2010 which accounts to 0.4 and 0.2<br />
percent <strong>of</strong> the agricultural and overall GDP<br />
respectively. This implies that large scale<br />
commercial farms will contribute about 3.3<br />
and 1.4 <strong>of</strong> the agricultural and overall GDP<br />
respectively. In summary, our results<br />
indicate that under conservative estimates<br />
the future contribution <strong>of</strong> irrigation to<br />
agricultural and overall GDP will be about 9<br />
and 3.7 percent respectively.<br />
When some <strong>of</strong> the assumptions related to<br />
cropping pattern, input and output prices,<br />
127
and efficiency levels are relaxed, the<br />
contribution <strong>of</strong> smallholder managed<br />
irrigation to agricultural and overall GDP<br />
will vary between 4 to 6 and 1.8 to 1.9<br />
percent respectively. Similarly, the<br />
contribution from large scale irrigation to<br />
agricultural and overall GDP will be in the<br />
range <strong>of</strong> 3 to 6 and 1.2 to 2.5 percent<br />
respectively. Overall, the future contribution<br />
<strong>of</strong> irrigation to agricultural GDP will be in<br />
the range <strong>of</strong> 7 to 12 percent while the<br />
contribution to overall GDP will be in the<br />
range <strong>of</strong> about 4 percent. To enhance the<br />
contribution <strong>of</strong> irrigation to national<br />
economy, besides increasing the presence <strong>of</strong><br />
physical water infrastructure, however, there<br />
is a need to: i) improve provision <strong>of</strong><br />
agricultural inputs, ii) promote high value<br />
crops through the extension system, iii)<br />
create good market conditions, and iv)<br />
increase the efficiency <strong>of</strong> small and large<br />
schemes.<br />
1. Introduction<br />
Unreliable rainfall, recurrent drought and<br />
limited use <strong>of</strong> the available water resources,<br />
coupled with heavy reliance on rain-fed<br />
subsistence agriculture, have contributed<br />
adversely to the economy <strong>of</strong> Ethiopia. In<br />
fact, the World Bank (2006) estimates that<br />
unmitigated hydrological variability<br />
currently costs the economy over one-third<br />
<strong>of</strong> its growth potential and leads to 25<br />
percent increase in poverty rates. Hence,<br />
enhancing public and private investment in<br />
irrigation development has been identified<br />
as one <strong>of</strong> the core strategies aimed to de-link<br />
economic performance from rainfall and to<br />
enable sustainable growth and development<br />
(World Bank 2006; MoWRa, 2002; MoWR,<br />
2002b; MOFED, 2006). In the government<br />
policy documents, irrigation development is<br />
identified as an important tool to stimulate<br />
sustainable economic growth and rural<br />
development and is considered as a corner<br />
stone <strong>of</strong> food security and poverty reduction<br />
(MoWRa, 2002; MoWR, 2002b; MOFED,<br />
2006).<br />
Ethiopia is said to have an estimated<br />
irrigation potential <strong>of</strong> 3.5 million hectares<br />
(Awulachew et al. 2007). However, the total<br />
estimated area <strong>of</strong> irrigated agriculture in the<br />
country in 2005/2006 was 625,819 ha,<br />
which in total constitutes about 18 percent<br />
<strong>of</strong> the potential (MOWR, 2007).<br />
Irrigation is expected to contribute to the<br />
national economy in several ways. At the<br />
micro level, irrigation could lead to an<br />
increase in yield per hectare and subsequent<br />
increases in income, consumption and food<br />
security (Bhattarai and Pandy, 1997;<br />
Vaidynathanet al., 1994; Ahmed and<br />
Sampath, 1992; Lipton et al. 2003; Hussain<br />
and Hanjra, 2004). Furthermore, Hussain<br />
and Hanjra (2004), based on their studies in<br />
Asia, indicated that irrigation benefits the<br />
poor through higher production, higher<br />
yields, lower risks <strong>of</strong> crop failure, and<br />
higher and year round farm and non-farm<br />
employment. Irrigation enables<br />
smallholders to adopt more diversified<br />
cropping pattern, and to switch from low<br />
value subsistence production to high-value<br />
market-oriented production (Hagos et al.,<br />
2007).<br />
Macro level impacts manifest themselves<br />
through agricultural impacts on economic<br />
growth. At the aggregate level irrigation<br />
investments act as production and supply<br />
shifters, and have a positive effect on<br />
economic growth. Studies in Asia show that<br />
agricultural growth serves as an “engine” <strong>of</strong><br />
economic growth, and irrigation-led<br />
technological changes are the key drivers<br />
behind productivity growth in the<br />
agricultural sector (Hussain and Hanjra<br />
2004; Alagh, 2001; Dhawan, 1988). Other<br />
effects <strong>of</strong> irrigation on changes in the<br />
environment and other social impacts have<br />
been reported in the literature such as on the<br />
economic value <strong>of</strong> wetlands (Barbier and<br />
Thompson, 1998); employment impact <strong>of</strong><br />
irrigation (Berck and H<strong>of</strong>fman, 2002) and<br />
non-farm sector benefits from irrigation<br />
investment (Bhattarai, et al. 2003).<br />
128
The methodological approaches applied to<br />
capture these diverse impacts <strong>of</strong> irrigation<br />
varied from linear programming, to<br />
regression models, to partial equilibrium<br />
models, to economy–wide models such as<br />
input-output models, Social Accounting<br />
Matrices (SAM) and Computable General<br />
Equilibrium (CGE) Models. For instance,<br />
Bhattarai and Pandy (1997) used a linear<br />
programming technique to isolate the impact<br />
<strong>of</strong> irrigation from other factors (such as road<br />
and market) on crop production and<br />
productivity in Nepal. Vaidynathan et al.<br />
(1994) used regression analysis at the<br />
aggregate level to assess the difference in<br />
land productivity between irrigated and un<br />
irrigated lands in India. Ahmed and Sampath<br />
(1992) used a partial equilibrium model that<br />
incorporates demand and supply shifts to<br />
assess the impact <strong>of</strong> irrigation on efficiency<br />
and equity in Bangladesh. Makombe (2000)<br />
used a similar partial equilibrium model to<br />
estimate the impact <strong>of</strong> irrigation induced<br />
technological change in Zimbabwe. Bell<br />
and Hazel (1980) used SAM and a semi<br />
input-out model to measure the magnitude<br />
and incidence <strong>of</strong> regional downstream<br />
effects <strong>of</strong> the Muda irrigation project in<br />
Malaysia. While there are various studies<br />
that have tried to capture the diverse impacts<br />
<strong>of</strong> irrigation, there are, however, few studies<br />
that attempted to capture the direct<br />
contribution <strong>of</strong> irrigation to the national<br />
economy. One such study is by Doak et al.,<br />
(2004) and Doak (2005) which develop a<br />
simple methodological framework to<br />
measure the economic value <strong>of</strong> irrigation to<br />
the New Zealand’s National economy. Our<br />
study builds on the approach followed by<br />
Doak et al., (2004) and Doak (2005).<br />
The objective <strong>of</strong> this study, hence, was to<br />
estimate the net contribution <strong>of</strong> irrigation to<br />
GDP at the farm gate. This study attempted<br />
only to capture the direct benefits <strong>of</strong><br />
irrigation to national economy for a given<br />
year (2005/2006) using a farm gate value<br />
approach and made forecasts on its future<br />
contribution based on the projected annual<br />
growth-rate <strong>of</strong> irrigated areas in the National<br />
Irrigation Development Program (MoWR,<br />
2002b; MOFED, 2006) and associated<br />
changes in cropping patterns. In so doing,<br />
we tried to determine how much irrigation is<br />
contributing and will contribute to national<br />
income relative to rain fed agriculture. This<br />
method <strong>of</strong> adjusted gross margin analysis<br />
accords with the System <strong>of</strong> Environmental<br />
and Economic Accounts (SEEA)<br />
recommendations (UN, 2003) and provides<br />
a “best estimate” <strong>of</strong> the change in GDP<br />
generated by irrigation at the farm gate<br />
(Doak, 2005). However, it should be noted<br />
that a large number <strong>of</strong> estimates and<br />
assumptions are required to estimate the<br />
impact on GDP, and the results should be<br />
interpreted with caution. In addition, the<br />
increased output from irrigated farms will<br />
have different multiplier effects in the wider<br />
economy, so the total impact <strong>of</strong> irrigation on<br />
GDP is likely to be higher than the farm gate<br />
impact.<br />
For estimating the contribution <strong>of</strong><br />
smallholder irrigation we relied on data<br />
collected during the 2005/6 season from<br />
eight smallholder irrigation schemes in<br />
four regional states in Ethiopia, namely<br />
Amhara, Oromia, Southern Nations<br />
Nationalities and Peoples Regional<br />
Government (SNNPR) and Tigray. The data<br />
collected included command area, actual<br />
cultivated area cropping pattern, output<br />
types and value, input use and input<br />
expenditure and information on the level <strong>of</strong><br />
operation, (e.g. fully operational, medium,<br />
low or not operational). Moreover, we used<br />
secondary data gathered from selected large<br />
scale commercial farms in the Awash and<br />
Nile Valleys and price data and production<br />
data from the Central Statistical Authority<br />
(CSA).<br />
The research report is presented as follows.<br />
Section two outlines the methodology used<br />
to value the contribution <strong>of</strong> irrigation to the<br />
national economy followed by presentation<br />
<strong>of</strong> data sources in section three. In section<br />
four we present an overview <strong>of</strong> the<br />
contribution <strong>of</strong> agriculture to national<br />
economy while section five outlines the<br />
hitherto irrigation development in Ethiopia<br />
129
followed by, in section six and seven, by<br />
presentation <strong>of</strong> agricultural production and<br />
cropping pattern, both rainfed and irrigated<br />
respectively. In section eight, we present the<br />
envisaged future expansion <strong>of</strong> irrigated<br />
agriculture based on the National Irrigation<br />
Development Program (IDP). Sections nine<br />
and ten present the results <strong>of</strong> the valuation,<br />
current and future, to national economy. In<br />
section eleven, we conduct sensitivity<br />
analysis to take account <strong>of</strong> possible changes<br />
in cropping patterns and crop cover, in input<br />
and output prices and improvements in<br />
efficiency levels. The final part concludes<br />
and draws some policy recommendations.<br />
2. Methodology in valuing the<br />
contribution <strong>of</strong> irrigation for the<br />
national income<br />
The methodology calculates the contribution<br />
<strong>of</strong> existing irrigation to gross domestic<br />
product (GDP) by taking into account the<br />
alternative rainfed production from the same<br />
area <strong>of</strong> land. The method adopted follows a<br />
“with minus without” irrigation approach,<br />
adjusted for changes in farm type and scale.<br />
Following Doak (2005) the formula is:<br />
Farm gate GDP due to irrigation = GDP<br />
with irrigation – GDP without irrigation.<br />
= (irrigated land use mix * (irrigated Gross<br />
Margin – fixed costs)) – (rainfed land use<br />
mix * (rainfed Gross Margin – fixed costs)).<br />
(1)<br />
A gross margin is the total revenue<br />
associated with a particular production<br />
(income) less the costs that clearly vary in<br />
direct proportion to the level <strong>of</strong> production -<br />
the direct or variable costs associated with<br />
the enterprise. Gross margin analysis is an<br />
accepted tool commonly used in the<br />
evaluation <strong>of</strong> farming enterprises. It has<br />
been used for the evaluation <strong>of</strong> the costs and<br />
benefits <strong>of</strong> irrigation in cost benefit analysis.<br />
Assessing the change to the gross margin<br />
per unit area as a result <strong>of</strong> irrigation and then<br />
scaling this appropriately by the total<br />
affected area provides an initial estimate <strong>of</strong><br />
the GDP change (at the farm gate) likely to<br />
occur as a result <strong>of</strong> irrigation.<br />
In the Ethiopian context, farmers use full<br />
irrigation to grow crops during the dry<br />
season when crop production from rain is<br />
not possible. This implies that households<br />
get additional income from irrigation to that<br />
what farmers get during the main cropping<br />
season. Under small scale irrigation system,<br />
irrigation does not replace rain fed<br />
agriculture but supplements it. Large scale<br />
schemes, however, are under full irrigation<br />
throughout the year. We made adjustments<br />
in the methodology to take account <strong>of</strong> this<br />
difference between small and large scale<br />
irrigation. Hence, for a given farmer i under<br />
smallholder agriculture,<br />
NetIncomei<br />
= Netmarg inirrig<br />
+ Netmargin<br />
(2),<br />
where the total income constitutes <strong>of</strong> income<br />
from rainfed and income from irrigation.<br />
The gross margins (GMs) were determined<br />
for farm types in each <strong>of</strong> the schemes and<br />
aggregated to a scheme scale throughout<br />
Ethiopia based on the data obtained from the<br />
household surveys and secondary sources.<br />
The gross margins are those for the 2005/06<br />
season and are defined as the revenue<br />
generated from the activity less the direct<br />
costs <strong>of</strong> producing the revenue. The Gross<br />
Margins were adjusted to account for the<br />
differences in overheads (fixed costs) <strong>of</strong><br />
land uses with and without irrigation, and<br />
also for differences in shadow prices <strong>of</strong><br />
labor and oxen in irrigated and rain fed<br />
systems (for the small scale schemes).<br />
Shadow prices <strong>of</strong> labor and oxen were<br />
estimated from the production data by first<br />
estimating labor elasticity, which was used<br />
to estimated the marginal value <strong>of</strong> labor, in a<br />
production function framework (for details<br />
see Jacoby, 1993).<br />
The “without irrigation” land use is that<br />
which would now exist if irrigation had not<br />
been developed, rather than if irrigation was<br />
rf<br />
130
no longer available for that particular land.<br />
This was estimated based on GM <strong>of</strong> rain fed<br />
agriculture around the scheme or average<br />
GM value for all rainfed, if data for adjacent<br />
rainfed plots were not available. The value<br />
<strong>of</strong> irrigated production and the value <strong>of</strong><br />
production from the rainfed use that would<br />
be most likely if there was no irrigation were<br />
derived from the survey data for each<br />
scheme. For the large scale schemes, we<br />
explored the dominant rainfed production<br />
type and estimated average gross margins<br />
per ha from the household survey.<br />
The assumption here is that all <strong>of</strong> the now<br />
irrigated lands would have been under some<br />
sort <strong>of</strong> rain-fed farming had it not been<br />
converted to irrigation plots. There are also<br />
some other possible scenarios. It is possible<br />
that some <strong>of</strong> the current irrigated lands are<br />
hitherto uncultivated lands or new<br />
openings 5 . If this is true, the methodology<br />
we adopted may underestimate the true<br />
contribution <strong>of</strong> irrigation development<br />
without considering the environmental costs<br />
<strong>of</strong> such changes. It may be that the current<br />
irrigated land may have been used for<br />
grazing livestock 6 . The direction <strong>of</strong> bias on<br />
our estimation depends on whether the gross<br />
margin per unit area from livestock rearing<br />
is greater or less than the gross margin per<br />
unit area for cropping under rainfed. While a<br />
meaningful analysis should take account <strong>of</strong><br />
these diverse scenarios, the lack <strong>of</strong> data on<br />
livestock productivity under pastoral<br />
production in Ethiopia and environmental<br />
costs <strong>of</strong> land use change made it impossible.<br />
Hence, the approach described above (in<br />
equations 1 and 2) was used to assess the<br />
current and future contribution <strong>of</strong> irrigation<br />
to the national economy.<br />
For the fixed cost, we calculated an annual<br />
replacement cost all on per ha basis. Annual<br />
replacement cost was computed as initial<br />
investment divided by project lifetime (25<br />
5 The development <strong>of</strong> Finchaaa Sugar estate is a<br />
case in point.<br />
6 The development irrigation in the middle and<br />
lower Awash is a case in point.<br />
years) and O & M was assumed to be 10<br />
percent <strong>of</strong> annual replacement for small<br />
scale schemes and 50 yrs and 5 percent for<br />
large scale schemes (Inocencio et al., 2007).<br />
In estimating the future contribution <strong>of</strong><br />
irrigation to national economy, we used<br />
information about the expected growth <strong>of</strong><br />
the irrigation sector during 2005/2006 to<br />
2009/2010 based on the country’s Irrigation<br />
Development Program (IDP) (MoWR, 2006;<br />
World Bank, 2006; MOFED, 2006). These<br />
policy documents outline how irrigation is<br />
expected to develop over the planning<br />
period. The details are provided in section<br />
eight <strong>of</strong> this paper.<br />
A complex issue related to the calculation <strong>of</strong><br />
the future contribution <strong>of</strong> irrigation to the<br />
national economy is how to address the<br />
impact <strong>of</strong> increased output on price. Gross<br />
margin calculations generally assume that a<br />
change in output has no effect on prices.<br />
While for small-scale changes at the<br />
individual farm level this may well<br />
approximate the truth 7 , the large-scale land<br />
use changes generated by irrigation on the<br />
national scale are believed to be sufficient to<br />
have some measurable effect on output<br />
prices. Lipton et al. (2003) state that if<br />
irrigation leads to increases in staples or<br />
non-staple food output then this may result<br />
in lower prices for staples and food in<br />
imperfectly open economies or if there are<br />
significant transport costs from food-surplus<br />
area to towns or food deficit areas. For crops<br />
that are largely dependent on the local<br />
market and for which there is little<br />
opportunity to develop large-scale export<br />
markets increases in production tend to have<br />
a dramatic effect on price (Doek, et al.,<br />
2004). A complicating factor in assessing<br />
the impact <strong>of</strong> future irrigation-driven<br />
increases in output on price is also that<br />
growers <strong>of</strong> annual crops are very flexible in<br />
the combinations <strong>of</strong> crops that they choose<br />
to grow (Doak et al., 2004). If, for example,<br />
7 Even at the small scale, we observe increases in<br />
crop output <strong>of</strong> tomato and onion leading to<br />
crashes in prices.<br />
131
potatoes are in over supply, growers would<br />
switch to another crop which proves more<br />
pr<strong>of</strong>itable. The farmer is, therefore, able to<br />
choose the most pr<strong>of</strong>itable product to<br />
produce, and to increase the value <strong>of</strong> the<br />
product e.g., by producing at a time <strong>of</strong> the<br />
year when price is highest, or by increasing<br />
the quality <strong>of</strong> the product (for example,<br />
through improved fruit size). There is also<br />
the possibility that as irrigation expands, it<br />
tends to get more government support e.g.<br />
extension and hence intensification can<br />
increase. This upside potential has by and<br />
large been included in the analysis. We<br />
suggested possible scenarios in changes in<br />
cropping patterns. However, it is difficult to<br />
exactly forecast the possible future changes<br />
in cropping patterns. The crop combinations<br />
and gross margins used in the analysis are,<br />
therefore, only indicative <strong>of</strong> a range <strong>of</strong><br />
possible crops with similar outcomes.<br />
To quantify the price effect <strong>of</strong> irrigation<br />
development we assumed different price<br />
scenarios based on certain assumptions<br />
about demand growth and output growth. In<br />
the light <strong>of</strong> all these considerations, we<br />
assumed different price changes in price <strong>of</strong><br />
the major produce when assessing the<br />
impact <strong>of</strong> future irrigation driven increases<br />
in output. This is described in detail in<br />
section ten <strong>of</strong> this report.<br />
Finally, there are a host <strong>of</strong> multiplier effects<br />
expected to manifest themselves with<br />
irrigation development, including expansion<br />
<strong>of</strong> the <strong>of</strong>f-farm sector, provision <strong>of</strong> inputs to<br />
industry and better nutrition for rural<br />
households. These effects are not captured<br />
in this study. Our calculated GDP<br />
represents, at best, the return to producers’<br />
labor and capital (including capital tied up in<br />
land). It is also worth noting that the high<br />
income sector <strong>of</strong> irrigation (emerging flower<br />
farming and capital intensive commercial<br />
farms are not included in our assessment.<br />
Our method therefore underestimates the<br />
true contribution <strong>of</strong> irrigation to GDP.<br />
3. Data sources<br />
This study made use <strong>of</strong> both primary data on<br />
smallholder production collected from<br />
household surveys and data from various<br />
secondary sources. The household survey<br />
was part <strong>of</strong> a comprehensive nationwide<br />
study on the impacts <strong>of</strong> irrigation on poverty<br />
and environment run between 2004 and<br />
2007 in Ethiopia. It was a component <strong>of</strong> the<br />
Impact <strong>of</strong> Irrigation on Poverty and<br />
Environment (IIPE) research project run by<br />
the <strong>International</strong> <strong>Water</strong> <strong>Management</strong><br />
<strong>Institute</strong> (IWMI) with support from the<br />
Austrian government. The survey, which<br />
investigated the impact <strong>of</strong> irrigation on<br />
poverty and irrigation’s contribution to<br />
national economy, addressed a total sample<br />
size <strong>of</strong> 1024 households from eight<br />
irrigation sites in 4 regional states involving<br />
traditional and modern and rainfed systems.<br />
The total sample comprised 397 households<br />
practicing purely rainfed agriculture and 627<br />
households (382 modern and 245<br />
traditional) practice irrigated agriculture.<br />
These households operate a total <strong>of</strong> 4,953<br />
plots (a household operating five plots on<br />
average). The data collected include<br />
demographics, asset holdings, access to<br />
services, plot level production and sale and<br />
input use data (distinguished between<br />
irrigated and rain fed), constraints to<br />
agricultural production and household<br />
perceptions about the impact <strong>of</strong> irrigation on<br />
poverty, environment and health and other<br />
household and site specific data. The data<br />
were collected for the 2005/2006 cropping<br />
season. We used part <strong>of</strong> this comprehensive<br />
dataset for the analysis here.<br />
We also used secondary data from various<br />
sources. From the large scale schemes we<br />
gathered data on investment cost/initial<br />
capital outlays, cost <strong>of</strong> production, output<br />
and revenue among others. From <strong>of</strong>ficial<br />
documents such as the policy documents <strong>of</strong><br />
the government (MoWR, 2006; World<br />
Bank, 2006; MoFED, 2006) we gathered<br />
developed and projected irrigation<br />
development plans and we used land<br />
utilization and crop cover data from the<br />
Central Statistics Agency (CSA, 2006).<br />
Furthermore, for specific data on future<br />
132
expansion and new development plans on<br />
sugar estates we used the revised master<br />
plan <strong>of</strong> the Ethiopian Sugar Development<br />
Agency (ESDA, 2007). The plans for the<br />
development <strong>of</strong> small scale irrigation are<br />
prepared by the regional governments and<br />
are compiled by the Ministry <strong>of</strong> Agriculture<br />
and Rural Development that oversees the<br />
development <strong>of</strong> the sub-sector.<br />
4. Contribution <strong>of</strong> agriculture to<br />
national economy<br />
Agriculture is the main stay <strong>of</strong> the Ethiopian<br />
economy. It is major contributor to the<br />
national economy both in terms <strong>of</strong> income,<br />
employment and generation <strong>of</strong> export<br />
revenue. Its contribution to GDP, although<br />
showing slight decline over the years, has<br />
remained very high, about 44 percent. From<br />
among the sub-sectors <strong>of</strong> agriculture, crop<br />
production is major contributor to GDP<br />
accounting for about 28 percent in 2005/06.<br />
The most important crops grown and their<br />
area coverage are described in section six<br />
and seven.<br />
<strong>Table</strong> 1: Contribution <strong>of</strong> Agriculture to GDP (in 000 Birr) (1995/96-2005/06)<br />
Agri<br />
Year<br />
GDP at Current<br />
Market Prices<br />
Agricultural<br />
GDP<br />
Crop GDP<br />
contribution<br />
to GDP<br />
Crop<br />
contribution<br />
to GDP<br />
1995/96 53,597,593 28,613,235 17,286,203 0.53 0.32<br />
1996/97 55,520,011 28,767,766 16,764,422 0.52 0.30<br />
1997/98 53,391,285 25,214,701 14,505,336 0.47 0.27<br />
1998/99 57,368,203 25,397,662 15,500,013 0.44 0.27<br />
1999/00 64,397,933 28,444,382 17,713,717 0.44 0.28<br />
2000/01 65,687,343 27,750,560 16,333,285 0.42 0.25<br />
2001/02 63,461,569 24,460,704 13,135,220 0.39 0.21<br />
2002/03 68,898,037 26,207,930 14,963,341 0.38 0.22<br />
2003/04 81,754,514 32,229,991 19,746,954 0.39 0.24<br />
2004/05 98,397,946 42,196,370 27,349,050 0.43 0.28<br />
2005/06 115,589,480 50,893,906 32,246,432 0.44 0.28<br />
Source: FDRE (2006).<br />
5. Overview <strong>of</strong> irrigation development<br />
in Ethiopia<br />
Ethiopia is said to have an estimated<br />
irrigation potential <strong>of</strong> 3.5 million hectares <strong>of</strong><br />
irrigation land (Awulachew et al. 2007) 8 .<br />
The total estimated area <strong>of</strong> irrigated<br />
agriculture in the country is about in<br />
2005/2006 was 625,819 ha, out <strong>of</strong> which<br />
483, 472 is from the traditional irrigation,<br />
56032 ha is from modern small scale,<br />
8 Other estimates put it in the order <strong>of</strong> 3.7<br />
million hectares (MoWR, 2002; World<br />
Bank, 2006).<br />
133
86,612 ha is from modern medium and large<br />
scale schemes. Out <strong>of</strong> the total irrigated<br />
area, 197,250 ha is covered by the so-called<br />
modern schemes while the remaining area<br />
traditional schemes (MoWR, 2002). The<br />
total and modern irrigated area account for<br />
about 17 and 5 percent <strong>of</strong> the potential<br />
respectively. The total cultivated land area,<br />
rainfed included, in 2005/06 was about<br />
12.28 million hectares (MOFED, 2006). The<br />
total current irrigated land area, hence,<br />
accounts for about 5 percent <strong>of</strong> the total<br />
cultivated land. When the traditional<br />
schemes are not considered, the irrigated<br />
land area covers a minimum <strong>of</strong> about 1.6<br />
percent <strong>of</strong> the total cultivated area.<br />
There is high spatial variability in water<br />
resources endowment and development in<br />
the country. Hence, ninety percent <strong>of</strong> the<br />
country’s water resources development<br />
occurs in four river basins (World Bank,<br />
2006). Much <strong>of</strong> the formal irrigation<br />
developments are located in the Awash<br />
Basin, where about 50 medium- and large<br />
scale irrigated farms are located (Fig. 1).<br />
Irrigation Schemes by River Basin<br />
MEREB GASH<br />
Existing Irrigation Schemes<br />
Large Scale<br />
Medium Scale<br />
Small Scale<br />
Rivers<br />
Lakes<br />
TEKEZE<br />
DENAKIL<br />
ABBAY<br />
AYISHA<br />
AWASH<br />
BARO AKOBO<br />
OGADEN<br />
WABI SHEBELE<br />
OMO GIBE<br />
·<br />
RIFT VALLEY<br />
GENALE DAWA<br />
150<br />
0 300 600<br />
Kilometers<br />
Fig.1: Existing Irrigation Schemes in various river basins in Ethiopia (Source: Awulachew, et al.<br />
2007)<br />
In terms <strong>of</strong> regional distribution, Afar and<br />
Oromia have the bulk <strong>of</strong> the share in<br />
irrigated agriculture accounting for 45 and<br />
31 percent <strong>of</strong> the total irrigated area.<br />
Amhara, SNNPR and Tigray account for 8,<br />
7 and 5 percent <strong>of</strong> the total irrigated area<br />
respectively (Awulachew, et al. 2007).<br />
.<br />
6. Agriculture production and<br />
cropping pattern<br />
Based on Central Statistics Agency’s<br />
2005/06 agricultural sample survey (CSA,<br />
2006), the major crops during the main rainy<br />
season (a.k.a meher season) are cereals,<br />
pulses, oilseeds, vegetables, root crops, fruit<br />
crops, stimulant crops 9 and sugar cane.<br />
Cereals are the dominant food crops<br />
covering 58 % <strong>of</strong> the land area 10 and 87 %<br />
<strong>of</strong> the volume <strong>of</strong> grain production 11 (See Fig<br />
2). The major cereal crops include: teff<br />
(Eragrostis tef), barley (Hordeum vulgare),<br />
wheat (Triticum durum), maize (Zea mays),<br />
sorghum (Sorghum bicolour) and finger<br />
9 Stimulant crops consist <strong>of</strong> Chat, c<strong>of</strong>fee and<br />
hops.<br />
10 Total cultivated land area during 2005/06<br />
cropping season was estimated at 12.28 million<br />
hectares.<br />
11 Total volume <strong>of</strong> agricultural produce during<br />
2005/06 cropping season was 133. 1 million<br />
quintals. A quintal is equivalent to 100 kgs.<br />
134
millet (Eleusine coracana). Teff, maize,<br />
sorghum and wheat took up 22, 15, 14 and<br />
14 percent <strong>of</strong> the grain crop area,<br />
respectively. Maize, wheat, Teff and<br />
sorghum made up 25, 17, 16 and 16 percent<br />
<strong>of</strong> the grain production in the same order.<br />
Crop cover rainfed (CSA data)<br />
12%<br />
7% 1% 2%0%1%2%0%<br />
75%<br />
cereals<br />
pulses<br />
oil seeds<br />
vegetables<br />
root crops<br />
fruit crops<br />
chat<br />
c<strong>of</strong>fee<br />
hops<br />
sugar cane<br />
Fig 2: Crop cover during the Meher season <strong>of</strong> 2005/2006 (Source: CSA (2006))<br />
Pulses grown in 2005/06 covered 12.7 % <strong>of</strong><br />
the grain crop area and 9.5 % <strong>of</strong> the grain<br />
production. Faba beans (Vicia faba), field<br />
peas (Pisum sativum) and chick-peas (Cicer<br />
arietinum) were planted on 4.5, 2.29 and<br />
1.98 percent <strong>of</strong> the grain crop area. The<br />
production obtained from the same crops<br />
was 3.8, 1.4 and 1.6 percent <strong>of</strong> the grain<br />
production.<br />
Oilseeds comprised 7.8% <strong>of</strong> the grain crop<br />
area and 3.6% <strong>of</strong> the production to the<br />
national grain total. Neug (Guizotia<br />
abyssinca), linseed (Linum sativum) and<br />
sesame (Sesamum indicum) covered 3.0, 2.1<br />
and 2.0 <strong>of</strong> the grain crop area and 1.1, 0.9<br />
and 1.1 <strong>of</strong> the grain production.<br />
Vegetables took up 1.1% <strong>of</strong> the area under<br />
all crops at national level. Of all the area<br />
under vegetables 69 and 19 percent was<br />
under red peppers and Ethiopian Cabbage<br />
(Brassica carinata), respectively. As to<br />
production <strong>of</strong> vegetables, 39.8 and 40.2<br />
percent was that <strong>of</strong> the same crops.<br />
Root crops covered more than 1.6% <strong>of</strong> the<br />
area under all crops in the country. Potatoes,<br />
sweet potatoes and taro covered 36.5, 29.7<br />
and 15.1 percent <strong>of</strong> the area to the root crop<br />
total. The same crops and onion contributed<br />
33.7, 30.6, 12.9 and 13.2 percent to the root<br />
crop production in the same order.<br />
More than 45 thousand hectares <strong>of</strong> land is<br />
under fruit crops in Ethiopia. Bananas<br />
contributed about 62.4% <strong>of</strong> the fruit crop<br />
area followed by mangoes that contributed<br />
12% <strong>of</strong> the area. Nearly 4.3 million quintals<br />
<strong>of</strong> fruits was produced in the country in<br />
2005/2006. Bananas, Papayas, mangoes and<br />
oranges took up 49.4, 16.6, 12.8 and 11.8<br />
percent <strong>of</strong> the fruit production, respectively.<br />
The area and production <strong>of</strong> chat and c<strong>of</strong>fee<br />
are larger than that <strong>of</strong> fruits since they earn a<br />
considerable amount <strong>of</strong> cash for the holders.<br />
Chat (Catus adulis) and c<strong>of</strong>fee shared 1.24<br />
and 2.39 percent <strong>of</strong> the area under all crops<br />
in the country and 1.2 and 1.7 million<br />
quintals <strong>of</strong> produce was obtained from these<br />
135
crops in the same agricultural year<br />
respectively.<br />
Sugar Cane is grown on about 19 thousand<br />
hectares <strong>of</strong> land in the country, yielding 16.1<br />
million quintals <strong>of</strong> produce by the peasant<br />
holders.<br />
7. Irrigation typologies and cropping<br />
patterns<br />
In the Ethiopian context, the irrigation subsector<br />
is classified as small (less than 200<br />
ha), medium (200 to 3000 ha) and largescale<br />
(over 3000 ha) schemes (MoWR<br />
2002a; Awulachew et al., 2005). Small scale<br />
irrigation schemes are considered as<br />
traditional if the diversion weirs are made<br />
from local material which needs annual<br />
reconstruction. The canals are usually<br />
earthen and the schemes are managed by the<br />
community. Many are constructed by local<br />
community effort and have been functional<br />
for relatively longer periods <strong>of</strong> time. On the<br />
other hand, small scale schemes are<br />
considered as modern schemes if they have<br />
more permanent diversion weirs made from<br />
concrete, and the primary and sometimes<br />
secondary canals are made <strong>of</strong> concrete. They<br />
are generally community managed and have<br />
recently been constructed by government or<br />
NGO. Werfring (2004) and Makombe et al.<br />
(2007) describe the typology <strong>of</strong> small scale<br />
irrigation in Ethiopia, the former in more<br />
detail. Small and medium scale schemes<br />
grow cereals as main crops. During the main<br />
rainy season most <strong>of</strong> small and medium<br />
scale irrigation schemes grow cereals like<br />
teff, maize and barley, with little or no<br />
supplementary irrigation, under rain fed<br />
conditions. During the dry season farmers<br />
grow cereals and a variety <strong>of</strong> vegetables<br />
including onions, tomatoes, and leafy green<br />
vegetables like lettuce under full irrigation.<br />
Farmers also grow perennial crops like<br />
mango, banana, sugar cane which are<br />
sometimes intercropped with seasonal crops.<br />
between traditional and modern irrigation<br />
schemes while looking into cropping<br />
composition. We clustered crops into<br />
different categories; namely, cereals, pulses,<br />
oil seeds, spices, vegetables, fruits and<br />
others and calculated area cover (as<br />
percentage <strong>of</strong> the total area) for these<br />
different crop categories in the different<br />
systems. The dominant crop categories<br />
under traditional irrigation system, in terms<br />
<strong>of</strong> the percentage area covered are: cereals<br />
(55%), vegetables (11%), fruits (11%),<br />
pulses (10%), spices (8%), oil seeds (5%),<br />
and others (0.2%) (Figure 3a). In the modern<br />
irrigation systems, in the order <strong>of</strong><br />
importance, the dominant crops are: cereals<br />
(67%), vegetables (17%), fruits (4%), pulses<br />
(3%), spices (0.2%), oil seeds (0.4%), and<br />
others (5 %) (Figure 3b).<br />
Under the rainfed agricultural system the<br />
dominant crops are: cereals (77%), pulses<br />
(16 %), vegetables (1.3 %), fruits (1%), oil<br />
seeds (1%), spices (0.4%), and others (3.3<br />
%) (Figure 3c).<br />
From our survey data, we present below the<br />
composition <strong>of</strong> crops under irrigated and<br />
rain fed conditions. We made the distinction<br />
136
Crop cover in traditional irrigation schemes<br />
Crop cover under moder irrigation schemes<br />
11%<br />
5%<br />
8% 0% 11% Cereals<br />
Pulses<br />
10%<br />
55%<br />
Oil seeds<br />
Vegetables<br />
Spices<br />
Other<br />
Fruits<br />
21%<br />
0%<br />
3%<br />
4% 5% Cereals<br />
Pulses<br />
Oil seeds<br />
Spieces<br />
Vegetables<br />
67%<br />
Fruits<br />
Others<br />
Fig. 3a: Dominant crops under traditional<br />
irrigation system (n= 1240) Fig. 3b:<br />
Dominant crops under modern irrigation system (n= 2092)<br />
Crop cover under rainfed system<br />
1% 0%1% 3%<br />
16%<br />
Cereals<br />
Pulses<br />
Oils seeds<br />
Fruits<br />
Spices<br />
vegetables<br />
Other<br />
78%<br />
Fig. 3c: Dominant crops under modern rain fed system (n= 1533)<br />
The figures above show that there is<br />
difference in the relative importance <strong>of</strong> the<br />
crop categories under different systems.<br />
Cereals and pulses are dominant under<br />
rainfed system while vegetables and fruits<br />
cover about 2 percent <strong>of</strong> the land area.<br />
While cereals still remain dominant under<br />
the irrigation systems, covering about 61<br />
percent <strong>of</strong> the land area, vegetables and<br />
fruits become important under both<br />
traditional and modern systems. There is<br />
also noticeable difference in the share <strong>of</strong><br />
land taken by vegetables and fruits between<br />
the modern and traditional irrigation<br />
systems. Vegetables take more land area<br />
under the modern systems compared to that<br />
<strong>of</strong> traditional systems while more land area<br />
is covered with fruit tress under the<br />
traditional system indicating perhaps the<br />
137
difference in age between the two type <strong>of</strong><br />
systems.<br />
Large-scale irrigation schemes, on the other<br />
hand, grow mainly sugar cane, cotton and<br />
fruits and vegetables. Wonji/Shoa, Metehara<br />
and Finchaa schemes grow sugar cane,<br />
while the Amibara and Upper Awash<br />
schemes grow cotton and Fruits and<br />
vegetables respectively (see <strong>Table</strong> 2)<br />
<strong>Table</strong> 2: Large scale schemes under irrigation and type <strong>of</strong> cropping<br />
Region Scheme name Major crop Area 2005/06 (in ha)<br />
Afar Amibara ( Middle Awash ) Cotton 6448<br />
Oromia Finchaa sugar plantation Sugar cane 7185<br />
Oromia Metehara sugar plantation Sugar cane 10145.9<br />
Oromia Upper Awash Vegetables & fruits 6017.34<br />
Oromia Wonji/Shoa sugar plantation Sugar cane 4094<br />
Source: ESDA (2007); MOFED (2006);<br />
8. Future expansion <strong>of</strong> irrigation<br />
development in the country<br />
The Irrigation Development Program (IDP)<br />
as set out in the government’s Plan for<br />
Accelerated and Sustained Development to<br />
End Poverty (PASDEP) document (2005/06-<br />
2009/10) envisages the expansion <strong>of</strong><br />
irrigation in the country by an additional<br />
430,061 ha by the year 2010 (MoWR, 2006;<br />
MOFED, 2006). This will consist <strong>of</strong> mainly<br />
medium and large scale schemes.<br />
Accordingly, 39 significant irrigation<br />
projects are planned to be implemented<br />
during the PASDEP period. These include<br />
World Bank project around Tana (100,000<br />
ha); Anger Negesso Project in Oromia<br />
(49,563 ha); Humera project in Tigray<br />
(42,965 ha); Kessem Tendaho in Afar<br />
(90,000 ha); Upper Beles in Benishangul<br />
Gumz (53,000 ha) and Ilo-Uen Buldoho<br />
(32,000 ha) in Somali (MOFED, 2006;<br />
MoWR, 2006). Most <strong>of</strong> these irrigation<br />
schemes will be community managed<br />
schemes to be used by small scale farmers.<br />
Exceptions are the schemes to be developed<br />
in the Awash basin which will mainly<br />
involve expansion <strong>of</strong> the already existing<br />
large scale schemes or development <strong>of</strong> new<br />
ones (see <strong>Table</strong> 3). About 90,000 ha <strong>of</strong><br />
irrigation land will be developed in Kesem<br />
and Tendaho to grow sugar cane while there<br />
are planned expansions in the already<br />
existing sugar plantations. Overall, by the<br />
year 2010 there will an additional 122,000<br />
ha <strong>of</strong> irrigated land developed to grow sugar<br />
cane (ESDA, 2007).<br />
There are also parallel plans to develop<br />
98,625 ha under small scale irrigation by the<br />
regional governments (Atnafu, 2007). The<br />
total extension to irrigated area by the year<br />
2009/10 compared to 2005/2006 will be in<br />
the range <strong>of</strong> 528,686 ha. This implies that<br />
further development will extend the irrigated<br />
area to about cover 33 percent <strong>of</strong> the<br />
irrigated potential and about 9 percent <strong>of</strong> the<br />
total cultivated land area. These plans are<br />
used as indicative targets for future<br />
irrigation development for valuing the future<br />
contribution <strong>of</strong> irrigation to the national<br />
economy.<br />
<strong>Table</strong> 3: Future development plans <strong>of</strong> large scale schemes<br />
Region Scheme name Main crop Future expansion/development until<br />
2010 (in ha)<br />
Oromia Finchaaa Sugar cane 12000<br />
Afar Kesem Sugar cane 40000<br />
Oromia Metehara Sugar cane 10000<br />
Afar Tendaho Sugar cane 50000<br />
Oromia Wonji/Shoa Sugar cane 10000<br />
Source: ESDA (2007)<br />
138
9. Value <strong>of</strong> irrigation to national<br />
economy<br />
The contribution <strong>of</strong> agriculture to national<br />
economy is estimated on the basis <strong>of</strong> the<br />
estimated production during the Meher<br />
(main rainy season) and the Belg seasons<br />
(small rainy season) (BOFED, 2006). We<br />
assume that the contribution from irrigation<br />
is included in the production during the Belg<br />
season, although not explicitly stated in the<br />
document. Farmers use full irrigation to<br />
grow crops during the dry season when crop<br />
production using rain is not possible. This<br />
implies that household’s get additional<br />
income from irrigation in comparison to<br />
farmers who can only grow during the main<br />
rainy season. Under small scale irrigation<br />
system, irrigation does not replace rainfed<br />
agriculture but supplements it. Large scale<br />
schemes, however, are under full irrigation<br />
through out the year.<br />
Based on the net gross margin calculations<br />
(see table 4), irrigation in the study sites<br />
generates an average income <strong>of</strong> about Birr<br />
2800 /ha, which is equivalent to USD 323/<br />
ha 12 . This compares to the calculated gross<br />
margin for rainfed which is USD 147/ha.<br />
This indicates that after accounting for<br />
annual investment replacement cost, net<br />
gross margin from irrigation is more than<br />
two times higher than gross margin from<br />
rainfed agriculture.<br />
modern schemes compared to the traditional<br />
ones. The relatively longer irrigation<br />
experience and, hence, acquired improved<br />
irrigated crop management practices <strong>of</strong><br />
farmers working and the composition <strong>of</strong><br />
crops grown under traditional system may<br />
also contribute to this difference. The<br />
development <strong>of</strong> modern irrigation schemes<br />
is a recent phenomenon in Ethiopia.<br />
There are also huge inter-scheme differences<br />
in income within the same typology which<br />
could be attributed to relative difference in<br />
irrigation experience and access to market.<br />
When it comes to medium scale irrigation<br />
schemes, the average income from modern<br />
irrigation schemes was USD 400/ha. We do<br />
not know the corresponding figure for a<br />
traditional medium scale scheme as we did<br />
not have such a scheme in our sample. We<br />
assumed in this study that the average net<br />
income from a traditional medium scale<br />
scheme is USD 400.<br />
When we disaggregate net income by<br />
irrigation typology, we also see a strong<br />
difference between the categories. Average<br />
income from small scale but modern<br />
schemes is about USD 355/ha while from<br />
small scale traditional is about USD 477/ha.<br />
This may sound counter intuitive in the<br />
sense that schemes with permanent<br />
structures and well lined canals should have<br />
led to better returns. The reason for higher<br />
margins for traditional schemes may have to<br />
do with high average investment cost <strong>of</strong><br />
12 1 USD was equivalent to 8.67 ETB in 2005/06<br />
prices.<br />
139
<strong>Table</strong> 4: Gross margin calculation from small and medium scale irrigation schemes<br />
GM/ha<br />
Scheme<br />
name<br />
Scheme<br />
scale Typology<br />
Area<br />
(in ha) AFC<br />
rain<br />
fed<br />
GM/ha<br />
irrigated<br />
GI<br />
minus<br />
FC<br />
Total<br />
income<br />
Modern/<br />
Indris Medium traditional 382 74 429 1850 1776 678571<br />
Gologota Medium Modern 850 303 1068 7596 7293 6199193<br />
Modern/<br />
traditional 685 200 1485 2603 2402 1645656<br />
WBS Medium<br />
Tikurit Small Traditional 102 91 1353 4140 4050 413081<br />
Zengeny Small Modern 270 222 1971 3375 3152 851160<br />
Haiba Small Modern 250 437 1585 2795 2358 589537<br />
Golgol<br />
Raya<br />
Hare Medium<br />
Source: Own calculation<br />
Micro<br />
irrigation Modern 104 1372 1710 2240 868 90280<br />
Modern/<br />
traditional 1345 159 646 950 791 1064206<br />
Taking the average income from<br />
smallholder managed small and medium<br />
scale irrigation schemes in the country and<br />
the total hectarage for both categories, we<br />
calculated the total income driven from<br />
irrigation to be Birr 2.27 billion (about 262.3<br />
million USD). This accounts for about 4.46<br />
percent <strong>of</strong> the agricultural GDP in<br />
2005/2006 and 1.97 percent <strong>of</strong> the total<br />
GDP.<br />
<strong>Table</strong> 5: Gross margin calculation from large scale irrigation schemes<br />
Scheme<br />
name Main crop<br />
Area<br />
(in<br />
ha)<br />
Average<br />
investment<br />
cost/ ha<br />
Annual<br />
recovery<br />
cost/ ha<br />
GM<br />
per<br />
ha<br />
Total<br />
income<br />
Total GM<br />
(in million)<br />
Net<br />
income<br />
Amibara* cotton 5358 11418 228 13.8 1212 984 5270343<br />
Finchaa sugar cane 7185 62672 1253 184.4 2943 1689 12137261<br />
Metehara sugar cane 10146 9303 186 303.7 32649 32463 32936660<br />
fruits &<br />
Upper Awash vegetables 6017 3793 76 62.9 16594 16518<br />
Wonji/Shoa*<br />
* Sugar cane 4094 35987 720 439.3 12210 11490<br />
* Based on 2004/2005 estimate<br />
** Average investment cost for Wonji is taken as the average for Metehara and Finchaa<br />
99396889<br />
47040510<br />
When it comes to valuation <strong>of</strong> the<br />
contribution from large scale schemes, we<br />
followed strictly the approach outlined in<br />
section two. Hence, in calculating net<br />
income from large scale schemes we<br />
deducted the contribution <strong>of</strong> rainfed from<br />
the net income obtained under irrigation to<br />
account for the income foregone for not<br />
using the land under rainfed production. The<br />
rationale behind this is that irrigation in the<br />
large scale schemes is full season devoid <strong>of</strong><br />
any possibilities to practice rain fed<br />
agriculture. Before netting out the<br />
contribution coming from rainfed, the<br />
average income from large scale schemes<br />
was USD1456/ha. There are strong<br />
differences in GM between the schemes,<br />
however. As we did not have data from<br />
rainfed in and around the large scale<br />
schemes, we used rainfed data from the<br />
medium and small scale sites. The<br />
calculated average gross margin per ha from
ainfed agriculture, as indicated earlier, was<br />
USD 147. Taking this value into account,<br />
the netted income from a hectare <strong>of</strong><br />
irrigation under large scale schemes is USD<br />
1308. When we differentiate the large scale<br />
schemes into sugar plantation and other crop<br />
growing plantations (i.e. predominantly<br />
vegetables and fruits and cotton growing<br />
schemes) the average net income is USD<br />
1782.5 and USD 998.9 respectively. Taking<br />
the all large scale schemes in the country,<br />
differentiated by their cropping pattern, and<br />
the average income from the selected<br />
learning sites, the total income earned from<br />
large scale schemes amounts to Birr 641<br />
million (ca 74.0 million USD). This<br />
accounts for about 1.26 percent <strong>of</strong> the<br />
agricultural GDP and 0.5 percent <strong>of</strong> the total<br />
GDP respectively. When only the improved<br />
system is considered, it contributed to about<br />
1.26 and 0.5 percent <strong>of</strong> the agricultural GDP<br />
and GDP respectively. Overall, the<br />
contribution <strong>of</strong> irrigation to agricultural<br />
GDP and total national GDP was about 5.7<br />
and 2.5 percent during the 2005/06 cropping<br />
season. This shows that the contribution <strong>of</strong><br />
irrigation to national income is still very<br />
small compared to the 28 percent<br />
contribution <strong>of</strong> crop production. Regional<br />
comparisons could shed some light on this.<br />
In the Sudan, for instance, irrigation<br />
contributes about 50 percent <strong>of</strong> the crop<br />
production while almost all agriculture in<br />
Egypt is irrigated (FAO, 1997).<br />
10. Projecting future contribution <strong>of</strong><br />
irrigation<br />
In this section we present the projected<br />
expansion <strong>of</strong> irrigated agriculture vis-à-vis<br />
rain fed agriculture and the contribution <strong>of</strong><br />
the former to agricultural GDP. To set the<br />
future scenario we used cropping patterns as<br />
observed in our empirical results and<br />
projected cropping patterns <strong>of</strong> the PASDEP<br />
(2005/06-2009/10) document (see <strong>Table</strong> 7).<br />
The projected irrigation development, both<br />
small-and medium scale and large scale<br />
schemes is taken into account in setting the<br />
future scenario.<br />
<strong>Table</strong> 6: Cropping pattern under different systems (% area covered by) by small and medium<br />
scale irrigation<br />
Crop category<br />
Area under Rain<br />
fed system (%)<br />
Area under<br />
Traditional<br />
irrigation (%)<br />
Area under<br />
Modern<br />
irrigation (%)<br />
Average area<br />
Cover under<br />
irrigation (%)<br />
Cereals 77 55 67 61<br />
Vegetables 1 11 21 16<br />
Perennials/fruits 1 11 4 7<br />
Pulses 16 10 3 6<br />
Oil seeds 1 5 0.4 3<br />
Spices 0.5 8 0.3 4<br />
Others 3 0.2 5 2.5<br />
141
Source: Own calculation<br />
In projecting future scenarios we assumed<br />
that the cropping pattern <strong>of</strong> the large scale<br />
sugar plantations to be the same. We ruled<br />
out reductions <strong>of</strong> irrigated land due to<br />
salinity or other environmental damages in<br />
those sugar plantation for lack <strong>of</strong> data that<br />
clearly shows the magnitude <strong>of</strong> the problem<br />
or how effective are the ameliorative<br />
measures undertaken by these schemes. On<br />
the other hand, we assumed that the<br />
cropping pattern in the smallholder managed<br />
large, medium and small scale irrigation<br />
schemes to be the same as depicted in <strong>Table</strong><br />
6. The land cover statistics <strong>of</strong> the irrigation,<br />
all typologies considered, and rainfed<br />
systems are also given in <strong>Table</strong> 7. We<br />
relaxed this assumption later in the<br />
sensitivity analysis as it is realistic that<br />
farmers will shift to high paying crops as<br />
they gain experience and the market<br />
situation likely to improve.<br />
<strong>Table</strong> 7: Land use assumptions for future<br />
irrigated areas (2005/06-2009/2010)<br />
Land use Area with Area<br />
irrigation<br />
(in 000 ha)<br />
without<br />
irrigation<br />
(in million<br />
ha)<br />
Cereals 809.2 9.2<br />
Pulses 1.6<br />
Oil seed 119.4 1.2<br />
crops<br />
Vegetables 212.2<br />
Fruits 99.5 0.419<br />
Cotton 0.043<br />
Sugar cane 122.0 0.060<br />
C<strong>of</strong>fee 0.734<br />
Floriculture n.a. 0.002<br />
Tea 0.0038<br />
Other 86.2 0.039<br />
Total 1326.5 12.65<br />
Source: MOFED (2006) and own<br />
calculation; n.a.= no data available<br />
The PASDEP document also outlines the<br />
projected development <strong>of</strong> the economy for<br />
the whole planning period. Accordingly, the<br />
Ethiopian economy is expected to grow at<br />
an average <strong>of</strong> 7.3 percent through out the<br />
PASDEP period. Agriculture, the major<br />
sector <strong>of</strong> the economy is also expected to<br />
grow at an average rate <strong>of</strong> 6.2 percent<br />
(MOFED, 2006, p. 55). Agriculture’s share<br />
to the economy will show slight reduction<br />
from 46.2 percent in 2004/2005 to 43.9<br />
percent at the end <strong>of</strong> the planning period.<br />
Taking the baseline situation (2005/06),<br />
Ethiopia’s GDP will grow to Birr 153.2<br />
billion while agricultural GDP will grow to<br />
Birr 64.7 billion both at 1999/00 constant<br />
basic prices.<br />
For the assumptions about the IDP<br />
differentiated into small-medium scale &<br />
large scale we used MOFED (2006) and<br />
MoWR (2006), as indicated in section eight.<br />
As the national IDP indicates the country’s<br />
irrigation coverage will increase from the<br />
current 625,819 ha to 1.15 Million hectares.<br />
Accordingly, there will be 638,129 ha <strong>of</strong><br />
small scale irrigation, both traditional and<br />
improved, 328,485.9 ha <strong>of</strong> smallholder<br />
managed medium and large scale irrigation<br />
schemes and 122000 ha <strong>of</strong> large scale<br />
schemes dedicated for sugar plantations and<br />
35511 ha <strong>of</strong> large scale commercial farms<br />
dedicated to growing <strong>of</strong> vegetables, fruits<br />
and cotton.<br />
Taking all the envisaged areal expansion,<br />
crop cover assumptions as indicated in<br />
<strong>Table</strong>s 7 and 8 and the average gross margin<br />
by crop category (table 9), we calculated<br />
that the contribution <strong>of</strong> smallholder<br />
managed irrigation to national economy to<br />
increase from USD 262.3 million in<br />
2005/2006 to about USD 414.2 million in<br />
2009/2010, which accounts to about 5.5<br />
percent <strong>of</strong> the agricultural GDP and 2.3 <strong>of</strong><br />
the overall GDP for the same year. On the<br />
other hand, the contribution coming from<br />
the large scale sugar growing estates is in<br />
2009/2010 is estimated to be USD 217.5<br />
million which amounts to 2.9 and 1.2<br />
percent <strong>of</strong> the agricultural and overall GDP<br />
respectively. Similarly the contribution<br />
142
coming from large scale commercial farms<br />
growing other crops other than sugar cane is<br />
expected to increase to USD 35.8 million in<br />
2009/2010 which accounts to 0.4 and 0.2<br />
percent <strong>of</strong> the agricultural GDP and overall<br />
GDP respectively. This implies that large<br />
scale commercial farms will contribute<br />
about 3.3 and 1.4 <strong>of</strong> the agricultural GDP<br />
and overall GDP respectively. This shows<br />
that the bulk <strong>of</strong> the contribution is expected<br />
to come from smallholder managed<br />
irrigation systems. In summary, this<br />
indicates that under conservative estimates<br />
the future contribution <strong>of</strong> irrigation to<br />
agricultural GDP and overall GDP will be in<br />
the range <strong>of</strong> 9 and 3.7 percent respectively.<br />
This estimation is based on the projected<br />
areal expansion, current cropping patterns<br />
and prices. These results are likely to change<br />
when some <strong>of</strong> the assumptions were allowed<br />
to change as shown below.<br />
11. Sensitivity analysis<br />
In projecting the future contribution <strong>of</strong><br />
irrigation to national economy or<br />
agricultural GDP our assumptions were<br />
rigid: only a change in area expansion was<br />
assumed. However, it is realistic to assume<br />
that there will be various changes associated<br />
with irrigation expansion. For instance,<br />
given the significant difference in the gross<br />
margin between different crop categories,<br />
farmers will benefit economically from<br />
growing more vegetables and fruits than<br />
growing cereals. Hence it is realistic to<br />
assume that farmers will gradually shift to<br />
high value crops. Prices <strong>of</strong> inputs and<br />
outputs cannot be taken to remain constant.<br />
It is realistic to assume that there could be<br />
either upward or down ward movements in<br />
prices <strong>of</strong> agricultural inputs and outputs.<br />
Furthermore, the efficiency <strong>of</strong> farmers is<br />
also expected to improve with time as they<br />
gain irrigation experience and experiment<br />
with various technologies and combinations.<br />
Hence it is important to relax these<br />
assumptions and see the effect <strong>of</strong> these<br />
changes on irrigation’s contribution to<br />
national income. This section presents the<br />
results <strong>of</strong> the sensitivity analysis.<br />
11.1 Simulating changes in cropping<br />
patterns under smallholder managed<br />
irrigation schemes<br />
To simulate the effect <strong>of</strong> such change in<br />
cropping pattern on the agricultural GDP we<br />
set the following scenarios: Scenario 1<br />
involves 10 percent increase in area<br />
coverage <strong>of</strong> vegetables and fruits (10 percent<br />
decrease in area for cereals) while areas for<br />
pulses and oil seeds and other crops remain<br />
the same; Scenario 2 assumes 10 percent<br />
increase in area <strong>of</strong> vegetables and 5 percent<br />
in fruits (15 percent reduction in area for<br />
cereals cetaris paribus) and Scenario 3<br />
assumes 10 percent increase in area for both<br />
vegetables and fruits (20 percent reduction<br />
in area for cereals) and finally scenario 4<br />
assumes a 25 percent increase in area <strong>of</strong><br />
vegetables and fruits (i.e. 25 percent<br />
reduction in area for cereals ceteris paribus).<br />
The outcomes <strong>of</strong> these scenarios were<br />
compared against the baseline scenario<br />
where we assumed that there will be only<br />
aerial expansion (<strong>Table</strong> 11).<br />
<strong>Table</strong> 8: Estimated average gross margin for different crop categories<br />
Average Gross margins by crop category Birr/ ha - rain<br />
fed<br />
Birr/ ha - irrigated<br />
Cereals 1282.32 1720.84<br />
Vegetables 3421.2<br />
Fruits 2754.9<br />
Pulses & oil seeds 1481.45 1558.19<br />
Sugar cane 4528.7<br />
Cotton 709.6<br />
others (hops, chat, etc) 1254.8 2891.8<br />
143
Source: Own calculation<br />
As can be seen from <strong>Table</strong> 8 (See also <strong>Table</strong><br />
10a and 10b in Annex) there is significant<br />
difference in the gross margin between<br />
different crop categories. On average<br />
farmers get Birr 1720 per ha from growing<br />
cereals, Birr 3421 from vegetables, Birr<br />
2755 from fruits, Birr 1558 from pulses and<br />
oil seeds, and Birr 1719 from growing other<br />
crops such as spices and stimulants.<br />
144
<strong>Table</strong> 9: The effect <strong>of</strong> change in cropping pattern on the projected contribution <strong>of</strong> small<br />
holder managed irrigated agriculture to Agricultural GDP (Net gross margin in BIRR)<br />
Contribution to Contribution to<br />
Total NGM AgGDP in GDP in Relative<br />
Crop type (in Million USD) 2009/2010 (%) 2009/2010 (%) change (%)<br />
Baseline 315.2 4.22 1.78<br />
Scenario 1 327.9 4.39 1.85 17<br />
Scenario 2 335.8 4.5 1.9 28<br />
Scenario 3 340.6 4.56 1.92 34<br />
Scenario 4 3.84.5 4.67 1.97 45<br />
As can be seen from the simulation results,<br />
the contribution from smallholder managed<br />
irrigation schemes to Agricultural GDP<br />
increases to about 4.5 percent or even more<br />
when these various changes in cropping<br />
patterns are assumed. 15 and 10 percent<br />
increase in the area <strong>of</strong> vegetables and fruits<br />
(25 percent reduction in the area <strong>of</strong> cereals)<br />
lead to about 45 percent increase in the<br />
contribution <strong>of</strong> smallholder irrigation to<br />
agricultural GDP as compared to the<br />
baseline scenario. This is an important result<br />
indicating that the contribution <strong>of</strong> irrigation<br />
could be maximized if smallholder farmers<br />
shift their cropping pattern to high value<br />
crops. Hence, the extension system could<br />
play an important role in providing and<br />
promoting high value crops.<br />
11.2 Simulating changes in crop prices<br />
The factors that influence price change<br />
could be related to overall demographic<br />
change and improved economic<br />
performance (through increased demand)<br />
and increase in supply <strong>of</strong> output. It is<br />
reasonable to assume that the population <strong>of</strong><br />
Ethiopia will continue to grow in the<br />
foreseeable future while there could be<br />
differences in opinion about the prospects <strong>of</strong><br />
economic growth in the country. The<br />
prospects point towards improved economic<br />
performance, however. For this exercise,<br />
hence, we assumed that demand factors will<br />
play a more significant role in influencing<br />
the price <strong>of</strong> outputs.. To simulate the effect<br />
<strong>of</strong> these changes in prices <strong>of</strong> output on the<br />
contribution <strong>of</strong> irrigation to national<br />
economy, we set various scenarios: baseline<br />
scenario GM net <strong>of</strong> annual investment<br />
recovery cost; 10 percent increase in price <strong>of</strong><br />
vegetables and fruits ceteris paribus<br />
(scenario 1); 15 percent increase in price <strong>of</strong><br />
vegetables and fruits ceteris paribus<br />
(scenario 2); 10 and 15 percent increase in<br />
price <strong>of</strong> cereals ceteris paribus (scenarios 3<br />
and 4); 10 and 15 percent increase in the<br />
price <strong>of</strong> pulses and oil seeds ceteris paribus<br />
(scenarios 5-6); and 10 and 15 percent<br />
increase in price <strong>of</strong> other crops ceteris<br />
paribus (scenario 7 and 8). The simulation<br />
results are reported in table 10 below.<br />
These simulation results show that a 10-15<br />
percent increase in the price <strong>of</strong> fruits and<br />
vegetables leads to 15-23 percent increase in<br />
the relative contribution <strong>of</strong> smallholder<br />
irrigation to agricultural GDP. An equivalent<br />
increase in the price <strong>of</strong> cereals leads to 22-<br />
32 percent increase in the relative<br />
contribution <strong>of</strong> the sub sector. One the other<br />
hand, the same level <strong>of</strong> increase in prices <strong>of</strong><br />
pulses, oil seeds and other crops did not<br />
yield significant change in their<br />
contribution. The relative higher<br />
contribution from cereals comes from the<br />
bigger share cereals have on land cover<br />
claiming about 61 percent <strong>of</strong> the cultivated<br />
area under irrigation, Hence, vegetables and<br />
fruits are economically more attractive. This<br />
implies that an increase or decrease <strong>of</strong> prices<br />
<strong>of</strong> vegetables and fruits will have a stronger<br />
relative impact on the contribution <strong>of</strong><br />
irrigation to national economy compared to<br />
the price change <strong>of</strong> cereals.<br />
145
<strong>Table</strong> 10: the effect <strong>of</strong> change in output prices on the projected contribution <strong>of</strong> small holder<br />
managed irrigated agriculture to Agricultural GDP<br />
Scenarios<br />
Baseline<br />
Scenario 1<br />
Scenario 2<br />
Scenario 3<br />
Scenario 4<br />
Scenario 5<br />
Scenario 6<br />
Scenario 7<br />
Scenario 8<br />
Description<br />
Contribution to AgGDP in<br />
2009/2010 (%)<br />
Contribution to GDP<br />
in 2009/2010 (%)<br />
GM net <strong>of</strong> investment<br />
recovery cost 4.22 1.8<br />
10 % increase in price <strong>of</strong><br />
vegetables & fruits 4.37 1.85 15<br />
15 % increase in price <strong>of</strong><br />
vegetables & fruits 4.45 1.88 23<br />
10 % increase in price <strong>of</strong><br />
cereals 4.44 1.87 22<br />
15 % increase in price <strong>of</strong><br />
cereals 4.55 1.92 32<br />
10 % increase in price <strong>of</strong><br />
pulses and oil seeds 4.25 1.79 3<br />
15 % increase in price <strong>of</strong><br />
pulses and oil seeds 4.26 1.80 4<br />
10 % increase in price <strong>of</strong><br />
other crops 4.25 1.79 3<br />
15 % increase in price <strong>of</strong><br />
other crops 4.26 1.80 4<br />
Relative<br />
change<br />
(%)<br />
11.3 Simulating changes in input prices<br />
Fertilizer is the most important input for<br />
smallholder farmers working under<br />
irrigation. The average cost <strong>of</strong> fertilizer<br />
varies by type <strong>of</strong> crop category. Cereals and<br />
vegetables are major consumers <strong>of</strong> fertilizer<br />
with average expenditure per hectare <strong>of</strong> Birr<br />
287 and Birr 403 respectively. Pulses and oil<br />
seeds, other crops and fruits reported<br />
expenditure per hectare <strong>of</strong> Birr 238, 161 and<br />
47 respectively. In projecting the impact <strong>of</strong><br />
irrigation on national economy, one needs to<br />
consider the effect <strong>of</strong> changes in input prices<br />
on the gross margin. To simulate such an<br />
effect, we determined the impact <strong>of</strong> the<br />
following scenarios: 10, 15, 25 and 35<br />
percent increase in the price <strong>of</strong> fertilizer.<br />
Given the current trends in fertilizer prices,<br />
it seems realistic to assume that fertilizer<br />
prices will increase.<br />
<strong>Table</strong> 11: Effect <strong>of</strong> changes in fertilizer prices on contribution <strong>of</strong> smallholder contribution<br />
to agricultural GDP<br />
Crop category Contribution to AgGDP Contribution to GDP Relative change<br />
Baseline 4.22 1.78<br />
Scenario 1 4.17 1.76 -5<br />
Scenario 2 4.14 1.75 -8<br />
Scenario 3 4.08 1.72 -14<br />
Scenario 4 4.03 1.70 -19<br />
As can be seen from the simulation results,<br />
the contribution from smallholder managed<br />
irrigation schemes to agricultural GDP does<br />
fall significantly compared to the baseline<br />
scenario if there is a 10 percent or more<br />
increase in price <strong>of</strong> fertilizer. A 35 percent<br />
increase in price <strong>of</strong> fertilizer, while<br />
assuming other things remain constant, for<br />
146
instance, leads to a 19 percent reduction in<br />
its contribution to agricultural GDP<br />
compared to the baseline scenario.<br />
11.4 Improvement in efficiency <strong>of</strong><br />
smallholder managed schemes<br />
Besides exogenous changes in prices and<br />
changes in cropping patterns, farmers are<br />
also expected to gain irrigation experience<br />
and improve their efficiency in using land<br />
and water. This is also expected to lead to<br />
increase in gross margin. We, hence,<br />
explored what happens to irrigation’s<br />
contribution if gross margin <strong>of</strong> smallholder<br />
agriculture increases to that <strong>of</strong> irrigators in<br />
the traditional schemes. The simulation<br />
results show that the contribution from<br />
smallholder managed irrigation will increase<br />
to about USD 475.5 million that accounts to<br />
6.4 and 2.7 percent <strong>of</strong> the agricultural GDP<br />
and overall GDP in 2009/2010. This has also<br />
an important policy implication; government<br />
and extension support through education and<br />
training contributes to improved efficiency<br />
and increased contribution <strong>of</strong> irrigation to<br />
national economy.<br />
11.5 Projecting the future contribution <strong>of</strong><br />
large scale plantations<br />
In projecting the future contribution from<br />
large scale commercial plantations, we<br />
tested various scenarios. First we need to<br />
differentiate between large scale smallholder<br />
managed and large scale commercial<br />
plantations. The former category was<br />
covered in the proceeding sections while in<br />
this section we focus on the large scale<br />
commercial production. The major<br />
expansion in the state owned commercial<br />
plantations involves predominantly growing<br />
<strong>of</strong> sugar cane for sugar production. There is<br />
no information on future expansion plans <strong>of</strong><br />
fruits and vegetables and other crop growing<br />
large scale commercial farms. Our focus in<br />
this section, hence, will be on sugar<br />
plantations. Worth noting is that in the<br />
existing sugar plantations there is huge<br />
difference in annual investment recovery<br />
costs and net gross margin (see <strong>Table</strong> 5).<br />
These differences could be attributed to<br />
differences in structure <strong>of</strong> investment and<br />
management and, hence, efficiency <strong>of</strong> the<br />
schemes. The lack <strong>of</strong> relevant information<br />
on initial investment expenditure has also<br />
made the analysis difficult. In schemes<br />
where we couldn’t get data on initial<br />
investment costs we used data related to<br />
initial capital outlays. The huge differences<br />
in annual investment recovery costs and net<br />
gross margin could partly be attributed to<br />
lack <strong>of</strong> reliable data.<br />
In simulating the future contribution <strong>of</strong> large<br />
scale schemes, we set certain assumptions<br />
based on the differences in net gross margin<br />
between the three major sugar growing<br />
schemes. Since there will be emerging<br />
schemes, e.g. Kesem and Tendaho on 90000<br />
ha <strong>of</strong> land, in sugar cane production, we<br />
need to set certain assumptions about these<br />
schemes performance. We first assumed that<br />
the net gross margin for Finachaa, Metehara<br />
and Wonjo/Shoa respectively applies to the<br />
new schemes (Scenario 1-3); Kesem &<br />
Tendaho perform on the average <strong>of</strong> the three<br />
exiting schemes (scenario 4); all schemes,<br />
existing and emerging, perform like<br />
Finachaa (scenario 5); all schemes perform<br />
like Metehara (scenario 6), all perform like<br />
Wonji/Shoa or all perform on the average <strong>of</strong><br />
the three (scenarios 7 & 8) . Finally we<br />
assumed a 10 and 15 percent increase in the<br />
price <strong>of</strong> sugar while the average gross<br />
margin works in all schemes (scenarios 9<br />
and 10). For details see <strong>Table</strong> 12 below.<br />
Following these scenarios, the contribution<br />
from large scale plantations to agricultural<br />
GDP, ranges from less than 1 percent for<br />
scenario 5 (worst scenario) to about 6<br />
percent in scenario 2 (best scenario). The<br />
intermediate outcomes lie somewhere in<br />
between contributing about 3 percent to the<br />
agricultural GDP. These results show that<br />
the structure <strong>of</strong> investment and the way<br />
these schemes are managed may have a<br />
significant bearing on their contribution to<br />
national economy.<br />
<strong>Table</strong> 12: Projected contribution <strong>of</strong> large scale sugar estates to Agricultural GDP<br />
147
Scenarios Description Contribution to<br />
AgGDP<br />
Contribution<br />
to GDP<br />
% Change<br />
Baseline<br />
average NGM for LSS<br />
assumed<br />
2.9 1.2<br />
Scenario 1 Kesem & Tendaho<br />
performs like Finchaa<br />
Scenario 2 Kesem & Tendaho<br />
performs like Metehara<br />
Scenario 3 Kesem & Tendaho<br />
performs<br />
like<br />
Wonji/Shoa<br />
Scenario 4 Kesem & Tendaho<br />
achieves average<br />
performance<br />
1.5 0.65 - 140<br />
5.8 2.46 290<br />
2.9 1.22 0<br />
3.4 1.4 50<br />
Scenario 5 All perform like Finchaa 0.32 0.13 -258<br />
Scenario 6 All perform like<br />
metehara<br />
Scenario 7 All perform like<br />
Wonji/Shoa<br />
6.1 2.5 320<br />
2.16 0.9 -74<br />
Scenario 8 All perform like average 2.87 1.2 -3<br />
Scenario 9<br />
Scenario 10<br />
10 percent increase in<br />
baseline NGM<br />
15 percent increase in<br />
baseline NGM<br />
2.87 1.2 -3<br />
2.87 1.2 -3<br />
Taking these scenarios into account the<br />
contribution <strong>of</strong> smallholder managed<br />
irrigation to agricultural and overall GDP<br />
will vary between 4 to 6 and 1.8 to 1.9<br />
percent respectively. Similarly, the<br />
contribution from large scale irrigation to<br />
agricultural and overall GDP will be in the<br />
range <strong>of</strong> 3 to 6 and 1.2 to 2.5 percent<br />
148
espectively. Overall, the future contribution<br />
<strong>of</strong> irrigation to agricultural GDP will be in<br />
the range <strong>of</strong> 7 to 12 percent while the<br />
contribution to overall GDP will be in the<br />
range <strong>of</strong> about 4 percent.<br />
12. Conclusions and recommendations<br />
Irrigation development is quite a recent<br />
phenomenon in Ethiopia. While the country<br />
has huge potential for irrigation only about 5<br />
percent <strong>of</strong> this potential is currently used.<br />
Irrigation development is identified as an<br />
important tool to stimulate sustainable<br />
economic growth and rural development and<br />
is considered as a corner stone for food<br />
security and poverty reduction in the<br />
country. To this effect a comprehensive<br />
national Irrigation Development Strategy<br />
(2005/06-2009-2010) has been developed<br />
and is being implemented with the aim <strong>of</strong><br />
establishing small, medium and large scale<br />
irrigation schemes, either for use either<br />
under smallholder managed schemes or<br />
large scale commercial plantations. In spite<br />
<strong>of</strong> this, there is little attempt to measure the<br />
actual and expected contribution <strong>of</strong><br />
irrigation to the national economy. Hence,<br />
the objective <strong>of</strong> this study was to estimate<br />
the net contribution <strong>of</strong> irrigation to GDP at<br />
the farm gate following an adjusted gross<br />
margin analysis approach. Studies <strong>of</strong> this<br />
kind could be instrumental in comparing the<br />
actual and expected direct benefits <strong>of</strong><br />
irrigation with the actual and expected costs<br />
<strong>of</strong> irrigation expansion to guide policy<br />
makers in irrigation development. However,<br />
there is need for caution. This study does not<br />
capture the all the multiplier effects <strong>of</strong><br />
irrigation. Doing that requires more data<br />
than is presently available. However, this<br />
first attempt can be extended to more precise<br />
analysis <strong>of</strong> economy wide effects <strong>of</strong><br />
irrigated agriculture development.<br />
Our results show that irrigation in the study<br />
sites generates an average income <strong>of</strong> about<br />
USD 323/ ha. This compares to the<br />
calculated gross margin for rainfed which is<br />
USD 147/ha. This indicates that after<br />
accounting for replacement cost, net gross<br />
margin from irrigation is more than twice<br />
higher than the gross margin from rainfed<br />
agriculture. When disaggregated by<br />
irrigation typology, average income from<br />
small scale modern systems is about USD<br />
355/ ha while from small scale traditional<br />
systems it is about USD 477/ha. This<br />
difference in net income between the<br />
traditional and modern systems could be<br />
attributed to differences in the investment<br />
cost and relative irrigation experience. We<br />
also found huge inter-scheme differences in<br />
average income within the same typology<br />
which could be attributed to differences in<br />
relative irrigation experience and access to<br />
market. When it comes to medium scale<br />
irrigation schemes, the average income from<br />
modern irrigation schemes was USD 400/ha.<br />
Taking the average income from<br />
smallholder managed small and medium<br />
scale irrigation schemes in the country and<br />
the total hectarage for both categories, we<br />
calculated the total income driven from<br />
irrigation to be Birr 2.27 billion (about 262.3<br />
million USD). This accounts for about 4.46<br />
percent <strong>of</strong> the agricultural GDP in<br />
2005/2006 and 1.97 percent <strong>of</strong> the total<br />
overall GDP.<br />
On the other hand, the average income net<br />
<strong>of</strong> annual recovery cost from a hectare <strong>of</strong><br />
irrigation under large scale schemes is USD<br />
1,308. Taking the all large scale schemes in<br />
the country, differentiated by their cropping<br />
pattern, and the average income from the<br />
selected learning sites, the total income<br />
earned from large scale schemes is estimated<br />
to be Birr 641 million (ca 74.0 million<br />
USD). This accounts for about 1.26 percent<br />
<strong>of</strong> the agricultural and 0.5 percent <strong>of</strong> the<br />
total GDP respectively. Overall, the<br />
contribution <strong>of</strong> irrigation to agricultural and<br />
total national GDP was about 5.7 and 2.5<br />
percent during the 2005/06 cropping season.<br />
When only the improved system is<br />
considered, it contributed to about 1.26 and<br />
0.5 percent <strong>of</strong> the agricultural GDP and<br />
GDP respectively. Our result show that the<br />
bulk <strong>of</strong> the contribution to national economy<br />
comes from the smallholder managed<br />
irrigation schemes, most importantly from<br />
149
the traditional schemes. The same results<br />
also show that the contribution <strong>of</strong> irrigation<br />
to national income is still very small<br />
compared to the 28 percent contribution <strong>of</strong><br />
crop production and role <strong>of</strong> irrigation to<br />
national economy in some countries such as<br />
the Sudan and Egypt where in the former<br />
irrigation contributes to about 50 percent <strong>of</strong><br />
the crop production while in the latter<br />
almost all agriculture is irrigated.<br />
Taking all the envisaged areal expansion,<br />
exiting cropping pattern, and the average<br />
gross margin values for different crop<br />
categories, the expected contribution <strong>of</strong><br />
smallholder managed irrigation to national<br />
economy is expected to increase from USD<br />
262.3 million in 2005/2006 to about USD<br />
414.2 million in 2009/2010, which accounts<br />
to about 5.5 percent <strong>of</strong> the agricultural GDP<br />
and 2.3 <strong>of</strong> the overall GDP for the same<br />
year. On the other hand, the contribution<br />
coming from the large scale sugar growing<br />
estates in 2009/2010 is estimated to be USD<br />
217.5 million which amounts to 2.9 and 1.2<br />
percent <strong>of</strong> the agricultural and overall GDP<br />
respectively. Similarly the contribution<br />
coming from large scale commercial farms<br />
growing crops other than sugar cane is<br />
expected to increase to USD 35.8 million in<br />
2009/2010 which accounts to 0.4 and 0.2<br />
percent <strong>of</strong> the agricultural and overall GDP<br />
respectively. This implies that large scale<br />
commercial farms will contribute about 3.3<br />
and 1.4 <strong>of</strong> the agricultural and overall GDP<br />
respectively. In summary, our results<br />
indicate that under conservative estimates<br />
the future contribution <strong>of</strong> irrigation to<br />
agricultural and overall GDP will be in the<br />
range <strong>of</strong> 9 and 3.7 percent respectively.<br />
Furthermore, we also relaxed some <strong>of</strong> the<br />
assumptions to check the sensitivity <strong>of</strong> our<br />
results to model assumptions. We assumed<br />
various changes in cropping patterns,<br />
changes in input and output prices and<br />
improvement in levels <strong>of</strong> efficiency.<br />
Our results from the simulation exercise in<br />
relation to shift in cropping patterns show<br />
that a 15 and 10 percent increase in the area<br />
<strong>of</strong> vegetables and fruits respectively (i.e. 25<br />
percent reduction in the area <strong>of</strong> cereals)<br />
leads to about 45 percent increase in the<br />
contribution <strong>of</strong> smallholder irrigation to<br />
agricultural GDP as compared to the<br />
baseline scenario. This is an important result<br />
indicating that the contribution <strong>of</strong> irrigation<br />
could be maximized if smallholder farmers<br />
shift their cropping pattern to more high<br />
value crops. Hence, the extension system<br />
could play an important role in providing<br />
and promoting high value crops.<br />
Likewise, simulation results on the effect <strong>of</strong><br />
price change show that a 10-15 percent<br />
increase in the price <strong>of</strong> fruits and vegetables<br />
leads to 15-23 percent increase in the<br />
relative contribution <strong>of</strong> smallholder<br />
irrigation to agricultural GDP. An equivalent<br />
increase in the price <strong>of</strong> cereals leads to 22-<br />
32 percent increase in the relative<br />
contribution <strong>of</strong> the sub sector. One the other<br />
hand, the same level <strong>of</strong> increase in prices <strong>of</strong><br />
pulses, oil seeds and other crops did not<br />
yield significant change in their<br />
contribution. The relatively higher<br />
contribution coming from cereals is<br />
attributed to the bigger share cereals have on<br />
land claiming about 61 percent <strong>of</strong> the<br />
cultivated area under irrigation. This implies<br />
that an increase or decrease <strong>of</strong> prices <strong>of</strong><br />
vegetables and fruits will have a stronger<br />
relative impact on the contribution <strong>of</strong><br />
irrigation to national economy compared to<br />
that <strong>of</strong> cereals. Hence, vegetables and fruits<br />
are economically more attractive and could<br />
yield more value to the economy if more a<br />
more land is shifted from cereal production<br />
to production <strong>of</strong> vegetables and fruits.<br />
On the other hand, increase in price <strong>of</strong><br />
fertilizer leads to reduction in the<br />
contribution <strong>of</strong> irrigation to national<br />
economy. Accordingly, a 35 percent<br />
increase in price <strong>of</strong> fertilizer, while<br />
assuming other things remain constant, for<br />
instance, leads to a 19 percent reduction in<br />
small holder irrigation’s contribution to<br />
agricultural GDP compared to the baseline<br />
scenario.<br />
Besides changes in prices and cropping<br />
patterns, improved efficiency is found to<br />
impact significant increased in the<br />
150
contribution <strong>of</strong> irrigation to national<br />
economy. Our simulation results show that<br />
the contribution from smallholder managed<br />
irrigation will increase to about USD 475.5<br />
million, which is 6.4 and 2.7 percent <strong>of</strong> the<br />
agricultural and overall GDP in 2009/2010,<br />
when all smallholder irrigation farmers<br />
perform to the level <strong>of</strong> traditional irrigators.<br />
This has also an important policy<br />
implication: government and extension<br />
support through education and training<br />
contributes to improved efficiency and<br />
increased contribution <strong>of</strong> irrigation to<br />
national economy.<br />
conditions, and iv) increase the efficiency <strong>of</strong><br />
small and large schemes.<br />
Furthermore, when we simulated the effect<br />
<strong>of</strong> changes in efficiency levels <strong>of</strong> existing<br />
and emerging large scale sugar plantations<br />
and changes in the price <strong>of</strong> sugar we found<br />
that the contribution from large scale<br />
plantations to agricultural GDP, ranges from<br />
less than 1 percent for worst scenario to<br />
about 6 percent in the best scenario. The<br />
intermediate outcomes lie somewhere in<br />
between contributing about 3 percent to the<br />
agricultural GDP. These results show that<br />
the structure <strong>of</strong> investment and the way<br />
these schemes are managed may have a<br />
significant bearing on their contribution to<br />
national economy.<br />
In summary, taking these scenarios into<br />
account the contribution <strong>of</strong> smallholder<br />
managed irrigation to agricultural and<br />
overall GDP will vary between 4 to 6 and<br />
1.8 to 1.9 percent respectively. Similarly, the<br />
contribution from large scale irrigation to<br />
agricultural and overall GDP will be in the<br />
range <strong>of</strong> 3 to 6 and 1.2 to 2.5 percent<br />
respectively. Overall, the future contribution<br />
<strong>of</strong> irrigation to agricultural GDP will be in<br />
the range <strong>of</strong> 7 to 12 percent while the<br />
contribution to overall GDP will be in the<br />
range <strong>of</strong> about 4 percent. To enhance the<br />
contribution <strong>of</strong> irrigation to national<br />
economy, besides increasing the presence <strong>of</strong><br />
physical water infrastructure, there is a need<br />
to: i) improve provision <strong>of</strong> agricultural<br />
inputs, ii) promote high value crops through<br />
the extension system, iii) create good market<br />
151
References<br />
Ahmed, A. U and Sampath, R.K., (1992).<br />
Effects <strong>of</strong> irrigation-induced<br />
technological change in Bangladesh rice<br />
production. American Journal <strong>of</strong><br />
Agricultural Economics 74(1): 144-57.<br />
Alagh, Y. K. (2001). <strong>Water</strong> and food<br />
security in South Asia. <strong>International</strong><br />
Journal <strong>of</strong> <strong>Water</strong> Resources<br />
Development. 17(1): 23-36.<br />
Atnafu, Teshome (2007). Current and Future<br />
Plans <strong>of</strong> Irrigation and Drainage<br />
Development in Ethiopia. Irrigation and<br />
Drainage Development Studies<br />
Department. Ministry <strong>of</strong> <strong>Water</strong><br />
Resources. Addis Ababa.<br />
Awulachew, S. B., Aster Denekew and<br />
Mekonnen Luelseged (2007). Status <strong>of</strong><br />
Irrigation Development in Ethiopia.<br />
<strong>International</strong> <strong>Water</strong> <strong>Management</strong> <strong>Institute</strong><br />
(IWMI). Addis Ababa.<br />
Awulachew S.B., Merrey D., Kamara A.,<br />
Koppen B.V., de Vries F.P., Boelee E.<br />
and Makombe G. (eds). 2005.<br />
Experiences and opportunities for<br />
promoting small-scale/micro-irrigation<br />
and rainwater harvesting for food<br />
security in Ethiopia. IWMI Working<br />
Paper. No. 98. IWMI (<strong>International</strong><br />
<strong>Water</strong> <strong>Management</strong> <strong>Institute</strong> (IWMI),<br />
Colombo, Sri Lanka. 86 p.<br />
Bahtia, R., Monica Scatasta and Rita Cestti<br />
(2003). Study on the multiplier effects <strong>of</strong><br />
dams: Methodological issues and<br />
preliminary results. Paper presented for<br />
the Third World <strong>Water</strong> Forum, Kyoto,<br />
Japan. March 16-23, 2003.<br />
Barbier, E. B. and Thompson, J.R. (1998).<br />
The value <strong>of</strong> water: Flood plain vs. large<br />
scale irrigation benefits. Ambio 27(6):<br />
434-443.<br />
Bell, C. and Hazel, P. (1980). Measuring the<br />
indirect effects <strong>of</strong> an agricultural<br />
investment project on its surrounding<br />
region. American Journal <strong>of</strong> Agricultural<br />
Economics 62(1): 75-86.<br />
Berck, P. and H<strong>of</strong>fman, S. (2002). Assessing<br />
the employment impact <strong>of</strong> environmental<br />
and natural resource policy.<br />
Environmental and Resource Economics.<br />
22(1-2): 133-156.<br />
Bhattarai, M., Baker, R., Narayanamoorthy,<br />
A.(2003) . Who benefits from irrigation<br />
investments in India? Implication <strong>of</strong><br />
irrigation multiplier estimates for cost<br />
recovery and irrigation financing. A<br />
workshop paper presented at the ICID<br />
regional meeting in Taipei, Taiwan, 10-<br />
12 November, 2003.<br />
Bhattarai, M., and Pandy, S. (1997). The<br />
economics <strong>of</strong> wheat production in the<br />
rice-wheat system in Nepal. A chapter in<br />
a book series in P.S. Teng et al. (Eds).<br />
1997. Application <strong>of</strong> systems approach<br />
at the farm and regional levels 1:45-57.<br />
Kluwer Academic Publishers. IRRI,<br />
ICASA. Netherlands.<br />
Central Statistical Agency (CSA) (2006).<br />
Agricultural Sample Survey 2005 / 2006<br />
(1998 E.C.). Report on Area And<br />
Production Of Crops. Statistical Bulletin,<br />
361. Addis Ababa. Pp. 118.<br />
Dhawan, B. D. (1988). Irrigation in India’s<br />
agricultural development: productivity,<br />
stability, equity. Sage Publications India,<br />
New Delhi. India.<br />
Doak, M. (2005). Value <strong>of</strong> irrigation in New<br />
Zealand. A paper presented on OECD<br />
Workshop on Agriculture and <strong>Water</strong>:<br />
sustainability, markets and policies, 14-<br />
18 November, 2005. Adelaide, Australia.<br />
Doak, M., Irene Parminter, Gerard Horgan,<br />
Rachel Monk, and Graeme Elliot. (2004)<br />
The Economic Value <strong>of</strong> Irrigation in New<br />
Zealand. MAF Technical Paper No:<br />
04/01.<br />
Ethiopian Sugar Development Agency<br />
(ESDA) (2007). Revised Master<br />
Schedule for New and Expansion projects<br />
and Annual Implementation Plan<br />
(2006/07). Project and Development<br />
Services. Addis Ababa. 143 Pp.<br />
FAO (1997) Irrigation in the near east<br />
region in figures. Food and Agriculture<br />
Organization <strong>of</strong> the United Nations.<br />
Rome, 1997.<br />
http://www.fao.org/docrep/W4356E/w43<br />
56e00.HTM. accessed 04.12.07.<br />
FDRE (2006). National Accounts Statistics<br />
<strong>of</strong> Ethiopia. National Economic Accounts<br />
152
Department. Ministry <strong>of</strong> Finance and<br />
Economic Development. November,<br />
2006. Unpublished.<br />
Hagos, F., Godswill Makombe, Regassa<br />
Namara, and Seleshi Bekele Awulachew<br />
(2007). Does access to small scale<br />
irrigation promote market oriented<br />
production in Ethiopia?. Submitted to<br />
Agricultural Economics.<br />
Hussain I. and Hanjra, A. (2004) Irrigation<br />
and poverty alleviation: Review <strong>of</strong> the<br />
empirical evidence. Irrigation and<br />
Drainage, 53: 1-15.<br />
Jacoby, H. G. (1993). Shadow Wages and<br />
Peasant Family Labour Supply: An<br />
Econometric Application to the Peruvian<br />
Sierra. The Review <strong>of</strong> Economic Studies,<br />
Vol. 60, No. 4., pp. 903-921.<br />
Lipton, M., Litchfield, J and Faures, J-M.<br />
(2003). The effects <strong>of</strong> irrigation on<br />
poverty: a framework for analysis. <strong>Water</strong><br />
Policy, 5: 413-427.<br />
Makombe, G. (2000), The economic impacts<br />
and performance <strong>of</strong> irrigation in<br />
Zimbabwe. Dissertation. Colorado State<br />
University. Department <strong>of</strong> Agricultural<br />
and Resource Economics. Fort Collins,<br />
CO 80523.<br />
Makombe, G., Fitsum Hagos, Regassa<br />
Namara, and Seleshi Bekele Awelachew<br />
(2007). A comparative analysis <strong>of</strong> factors<br />
affecting the financial performance <strong>of</strong><br />
smallholder irrigated and rainfed<br />
agricultural production in Ethiopia.<br />
Unpublished.<br />
Ministry <strong>of</strong> Finance and Economic<br />
Development (MOFED). (2006a).<br />
Ethiopia: Building on Progress. A Plan<br />
for Accelerated and Sustained<br />
Development to End Poverty (PASDEP).<br />
(2005/06-2009/10). Volume I: Main<br />
Text. Ministry <strong>of</strong> Finance and Economic<br />
Development (MoFED). September,<br />
2006. Addis Ababa. 229 pp.<br />
MoWR (Ministry <strong>of</strong> <strong>Water</strong> Resources).<br />
(2002a). <strong>Water</strong> sector development<br />
programme 2002–2016. Irrigation<br />
development program, Main report.<br />
MoWR, Addis Ababa, Ethiopia. 142 pp.<br />
MoWR (Ministry <strong>of</strong> <strong>Water</strong> Resources).<br />
(2002b). <strong>Water</strong> sector development<br />
programme 2002–2016. Irrigation<br />
development program. MoWR, Addis<br />
Ababa, Ethiopia. 57 pp.<br />
MoWR (Ministry <strong>of</strong> <strong>Water</strong> Resources).<br />
(2006). Five year Irrigation development<br />
Programmme (2005/06 – 2009/10).<br />
MoWR, Addis Ababa, Ethiopia. 57 pp.<br />
Vaidynathan, A. Krishnakumar, A.<br />
Rajagopal, A. Varharajan, D. (1994).<br />
Impact <strong>of</strong> irrigation on productivity <strong>of</strong><br />
land. Journal <strong>of</strong> Indian School <strong>of</strong><br />
Political Economy 6(4).<br />
Werfring, A., 2004. Typology <strong>of</strong> Irrigation<br />
in Ethiopia. A thesis submitted to the<br />
University <strong>of</strong> Natural Resources and<br />
Applied Life Sciences Vienna. <strong>Institute</strong><br />
<strong>of</strong> Hydraulics and Rural <strong>Water</strong><br />
<strong>Management</strong> in partial fulfillment <strong>of</strong> the<br />
degree <strong>of</strong> Diplomingeieur.<br />
World Bank (2006). Managing water<br />
sources to maximize sustainable growth:<br />
A World Bank <strong>Water</strong> Resource<br />
Assistance Strategy for Ethiopia.<br />
Agriculture and Rural Development<br />
Department. World Bank.<br />
153
Annex I<br />
<strong>Table</strong> 10a: Gross margin <strong>of</strong> rain fed crops<br />
Mean area Gross value <strong>of</strong><br />
GM per ha rain<br />
Crop type (in timad) output/ mean area GM rain fed fed<br />
Wheat 1.3 857 366.7 1089.6<br />
Teff 1.8 806 437.8 956.9<br />
Barley 1.2 507.7 429.2 1493<br />
Maize 1.7 609.2 341 816.7<br />
Finger millet 1.3 717 652.6 2055.4<br />
Sorghum 2.4 754.7 644.6 1053.8<br />
Chick pea 1.3 498.4 337.9 1031.7<br />
Lathyrus 1.2 654.8 592.2 1970.8<br />
Bean 1.2 725 334.3 1078.5<br />
Lentil 0.6 309.4 250.4 1584.8<br />
Nug 2.2 1132.3 939.6 1709.9<br />
Grass pea 1.6 568.2 237.9 599.2<br />
Eucalyptus 0.9 271.3 259.7 1185.6<br />
Hops 0.6 214.1 136.5 956<br />
Other 1.1 495.4 407.8 1553.6<br />
154
<strong>Table</strong> 10b: Gross margin <strong>of</strong> irrigated crops<br />
Mean area<br />
Crop type (in timad) GVOUT GM irrigated GM per ha<br />
Wheat 1.4 1291.2 745.3 2077.7<br />
Teff 1.5 904.7 514.2 1418.4<br />
Barley 1 687.2 513.1 2052.3<br />
Maize 1.6 864.7 610.4 1575.1<br />
Sorghum 1.7 720.4 610.8 1480.7<br />
Cotton 2 394.9 354.8 709.6<br />
Chick pea 1.4 966.3 452.3 1256.5<br />
Lathyrus 1.3 390 252 800.1<br />
Bean 1.1 641.1 265.8 1012.6<br />
Lentil 1 1505 1309.4 5237.6<br />
Nug 1.4 717 538.5 1516.8<br />
Grass pea 2.2 916.4 420.2 771.8<br />
Pea 1.5 1467 617.7 1625.5<br />
Linseed 2.1 445.2 252.7 493<br />
Pepper 1 952.2 833.7 3437.9<br />
Potato 0.9 574.6 420 1812.5<br />
Sweet potato 2 498 397 814.3<br />
Cabbage 0.8 821 662.3 3230.8<br />
Onion 1.5 3112 2699.4 7415.8<br />
Tomato 1.5 1506.1 1017.7 2765.4<br />
Shallot 0.9 1873.5 1016.2 4471.7<br />
Papaya 1 679.5 625.4 2399.9<br />
Banana 1.9 534.1 475.8 995.9<br />
Mango 1.2 711 652.2 2211<br />
Guava 0.7 1038 933.7 5412.8<br />
C<strong>of</strong>fee 0.7 8407.4 8341.4 45210.6<br />
Sugar cane 0.8 1001.3 869.52 4528.77<br />
Eucalyptus 0.8 5191.9 5113.7 26808.3<br />
Hops 0.9 441.4 340 1456.1<br />
Chat 0.6 1221.9 1098.5 7323.7<br />
Enset 1 400.5 258.3 1051.2<br />
Other 1 505.6 441.4 1736.2<br />
155
Investment in irrigation as a poverty reduction strategy: Analysis <strong>of</strong> smallscale<br />
irrigation impact on poverty in Tigray, Ethiopia<br />
Gebrehaweria Gebregziabher 1 and Regassa E. Namara 2<br />
1 Norwegian University <strong>of</strong> Life Sciences (UMB), N1432, Ås, Norway;<br />
and Mekelle University, Ethiopia<br />
2 <strong>International</strong> <strong>Water</strong> <strong>Management</strong> <strong>Institute</strong>, Africa Regional Office, Accra, Ghana<br />
gebrge@umb.no<br />
Abstract<br />
The regional government <strong>of</strong> Tigray has invested<br />
in millions <strong>of</strong> Birr to develop irrigation schemes<br />
as a strategy <strong>of</strong> poverty reduction. The study was<br />
based on a representative sample <strong>of</strong> 613 farm<br />
households (331 irrigators and 282 nonirrigators)<br />
drawn using three stage stratified<br />
sampling with probability proportional to size.<br />
The main aim <strong>of</strong> this paper is to study the impact<br />
<strong>of</strong> irrigation on household income, therefore, to<br />
contribute to the scant literature on irrigationpoverty<br />
reduction nexus in Ethiopia, which<br />
policy makers can use it as an input to make<br />
informed policy decisions in their future<br />
endeavors. We found that farming income is<br />
more important to irrigating households than to<br />
non-irrigating households, while <strong>of</strong>f-farm<br />
income is negatively related with access to<br />
irrigation. We also found that irrigating<br />
households’ average income is above the<br />
regional average, while non-irrigating<br />
households’ average income is 50 percent less<br />
than the average income <strong>of</strong> irrigating<br />
households. Although there can be other factors,<br />
which may contribute to the difference in<br />
income, these results are inline with our<br />
expectation and supports the decision <strong>of</strong> the<br />
Tigray government to use irrigation as a poverty<br />
reduction tool. We have used a stochastic<br />
dominance analysis and found that the results<br />
are consistent. This result differs from a<br />
previous study by Pender et al. (2002), which<br />
argues that irrigation has less impact in<br />
agricultural yields than expected, reducing<br />
returns to investment in modern irrigation.<br />
Keyword: Tigray, Irrigation, Poverty reduction,<br />
Matching, Propensity Score<br />
1. Introduction<br />
Ethiopia is one <strong>of</strong> the poorest economies in the<br />
world (Hagos 2003) and Tigray is its poorest<br />
and most severely food insecure region as<br />
compared to the other regions <strong>of</strong> the country<br />
except to SNNPR (Federal Democratic Republic<br />
<strong>of</strong> Ethiopia (FDRE) 1999). Poverty reduction in<br />
Tigray is a core policy agenda <strong>of</strong> the Ethiopian<br />
government in general and the regional<br />
government <strong>of</strong> Tigray in particular. A general<br />
consensus was reached that an increase in<br />
agricultural production and poverty reduction<br />
should come mainly through agricultural<br />
intensification and adoption <strong>of</strong> technologies that<br />
improve soil moisture to use more productivity<br />
enhancing inputs. The use <strong>of</strong> productivity<br />
enhancing inputs (such as fertilizer and high<br />
yielding variety) depends much on availability<br />
<strong>of</strong> moisture in which case, investment in<br />
irrigation becomes crucial. Despite the role <strong>of</strong><br />
irrigation in easing the effect <strong>of</strong> rainfall<br />
uncertainty on agricultural performance,<br />
Ethiopia in general having an immense irrigation<br />
potential, has remained dependent on rain-fed<br />
and less productive agriculture, which resulted<br />
in food insecurity and sever poverty. To this<br />
end, the Ethiopian government in general and<br />
the regional government <strong>of</strong> Tigray in Tigray has<br />
focused on rural investment on small-scale<br />
irrigation as a key poverty reduction strategy.<br />
Since the establishment <strong>of</strong> the Commission for<br />
Sustainable Agricultural and Environment<br />
Rehabilitation <strong>of</strong> Tigray (CoSAERT) in 1995,<br />
54 micro-dams; 106 river diversion; and a<br />
156
number <strong>of</strong> spate irrigation projects were<br />
constructed with a total irrigation capacity <strong>of</strong><br />
3700 hectares benefiting 19,000 households<br />
(Abraha 2003). In addition to the government’s<br />
effort, non-governmental organizations such as<br />
Relief Society <strong>of</strong> Tigray (REST), have invested<br />
in irrigation projects. According to Abraha<br />
(2003), a micro-dam project, to irrigate 100<br />
hectares, is estimated to cost about 5.84 million<br />
Birr (1US$=8.65 Birr), while a river diversion<br />
project that can irrigate 45 hectares costs 1.17<br />
million Birr, in which case investment per<br />
hectare is estimated at 58,390 and 25,896 Birr,<br />
in dam and river diversion projects, respectively.<br />
In spite <strong>of</strong> the high optimism and the amount <strong>of</strong><br />
resources committed to develop irrigation,<br />
Pender et al (2002), argued that in Tigray<br />
“irrigation has contributed to intensification <strong>of</strong><br />
land use and to change in crop choice, but has<br />
been associated with less adoption <strong>of</strong> fertilizer<br />
and improved seeds and less improvement in<br />
yields than expected. As a result, it appears that<br />
the returns to investment in modern irrigation so<br />
far have been relatively low”. On the other hand,<br />
given the experience that irrigation has been an<br />
enabling factor for the use <strong>of</strong> other productivity<br />
enhancing agricultural inputs (Dhawan 1988),<br />
and the high expectation from irrigation as antipoverty<br />
program, the findings <strong>of</strong> Pender et al.<br />
(2002) seem to be paradoxical, which attract the<br />
attention <strong>of</strong> researchers, policy makers and<br />
financing agencies.<br />
The existing literature and empirical studies<br />
dealing directly with irrigation-poverty linkage<br />
are not only dominantly <strong>of</strong> Asian origin, but they<br />
are few, recent origin and polarized. On the<br />
other hand, although there are many studies,<br />
which indirectly deal with the linkages <strong>of</strong><br />
irrigation and household income as a proxy <strong>of</strong><br />
household wellbeing or poverty, most <strong>of</strong> them<br />
are like a by-product <strong>of</strong> a general analysis <strong>of</strong> the<br />
phenomenon <strong>of</strong> agricultural growth and/or<br />
poverty (Saleth et al. 2003). Literature review<br />
pertinent to the linkages <strong>of</strong> irrigation-household<br />
income and poverty reduction is presented in the<br />
next section. In general, we note that there is a<br />
knowledge gap whether small-scale irrigation<br />
contributes to increase household income and<br />
poverty reduction. To our best knowledge,<br />
Hagos et al. (2006) is the only recent research<br />
output from Tigray which deals with the impact<br />
<strong>of</strong> small-scale water harvesting (ponds and<br />
shallow-wells) on household poverty. This study<br />
is the first <strong>of</strong> its kind anywhere in Ethiopia in<br />
addressing and comparing three irrigation<br />
systems (i.e., earth dam, river diversion and<br />
shallow wells) under different agro-ecological<br />
settings. Furthermore, it has made an effort to<br />
address the complete pathways and layers that<br />
could exist between irrigation and poverty<br />
reduction.<br />
Accordingly, the main objectives <strong>of</strong> this paper<br />
are:<br />
1) To study the impact <strong>of</strong> small-irrigation on<br />
household income in Tigray, so that policy<br />
makers can use the research outcome to make<br />
informed policy decision. To this end, we<br />
investigate irrigation’s impact on household<br />
income. We also test whether irrigation has an<br />
effect on <strong>of</strong>f-farm employment and income<br />
diversification.<br />
2) This paper seeks to contribute to the empirical<br />
literature on irrigation-poverty reduction<br />
linkages, through a better understanding the<br />
pathways <strong>of</strong> irrigation-household income and<br />
poverty reduction from the experience <strong>of</strong> Tigray,<br />
Ethiopia.<br />
To achieve the main objectives specified above,<br />
we develop an analytical framework that depicts<br />
the linkage between irrigation-household income<br />
and poverty reduction (see Figure 1). The<br />
framework shows how the linkage works<br />
between four inter-linked systems (which are:<br />
irrigation, socio-economic, household<br />
characteristics and agro-climatic systems).<br />
The structure <strong>of</strong> the paper is as follows: section<br />
2 reviews related literature, while in section 3;<br />
we describe the conceptual framework that<br />
captures the pathways. In section 4, we briefly<br />
discuss data, sampling procedure and the study<br />
area. Section 5, is dedicated to discuss the<br />
empirical method. In this section, we have<br />
discussed factors that determine participation;<br />
hence, we identify varibles that are used to<br />
match participants with non-participants.<br />
Furthermor, we have brifley discussed the<br />
advantges and limitations <strong>of</strong> PSM as an<br />
157
estimation method. We use section 6 to presents<br />
results and discussions followed by conclusion<br />
in section 7.<br />
2. Literature review<br />
Among the existing literature on irrigation and<br />
its impact on poverty reduction, some are based<br />
on empirical research, which focuses on specific<br />
locations. These types <strong>of</strong> literatures use primary<br />
or secondary data and are methodologically<br />
rigorous. On the other hand there are literatures,<br />
which are based on perceptions and logic based<br />
arguments (e.g Lipton and Litchfield, 2003; ),<br />
while the third type <strong>of</strong> literature is based on<br />
project evaluation, which mostly is based on the<br />
interest <strong>of</strong> funding organization (Hussain and<br />
Hanjra, 2004). Among these, one <strong>of</strong> the studies<br />
that attempt to deal with irrigation poverty<br />
linkages is (Hussain and Wijerathna, 2004),<br />
which is a wide-ranging study that covers six<br />
major Asian countries (i.e., Pakistan, India,<br />
Bangladesh, China, Vietnam and Indonesia).<br />
Although highly aggregated and review based,<br />
Hussain and Wijerathna (2004) argued that<br />
irrigation reduces poverty both directly and<br />
indirectly, where the direct impacts are realized<br />
through labour and land augmentation effect that<br />
ultimately translates to improved productivity,<br />
employment, income and consumption, while<br />
the indirect impact is realized through enhanced<br />
local economy and improved welfare at macro<br />
level (Hussain and Wijerathna, 2004).<br />
Regardless <strong>of</strong> the methodologies applied, most<br />
<strong>of</strong> the studies carried to investigate the impact <strong>of</strong><br />
irrigation on poverty reduction are classified as<br />
comparative analysis, such as before and after,<br />
with and without or more or less comparisons<br />
Hussain and Hanjra (2004) is one <strong>of</strong> the<br />
descriptive/comparative type study, which<br />
attempts to study the irrigation-poverty linkage,<br />
and argued that access to irrigation reduces<br />
poverty. Furthermore, Hussain et al. (2006) has<br />
used primary data to make a comparative<br />
analysis <strong>of</strong> irrigation impact on household<br />
income in the marginal areas <strong>of</strong> Pakistan, where<br />
it concludes that small-scale irrigation is<br />
positively correlated with household income and<br />
then reduces poverty. Similarly, Bhattarai and<br />
Narayanamoorthy, (2003) has used both cross<br />
section and time series data to study the effect <strong>of</strong><br />
investment in irrigation in poverty reduction in<br />
India, where they found that investment in<br />
irrigation as compared to investment in rural<br />
letracy was more effective poverty reduction<br />
instrument, but since they used a single equation<br />
and highly aggregated data it makes it difficult<br />
to capture the layers and linkages between<br />
irrigation, agricultural growth and poverty<br />
reduction (Saleth et al. 2003).<br />
Furthermore, the success stories <strong>of</strong> China’s food<br />
self sufficiency in the 1960s and 1970s, was<br />
attributed to a massive investment in irrigation<br />
(Huang et al., 2005; and Huang et al., 2006)<br />
implying that irrigation plays an important role<br />
in poverty reduction. Huang et al. (2005) has<br />
used household level cross sectional data to<br />
apply a multivariate analysis method, where it<br />
found a strong positive correlation between<br />
access to irrigation and household income,<br />
leading to poverty reduction and equitable<br />
income distribution.<br />
As mentioned above, the literature on irrigation<br />
and its impact is polarized. For example, unlike<br />
to the above stated literature, different studies<br />
which manly used aggregated data (e.g.,<br />
Rosegrant and Evenson, 1992; Jin et al.,2002;<br />
and Fan et al.,2000 ) have found negative and/or<br />
weak relationship between irrigation and<br />
agricultural productivity implying negative or no<br />
impact on household income and poverty<br />
reduction at large. According to Rosegrant and<br />
Evenson (1992), for example the effect <strong>of</strong><br />
irrigation on agricultural productivity in India<br />
was found negative. Moreover, Jin et al. (2002)<br />
uses aggregated nation wide data <strong>of</strong> China’s<br />
major crops but cannot find a relationship<br />
between irrigation and total factor productivity<br />
(TFP). On the other hand, Fan et al.(2000) has<br />
made a comparative analysis <strong>of</strong> impact <strong>of</strong> public<br />
expenditure in irrigation, research &<br />
development, road, education, electrification and<br />
rural telephone networking, where “investment<br />
in irrigation was found to have the least impact<br />
on both production and poverty alleviation” (Fan<br />
et al.,2000). Most <strong>of</strong> the studies that used<br />
aggregate data could not identify a positive<br />
contribution <strong>of</strong> irrigation to poverty reduction,<br />
implying that the direct effect <strong>of</strong> irrigation could<br />
158
e undermined by other factors which could<br />
have been observed at household and/or plot<br />
level.<br />
In general, the lack <strong>of</strong> consensus regarding the<br />
linkages between irrigation and poverty<br />
reduction seems to mirror the general debate<br />
regarding the role <strong>of</strong> investment in agriculture.<br />
For instance, Christiaensen et al. (2006) argue<br />
that although the majority <strong>of</strong> poor people in<br />
developing countries, especially in Sub-Saharan<br />
Africa (SSA), depend directly on agriculture for<br />
their livelihood, there is no common view about<br />
the role <strong>of</strong> agriculture in economic development<br />
and poverty reduction. For example, the dual<br />
economy model inspired by Lewis in the 1950s,<br />
argue that resources have to be diverted from<br />
agriculture to the industrial sector, while a<br />
positive view that emerged in the early 1960s<br />
argue about investment in agriculture and its<br />
contribution to economic growth and poverty<br />
reduction is more than an equal amount <strong>of</strong><br />
investment in non-agriculture (Christiaensen et<br />
al. 2006). The experience <strong>of</strong> the Green<br />
Revolution in Asia, where traditional agriculture<br />
was rapidly transformed substantiates the role <strong>of</strong><br />
investment in agriculture in economic growth<br />
and poverty reduction (Christiaensen et al.<br />
2006). Empirical evidences show that in areas<br />
where irrigation is widely used, agricultural<br />
yields and household income are higher, and less<br />
poverty and undernourishment are observed<br />
(FAO 2003). In the framework we made clear<br />
that the impact <strong>of</strong> irrigation comes through its<br />
multi-dimensional effect.<br />
3. Conceptual framework<br />
We hypothesize that irrigation had a significant<br />
impact on agricultural performance and poverty<br />
reduction in Tigray. We assume that the effect <strong>of</strong><br />
irrigation on production is ultimately translated<br />
to household income and poverty reduction.<br />
Although it may differ from location to location<br />
and irrigation technology/system, the pathways<br />
through which irrigation can impact on poverty<br />
reduction are complex and diverse. Hence, if<br />
researchers and policy makers have to<br />
understand how irrigation affects poverty, it is<br />
essential to understand the complexity and<br />
diversity <strong>of</strong> pathways and linkages. Accordingly,<br />
we developed a conceptual framework (see<br />
Figure 1) as a guide to our research. Figure 1<br />
illustrates the basic relationship capturing the<br />
major pathways and layers inherent in irrigationpoverty<br />
linkage, which helps to net out the<br />
impact <strong>of</strong> irrigation on poverty reduction. The<br />
framework makes clear that the impact <strong>of</strong><br />
irrigation comes through its multi-dimensional<br />
effect, such as its effect in input use, crop<br />
intensity, land and labour productivity.<br />
In rural areas where most <strong>of</strong> the people depend<br />
on agriculture for their food and income, water<br />
and food security are closely related (FAO<br />
2003). In the framework, the impact <strong>of</strong> irrigation<br />
on household income and poverty reduction is<br />
captured through two major pathways (i.e., land<br />
and labour productivity). Irrigation enhances the<br />
use <strong>of</strong> agricultural inputs (such as fertilizer and<br />
HYV), which in turn improves the productivity<br />
<strong>of</strong> land and labor (especially, agricultural labor)<br />
ultimately resulting in high household income<br />
and poverty reduction. Such an agricultural<br />
performance could result either because <strong>of</strong> the<br />
input use effect or simply due to the external<br />
shock minimizing effect <strong>of</strong> irrigation.<br />
For example, crop production in the highlands <strong>of</strong><br />
Tigray requires more than 90 days (for<br />
vegetative and flowering), but usually the rain<br />
stays effectively for about 60 days (during July-<br />
August), where agricultural crops are grown<br />
once a year, therefore, farmers are not willing to<br />
invest in fertilizer and other agricultural inputs,<br />
because <strong>of</strong> the risk <strong>of</strong> crop failure. As a result<br />
agricultural productivity is low and poverty is<br />
high. FAO (1999) argued that higher<br />
productivity and production is associated with<br />
high input use, therefore, the main constraint to<br />
increase food production is limited uptake <strong>of</strong><br />
new technologies by risk-averse farmers. The<br />
uncertainty caused by unreliable moisture<br />
availability is the main factor behind the risk<br />
aversion behavior <strong>of</strong> farmers. Since the<br />
exogenous component <strong>of</strong> production uncertainty<br />
is reduced with assured access to irrigation, we<br />
assume that production and income difference<br />
between irrigating and rain-fed households is<br />
observed even if there is no difference in input<br />
use.<br />
159
Another dimension through which irrigation can<br />
impact on household income and poverty<br />
reduction is through its spillover effect. The<br />
economic integration (linkage) effect <strong>of</strong><br />
irrigation on poverty reduction is important, but<br />
in most cases remains masked. As discussed<br />
above, irrigating households benefit directly<br />
through increased and stable income or because<br />
<strong>of</strong> the higher value <strong>of</strong> irrigated land. On the<br />
other hand, even landless laborers and small<br />
farmers who have no access to irrigation <strong>of</strong>ten<br />
benefit through higher wages, lower food prices<br />
and a more varied diet (FAO 2003). Therefore,<br />
in areas where there is irrigation project, we<br />
assume that more jobs and informal businesses<br />
(such as family based petty trade) are created.<br />
Since irrigation creates demand for small scale<br />
implements, credit, marketing and extension<br />
services, every job created due to irrigation may<br />
trigger another job in the non-agricultural sector.<br />
Figure 1 depicts the relationship between<br />
irrigation and poverty in more detail. The keys<br />
to the acronyms used in the figure are presented<br />
in table 1.<br />
160
Figure 1 Impact <strong>of</strong> Irrigation on Household Income and Poverty Reduction: Irrigation-Poverty Linkages<br />
IRRIGATION SYSTEM<br />
DAM<br />
GWM<br />
GWT<br />
RDIV<br />
HHSIZE<br />
SEX<br />
EDUC<br />
AGE<br />
COWORO<br />
I<br />
R<br />
R<br />
I<br />
HOUSEHOLD CHARACTERSTICS<br />
LANDPR<br />
A<br />
G<br />
R<br />
I<br />
N<br />
C<br />
O<br />
M<br />
E<br />
LABPR<br />
O<br />
T<br />
H<br />
I<br />
N<br />
C<br />
O<br />
M<br />
E<br />
I<br />
N<br />
P<br />
U<br />
T<br />
SOCIO-ECONOMIC SYSTEM<br />
OX & LIVSTOCK<br />
ASSET<br />
CREDIT<br />
LABOUR<br />
LSIZE<br />
MARKET<br />
AGRO-CLIMATE SYSTEM<br />
ALTITUDE<br />
AVRAFLL<br />
CV<br />
SOILTYPE<br />
LANQUALI<br />
HOUSEHOLD<br />
INCOME<br />
(HHINCOME)<br />
POVERTY REDUCTION<br />
(POVREDU)<br />
161
4. Data and the study area<br />
The data used in this paper was obtained from a<br />
survey made to study small-scale irrigation in<br />
the Tigray region, Ethiopia as part <strong>of</strong> a PhD<br />
study program. The study area covers six<br />
communities (tabias), each <strong>of</strong> which consists <strong>of</strong><br />
about 4 villages. As presented in Figure 2, <strong>of</strong> the<br />
six sites, two each are in the southern and Northwest<br />
zones, while the others are one each in<br />
Eastern and Central zone <strong>of</strong> Tigray; therefore,<br />
we believe that our data is representative <strong>of</strong> the<br />
region <strong>of</strong> Tigray.<br />
Figure 2: Map <strong>of</strong> Tigray, Ethiopia and study sites.<br />
The sample selection process involved three<br />
stage stratified random sampling. First, all<br />
tabias in the region having irrigation projects<br />
were stratified based on the type <strong>of</strong> irrigation.<br />
Six sites were selected among which two <strong>of</strong><br />
them use micro-dam, two river diversions and<br />
the rest two use ground water as a source <strong>of</strong><br />
irrigation. Among the two ground water sites<br />
Kara-Adi-Shawo irrigation project located in<br />
Golgol Raya uses pressurized tube<br />
(drip/sprinkler) irrigation systems.<br />
In the second stage, we stratified all farm<br />
households in each tabia based on their access to<br />
irrigation. Access to irrigated plot through any<br />
other means (such as formal or informal land<br />
rental contract) was not considered in the<br />
stratification process. Finally, we randomly<br />
selected 613 farm households (100 sample<br />
162
households from each <strong>of</strong> the five tabias and 113<br />
households from Kara-Adi-Shawo). The<br />
proportion <strong>of</strong> sample households with and<br />
without access to irrigation mirrors the<br />
proportion <strong>of</strong> total households in the respective<br />
tabia. This approach enables us to collect<br />
information about non-irrigating households<br />
who are comparable in basic characteristics to<br />
the irrigators that can serve as counterfactual.<br />
From the total <strong>of</strong> 613 sample households, 331 <strong>of</strong><br />
them had access to irrigation and 282 <strong>of</strong> them<br />
were purely rain-fed cultivators.<br />
We asked our respondents about their household<br />
specific information. We have also collected<br />
data on farm input and output by asking each<br />
household head to recall his activities and<br />
production on a particular plot during the<br />
immediate past harvest year, that includes<br />
multiple cropping, especially in irrigated plots.<br />
Data collection was carried during October-<br />
December, 2005. Detailed plot level data was<br />
also collected. A plot is defined as a distinct<br />
management unit based on the type <strong>of</strong> crop<br />
planted during the 2004/2005 agricultural year.<br />
Plot size was not physically measured, but we<br />
ask farmers to tell us in local measurement unit<br />
(i.e., in tsimdi). Four tsimdi is equivalent to one<br />
hectare. We have asked each respondent about<br />
the prices <strong>of</strong> input and output, but we have also<br />
randomly checked in the nearby market from<br />
which we calculated an average price for each<br />
product type in order to control the effect <strong>of</strong><br />
price difference. The empirical method <strong>of</strong><br />
analysis is outlined below.<br />
5. Empirical Method<br />
5.1. Estimation Method<br />
The difficulty in impact evaluation is,<br />
identifying the comparison group (the<br />
counterfactual). To make an impact evaluation,<br />
we need to know what the outcome (in our case<br />
the income <strong>of</strong> households who actually have<br />
access to irrigation) would have been in the<br />
absence <strong>of</strong> irrigation (i.e., the counterfactual).<br />
Once the problem <strong>of</strong> identifying the<br />
counterfactual is resolved, the difference<br />
between the actual and the would be income is<br />
the impact <strong>of</strong> irrigation. However, since the<br />
counterfactual income is not observed, resolving<br />
such missing data problem requires feasible<br />
method <strong>of</strong> estimation that is based on economic<br />
theory. In other words, in studying the impact <strong>of</strong><br />
irrigation, a methodological problem that is<br />
frequently observed is the tendency to assume<br />
every income and poverty difference observed<br />
between households with and without access to<br />
irrigation solely attributed to the irrigation factor<br />
(Dhawan 1988), therefore, to insure<br />
methodological rigorousness, estimating the<br />
counterfactual is at the core <strong>of</strong> impact evaluation<br />
(Baker 2000). In line with this, we used<br />
matching method to form a counterfactual<br />
against which comparison can be made. To<br />
analyze the impact <strong>of</strong> small-scale irrigation in<br />
Tigray, we consider irrigation as a treatment and<br />
rain-fed as a control. A dummy variable I is used<br />
to denote access to irrigation, where (I=1) if<br />
household i has access to irrigation, and (I=0)<br />
otherwise. Variables Y 1 and Y 0 represent<br />
household’s income with and without access to<br />
irrigation, respectively. Subscripts 1 and 0<br />
indicate income with and without access to<br />
irrigation, respectively. In line with this, the<br />
impact <strong>of</strong> irrigation on income <strong>of</strong> household i is<br />
given by:<br />
Δ<br />
iY = Y1 i<br />
− Y0i<br />
[1]<br />
For a household who have access to irrigation,<br />
we only observe Y 1i<br />
, while for those who have<br />
no access Y 0i<br />
is observed, implying that a<br />
household can not be in both situations at a,<br />
therefore, we only observe Y<br />
1i<br />
or Y<br />
0i<br />
, which can<br />
be written as:<br />
Y = IY + ( 1− I)<br />
Y<br />
[2]<br />
i 1i 0i<br />
In Equation [2] if I = 1, (1-I) = 0, thusYi<br />
= IY1<br />
i<br />
and the reverse is also true. When we say<br />
impact, we mean the change in income due to<br />
access to irrigation, thus by rearranging equation<br />
[2], we get<br />
Yi = Y0<br />
i<br />
+Δ<br />
iI<br />
[3]<br />
If household i has no access to irrigation, I = 0,<br />
Δ i I = 0, therefore, Y = Y0<br />
.<br />
i<br />
In summary, we draw three basic points about<br />
the whole process <strong>of</strong> examining the impact <strong>of</strong><br />
i<br />
163
irrigation. Firstly, the framework differentiates<br />
between outcomes ( Y 1i<br />
and Y<br />
0i<br />
) and impact (Δ i ).<br />
The former is simply about describing the<br />
outcomes ( Y 1i<br />
and Y 0i<br />
), while the second is<br />
about impact (Cobb-Clark and Crossley 2003).<br />
Secondly, the analytical framework allows for<br />
heterogeneity in impact as well as in income<br />
(income without irrigation). This point is very<br />
important in an empirical impact study and<br />
differentiates the analytical framework adopted<br />
in this study from other models which assume<br />
homogeneity. The assumption <strong>of</strong> heterogeneity<br />
is important, because in practice, all households<br />
who have access to irrigation can not benefit<br />
equally due to heterogeneous characteristics.<br />
Thirdly, the framework is restrictive, because it<br />
assumes a Stable-Unit-Treatment-Value<br />
(SUTV). As explained in the second point, the<br />
impact <strong>of</strong> irrigation varies across households due<br />
to their heterogeneous characteristics, and it<br />
assumes that any impact is confined within that<br />
household which implies SUTV, thus it rules out<br />
the possible interaction effect, however, this<br />
may not be plausible assumption, because <strong>of</strong> the<br />
spillover effect <strong>of</strong> irrigation.<br />
The assumption <strong>of</strong> heterogeneity is important to<br />
frame our analysis. According to Cobb-Clark<br />
and Crossley (2003), population average<br />
treatment effect (ATE) [Ε(Δ i )] and average<br />
treatment effect on the treated (ATT)<br />
⎡E( Δ<br />
i<br />
I = 1)<br />
⎤<br />
⎣ ⎦<br />
are different, but are frequently<br />
estimated impact parameters, which can be<br />
specified as in equation (4) and (5), respectively.<br />
ATE = E Δ = E Y − Y =<br />
( i) [ 1i 0i]<br />
{ E ⎡Y1i − Y0i I = ⎤ ( I = ) } + E ⎡Y1i − Y0i<br />
I = ⎤ ( I = )<br />
Since the objective <strong>of</strong> this paper is to estimate<br />
the average treatment effect on the treated<br />
(ATT), Equation (4) is irrelevant. Hence, the<br />
average effect <strong>of</strong> the treatment (irrigation) on the<br />
income <strong>of</strong> the treated (ATT) can be written as:<br />
ATT = ⎡E Δ I = ⎤ = E ⎡Y − Y I = ⎤ = E ⎡Y I = ⎤− E ⎡Y I = ⎤<br />
⎣<br />
( i<br />
1) 1i 0i 1<br />
1i 1<br />
0i<br />
1 [ 5]<br />
⎦<br />
The difference between equation (4) and (5) is<br />
that Equation (4) estimates the average treatment<br />
effect <strong>of</strong> irrigation on the income <strong>of</strong> the whole<br />
population irrespective <strong>of</strong> household’s access to<br />
irrigation, i.e., E(Δ i ), while Equation (5)<br />
estimates the average treatment effect<br />
conditional on access to irrigation, i.e., E(Δ i ⎢I =<br />
1), which is ATT. The most common evaluation<br />
context is one <strong>of</strong> ex-post evaluation, where we<br />
wish to know what change in outcomes an<br />
intervention delivered for those who were<br />
subject to the intervention (Cobb-clark and<br />
Crossley 2003).<br />
ATT could have give a policy idea about the<br />
possible impact <strong>of</strong> irrigation if more investment<br />
is made to expand the program and more<br />
households get access to irrigation. However,<br />
the basic problem in estimating ATT is the<br />
missing data problem. For example, in Equation<br />
(5), E⎡⎣ Y1 i<br />
I = 1⎤⎦ is observed, while<br />
E⎡⎣<br />
Y0 i<br />
I = 1⎤⎦ is missing. If we assume that the<br />
impact <strong>of</strong> irrigation is homogenous, it would<br />
imply that Equation (4) is equal to Equation (5),<br />
i.e., ATE = ATT. Thus the missed data would<br />
have been estimated by E⎡⎣Y0 i<br />
I = 0⎤⎦ in<br />
Equation (4), because homogeneity assumes that<br />
E⎡⎣ Y0 i<br />
I = 1⎤⎦ = E⎡⎣<br />
Y0 i<br />
I = 0⎤⎦ . However, since<br />
different households have different<br />
characteristics, they respond quite differently to<br />
the same treatment. Hence, the realistic<br />
assumption about the impact <strong>of</strong> irrigation is<br />
heterogeneity, which invalidates the possibility<br />
that the missed data E⎡⎣Y0 i<br />
I = 1⎤⎦ in Equation<br />
(5) can be approximated by E⎡⎣Y0 i<br />
I = 0⎤⎦ as in<br />
⎣ 1⎦ Pr 1 { ⎣<br />
Equation (4). Therefore, the basic question is,<br />
how 0⎦<br />
Pr can we 0 estimate } [ the 4]<br />
income <strong>of</strong> those<br />
households who actually have access to<br />
irrigation in the absence <strong>of</strong> irrigation.<br />
One possibility to handle such a problem is to<br />
use the income <strong>of</strong> households who have no<br />
access to irrigation to estimate what the income<br />
<strong>of</strong> those households who have access to<br />
⎣ ⎦ ⎣ irrigation ⎦ ⎣ would ⎦have been in the absence <strong>of</strong><br />
irrigation which can be written as:<br />
E⎡⎣ Δ<br />
i<br />
I = 1⎤⎦= E⎡⎣Y1 i<br />
− Y0i I = 1⎤⎦= E⎡⎣Y1 i<br />
I = 1⎤⎦− E⎡⎣Y0i<br />
I = 1⎤⎦<br />
[6]<br />
164
Observed Missing<br />
If we use income <strong>of</strong> non-participating household<br />
to estimate the unobservable/missing data,<br />
equation (6) can be rearranged as:<br />
treated, i.e., I =1, therefore, the missing data is<br />
E⎡⎣Δ i<br />
I = 1⎤⎦ = E⎡⎣Y1 i<br />
I = 1⎤⎦− E⎡⎣Y0i<br />
I = 0⎤<br />
now estimable through the counterfactual as<br />
⎦<br />
follows.<br />
[7a]<br />
By subtracting and adding E⎡⎣Y0 i<br />
I = 1⎤⎦ to Δ= [ ] [ 8<br />
i<br />
Y1 i−<br />
EY0 i<br />
]<br />
But, since Equation (8) estimates homogeneous<br />
equation (7a) we get<br />
impact, while the heterogeneous impact (ATT)<br />
is estimated as:<br />
E⎡⎣Y1 i<br />
I = 1⎤⎦− E⎡⎣Y0i I = 0⎤⎦− E⎡⎣Y0i I = 1⎤⎦+ E⎡⎣Y0i<br />
I = 1⎤<br />
1 1<br />
ATT ⎦ = ⎡E ( i<br />
I 1 ) ⎤<br />
⎣<br />
Δ =<br />
⎦<br />
= ∑( Y<br />
1i− E[ Y<br />
0i]<br />
) I = ∑ΔiI<br />
[ 9]<br />
[7b]<br />
I<br />
I<br />
By rearranging the above specification, we<br />
obtain<br />
5.2. Selection procedure <strong>of</strong> participants<br />
E⎡Y − Y I = 1⎤+ E⎡Y I = 1⎤− E⎡Y I = 0⎤<br />
=<br />
⎣ 1i 0i ⎦ ⎣ 0i ⎦ ⎣ 0i<br />
⎦<br />
{ 0 0 }<br />
employed, it is important to have clear<br />
E⎡⎣Δ i<br />
I = 1⎤⎦+ E⎡⎣Y i<br />
I = 1⎤⎦− E⎡⎣Y i<br />
I = 0⎤⎦<br />
= ATT + BIAS<br />
understanding about the selection processes <strong>of</strong><br />
[7c]<br />
project site beneficiary placement,<br />
Therefore, it is now clear that Equation (7c)<br />
suffers from bias because the income <strong>of</strong><br />
households with and without access to irrigation<br />
administrative and institutional details <strong>of</strong> the<br />
program (Ravallion, 2005), both at household<br />
and plot level.<br />
would be different in the absence <strong>of</strong> irrigation,<br />
why identifying a counterfactual is the core <strong>of</strong><br />
impact evaluation. While experimental design<br />
method is theoretically ideal for establishing a<br />
counterfactual, it is practically impossible,<br />
hence, it has been shown that non-experimental<br />
design methods, particularly the matching<br />
method is considered as the best solution in<br />
practice (Cobb-Clark and Crossely 2003). In<br />
ATT = E ⎡Δ<br />
I ⎤<br />
Equation (7c), ⎣ i ⎦ and<br />
BIAS = { E ⎣⎡Y 1 0<br />
0i<br />
I = ⎦⎤− E ⎣⎡Y 0i<br />
I = ⎦ ⎤}<br />
,<br />
therefore if a parametric regression method is<br />
applied, the assumption will be no selection bias<br />
in program placement, however, when the<br />
program is policy induced (such as placement to<br />
irrigation), it is purposive placement, then the<br />
outcome will depend on treatment status<br />
implying selection bias (Ravallion, 2005).<br />
Specifically, matching is used to estimate the<br />
expected counterfactual EY [ 0 i]<br />
, I= 1, Xi<br />
= x<br />
{ }<br />
using Y , 0,<br />
0 i<br />
I = Xi<br />
close to x drown from the<br />
households who have no access to irrigation, i.e.,<br />
I =0 to serve as a comparison group for each<br />
household E [ Y1 i]<br />
, I = 1, Xi<br />
= x in the<br />
{ }<br />
When we embark on impact evaluation,<br />
especially when non-parametric method is<br />
Accordingly, in Tigray, irrigation project sites<br />
were selected based on environmental and<br />
geological futures <strong>of</strong> the area, which includes:<br />
availability enough catchments area, sufficient<br />
reservoir, presence <strong>of</strong> sufficient command area,<br />
geological feasibility, short crust length. In the<br />
regional state <strong>of</strong> Tigray, it is a tradition to<br />
consult the community and make sure that the<br />
project is accepted by the community before<br />
construction is started. Moreover, priority is<br />
given to drought prone areas. Accordingly, since<br />
the site selection criteria are related to<br />
topographical issues, whether a plot is irrigated<br />
(treated) or not depends on factors, such as<br />
rainfall agro-ecology; slope <strong>of</strong> land,<br />
susceptibility to erosion, soil type and soil<br />
quality. Commonly, irrigation projects found in<br />
lowland areas with upstream catchments,<br />
therefore, we assume that plots that become<br />
irrigated are steep sloped, and those which are<br />
susceptible to erosion. Furthermore, because <strong>of</strong><br />
continuous soil erosion and/or sediment<br />
accumulation that take place prior to project<br />
165
inception, potentially irrigable plots can be<br />
peroxide by their soil chrematistics.<br />
The issue <strong>of</strong> household’s access to irrigation<br />
(i.e., whether a household is treated or not) is<br />
relevant after the project is constructed.<br />
According to criteria used in the region, priority<br />
is given to farm households who get land within<br />
the command area before the project was<br />
constructed. The standard irrigated plot size is<br />
one tsimidi (i. e., 0.25 ha, that represents an area<br />
a farmer can plough with a pair <strong>of</strong> oxen within a<br />
day), hence, who had more than one tsimidi<br />
were lowered to one tsimidi considering that one<br />
tsimidi <strong>of</strong> irrigable land is equivalent to 2 or 2.5<br />
tsimidi <strong>of</strong> rainfed land (depending on the<br />
availability <strong>of</strong> land in each community),<br />
however, in most <strong>of</strong> the communities, the<br />
withdrawal was done without compensation<br />
because <strong>of</strong> scarcity <strong>of</strong> land. Farm households<br />
who lost land because <strong>of</strong> water in the reservoir<br />
are the next beneficiaries to get the standard size<br />
<strong>of</strong> irrigable land in the command area. Finally,<br />
given that the command area allows (i.e., there is<br />
unoccupied irrigable land), additional farm<br />
households become beneficiaries among which<br />
poor households (i.e., who lacks livestock and<br />
have more family size) and female headed<br />
households get priority. Although small in<br />
number (49 households), we found that<br />
households can access irrigable land through<br />
land rental market. Accordingly, we used<br />
household head’s sex, family size, female and<br />
male adult members <strong>of</strong> the household, plot size,<br />
a dummy variable for type <strong>of</strong> land rented in<br />
(1=irrigated, 0=raiinfed), number <strong>of</strong> plots owned<br />
by the household and dummy variable for<br />
ownership <strong>of</strong> land (i.e., whether the household<br />
has rented in land or not) as matching variables<br />
to estimate the propensity score. Usually,<br />
households with more family size, especially<br />
with more dependent are considered as poor in<br />
the rural areas <strong>of</strong> Tigray as elsewhere in<br />
Ethiopia. Plot number was used as matching<br />
variable, because it proxies the probability <strong>of</strong><br />
having land in the command area and the<br />
probability <strong>of</strong> being considered as a poor. If a<br />
household owned more plots, the probability <strong>of</strong><br />
having land in the command area is high, while<br />
the probability <strong>of</strong> being considered as poor to<br />
get access to irrigation is low. Although,<br />
livestock ownership was used as a selection<br />
variable, it is also an outcome <strong>of</strong> access to<br />
irrigation; hence, we opt not to use it as selection<br />
criteria.<br />
5.3. Why Propensity Score Matching (PSM)<br />
Method?<br />
In practice, participation in anti-poverty program<br />
cannot be randomly; hence, matching method is<br />
among the appropriate evaluation tools to assess<br />
the impact <strong>of</strong> such social programs. To apply the<br />
matching method, it is necessary to identify<br />
households from the non-participant group that<br />
is similar in terms <strong>of</strong> observable characteristics.<br />
However, in practice, since exact matching is<br />
rarely possible, because the observable variables<br />
based on which the counterfactual is estimated<br />
and individuals are matched can be many and<br />
different in dimensions making matching<br />
difficult, options for closeness in matching must<br />
be considered (Rosenbaum and Rubin 1985),<br />
hence, the Propensity Score Matching (PSM)<br />
method, which is based on the assumptions <strong>of</strong><br />
conditional independence and common support,<br />
has been used as one method to solve the<br />
problem <strong>of</strong> dimensionality. The idea <strong>of</strong><br />
estimating propensity score is used to balance<br />
households who have access to the treatment<br />
(irrigation) by choosing control households from<br />
those who have no access to the treatment<br />
(irrigation), but look like the treated households<br />
based on observable characteristics (Ho et al.,<br />
2007), therefore, are comparable to estimate the<br />
impact <strong>of</strong> irrigation. “The use <strong>of</strong> PSM relaxes<br />
the assumption <strong>of</strong> exogenous placement <strong>of</strong> antipoverty<br />
programs, and it attempts to balance the<br />
distribution <strong>of</strong> observables, i.e., the propensity<br />
score” (Ravallion, 2005), therefore, unlike the<br />
much theoretic randomization, PSM emphasizes<br />
on the matching variables and on the quality and<br />
quantity <strong>of</strong> data<br />
As compared to parametric models, PSM is<br />
preferred, because it relaxes randomization.<br />
Furthermore, its simplicity in relaxing the<br />
assumptions <strong>of</strong> functional forms that normally<br />
are imposed by parametric regression models,<br />
such as OLS is an advantage. “PSM allows the<br />
estimation <strong>of</strong> mean impacts without arbitrary<br />
assumptions about functional forms and error<br />
166
distributions. Furthermore, despite that<br />
regression models use full sample, PSM is<br />
confined to matched one (i.e., the region <strong>of</strong><br />
common support), therefore, impact estimated<br />
with parametric models (i.e., based on full or<br />
unmatched samples) are more biased and less<br />
robust to miss-specification <strong>of</strong> regression<br />
functions than those based on matched<br />
samples.”(Ravallion, 2005).<br />
Finally, our study takes the advantage <strong>of</strong> having<br />
detailed survey data and full knowledge <strong>of</strong> the<br />
program. Our knowledge about the<br />
administrative and implementation procedure <strong>of</strong><br />
irrigation schemes in the region helps us to<br />
identify proxy variables that determine program<br />
participation. We have collected a detailed data<br />
by administering the same questioner to both the<br />
participants and non-participants. The nearest<br />
neighbor and kernel matching methods were<br />
used to estimate the average treatment effect <strong>of</strong><br />
irrigation on the treated (ATT). We have<br />
checked that the common support and balancing<br />
properties were satisfied in our data, hence, the<br />
remaining bias, if any, can be attributed to<br />
unobserved characteristics (Jalan and Ravallion,<br />
in press).<br />
5.4. Limitations<br />
There are three basic problems that confound<br />
impact evaluation in general, which includes:<br />
selection bias, spillover effect and<br />
data/measurement error (Ravallion, 2005) where<br />
our study is not exceptional. The main concern<br />
<strong>of</strong> non-parametric impact evaluation is whether<br />
the selection (placement) process to participate<br />
in the program is full captured by the control<br />
variables (Ravallion, 2005).<br />
Since irrigation a policy induced program to<br />
reduce poverty, it is impractical to assume that<br />
participation could be random, hence, it should<br />
be emphasized that the concern about selection<br />
bias is that some <strong>of</strong> the variables that jointly<br />
influence income and access to irrigation are<br />
unobservable making it difficult to claim that the<br />
entire difference between the income <strong>of</strong><br />
households with and without access to irrigation<br />
is attributed to irrigation (such a bias is specified<br />
in Equation 7c). This indicates that we can only<br />
minimize the level <strong>of</strong> bias. There are examples<br />
indicating that bias can be large in nonexperimental<br />
impact evaluation among which<br />
(Lalonde, 1986; Glewwe et al., 2004; and Van<br />
de Walle, 2002) are few, but this does not mean<br />
that non-experimental impact evaluation<br />
methods can not be used(Ravallion, 2005).<br />
The spillover effect is another methodological<br />
challenge <strong>of</strong> impact assessment, implying that<br />
eliminating selection bias by itself is not<br />
sufficient to identify the impact <strong>of</strong> treatment.<br />
The estimation method outlined in section 5.1<br />
assumes that the presence <strong>of</strong> irrigation project in<br />
the community affects only those who have<br />
access to it (i.e., ATT), however, although they<br />
are not direct beneficiaries, those who get<br />
employment through the project implementation<br />
also benefits fro the project. For example,<br />
irrigation network construction and catchments<br />
treatment brought a huge employment<br />
opportunity for people inside and outside the<br />
command area. Furthermore, even after the<br />
project completion, more labour get recruited<br />
because <strong>of</strong> the labour intensive nature <strong>of</strong><br />
irrigation. The benefits <strong>of</strong> lower food prices lead<br />
to improved nourishment <strong>of</strong> the whole<br />
community. On the other hand, irrigation brings<br />
negative externality, such as prevalence <strong>of</strong><br />
malaria. In general, in the presence <strong>of</strong> positive<br />
spillover effect, estimated impact could be<br />
downward biased, while it could be upward<br />
biased if the negative affected is assumed in the<br />
estimation process.<br />
6. Results and Discussion<br />
6.1 Descriptive results<br />
Household characteristics and resource<br />
endowments:<br />
The descriptive results are presented in tables 2<br />
and 3. There are no significant differences<br />
between irrigators and rain-fed farmers<br />
regarding household demographic characteristics<br />
and level <strong>of</strong> education. No significant difference<br />
is observed in farm size between the two groups.<br />
We noted that households who have access to<br />
irrigation hired more labor as compared to<br />
households who have no access to irrigation.<br />
167
Both irrigating and rain-fed households have<br />
almost equal number <strong>of</strong> oxen, milk cows and<br />
labor although we observed slightly higher<br />
values in favor <strong>of</strong> irrigating households.<br />
Comparison <strong>of</strong> level and sources <strong>of</strong> income,<br />
consumption and poverty:<br />
Irrigators had, more diversified income sources.<br />
The irrigators had significantly higher non-crop<br />
farming income. The non-crop farming activities<br />
are mainly related to livestock rearing including<br />
dairying, poultry and bee keeping. There is no<br />
significant difference in the magnitude <strong>of</strong><br />
income obtained from <strong>of</strong>f-farm activities<br />
between the two groups, however, the<br />
contribution <strong>of</strong> <strong>of</strong>f-farm income to non-irrigating<br />
households’ total income is about 18 percent<br />
higher than that <strong>of</strong> irrigating households’. This<br />
might be due to the labor intensive nature <strong>of</strong><br />
irrigation. The implication is that households<br />
who have access to irrigation are more occupied<br />
in their own farm and have less <strong>of</strong>f-farm<br />
participation.<br />
Although farming income constitutes, on<br />
average, about 72 percent <strong>of</strong> the total sample<br />
household’s income, it contributes 76 percent <strong>of</strong><br />
income <strong>of</strong> households who have access to<br />
irrigation, and only 66 percent <strong>of</strong> income <strong>of</strong><br />
households without access to irrigation. Given<br />
the contribution <strong>of</strong> agriculture to the income <strong>of</strong><br />
rural households, such differences in the<br />
proportion <strong>of</strong> farming income supports the<br />
argument about the role <strong>of</strong> investment in<br />
irrigation as a poverty reduction strategy. In<br />
general, the descriptive statistics makes clear<br />
that irrigators have less <strong>of</strong>f-farm employment<br />
and more cropping income.<br />
Overall, the total income <strong>of</strong> non-irrigators is<br />
only about 67% <strong>of</strong> that <strong>of</strong> irrigators. Thus the<br />
mean income for irrigators is significantly<br />
higher than that <strong>of</strong> non-irrigators. However, the<br />
difference in the total household consumption<br />
expenditure between the two groups is not that<br />
significant. The consumption expenditure is<br />
higher for irrigators only by 8.6%. The<br />
implication is that even though the observed<br />
income gap between irrigators and non-irrigators<br />
is huge, the non-irrigators where able to smooth<br />
their consumption level and bring it almost to<br />
the level <strong>of</strong> that <strong>of</strong> irrigators through various<br />
mechanisms. This confirms the usual claims<br />
made in the literature that consumption<br />
expenditure is the preferred measure <strong>of</strong> welfare<br />
to income 13 . Although the average per capita<br />
income <strong>of</strong> irrigators and rain-fed farmers are<br />
above the <strong>of</strong>ficial poverty line that <strong>of</strong> irrigating<br />
households is almost double <strong>of</strong> that <strong>of</strong> the nonirrigating<br />
households. The difference between<br />
per capita consumption expenditure <strong>of</strong> irrigators<br />
and non-irrigators is statistically significant.<br />
The observed income difference between the<br />
two groups is also reflected in the poverty<br />
incidence rate. The poverty incidence was<br />
calculated using a poverty line determined based<br />
on the estimated income required to access the<br />
minimum calorie required for subsistence (i.e.,<br />
2200 kcal) and other essential non-food goods<br />
and services. The <strong>of</strong>ficial national poverty line<br />
is 1075 Birr in 1995/96 constant national<br />
average prices (Weldehanna 2004), however, the<br />
regional poverty line (for Tigray region) was<br />
estimated at Birr 1033.5 (Hagos 2003). Our<br />
study shows that poverty incidence (i.e., the<br />
proportion <strong>of</strong> poor households) among irrigators<br />
group is significantly lower than that <strong>of</strong> nonirrigators.<br />
The poverty incidence among nonirrigators<br />
is slightly higher than the regional<br />
average for Tigray and significantly higher than<br />
the national average (<strong>Table</strong> 2 and 3). In general<br />
Tigray, Amhara and SNNPR are the worst<br />
regions in terms <strong>of</strong> poverty incidence and depth.<br />
6.2. Model results<br />
The propensity score matching allows for the<br />
statistical comparison group to irrigation<br />
participants. <strong>Table</strong> 4 presents the logit<br />
regression used to estimate the propensity scores<br />
on the basis <strong>of</strong> which the matching was<br />
subsequently done. The logit regression suggests<br />
that the probability <strong>of</strong> access to irrigation<br />
increases as household’s ownership <strong>of</strong> land<br />
(both in size and number <strong>of</strong> plots) increase.<br />
13 However, beware that the consumption smoothing<br />
is usually achieved through distress measures such as<br />
drawing down on the stock <strong>of</strong> assets owned such as<br />
livestock, borrowing, etc.<br />
168
<strong>Table</strong> 5 gives our estimates <strong>of</strong> average income<br />
gains, <strong>of</strong>f-farm labor allocation and magnitude<br />
<strong>of</strong> <strong>of</strong>f-farm income difference based on Nearest<br />
Neighbor, Kernel and stratification matching<br />
methods.<br />
The overall average income gain due to<br />
participation in irrigated agriculture ranges<br />
between 3600 to 4500 Birr based on the<br />
matching method adopted. The average income<br />
gain estimated stratified matching method is<br />
lower than that <strong>of</strong> the Kernel matching method<br />
and nearest neighbour methods. The nearest<br />
neighbour matching method is some what<br />
conservative since only 71 cases from the total<br />
<strong>of</strong> 282 rain-fed farming households were judged<br />
to be comparable to irrigators when using this<br />
method (<strong>Table</strong> 5). On the other hand, the<br />
stratification matching method is not restrictive.<br />
Although the Kernel matching method is<br />
marginally conservative as compared to<br />
stratification, but resulted in higher overall<br />
income gain. 236 rain-fed farmers where<br />
estimated to be comparable to the irrigators<br />
when using the Kernel matching method.<br />
The mean overall income gain due to<br />
participation in irrigation calculated based on the<br />
whole irrigators and non-irrigators sample (i.e.,<br />
without using PSM method) is 1413.07<br />
(4278.445 minus 2865.377, see table 2). Thus<br />
the use <strong>of</strong> the whole rain-fed sample as a<br />
counterfactual would under estimate the impact<br />
<strong>of</strong> irrigation on income and poverty. The bias is<br />
about 2208.19 (3620.26 14 minus1413.07) Birr.<br />
Moreover, the irrigators had lower <strong>of</strong>f-farm<br />
income than non-irrigators but the difference is<br />
not statistically significant.<br />
6.3 Stochastic dominance analysis<br />
Although randomization is considered as a<br />
powerful method <strong>of</strong> impact assessment, no<br />
single method is ideal implying that a<br />
combination <strong>of</strong> tools might be appropriate<br />
(Ravallion, 2005). Accordingly we have used a<br />
stochastic dominance analysis to check the<br />
robustness <strong>of</strong> our estimation <strong>of</strong> matching<br />
14 This number shows the minimum gain based on the<br />
estimation <strong>of</strong> stratified matching method.<br />
method. Such an assessment is based on set<br />
poverty lines, which ideally give the minimum<br />
income that is sufficient for an individual to<br />
fulfill a minimum level <strong>of</strong> consumption,<br />
therefore, the individual’s standard <strong>of</strong> living is<br />
above the poverty line. The general principle <strong>of</strong><br />
setting a poverty line is that the individual<br />
whose income is above the poverty line is being<br />
adequately nourished and can fulfill the basic<br />
needs. We used a poverty line equal to 1033.5<br />
Birr (Hagos, 2003). We assessed the impact <strong>of</strong><br />
access to irrigation on the cumulative<br />
distribution <strong>of</strong> income and then poverty<br />
reduction by simulating multiple poverty lines.<br />
We found that the stochastic dominance tests<br />
confirm the results <strong>of</strong> propensity score matching<br />
that investment in small-scale irrigation has<br />
significant impact on household income and<br />
poverty statues. Results <strong>of</strong> the stochastic<br />
dominance tests are reported in figures 3-5.<br />
Comparing the head count ratio (the first order<br />
stochastic dominance tests), we found that<br />
poverty incidence is significantly low for<br />
households with access to irrigation. Similarly,<br />
the second and third order stochastic dominance<br />
tests confirm that the depth and severity <strong>of</strong><br />
poverty is lower for irrigating households.<br />
7. Conclusions<br />
Poverty reduction in Tigray regional state is a<br />
core policy agenda <strong>of</strong> both regional government<br />
and the federal government <strong>of</strong> Ethiopia.<br />
Investment in small-scale irrigation was<br />
regarded as a key poverty reduction strategy and<br />
many governmental and non-governmental<br />
organizations have constructed different<br />
irrigation systems with a total irrigation capacity<br />
<strong>of</strong> 3700 hectares benefiting about 19000 farming<br />
households. However, limited efforts have been<br />
made so far to assess whether investments in<br />
small-scale irrigation in Tigray have attained the<br />
stated objectives <strong>of</strong> poverty reduction, food<br />
security and overall socioeconomic<br />
improvement in Tigray. In fact some <strong>of</strong> the<br />
limited efforts made to assess small-scale<br />
irrigation systems are quite pessimistic (see<br />
Pender et al. 2002). The main objective <strong>of</strong> this<br />
study was to robustly assess the link between<br />
public investment in irrigated agriculture and its<br />
169
impacts on income and household poverty in<br />
Tigray.<br />
To analyze the welfare impact <strong>of</strong> small-scale<br />
irrigation, Propensity Score Matching method<br />
has been applied to a data set generated from a<br />
random sample <strong>of</strong> 613 farming households (i.e.,<br />
331 irrigators and 282 rain-fed farmers)<br />
representing different agro-ecological zones <strong>of</strong><br />
Tigray and irrigation system typologies. The<br />
main conclusions from the study are as follows:<br />
• There is no significant differences in<br />
household demographic characteristics<br />
between the irrigators and non-irrigators<br />
sample households<br />
• Irrigators hired more labor indicating the<br />
relative labor absorption potential <strong>of</strong> irrigated<br />
farming as compared to rain-fed farming<br />
• Irrigators had more diversified income<br />
sources<br />
• Households with access to irrigation had<br />
lower participation in <strong>of</strong>f-farm activities again<br />
indicating the labor absorption or on-farm<br />
employment generation capacity <strong>of</strong> irrigated<br />
agriculture<br />
• The mean income <strong>of</strong> irrigators is<br />
significantly higher than that <strong>of</strong> rain-fed<br />
farmers. There is also a difference (although<br />
not statistically significant) in total household<br />
consumption expenditure between the two<br />
groups.<br />
• The over all average income gain due to<br />
participation in irrigated agriculture estimated<br />
using PSM method ranges between 3600 to<br />
4500 Birr per household per annum, which is<br />
higher than the income gain estimated based<br />
on the whole sample (i.e., using the total rainfed<br />
farmers sample as a counterfactual or<br />
comparison group). Hence, the use <strong>of</strong> PSM<br />
avoided the under estimation <strong>of</strong> the magnitude<br />
<strong>of</strong> irrigation impact on income.<br />
• Finally, the significant income gain has<br />
significantly reduced poverty among farmers<br />
with access to irrigation.<br />
Reference<br />
Abraha, Z. (2003). Business Plan: First Draft,<br />
Executive Summary, Tigray Regional<br />
National State, Bureau <strong>of</strong> <strong>Water</strong> Resource<br />
Development (Irrigation Construction<br />
Interprise), Mekelle.<br />
Baker, J. L. (2000). Evaluating the Impact <strong>of</strong><br />
Development Projects on Poverty:A<br />
Handbook for Practitioners. The World<br />
Bank.<br />
Bhattarai, M. & Narayanamoorthy, A. (2003).<br />
Impact <strong>of</strong> Irrigation on Agricultural Growth<br />
and Poverty Alleviation: Macro Level<br />
Analyses in India: Paper Presented at the<br />
Iwmi- Tata Annual Workshop in Anand,<br />
Gujarat, India, January, 27-29, 2003.<br />
Christiaensen, L.Demery, L. & Kühl1, J. (2006).<br />
The Role <strong>of</strong> Agriculture in Poverty<br />
Reduction an Empirical Perspective: Policy<br />
Research Working Paper 4013, 4013,<br />
World Bank<br />
Cobb-Clark, D. A. & Crossley, T. (2003).<br />
Econometrics for Evaluations: An<br />
Introduction to Recent Developments. The<br />
Economic Record, 79 (247): 491-511.<br />
Dhawan, B. D. (1988). Irrigation in India's<br />
Agricultural Development: Productivity,<br />
Stability and Equity. New Delhi, Sage<br />
Publications India Pvt. Ltd.<br />
Fan, S., Zhang, L. & Zhang, X. (2000). Growth<br />
and Poverty in Rural China: The Role <strong>of</strong><br />
Public Investments. Environment and<br />
Production Technology Division,<br />
<strong>International</strong> Food Policy Research<br />
<strong>Institute</strong>: EPTD DISCUSSION PAPER NO.<br />
66.<br />
FAO(1999). Poverty Reduction and Irrigated<br />
Agriculture, <strong>International</strong> Program for<br />
Technology and Research in Irrigation and<br />
Drainage,Issues paper No. 1, January, Rome.<br />
FAO(2003). <strong>Water</strong> and Food Security. The State<br />
<strong>of</strong> Food Insecurity in the World: Monitoring<br />
progress towards the World Food Summit<br />
and Millennium Development Goals, Italy.<br />
FDRE. (1999). Comprehensive and Integrated<br />
<strong>Water</strong> Resource <strong>Management</strong>: Ethiopian<br />
<strong>Water</strong> Resource <strong>Management</strong> Policy,<br />
170
Ministry <strong>of</strong> <strong>Water</strong> Resources.<br />
FDRE(2002). Food Security Strategy, Addis<br />
Ababa, Ethiopia.<br />
Glewwe, P., Kremer, M., Moulin, S. &<br />
Zitzewitz, E. (2004). Retrospective Vs.<br />
Prospective Analyses <strong>of</strong> School Inputs: The<br />
Case <strong>of</strong> Flip Charts in Kenya. Journal <strong>of</strong><br />
Development Economics 74: 251– 268.<br />
Hagos F.(2003) Poverty, institution, peasant<br />
behavious and conservation investment in<br />
Northern Ethiopia. Department <strong>of</strong><br />
Economics and Social Sciences, Ås,<br />
Agricultural University <strong>of</strong> Norway.<br />
Hagos, F., Kruseman, G., Abreha, Z., Linderh<strong>of</strong>,<br />
V., Mulugeta, A. & G/Samuel, G. (2006).<br />
Impact <strong>of</strong> Small Scale <strong>Water</strong> Harvesting on<br />
Household Poverty: Evidence from Northen<br />
Ethiopia. Poverty Reduction and<br />
Environmental <strong>Management</strong> (PREM).<br />
Ho, D. E., Imai, K., King, G. & Stuart, E. A.<br />
(2007). Matching as Nonparametric<br />
Preprocessing for Reducing Model<br />
Dependence in Parametric Causal Inference.<br />
Political Analysis 15: 199–236.<br />
Huang, Q., Dawe, D., Rozelle, S., Huang, J. &<br />
Wang, J. (2005). Irrigation, Poverty and<br />
Inequality in Rural China. The Australian<br />
Journal <strong>of</strong> Agricultural and Resource<br />
Economics, 49: 159–175.<br />
Huang, Q., Rozelle, S., Lohmar, B., Huang, J. &<br />
Wang, J. (2006). Irrigation, Agricultural<br />
Performance and Poverty Reduction in<br />
China. Food Policy, 31 30–52.<br />
Hussain, I. & Hanjra, M. A. (2004). Irrigation<br />
and Poverty Alleviation: Review <strong>of</strong> the<br />
Empirical Evidence, IRRIGATION AND<br />
DRAINAGE, 53 ( ): 1–15<br />
Hussain, I. & Wijerathna, D. ( 2004). Irrigation<br />
and Income-Poverty Alleviation:A<br />
Comparative Analysis <strong>of</strong> Irrigation Systems<br />
in Developing Asia. <strong>International</strong> <strong>Water</strong><br />
<strong>Management</strong> <strong>Institute</strong> (IWMI).<br />
Hussain, M., Hussain, Z. & Ashfaq, M. (2006).<br />
Impact <strong>of</strong> Small Scale Irrigation Schemes<br />
on Poverty Alleviation in Marginal Areas <strong>of</strong><br />
Punjab, Pakistan. <strong>International</strong> Research<br />
Journal <strong>of</strong> Finance and Economics, 6 (6).<br />
Jalan, J. & Ravallion, M. (In press). Estimating<br />
the Benefit Incidence <strong>of</strong> an Antipoverty<br />
Program by Propensity Score Matching.<br />
Journal <strong>of</strong> Business and Economic<br />
Statistics.<br />
Jin, S., Huang, J., Hu, R. & Rozelle, S. (2002).<br />
The Creation and Spread <strong>of</strong> Technology and<br />
Total Factor Productivity in China’s<br />
Agriculture. American Journal <strong>of</strong><br />
Agricultural Economics, 84: 916-930<br />
Lalonde, R. J. (1986). Evaluating the<br />
Econometric Evaluations <strong>of</strong> Training<br />
Programs with Experimental Data. The<br />
American Economic Review, 76 (4): 604-<br />
620.<br />
Lipton, M., Litchfield, J. & Faures, J.-M. (2003).<br />
The Effect <strong>of</strong> Irrigation on Poverty: A<br />
Framework for Analysis. <strong>Water</strong> Policy, 5:<br />
413-427.<br />
Pender, J., P.Jagger, Gebremedhin, B. & Haile,<br />
M. (2002). Agricultural Change and Land<br />
<strong>Management</strong> in the Highlands <strong>of</strong> Tigray:<br />
Causes and Implications. Policies for<br />
Sustainable Land <strong>Management</strong> in the<br />
Highlands <strong>of</strong> Tigray, Northern Ethiopia:<br />
Summary <strong>of</strong> Papers and Proceedings <strong>of</strong><br />
Workshop held at Axum Hotel, Mekelle,<br />
Etiopia, 28-29 March 2002. Socio-economic<br />
and Policy Research Working Paper 54.<br />
ILRI (<strong>International</strong> Livestock Research<br />
<strong>Institute</strong>), Nairobi<br />
Ravallion, M. (2005). Evaluating Anti-Poverty<br />
Programs. World Bank Policy Research,<br />
Development Research Group, Working<br />
Paper 3625.<br />
Rosegrant, M. & Evenson, R. (1992).<br />
Agricultural Productivity and Sources <strong>of</strong><br />
Growth in South Asia. American Journal <strong>of</strong><br />
171
Agricultural Economics, 74: 757-761<br />
Rosenbaum, P. R. & Rubin, D. B. (1985).<br />
Constructing a Control Group Using<br />
Multivariate Matched Sampling Methods<br />
That Incorporate the Propensity Score. The<br />
American Statistician, 39 (1): 33-38.<br />
Saleth, R. M., Namara, R. E. & Samad, M.<br />
(2003). Dynamics <strong>of</strong> Irrigation-Poverty<br />
Linkage in Rural India: Analytical<br />
Framework and Empirical Analysis. <strong>Water</strong><br />
Policy, 5: 459-473.<br />
Walle, D. V. D. (2002). Choosing Rural Road<br />
Investments to Help Reduce Poverty. World<br />
Development 30 (4): 575–589.<br />
Weldehanna T (2004)The experiences <strong>of</strong><br />
measuring and monitoring poverty in<br />
Ethiopia. Poverty Analysis and Data<br />
Initiative (PADI).Mombassa, Kenya, at<br />
http://www.worldbank.org/afr/padi/ethiopia<br />
_paper.pdf, accessed on 13.07.07.<br />
<strong>Table</strong> 1. Key to the acronyms used in Figure 1 or conceptual framework.<br />
Accronym Description<br />
DAM<br />
Source <strong>of</strong> water for irrigation is micro-dam<br />
RDIV<br />
Source <strong>of</strong> water for irrigation is river diversion<br />
GWM<br />
Source <strong>of</strong> water for irrigation is groundwater :modern communal<br />
GWT<br />
Source <strong>of</strong> water for irrigation is groundwater: private manual<br />
IRRIG<br />
Access to irrigation<br />
LABOUR Household’s labor endowment<br />
CREDIT Access to credit<br />
ASSET Asset holding<br />
LSIZE<br />
Land holdings size<br />
OXEN<br />
Number <strong>of</strong> oxen owned<br />
LIVESTOCK Households livestock holding (TLU)<br />
MARKET Distance to nearest market<br />
INPUT Total expenditure o inputs used (Chemicals, fertilize, seed, etc)<br />
LANDPR Land productivity<br />
LABPR Labor productivity<br />
HHSIZE Household size in adult equivalent<br />
AGE<br />
Age <strong>of</strong> household head<br />
SEX<br />
Sex <strong>of</strong> household head<br />
EDUC<br />
Number <strong>of</strong> educated household members<br />
COWORO Consumer worker ratio<br />
ALTITUDE Altitude above sea level<br />
AVRAFLL Average rainfall<br />
CV<br />
Coefficient <strong>of</strong> variance <strong>of</strong> rainfall<br />
SOILTYPE Soil types<br />
LANQUALI Land quality<br />
AGRINCOME Income from agriculture (cropping income)<br />
OTHINCOME Income from other sources<br />
HHINCOME Total household income<br />
POVREDU Poverty statues based on income level<br />
172
<strong>Table</strong> 2: Summary statistics <strong>of</strong> selected variables used in estimating the treatment effect<br />
Welfare indicators<br />
Irrigators<br />
(N=330)<br />
Non-irrigators<br />
(N=282)<br />
t-test<br />
( Significance test <strong>of</strong><br />
Mean SE Mean SE difference)<br />
Household characteristics and resource endowments<br />
Family size (number) 5.066 .120 4.681 .127 -2.206**<br />
Family size (adult equivalence) 4.495 .126 4.154 .129 1.884*<br />
Female adult members <strong>of</strong> the household 2.650 .078 2.482 .076 -1.5302<br />
(number)<br />
Male adult members <strong>of</strong> the household 2.417 .082 2.199 .087 -1.817*<br />
(number)<br />
Number <strong>of</strong> plots the household 4.574 .109 3.351 .114 -7.736***<br />
cultivated in 2005/06<br />
Number <strong>of</strong> oxen the household own 1.260 .056 1.121 .066 -1.625<br />
Number <strong>of</strong> milk cows the household .656 .057 .660 .075 0.043<br />
own<br />
Farm size in hectare 5.018 .160 5.038 .203 0.082<br />
Household members who can read and 1.426 .084 1.259 .081 -1.418<br />
write (number)<br />
Income and consumption<br />
Total Household income in 2005/06 4278 364 2865 224 -3.178***<br />
(Birr)<br />
Total Household consumption 3058.839 111 2817.016 106.248 -1.555<br />
expenditure in 2005/06 (Birr)<br />
Proportion <strong>of</strong> farming income (%) .76 .011 .66 .016 -5.234***<br />
Per capita income (Birr) 1230.097 169 799.304 63.477 -2.248**<br />
Per capita expenditure(Birr) 803.190 34 785.259 30 0.393<br />
Poverty incidence (%) .44 .027 .56 .030 3.111***<br />
<strong>Table</strong> 3. Poverty by region using poverty line based on Basket <strong>of</strong> Kcal<br />
Region<br />
Per capita consumption<br />
expenditure (Birr) (1999)<br />
Poverty Index (%)<br />
Poverty Gap<br />
(2002)<br />
1999 2002<br />
Tigray 903.60 0.58 0.56 0.17<br />
Afar 1105.6 0.52 0.33 0.10<br />
Amhara 917.2 0.57 0.54 0.16<br />
Oromia 1184.0 0.35 0.34 0.08<br />
Somali 1166.4 0.35 0.31 0.07<br />
Benshangul-Gumuz 1026.8 0.48 0.47 0.13<br />
SNNPR 945.5 0.57 0.56 0.18<br />
Gambela 1223.5 0.42 0.34 0.09<br />
Harari 1459.7 0.29 0.22 0.05<br />
Addis-Ababa 1569.0 0.30 0.30 0.09<br />
Dire Dawa 1397.1 0.25 0.29 0.07<br />
National 1087.8 0.46 0.45 0.13<br />
Source: FDRE (1999, 2002)<br />
173
<strong>Table</strong> 4: Estimation <strong>of</strong> the propensity score to estimate the impact <strong>of</strong> irrigation on household’s income,<br />
<strong>of</strong>f-farm labor participation, and <strong>of</strong>f-farm income<br />
Variable Variable Description<br />
Coef.<br />
z<br />
accirri Access to Irrigation (1=yes, 0=no)<br />
plotsize Plot size in hectare -2049959(.0378145) -5.42<br />
typland Type <strong>of</strong> rented in land (1=irrigated, 0=rainfed) -.4637671(.4452168) -1.04<br />
hheadsex Household head sex(1=male, 0=female) .0742088(.2271787) 0.33<br />
familysize Family size in number <strong>of</strong> people .0532757(.0483211) 1.10<br />
femwl Adult female working labour .0183509(.1003034) 0.18<br />
mamwl Adult male working labour -.0856737(.0919116) -0.93<br />
plotnumber Number <strong>of</strong> plots operated by the household in .5404309(.0649462) 8.32<br />
2005/06 production year<br />
ownrship Whether a household rented in land (1=yes, 0=no) -.1359277(.183545) -0.74<br />
_cons Constant -1.079743(.4993401) -2.16<br />
Notes: () = Std. Err.; *, **, *** Significant at 10%, 5% and 1%, respectively;<br />
Treatment is Access to Irrigation<br />
<strong>Table</strong> 5: Impact <strong>of</strong> irrigation on household income, household labor allocation and <strong>of</strong>f-farm income<br />
(Bootstrapped standard errors): Estimation results <strong>of</strong> matching method<br />
Impact on Matching Method Number <strong>of</strong> Number <strong>of</strong> Average Treatment effect t-<br />
Treated Control on the Treated (ATT) statistic<br />
Income Nearest neighbour 331 71 3940.604 (1348.995) 2.921**<br />
(Equal version)<br />
Nearest neighbour 331 71 3940.604(1677.466) 2.349**<br />
(random version)<br />
Kernel Matching 331 236 4405.777 (1382.702) 3.186**<br />
Metod<br />
Stratification 331 259 3620.260 (1516.378) 2.387**<br />
Off-farm Nearest neighbour 331 71 14.171 (20.037) 0.707<br />
labour<br />
allocation<br />
(Equal version)<br />
Nearest neighbour 331 71 14.171 (23.227) 0.610<br />
(random version)<br />
Kernel Matching 331 236 8.808 (14.145) 0.623<br />
Metod<br />
Stratification 331 259 9.605 (9.958) 0.965<br />
Off-farm Nearest neighbour 331 71 77.023(233.666) 0.330<br />
Income (Equal version)<br />
Nearest neighbour 331 71 77.023(446.155) 0.173<br />
(random version)<br />
Kernel Matching 331 236 -256.966(288.294) -0.891<br />
Metod<br />
Stratification 331 259 -103.900(97.895) -1.061<br />
Note: numbers in parenthesis are bootstrapped standard errors, ** significant at 5% level <strong>of</strong> significance,<br />
df = 8<br />
174
Figure 3: First order stochastic dominance test to compare the<br />
incidence <strong>of</strong> poverty among households with and without<br />
access to irrigation<br />
Poverty line<br />
1<br />
0,9<br />
0,8<br />
0,7<br />
0,6<br />
0,5<br />
0,4<br />
0,3<br />
0,2<br />
0,1<br />
0<br />
0,25 0,5 0,75 1 1,25 1,5 1,75<br />
Head count ratio<br />
Irrigation users<br />
Non Irrigation users<br />
Figure 4: Second order stochastic dominance test to compare<br />
the depth <strong>of</strong> poverty among households with and without<br />
access to irrigation<br />
0,6<br />
0,5<br />
poverty line<br />
0,4<br />
0,3<br />
0,2<br />
Irrigation users<br />
Non Irrigation users<br />
0,1<br />
0<br />
0,25 0,5 0,75 1 1,25 1,5 1,75<br />
Poverty gap<br />
175
Figure 5: Third order stochastic dominance test to compare the<br />
severity <strong>of</strong> poverty among households with and without access<br />
to irrigation<br />
0,35<br />
0,3<br />
0,25<br />
Poverty line<br />
0,2<br />
0,15<br />
0,1<br />
0,05<br />
Irrigation users<br />
Non Irrigation users<br />
0<br />
0,25 0,5 0,75 1 1,25 1,5 1,75<br />
Poverty gap sqaured<br />
300<br />
250<br />
250<br />
200<br />
RF (mm)<br />
200<br />
150<br />
100<br />
150<br />
100<br />
CV (%)<br />
50<br />
50<br />
0<br />
Jan Feb Mar Apr May Jun Jul Aug Sep Oct Nov Dec<br />
Months<br />
Figure 6: Average monthly rainfall distribution (RF) and Coefficient<br />
<strong>of</strong> Variance <strong>of</strong> rainfall CV) <strong>of</strong> Tigray (1956-2006)<br />
Source: Ethiopian Metrology Agency, Tigray branch <strong>of</strong>fice<br />
0<br />
176
Appendix 1: Logit model Estimates <strong>of</strong> Propensity Score Matching<br />
****************************************************<br />
Algorithm to estimate the propensity score<br />
****************************************************<br />
The treatment is access to irrigation (accirri)<br />
access to<br />
irrigation<br />
1=yes, 0=no Freq. Percent Cum.<br />
0 282 46.00 46.00<br />
1 331 54.00 100.00<br />
Total 613 100.00<br />
Estimation <strong>of</strong> the propensity score<br />
Iteration 0: log likelihood = -422.93873<br />
Iteration 1: log likelihood = -377.59997<br />
Iteration 2: log likelihood = -376.19771<br />
Iteration 3: log likelihood = -376.18939<br />
Iteration 4: log likelihood = -376.18939<br />
Logistic regression Number <strong>of</strong> obs = 613<br />
LR chi2(8) = 93.50<br />
Prob > chi2 = 0.0000<br />
Log likelihood = -376.18939 Pseudo R2 = 0.1105<br />
accirri Coef. Std. Err. z P>z [95% Conf. Interval]<br />
plotsize -.2049959 .0378145 -5.42 0.000 -.279111 -.1308809<br />
typland -.4637671 .4452168 -1.04 0.298 -1.336376 .4088418<br />
hheadsex .0742088 .2271787 0.33 0.744 -.3710532 .5194707<br />
familysize .0532757 .0483211 1.10 0.270 -.0414319 .1479834<br />
femwl .0183509 .1003034 0.18 0.855 -.1782401 .2149419<br />
mamwl -.0856737 .0919116 -0.93 0.351 -.2658171 .0944697<br />
plotnumber .5404309 .0649462 8.32 0.000 .4131387 .6677231<br />
ownrship -.1359277 .183545 -0.74 0.459 -.4956693 .2238138<br />
_cons -1.079743 .4993401 -2.16 0.031 -2.058432 -.1010546<br />
Note: the common support option has been selected<br />
The region <strong>of</strong> common support is [.24230422, .98838866]<br />
Description <strong>of</strong> the estimated propensity score in region <strong>of</strong> common support<br />
177
Estimated propensity score<br />
Percentiles Smallest<br />
1% .2458666 .2423042<br />
5% .2771301 .2439084<br />
10% .3179111 .2447952 Obs 590<br />
25% .4128555 .2452673 Sum <strong>of</strong> Wgt. 590<br />
50% .5375359 Mean .5527539<br />
Largest Std. Dev. .1792381<br />
75% .6757212 .9483694<br />
90% .8177568 .9499213 Variance .0321263<br />
95% .8822696 .952905 Skewness .3062784<br />
99% .9415825 .9883887 Kurtosis 2.282861<br />
******************************************************<br />
Step 1: Identification <strong>of</strong> the optimal number <strong>of</strong> blocks<br />
Use option detail if you want more detailed output<br />
******************************************************<br />
The final number <strong>of</strong> blocks is 8.This number <strong>of</strong> blocks ensures that the mean propensity score is not<br />
different for treated and controls in each blocks<br />
**********************************************************<br />
Step 2: Test <strong>of</strong> balancing property <strong>of</strong> the propensity score<br />
Use option detail if you want more detailed output<br />
**********************************************************<br />
The balancing property is satisfied<br />
This table shows the inferior bound, the number <strong>of</strong> treated and the number <strong>of</strong> controls for each block<br />
Inferior access to irrigation<br />
<strong>of</strong> block<br />
1=yes, 0=no<br />
<strong>of</strong> pscore 0 1 Total<br />
.1428571 36 2 38<br />
.2857143 46 6 52<br />
.3571429 38 39 77<br />
.4285714 60 107 167<br />
.5714286 49 93 142<br />
.7142857 21 54 75<br />
.8571429 9 30 39<br />
Total 259 331 590<br />
Note: the common support option has been selected<br />
*******************************************<br />
End <strong>of</strong> the algorithm to estimate the pscore<br />
*******************************************<br />
end <strong>of</strong> do-file<br />
178
The Impact <strong>of</strong> Small Scale Irrigation on Household Food Security: The Case<br />
<strong>of</strong> Filtino and Godino Irrigation Schemes in Ada Liben District,<br />
East Shoa, Ethiopia<br />
Abonesh Tesfaye 1 , Ayalneh Bogale 2 , Regassa E. Namara 3<br />
1 Ministry <strong>of</strong> <strong>Water</strong> Resources, 2 Haramaya University, 3 IWMI-Acra<br />
abuye_t@yahoo.com<br />
Abstract<br />
Irrigated production is far from satisfactory in<br />
the country. The country's irrigation potential is<br />
estimated at 3.7 million hectare, <strong>of</strong> which only<br />
about 190,000 hectare (4.3 percent <strong>of</strong> the<br />
potential) is actually irrigated. The aim <strong>of</strong> this<br />
paper is to identify the impact <strong>of</strong> small-scale<br />
irrigation on household food security based on<br />
data obtained from 200 farmers in Ada Liben<br />
district <strong>of</strong> Ethiopia. Different studies revealed<br />
that access to reliable irrigation water can enable<br />
farmers to adopt new technologies and intensify<br />
cultivation, leading to increased productivity,<br />
overall higher production, and greater returns<br />
from farming. In the study area also about 70<br />
percent <strong>of</strong> the irrigation users are food secure<br />
while only 20 percent <strong>of</strong> the non-users are found<br />
to be food secure. Access to irrigation enabled<br />
the sample households to grow crops more than<br />
once a year; to insure increased and stable<br />
production, income and consumption; and<br />
improve their food security status. The study<br />
concludes that small-scale irrigation is one <strong>of</strong> the<br />
viable solutions to secure household food needs<br />
in the study area but it did not eliminate the food<br />
insecurity problem.<br />
1. Introduction<br />
1.1 Background<br />
Ethiopia is faced with complex poverty, which is<br />
broad, deep and structural (MoFED, 2002).<br />
Despite the importance <strong>of</strong> agriculture in its<br />
economy, the country has been a food deficit<br />
country for several decades, with cereal food aid<br />
averaging 14 percent <strong>of</strong> total cereal production<br />
(FAO, 2001). Irrigation is one means by which<br />
agricultural production can be increased to meet<br />
the growing food demand in Ethiopia<br />
(Awulachew et al., 2005). However, in Ethiopia<br />
irrigated production is far from satisfactory<br />
(Woldeab, 2003). While the country’s irrigation<br />
potential is about 3.7 million hectares (WSDP,<br />
2002), the total irrigated area is 190,000 ha in<br />
2004, that is only 4.3 percent <strong>of</strong> the potential<br />
(FAO, 2005).<br />
It was claimed that Ethiopia can not assure food<br />
security for its population with rain fed<br />
agriculture alone without a substantive<br />
contribution <strong>of</strong> irrigation. Thus, the government<br />
<strong>of</strong> Ethiopia has prepared a water sector<br />
development program to be implemented in 15<br />
years between 2002 and 2016. this program<br />
assigned a prominent role to the development <strong>of</strong><br />
irrigation in the country for food production<br />
(mowr, 2001). this paper reports the results <strong>of</strong> a<br />
study conducted to assess the efficacy <strong>of</strong><br />
irrigation led food insecurity eradication and<br />
poverty reduction policy objectives <strong>of</strong> ethiopia<br />
based on data collected from godino and filtino<br />
small scale irrigation schemes found in ada liben<br />
district <strong>of</strong> the oromia regional state <strong>of</strong> ethiopia.<br />
1.2 Irrigation and Household Food Security:<br />
some empirical evidences<br />
179
Chamber (1994) based on some empirical<br />
studies confirms that reliable and adequate<br />
irrigation increases employment, i.e., Landless<br />
laborers as well as small and marginal farmers<br />
have more work on more days<br />
<strong>of</strong> the year, which ultimately contributes to food<br />
security. A study conducted in 10 Indian villages<br />
in different agro-climatic regions shows that<br />
increasing irrigation by 40 percent was equally<br />
effective in reducing poverty (reducing food<br />
insecurity) as providing a pair <strong>of</strong> bullocks,<br />
increasing educational level and increasing wage<br />
rates (Singh et al., 1996). Kumar (2003) also<br />
stated that irrigation has significantly<br />
contributed to boosting India's food production<br />
and creating grain surpluses used as drought<br />
buffer. A study by Hussain et al. (2004)<br />
confirms that access to reliable irrigation water<br />
can enable farmers to adopt new technologies<br />
and intensify cultivation, leading to increased<br />
productivity, overall higher production, and<br />
greater returns from farming. This in turn opens<br />
up new employment opportunities; both on farm<br />
and <strong>of</strong>f-farm, and can improve incomes,<br />
livelihood, and the quality <strong>of</strong> life in rural areas.<br />
The same study identified five key dimensions<br />
<strong>of</strong> how access to good irrigation water<br />
contributes to socioeconomic uplift <strong>of</strong> rural<br />
communities. These are production, income and<br />
consumption, employment, food security, and<br />
other social impacts contributing to overall<br />
improved welfare.<br />
According to a study carried out on five<br />
irrigation schemes in Zimbabwe, the schemes<br />
were found to act as sources <strong>of</strong> food security for<br />
the participants and the surrounding community<br />
through increased productivity, stable<br />
production and incomes (Mudima, 1998). The<br />
same study reported that farmers participating in<br />
irrigation schemes never run out <strong>of</strong> food unlike<br />
their counterparts that depend on rain-fed<br />
agriculture.<br />
Ngigi (2002) disclosed that in Kenya for the two<br />
decades agricultural production has not been<br />
able to keep pace with the increasing population.<br />
To address this challenge the biggest potential<br />
for increasing agricultural production lies in the<br />
development <strong>of</strong> irrigation. According to the<br />
same study, irrigation can assist in agricultural<br />
diversification, enhance food self sufficiency,<br />
increase rural incomes, generate foreign<br />
exchange and provide employment opportunity<br />
when and where water is a constraint. Nigigi<br />
concluded that the major contributions <strong>of</strong><br />
irrigation to the national economy are food<br />
security, employment creation, and improved<br />
foreign exchange earning.<br />
A study by IFAD (2005) states that in Ethiopia,<br />
the construction <strong>of</strong> small-scale irrigation<br />
schemes has resulted in increased production,<br />
income and diet diversification in the Oromia<br />
and Southern Nation and Nationalities People<br />
(SNNP) regions. According to this study, the<br />
cash generated from selling vegetables and other<br />
produce is commonly used to buy food to cover<br />
the household food demand during the food<br />
deficit months. The same study further added<br />
that during an interview conducted with some<br />
farmers, it was disclosed that the hungry months<br />
reduced from 6 to 2 months (July and August)<br />
because <strong>of</strong> the use <strong>of</strong> small scale irrigation.<br />
Moreover, the increase in diversity <strong>of</strong> crops<br />
across the schemes and the shift from cereallivestock<br />
system to cereal-vegetable-livestock<br />
system is starting to improve the diversity <strong>of</strong><br />
household nutrition through making vegetables<br />
part <strong>of</strong> the daily diet. A study conducted by<br />
Woldeab (2003) also identified that in Tigray<br />
region irrigated agriculture has benefited some<br />
households by providing an opportunity to<br />
increase agricultural production through double<br />
cropping and by taking advantage <strong>of</strong> modern<br />
technologies and high yielding crops that called<br />
for intensive farming.<br />
However, these studies were descriptive than<br />
analytical in that they did not formally account<br />
for/ isolate the possible contribution <strong>of</strong> other<br />
confounding variables such has<br />
household/village characteristics, and other<br />
policies and interventions that might have as<br />
well contributed to the food security status<br />
differences between irrigators and non-irrigators.<br />
Moreover, the empirical works in this area are<br />
very scant in Ethiopia in particular and in Africa<br />
in general. Thus, the study aims to contribute to<br />
the small scale irrigation-food security literature<br />
and to provide policy conclusions and<br />
180
implications for future planning <strong>of</strong> irrigation<br />
systems.<br />
2. Research methodology<br />
2.1. Study area, sample size and sampling<br />
techniques<br />
godino and filtino small scale irrigation schemes<br />
are found in ada liben district and were<br />
constructed by oromiya irrigation development<br />
authority (oida) in 1996 and 1998, respectively<br />
(oida, 2000 ). the water source for godino<br />
irrigation scheme is wedecha dam, which has the<br />
capacity to irrigate about 310 ha. while the water<br />
source for filtino irrigation scheme is belbela<br />
dam, which has a capacity <strong>of</strong> irrigating 100 ha.<br />
the irrigable land in the respective command<br />
areas is distributed to farmers by the<br />
government. except few farmers who lease-in<br />
additional irrigable land almost all farmers in the<br />
area own quarter <strong>of</strong> a hectare. the major types <strong>of</strong><br />
crops grown by irrigation are onion, tomato,<br />
potato and chick pea among others.<br />
Out <strong>of</strong> the 45 Peasant Associations (PA) that are<br />
found in the Ada Liben district, two PAs namely<br />
Godino and Quftu were purposely selected<br />
mainly because <strong>of</strong> availability <strong>of</strong> irrigation<br />
schemes. To select sample respondents from the<br />
two PAs, first the household heads in the two<br />
PAs were identified and stratified in to two<br />
strata: irrigation users and non-users. Then the<br />
sample respondents from each stratum were<br />
selected randomly using simple random<br />
sampling technique. Since the number <strong>of</strong><br />
household heads in the two groups was<br />
proportional, equal number <strong>of</strong> sample is drawn<br />
from each group, i.e., 100 household heads were<br />
selected from each group. In total 200<br />
household heads were interviewed.<br />
2.2. Data collection<br />
The data required for this study was collected<br />
from sample respondents using a semi-structured<br />
questionnaire. The enumerators for the data<br />
collection were selected on the basis <strong>of</strong> their<br />
educational background and their ability <strong>of</strong> the<br />
local language. One week training was given to<br />
the enumerators about method <strong>of</strong> data collection<br />
and the contents <strong>of</strong> the questionnaire. Data<br />
collection proper was started after pretest was<br />
conducted and modifications were made based<br />
on the feedback from the pretest. Secondary<br />
information that could supplement the primary<br />
data was collected from published and<br />
unpublished documents obtained from different<br />
governmental and non-governmental<br />
organizations.<br />
2.3. Method <strong>of</strong> data analysis<br />
The study employed both descriptive and<br />
econometric techniques. The descriptive analysis<br />
was performed using frequencies, means, and<br />
maximum and minimum values. The<br />
econometric analysis employed the Heckman<br />
two-step procedure to identify the impact <strong>of</strong><br />
small scale irrigation on household food security<br />
from among possible other household food<br />
security influencing factors.<br />
Heckman two-step procedure: Evaluating the<br />
impact <strong>of</strong> a project/program on an outcome<br />
variable using regression analysis can lead to<br />
biased estimate if the underlying process which<br />
governs selection into a project/ program is not<br />
incorporated in the empirical framework. The<br />
reason for this is that, the effect <strong>of</strong> the program<br />
may be over (under) estimated if program<br />
participants are more (less) able due to certain<br />
unobservable characteristics, to derive these<br />
benefits compared to eligible non-participants<br />
(Zaman, 2001).<br />
To evaluate the impact <strong>of</strong> a program, a model<br />
commonly employed can be expressed as:<br />
Y = Xβ + αI<br />
+ u<br />
(1)<br />
Where Y is the outcome/impact, X is a vector <strong>of</strong><br />
personal exogenous characteristics and I is a<br />
dummy variable (I=1, if the individual<br />
participates in the program and 0 otherwise).<br />
From this model, the effect <strong>of</strong> the program is<br />
measured by the estimate <strong>of</strong> α . However, the<br />
dummy variable ‘I’ can not be treated as<br />
exogenous if the likelihood <strong>of</strong> an individual to<br />
participate or not to participate in the program is<br />
181
ased on an unobserved selection process<br />
(Maddala, 1983). Some studies have shown the<br />
limitations <strong>of</strong> applying the classical linear<br />
regression methodology to the analysis <strong>of</strong><br />
samples with selectivity bias (Heckman, 1979,<br />
Dardis et al. 1994, Sigelman and Zeng, 1999,<br />
Maddala, 1992). Application <strong>of</strong> the classical<br />
linear regression model does not guarantee<br />
consistent and unbiased estimates <strong>of</strong> the<br />
parameter. One solution to this problem in<br />
econometrics is the application <strong>of</strong> Heckman<br />
two-step procedures. It is considered as an<br />
appropriate tool to test and control for sample<br />
selection biases (Wooldrige, 2002).<br />
The Heckman two step procedures involves two<br />
equations. The first equation (i.e., the selection<br />
or participation equation) attempts to capture the<br />
factors governing membership in a program.<br />
This equation is used to construct a selectivity<br />
term known as the ‘Mills ratio’ which is<br />
included as independent variable to the second<br />
equation known as response or outcome<br />
equation. If the coefficient <strong>of</strong> the ‘selectivity’<br />
term is significant then the hypothesis that the<br />
participation equation is governed by an<br />
unobserved selection process or selectivity bias<br />
is confirmed. Moreover, with the inclusion <strong>of</strong><br />
extra term, the coefficient in the second stage<br />
‘selectivity corrected’ equation is unbiased<br />
(Zaman, 2001). Therefore, to evaluate the<br />
impact <strong>of</strong> small scale irrigation on household<br />
food security, we use the Heckman two-step<br />
procedure.<br />
Specification <strong>of</strong> the Heckman two-step<br />
procedure:<br />
Let Z<br />
ik<br />
be a group <strong>of</strong> K variables which<br />
represent the characteristics <strong>of</strong> a household i<br />
which influences the probability <strong>of</strong> participation<br />
in irrigation agriculture measured by a latent<br />
*<br />
variable D<br />
i<br />
andγ k<br />
are the coefficients which<br />
reflect the effect <strong>of</strong> these variables on the<br />
probability <strong>of</strong> being an irrigation farmer, and<br />
X<br />
is<br />
is a group <strong>of</strong> variables which represent the<br />
characteristics <strong>of</strong> household i which determine<br />
household’s food security ( C<br />
i<br />
) and β s<br />
are the<br />
coefficients which reflect the effect <strong>of</strong> these<br />
variables on household food security. Thus, the<br />
Heckman two-step procedure takes the<br />
following form:<br />
K<br />
*<br />
D<br />
i<br />
= ∑ γ<br />
k<br />
Z<br />
ik<br />
+ u<br />
i<br />
(2)<br />
C<br />
i<br />
S<br />
S =1<br />
K<br />
s<br />
= 1<br />
= ∑ β X + ε Observed only if<br />
is<br />
i<br />
D * i<br />
>0...<br />
(3)<br />
Where the disturbances u i<br />
and ε<br />
i<br />
follow a<br />
bivariate normal distribution with a zero mean,<br />
variance σ<br />
u<br />
and σ<br />
ε<br />
respectively, and<br />
covarianceσ εu<br />
. Therefore, we define a<br />
dichotomous variable D<br />
i<br />
which takes a value 1<br />
when a household is an irrigator and 0<br />
otherwise. The estimator is based on the<br />
conditional expectation <strong>of</strong> the observed variable,<br />
household food security (C i) :<br />
E<br />
*<br />
( C / D > 0) = xβ<br />
+ σ σ λ( − γz)<br />
i<br />
i<br />
εu<br />
ε<br />
(4)<br />
Where λ is the inverse Mills ratio defined as<br />
λ( − γZ<br />
) = φ( − γZ<br />
)/( 1−<br />
ϕ( − γZ<br />
))<br />
; β and γ are<br />
the vectors <strong>of</strong> parameters which measure the<br />
effect <strong>of</strong> variables X and Z, φ and ϕ are the<br />
functions <strong>of</strong> density and distribution <strong>of</strong> a normal,<br />
respectively. The expression <strong>of</strong> conditional<br />
expectation shows thatC i<br />
equals xβ<br />
only when<br />
the errors ε<br />
i<br />
and u<br />
i<br />
are non correlated, i.e.,<br />
σ<br />
εu<br />
= 0 ; otherwise, the expectation <strong>of</strong> C<br />
i<br />
is<br />
affected by the variable <strong>of</strong> equation 2. Thus,<br />
from expression 4 we find that:<br />
*<br />
(<br />
i<br />
/ Di<br />
> 0) + Vi<br />
= xβ<br />
+ σ<br />
u ε<br />
σελ<br />
( − Z) Vi<br />
C<br />
i<br />
/ Di<br />
> 0=<br />
EC/ γ + (5)<br />
WhereV<br />
i<br />
is the distributed error term,<br />
( 0 , σ ( 1−σ<br />
( λ( λ − ))))<br />
N<br />
u<br />
γZ<br />
ε<br />
3. Results and discussion<br />
3.1. Descriptive Results<br />
ε<br />
182
The variables included in the model are defined<br />
in table 1. The dependent variable for the first<br />
stage <strong>of</strong> the Heckman two-step procedure is<br />
participation in irrigation. This variable is a<br />
dummy variable (given a value <strong>of</strong> 1 if the<br />
household participates in the irrigation scheme<br />
and 0 otherwise) for the second stage <strong>of</strong> the<br />
model household food security status is a<br />
continuous variable measured by the annual<br />
food expenditure in Birr <strong>of</strong> the household per<br />
adult equivalent. Before discussing the<br />
econometric results, however, we present some<br />
interesting descriptive results.<br />
One <strong>of</strong> the pervasive features <strong>of</strong> food insecurity<br />
in Ethiopia is that it is usually seasonal. It<br />
mainly coincides with the active agricultural<br />
season or wet season. To this effect we have<br />
tried to see if there is discernable difference in<br />
the timing <strong>of</strong> food inadequacy between irrigators<br />
and non-irrigators. Surprisingly, there is no<br />
difference regarding the timing <strong>of</strong> food<br />
shortages between irrigators and non-irrigators<br />
(See Figure 1). The food shortage months start<br />
as early as June (which is the beginning rainy<br />
season and therefore agricultural activities in<br />
the study areas) and extends up to November<br />
(which is the beginning <strong>of</strong> harvest season). No<br />
household from the irrigators group has reported<br />
food shortage in June. September is the most<br />
serious food shortage month among nonirrigators,<br />
while October is the peak food<br />
shortage month for irrigators. About half <strong>of</strong> the<br />
non-irrigators reported food shortage in the<br />
month <strong>of</strong> September. However, there is a stark<br />
difference regarding the incidence rate <strong>of</strong><br />
reported food shortage between the two groups.<br />
The proportion <strong>of</strong> farmers reporting food<br />
shortage in every month is significantly lower<br />
for irrigators group. It is interesting to note that<br />
irrigation has not eradicated the food insecurity<br />
problem even in this seemingly better <strong>of</strong>f part <strong>of</strong><br />
the country indicating the depth <strong>of</strong> the problem.<br />
% <strong>of</strong> households reporting food shortage<br />
60<br />
50<br />
40<br />
30<br />
20<br />
10<br />
0<br />
June<br />
July<br />
August<br />
September<br />
October<br />
November<br />
Months <strong>of</strong> food shortage<br />
Irrigators<br />
Non-irrigators<br />
Figure 1. Incidence <strong>of</strong> reported food shortage by<br />
months<br />
The irrigators and non-irrigators have slightly<br />
different copping mechanisms in the advent <strong>of</strong><br />
food deficit problem (See figure 2). None <strong>of</strong> the<br />
irrigators have reported <strong>of</strong>f-farm employment as<br />
a coping strategy and also relatively fewer<br />
irrigators reported to have used credit as a means<br />
<strong>of</strong> copping with food shortage. It must be noted<br />
that using wage employment and consumption<br />
credit as a strategy to avert food insecurity is<br />
considered as a distress measure or strategy in<br />
Ethiopia. Small animals (such as sheep, goats<br />
and chicken) is the most important copping<br />
strategy among both irrigators and nonirrigators.<br />
183
% <strong>of</strong> sample farmers reporting<br />
50<br />
45<br />
40<br />
35<br />
30<br />
25<br />
20<br />
15<br />
10<br />
5<br />
0<br />
Sales <strong>of</strong><br />
Cattle<br />
Sales <strong>of</strong> Small<br />
Animals<br />
Off-farm<br />
Employment<br />
Food shortage copping strategy<br />
Consumption<br />
Credit<br />
Irrigators<br />
Non-Irrigators<br />
Figure 2. Food shortage coping mechanisms<br />
Based on how households adapt to the presence<br />
or threat <strong>of</strong> food shortages, the overall Coping<br />
Strategy Index (CSI) has been calculated for<br />
each <strong>of</strong> the sample households and the resulting<br />
values were averaged for irrigators and nonirrigators.<br />
It was found that the average CSI for<br />
irrigator households is 11.4, while for nonirrigators<br />
the corresponding value is 31.4. The<br />
mean difference is statistically significant (<strong>Table</strong><br />
2). The higher the CSI, the more food-insecure<br />
is a household (reference). Therefore, based on<br />
CSI the non-irrigator households are more food<br />
insecure as compared to irrigator households.<br />
The calculated food consumption expenditure<br />
per adult equivalent values also confirms the<br />
food security status difference between irrigators<br />
and non-irrigators (table 2). The average food<br />
consumption expenditure per adult equivalent<br />
per annum for irrigation user households is<br />
1322.4 Birr, while the corresponding figure for<br />
non-users is 774.4 Birr. The mean difference is<br />
statistically significant. Moreover, the total<br />
consumption expenditure (both food and nonfood)<br />
for irrigators is almost double that <strong>of</strong> nonirrigators.<br />
The minimum food consumption expenditure<br />
per adult equivalent above which a household is<br />
considered to be food secure (alternatively<br />
below which a household is considered as food<br />
insecure) was calculated based on the estimated<br />
cost <strong>of</strong> acquiring the recommended daily calorie<br />
allowance, which was taken as 2200 kcal per<br />
adult equivalent per day 15 . This cut-<strong>of</strong>f value is<br />
estimated to be Birr 900.0 per adult equivalent<br />
per annum. Thus, households having food<br />
consumption expenditure per adult equivalent <strong>of</strong><br />
less than Birr 900 are considered as food<br />
insecure, while those earning more than Birr 900<br />
are considered to be food secure. Based on this<br />
indicator, again there is substantial difference in<br />
food insecurity incidence rate between irrigator<br />
and non-irrigators households (see figure 3).<br />
Generally out <strong>of</strong> the 200 sample households 45<br />
percent <strong>of</strong> them are food secure and 55 percent<br />
<strong>of</strong> them are food insecure.<br />
15 This cut-<strong>of</strong>f value was calculated following Greer and<br />
Thorbecke (1986) food energy intake method <strong>of</strong> measuring<br />
household food security<br />
184
% <strong>of</strong> the households<br />
90<br />
80<br />
70<br />
60<br />
50<br />
40<br />
30<br />
20<br />
10<br />
0<br />
Food Secure<br />
Food<br />
Insecure<br />
Household food security<br />
status<br />
Irrigators<br />
Non-Irrigators<br />
Figure 3. Household food security status differentiated by access to irrigation<br />
When comparing other indicators <strong>of</strong> welfare<br />
between irrigation and non-irrigators,<br />
statistically significant differences were detected<br />
(<strong>Table</strong> 3). For example, irrigators have small<br />
household size, higher level <strong>of</strong> education, large<br />
livestock holding size, and better quality<br />
(fertility) cultivable land. The irrigators had also<br />
better access to extension and credit services<br />
(<strong>Table</strong> 4). In conclusion, the descriptive<br />
analyses indicate that irrigators are better <strong>of</strong>f in<br />
terms <strong>of</strong> food security status and other welfare<br />
indicators. But is this due solely to access to<br />
irrigation? Other observable and unobservable<br />
variables might have contributed to the observed<br />
food security status difference between irrigators<br />
and non-irrigators. Therefore, we know turn to<br />
the presentation <strong>of</strong> Heckman’s two stage<br />
regression model to show the impact <strong>of</strong> access to<br />
irrigation on food security while controlling for<br />
the effects <strong>of</strong> other observable and unobservable<br />
confounding factors.<br />
3.2. Econometric Analysis Results<br />
Determinants <strong>of</strong> likelihood <strong>of</strong> access to<br />
irrigation: The first stage <strong>of</strong> the Heckman model<br />
predicts the probability <strong>of</strong> access to the irrigation<br />
scheme <strong>of</strong> a household. Among the observable<br />
hypothesized variables, those that significantly<br />
influenced the probability <strong>of</strong> participating in<br />
irrigation farming include nearness to the water<br />
source, household siz size <strong>of</strong> cultivated land,<br />
livestock holding, the quality <strong>of</strong> land owned by a<br />
farmer and access to credit (<strong>Table</strong> 5). The<br />
relationship between household size and<br />
participation in irrigation project is non-linear.<br />
As the size <strong>of</strong> a household increases by one adult<br />
equivalent, the probability <strong>of</strong> access to irrigation<br />
decreases by 30.4% but only up certain point<br />
beyond which a unit increase in household size<br />
starts increasing the likelihood <strong>of</strong> participation<br />
in irrigation. As the size <strong>of</strong> cultivated area<br />
increases the probability <strong>of</strong> being an irrigator<br />
decreases. This may imply that irrigators tend<br />
intensify their cultivated land, while rain-fed<br />
farmers try to put more land under cultivation.<br />
185
Irrigators have significantly more livestock than<br />
their rain-fed only farmers. They also possess<br />
more fertile land.<br />
Determinants <strong>of</strong> household food security: The<br />
significance <strong>of</strong> the lambda term in the second<br />
stage <strong>of</strong> the Heckman procedure, confirms the<br />
presence <strong>of</strong> selectivity bias (<strong>Table</strong> 6). As<br />
expected, access to irrigation had significant<br />
impact on household food security. In the study<br />
area irrigation enable households to grow crops<br />
more than once a year, to insure increased and<br />
stable production, income and consumption<br />
thereby improving food security status <strong>of</strong> the<br />
household. This result is consistent with the<br />
finding <strong>of</strong> Abebaw (2003). The other variables<br />
that significantly enhance household food<br />
security are experience (as indicate by farmers<br />
age in years), access to extension service, and<br />
size <strong>of</strong> cultivated land. .<br />
The relationship between household size and<br />
food security is non-linear (see the coefficients<br />
for household size and its square variable). The<br />
negative and significant coefficient <strong>of</strong> household<br />
size reveals that larger household size leads to<br />
food insecurity, but only up to a certain point.<br />
The coefficient <strong>of</strong> the variable indicates that as<br />
the household size increases by one adult<br />
equivalent the food consumption expenditure <strong>of</strong><br />
the household decreases by 391.9 Birr. This<br />
result is consistent with the finding <strong>of</strong> Mulugeta<br />
(2002) and Yilma (2005). Contrary to other<br />
similar studies (Belayneh, 2005), in this study<br />
female headed households had better food<br />
security status than the male headed households.<br />
The coefficient <strong>of</strong> the variable shows that when<br />
the head <strong>of</strong> the household is male, food<br />
consumption expenditure <strong>of</strong> the household<br />
decreases by 331.1 Birr. The possible<br />
justification for this inverse relationship could<br />
be that though male headed households are in a<br />
better position to pool resource to increase<br />
production, they might spent more money on<br />
nonfood expenses rather than spending on food<br />
items to meet the household’s food needs.<br />
The regression result also shows that as the<br />
cultivated land size increases, a household is<br />
able to increase and diversify the quantity and<br />
type <strong>of</strong> crop produced, which may in turn lead to<br />
increased consumption and household food<br />
security. The coefficient <strong>of</strong> the land size variable<br />
shows that as the household gets one more<br />
hectare <strong>of</strong> land food consumption expenditure <strong>of</strong><br />
the household increases by 85 Birr. This result is<br />
consistent with the findings <strong>of</strong> Mulugeta (2002),<br />
Ayalew (2003), Abebaw (2003) and Yilma<br />
(2005).<br />
Access to extension service and nearness to the<br />
water source are also found to have a positive<br />
relationship with household food security. The<br />
positive effect <strong>of</strong> access to extension service<br />
may indicate that in the study area, those<br />
households who get technical advice and<br />
training or those who participated in field<br />
demonstrations are well aware <strong>of</strong> the advantage<br />
<strong>of</strong> agricultural technologies and adopt new<br />
technologies and produce more, thereby<br />
improving the household food security status.<br />
The nearness to the water source may be a<br />
surrogate variable for access to irrigation. It has<br />
already been shown that to the irrigation<br />
scheme, significantly improves household’s food<br />
security status. The possible other justification<br />
could be that the nearness to water source may<br />
proxy the location <strong>of</strong> the farms in relation to the<br />
irrigation water source . Therefore, households<br />
who are closer to the irrigation scheme do not<br />
incur much cost to access their farm so they can<br />
follow up the farm activity closely and<br />
frequently and may get a better yield.<br />
4. Conclusion and Implications<br />
The variables that significantly predict access to<br />
irrigation are: household size, size <strong>of</strong> cultivated<br />
land, livestock holding, farmers’ perception <strong>of</strong><br />
soil fertility status, access to credit, nearness to<br />
the water source and household size square. The<br />
variables that reduce the probability <strong>of</strong> access to<br />
irrigation are large household size, large<br />
cultivated area and access to credit. Rain-fed<br />
farmers tend to have large cultivated area. The<br />
negative relationship between access to credit<br />
and access to irrigation may be explained by the<br />
fact that: (1) in Ethiopia, the institutional credits<br />
usually give priority to rain-fed agriculture, and<br />
(2) the demand for credit among farmers with<br />
access to irrigation may be lower for they can<br />
satisfy cash needs through sales from their<br />
irrigated crops.<br />
186
The variables that increase the probability <strong>of</strong><br />
participation <strong>of</strong> farmers in irrigation farming<br />
include large livestock holding size, ownership<br />
<strong>of</strong> relatively fertile land and nearness to water<br />
source. Obviously, those households that are<br />
situated near the water source are more likely to<br />
participate in irrigation scheme. However, it<br />
does not mean that placement <strong>of</strong> an irrigation<br />
scheme in the village is solely governed by<br />
hydrological considerations. It involves political<br />
process and power relations.<br />
In the study area the use <strong>of</strong> small-scale irrigation<br />
contributes significantly to improve household<br />
food security. In addition to access to irrigation,<br />
access to irrigation, household size, sex <strong>of</strong> the<br />
household head, size <strong>of</strong> cultivated land, and<br />
access to extension service significantly<br />
influence the food security status <strong>of</strong> a farm<br />
household.<br />
The relationship between a household food<br />
security status and household size is non-linear<br />
(see the signs for the variables household size<br />
and the square <strong>of</strong> household size). As the size <strong>of</strong><br />
a household increases the per capita food<br />
expenditure decreases, but up to a point, after<br />
which the per capita food expenditure starts to<br />
increase as the household size increases.<br />
Contrary to expectation, female headed<br />
households are less likely to be food insecure as<br />
compared to male headed households. This<br />
needs further investigation, however, tentatively<br />
it may be explained by differences in the<br />
expenditure behavior <strong>of</strong> male and female<br />
farmers-female members <strong>of</strong> a farm household<br />
tend to spend more on food items to guarantee<br />
the food needs <strong>of</strong> the family before anything<br />
else. Another possible explanation may be that<br />
the male members <strong>of</strong> a female-headed household<br />
may have gainful employment elsewhere thus<br />
contributing to household food security.<br />
Size <strong>of</strong> cultivated land and household food<br />
security are positively related indicating larger<br />
farm size improves household food security.<br />
Households with large farm size are found to be<br />
food secure; however, there may not be a<br />
possibility <strong>of</strong> expanding cultivated land size any<br />
more because <strong>of</strong> increasing family size and<br />
degradation <strong>of</strong> the existing farm land. Therefore,<br />
household must be trained as to how to increase<br />
production per unit area (productivity).<br />
Access to extension service is also positively<br />
related to household food security. Extension<br />
workers could play a key role in transferring<br />
knowledge to the rural people easily there by<br />
improving production and consumption.<br />
Capacity building <strong>of</strong> the existing ones and<br />
training more extension workers might help<br />
address the issue.<br />
Reference<br />
Abebaw, Shimeles. 2003. Dimensions and<br />
determinants <strong>of</strong> food security among rural<br />
households in Dire Dawa, Eastern Ethiopia. An<br />
MSc Thesis Presented to the School <strong>of</strong> Graduate<br />
Studies <strong>of</strong> Alemaya University. 152p.<br />
Awulachew, B., Merrey, J., Kamara, B., Van<br />
Koppen, B., Penning de Vries, F., and<br />
Boelee, E. 2005. Experiences and<br />
opportunities for promoting small scale micro<br />
irrigation and rain water harvesting for food<br />
security in Ethiopia. Working paper 98.<br />
IWMI (<strong>International</strong> <strong>Water</strong> <strong>Management</strong><br />
<strong>Institute</strong>) Addis Ababa, Ethiopia.<br />
Belayneh Belete. 2005. Analysis <strong>of</strong> food<br />
insecurity causes: the case <strong>of</strong> rural farm<br />
households in Metta woreda, eastern<br />
Ethiopia. An MSc Thesis Presented to the<br />
School <strong>of</strong> Graduate Studies <strong>of</strong> Alemaya<br />
University. 130p<br />
Chamber, R. 1994. Irrigation against Rural<br />
Poverty. pp. 32-33. In Socio- Economic<br />
Dimension and Irrigation, ed., R.K. Gujar.<br />
Jaipur. India: Printwell.<br />
Cho, S., D. Newman and J. Bowker. 2005.<br />
Measuring rural homeowners’ willingness to<br />
pay for land conservation easements. Forest<br />
policy economics 7:757-770<br />
CBE (Commercial Bank <strong>of</strong> Ethiopia). 2006.<br />
<strong>International</strong> Banking Division.<br />
Dardis, H., Soberon and D. Patro. 1994.<br />
Analysis <strong>of</strong> leisure expenditure in the United<br />
187
States. The Proceeding <strong>of</strong> the American<br />
Council on Consumer Interest 39,194-200.<br />
FAO (Food and Agricultural Organization <strong>of</strong> the<br />
United Nations), 2001. The state <strong>of</strong> food and<br />
agriculture. pp. 18-20. World Review Part I.<br />
Rome. Italy.<br />
FAO (Food and Agricultural Organization <strong>of</strong> the<br />
United Nations).2005. Global information<br />
and early warning system on food and<br />
agriculture. World food program. Special<br />
report. Italy, Rome.<br />
Green, W. 2003. Econometric Analysis. 5 th ed.<br />
Prentice Hall. Inc, New York.<br />
Heckman, J., 1979. Sample selection bias as a<br />
specification error. Econometrica. 47(1):153-<br />
162.<br />
Hussain, I., R.E., Namara, and S. Madar. 2004.<br />
<strong>Water</strong> for food security for the poor. A<br />
collection <strong>of</strong> thematic papers. Asian<br />
Development Bank. Colombo, Sri Lanka.<br />
IFAD (<strong>International</strong> Fund for Agricultural<br />
Development). 2005. Special country<br />
program phase II (SCP II) interim evaluation<br />
report number 1643-ET. Ethiopia.<br />
Kumar, D. 2003. Food security and sustainable<br />
agriculture in India. pp. 1-2. The water<br />
management challenge. Working paper 60.<br />
<strong>International</strong> <strong>Water</strong> <strong>Management</strong> <strong>Institute</strong>.<br />
Colombo, Sri Lanka.<br />
Madalla, G.S. 1983. Limited Dependent and<br />
Qualitative Variables in Econometrics.<br />
Cambridge University Press. United<br />
Kingdom.<br />
Madalla, G.S. 1992. Introduction to<br />
Econometrics. pp. 341. 2 nd ed. Cambridge<br />
University Press. United Kingdom.<br />
MoFED (Ministry <strong>of</strong> Finance and Economic<br />
Development).2002.Sustainable development<br />
and poverty reduction program. pp. 1-87.<br />
Addis Ababa, Ethiopia.<br />
MoWR (Ministry <strong>of</strong> <strong>Water</strong> Resources).2001.<br />
Irrigation development strategy (Component<br />
<strong>of</strong> the water sector development program).<br />
Draft report. Ethiopia, Addis Ababa.<br />
Mudima, K.1998. Socio economic impact <strong>of</strong><br />
smallholder irrigation development in<br />
Zimbabwe: A case study <strong>of</strong> five successful<br />
irrigation schemes. Private irrigation in Sub<br />
Saharan Africa. <strong>International</strong> <strong>Water</strong><br />
<strong>Management</strong> <strong>Institute</strong>. Colombo, Sri Lanka.<br />
Mulugeta Tefera. 2002. Determinants <strong>of</strong><br />
household food security in Eastern Oromiya,<br />
Ethiopia: The case <strong>of</strong> Boke District <strong>of</strong><br />
Western Hararge Zone. An MSc Thesis<br />
Presented to the School <strong>of</strong> Graduate Studies<br />
<strong>of</strong> Alemaya University. 151p.<br />
Ngigi, S.2002. Review <strong>of</strong> irrigation development<br />
in Kenya. pp. 35-37. <strong>International</strong> <strong>Water</strong><br />
<strong>Management</strong> <strong>Institute</strong>. Colombo, Sri Lanka.<br />
Reilly, B. 1990. Occupational endogeneity and<br />
gender wage differentials for young workers:<br />
An empirical analysis using Irish data. The<br />
economic and social review. 21(3): 311-328<br />
Singh, B., B. N. Singh, and A. Singh. 1996.<br />
Effect <strong>of</strong> mulch and irrigation on yield <strong>of</strong><br />
Indian mustard on dry terraces in Alfisols.<br />
Indian Journal <strong>of</strong> Agricultural Science 60<br />
(7):477-479<br />
Sigelman, L., and L. Zeng. 1999. Analyzing<br />
censored and sample selected data with Tobit<br />
and Heckit models. Political analysis 8:167-<br />
182<br />
Teshome, W. 2003. Irrigation practices, state<br />
intervention and farmers Life-Worlds in<br />
drought-prone Tigray. pp. 2-53. Phd<br />
Dissertation, Wageningen University, the<br />
Netherlands.<br />
Wooldridge, M. 2002. Econometric Analysis <strong>of</strong><br />
Cross Section and Panel Data. pp. 551-565.<br />
Massachusetts <strong>Institute</strong> <strong>of</strong> Technology.<br />
London, England.<br />
188
WSDP (<strong>Water</strong> sector Development Program).<br />
2002. <strong>Water</strong> sector development program<br />
2002-2016, Volume II: Main report. Addis<br />
Ababa, Ethiopia.<br />
Yilma Muluken. 2005. Measuring rural<br />
household food security status and its<br />
determinants in the Benishangul Gumuze<br />
Region: The case <strong>of</strong> Asosa Woreda. An MSc<br />
Thesis Presented to the School <strong>of</strong> Graduate<br />
Studies <strong>of</strong> Alemaya University. pp. 134.<br />
Zaman, H. 2001. Assessing the poverty and<br />
vulnerability impact <strong>of</strong> micro credit in<br />
Bangladesh. pp. 34-36. A case study <strong>of</strong><br />
BRAC. Office <strong>of</strong> the chief economist and<br />
senior vice president (DECVP). The World<br />
Bank.<br />
<strong>Table</strong> 1. Definition <strong>of</strong> model variables<br />
Variable<br />
code<br />
Variable<br />
type Variable definition Mean Std.<br />
Expected<br />
sign<br />
ACCIRRG Dummy Access to irrigation <strong>of</strong> the household Positive<br />
HEADAGE Continuous Age <strong>of</strong> household head in years 48.0 13.5 Positive<br />
HEADAGE2 Continuous Age <strong>of</strong> the household head square Positive<br />
HHSIZEAE Continuous Household size in adult equivalent 4.7 1.7 Negative<br />
HHSIZEAE2 Continuous Household size in adult equivalent square Positive<br />
EDUCATA Category Education <strong>of</strong> the household head /illiterate,<br />
read and write, grade 1-4, grade 5-8 and grade<br />
>8/<br />
Positive<br />
SEXHEAD Dummy Sex <strong>of</strong> the household head (1=male, 0=female) Positive<br />
CUTLAND Continuous Cultivated land size in hectare 1.5 1.2 Positive<br />
LIVESTOC Continuous Total livestock holding in TLU 6.7 4.2 Positive<br />
DISMARKE Continuous Distance from the market place in km 6.7 2.1 Negative<br />
SOILFERT Dummy Farmers’ perception <strong>of</strong> soil fertility status (1=<br />
Positive<br />
fertile, 0= infertile)<br />
SUPPEX Dummy Access to extension service (1= access, 0=no<br />
Positive<br />
access)<br />
CREDIT Dummy Access to credit (1=access, 0=no access) Positive<br />
NEARNESS Continuous Nearness <strong>of</strong> households to water source in km 13.0 9.7 Positive<br />
<strong>Table</strong> 2. Comparison <strong>of</strong> consumption expenditure per adult equivalent between irrigators and<br />
non-irrigators<br />
User<br />
Nonuser<br />
Mean Std Mean Std<br />
MD t - value<br />
Food consumption<br />
expenditure 1322.3 563.4 774.4 369.7 547.8 8.0 ***<br />
Total expenditure 1,780.3 946.4 955.6 434.5 824.7 7.9 ***<br />
Coping strategy index 11.4 13.9 31.4 16.1 19.93 9.1 ***<br />
Source: survey result (2006)<br />
*** indicates significance level at 1 percent.<br />
189
<strong>Table</strong> 3. Summary <strong>of</strong> descriptive statistics <strong>of</strong> sample households by access to irrigation<br />
/continuous variables/<br />
User<br />
Nonuser<br />
Mean Std Mean Std<br />
MD t - value<br />
HEADAGE 46.8 14.4 49.5 12.5 2.7 1.4<br />
HHSIZEAE 4.3 1.7 5.1 1.8 0.7 3.0 ***<br />
DEPRATIO 0.4 0.1 0.5 0.1 0.0 3.1 ***<br />
CUTLAND 1.5 1.5 1.4 0.7 0.1 0.9<br />
LIVESTOC 7.3 3.4 5.0 2.6 2.2 3.6 ***<br />
TOTPRODUC 13,689.1 21,706.8 2,255.4 3,487.0 11,433.7 5.2 ***<br />
TOTEXPEN 1,780.3 946.4 955.6 434.5 824.7 7.9 ***<br />
DISMARKE 7.3 2.2 6.1 1.9 1.2 4.0 ***<br />
Source: Survey result (2006)<br />
*** indicates significance level at 1 percent.<br />
<strong>Table</strong> 4. Summary <strong>of</strong> descriptive statistics <strong>of</strong> sample households by access to irrigation<br />
/discrete variables/<br />
Variable User Nonuser Total χ2<br />
EDUCATAGORY 0.007***<br />
Illiterate 69 58 127<br />
Read and write 1 13 14<br />
Grade 1-4 3 7 10<br />
Grade 5-8 15 15 30<br />
Grade >8 12 7 19<br />
SEXHEAD 0.6<br />
Female 7 9 16<br />
Male 93 91 184<br />
SUPPEX 0.002***<br />
Access to extension 67 45 112<br />
No access to extension 33 55 88<br />
CREDIT 0.01***<br />
Access to credit 31 48 79<br />
No access to credit 69 52 121<br />
SOILFERT 0.001***<br />
Fertile 93 67 160<br />
Infertile 7 33 40<br />
Source: Survey result (2006)<br />
*** indicates significance level at 1 percent.<br />
190
<strong>Table</strong> 5. Estimation result <strong>of</strong> the Binary Probit model and its Marginal Effect<br />
Variable Coefficient Marginal effect<br />
CONSTANT 2.634<br />
(0.203)<br />
1.050<br />
(0.203)<br />
AGEHEAD -0.861<br />
(0.248)<br />
-0.343<br />
(0.248)<br />
HHSIZEAE -0.764<br />
(0.021) ** -0.304<br />
(0.021)<br />
SEXHEAD 0.414<br />
(0.438)<br />
0.165<br />
(0.438)<br />
EDUCATAGORY -0.293<br />
(0.764)<br />
-0.117<br />
(0.764)<br />
DISMARKE -0.324<br />
(0.673)<br />
-0.129<br />
(0.673)<br />
CUTLAND -0.604<br />
(0.004) *** -0.241<br />
(0.004)<br />
LIVESTOC 0.362<br />
(0.000) *** 0.144<br />
(0.000)<br />
SOILFERT 0.838<br />
(0.019) *** 0.334<br />
(0.019)<br />
SUPPEX -0.427<br />
(0.169)<br />
-0.170<br />
(0.169)<br />
CREDIT -0.615<br />
(0.024) ** -0.245<br />
(0.024)<br />
NEARNESS 0.403<br />
(0.008) *** 0.160<br />
(0.008)<br />
AGEHEAD2 0.722<br />
(0.302)<br />
0.288<br />
(0.302)<br />
HHSIZEAE2 0.687<br />
(0.034) ** 0.274<br />
(0.034)<br />
Dependent variable<br />
Access to irrigation<br />
Weighting variable<br />
One<br />
Number <strong>of</strong> Observations 193<br />
Logliklihood function -69.13<br />
Restricted log likelihood -133.65<br />
Chi squared 129.03<br />
Degree <strong>of</strong> freedom 13<br />
Significance level 0.00<br />
Source: Model out put (2006)<br />
*** and** are level <strong>of</strong> significance at 1 percent and 5 percent respectively<br />
Values in parenthesis are p values<br />
191
<strong>Table</strong> 6. Estimation Result <strong>of</strong> the Selection Equation and its Marginal Effect<br />
Variable Coefficient Marginal effect<br />
1553.936<br />
576.882<br />
-331.133<br />
CONSTANT 1553.936<br />
(0.000) *** (0.000) ***<br />
ACCIRRIG 576.882<br />
(0.000) *** (0.000) ***<br />
AGEHEAD 14.918<br />
(0.348)<br />
14.918<br />
(0.348)<br />
HHSIZEAE -391.676<br />
(0.000) *** -391.676<br />
(0.000) ***<br />
SEXHEAD -331.133<br />
(0.001) *** (0.001) ***<br />
EDUCATAGORY 1.736<br />
(0.930)<br />
1.736<br />
(0.930)<br />
DISMARKE 13.567<br />
(0.378)<br />
13.567<br />
(0.378)<br />
CUTLAND 85.751<br />
(0.058) * 85.751<br />
(0.058) *<br />
LIVESTOC -5.063<br />
(0.717)<br />
-5.063<br />
(0.717)<br />
SOILFERT -47.613<br />
(0.534)<br />
-47.613<br />
(0.534)<br />
SUPPEX 117.729<br />
(0.069) * 117.729<br />
(0.069) *<br />
CREDIT -44.539<br />
(0.429)<br />
-44.539<br />
(0.429)<br />
NEARNESS 9.602<br />
(0.009) *** 9.602<br />
(0.009) ***<br />
AGEHEAD2 -0.112<br />
(0.441)<br />
-0.112<br />
(0.441)<br />
HHSIZEAE2 25.607<br />
(0.001) *** 25.607<br />
(0.001) ***<br />
LAMBDA -243.448<br />
(0.041) **<br />
Dependent variable<br />
Number <strong>of</strong> Observations 193<br />
Selection rule is: User =1<br />
Log-L = -1395.69<br />
Restricted (b=0) Log -L = -1489.70<br />
R-squared = 0.58<br />
Correlation <strong>of</strong> disturbance in<br />
regression and selection criteria<br />
(Rho)<br />
Total food (Total food expenditure<br />
per adult equivalent per annum)<br />
-0.67<br />
Prob value = 0.00<br />
Source: model out put (2006)<br />
*** ** and * show level <strong>of</strong> significance at 1percent, 5 percent and 10 percent probability level.<br />
Values in parenthesis are p values<br />
192
A Comparative Analysis <strong>of</strong> the Technical Efficiency <strong>of</strong> Irrigated and<br />
Rainfed Agriculture:<br />
A Case <strong>of</strong> Awash and Rift Valleys <strong>of</strong> Ethiopia<br />
Dawit Kelemework<br />
Department <strong>of</strong> Economics, Haramaya University<br />
dawitkelemework@yahoo.com<br />
Abstract<br />
Ethiopia’s economy is heavily dependent on<br />
the agricultural sector, which contributes<br />
45% <strong>of</strong> the GDP, providing livelihood for<br />
85% <strong>of</strong> the population and accounting for<br />
60% <strong>of</strong> the foreign exchange earning.<br />
Ethiopia, one <strong>of</strong> the poorest countries in<br />
Sub-Saharan Africa, has been repeatedly hit<br />
by drought resulting in famine and the loss<br />
<strong>of</strong> life <strong>of</strong> thousands <strong>of</strong> its rural citizens. The<br />
country’s agriculture mainly depends on rain<br />
fed peasant farming which accounts for 96%<br />
<strong>of</strong> the food produced in the country. On the<br />
other hand, it is estimated that the major<br />
river basins <strong>of</strong> the country can irrigate about<br />
3.5 million-hectare <strong>of</strong> land and at present<br />
only about 161,010 ha or 4.6% is irrigated<br />
around the major river basins. Though the<br />
expansion and better utilization <strong>of</strong> this<br />
irrigation potential is unattested, the<br />
production efficiency <strong>of</strong> the existing<br />
irrigation systems also needs attention. This<br />
paper compares the technical efficiency <strong>of</strong><br />
rainfed and irrigated agricultural production<br />
in Ethiopia. Using the stochastic production<br />
frontier approach, the study concludes that<br />
the existing irrigation systems are not that<br />
efficient and there is a need to make them<br />
operate near their production frontier. The<br />
production frontiers <strong>of</strong> both irrigated and<br />
rainfed agriculture is estimated along with<br />
the technical efficiency <strong>of</strong> each farmer in<br />
both groups and the two groups are<br />
compared in relation to their respective<br />
frontiers. The marginal and average<br />
productivities <strong>of</strong> the important factors <strong>of</strong><br />
production is also calculated and compared.<br />
1. Introduction<br />
Ethiopia has a total land area <strong>of</strong> about<br />
113,000,000 hectares (Annual Report in the<br />
Ethiopian Economy, 1999). The economy is<br />
heavily dependent on the agricultural sector,<br />
which contributes 45 percent to GDP, 60<br />
percent <strong>of</strong> the foreign exchange earnings and<br />
provides livelihood to 85 percent <strong>of</strong> the<br />
population (EEPRI, 2005). Of the arable<br />
land, only 40 percent is currently cultivated<br />
(Awulachew et al, 2005). As a result <strong>of</strong> the<br />
importance <strong>of</strong> agriculture in Ethiopia’s<br />
economy, the government has embarked on<br />
an agriculture centered rural development<br />
program which is meant to spearhead the<br />
country’s economic development program<br />
(Government <strong>of</strong> the Federal Republic <strong>of</strong><br />
Ethiopia, 2003). Irrigation development is<br />
viewed as an integral part <strong>of</strong> this economic<br />
development program as promulgated by the<br />
Ethiopian <strong>Water</strong> Sector Strategy (Federal<br />
Democratic Republic <strong>of</strong> Ethiopia, 2001).<br />
It is estimated that the major river basins <strong>of</strong><br />
the country can irrigate about 3.5 millionhectare<br />
<strong>of</strong> land. At present only about<br />
161,010 ha or under five percent is irrigated<br />
(Annual Report on the Ethiopian Economy).<br />
The private sector accounts for 6,000 ha <strong>of</strong><br />
the developed irrigated area (Amare, 2000).<br />
Unpredictable rainfall coupled with a high<br />
193
ate <strong>of</strong> population growth, makes Ethiopia<br />
unable to feed its people. Even under<br />
favorable growth scenarios <strong>of</strong> rain fed<br />
agriculture, the country still faces a deficit <strong>of</strong><br />
food crops.<br />
The policies for economic development are<br />
formulated in an environment which can be<br />
referred to as the “Ethiopian Paradox”. The<br />
Ethiopian <strong>Water</strong> Resources <strong>Management</strong><br />
Policy (1999) states that Ethiopia is<br />
endowed with relatively higher amounts <strong>of</strong><br />
rainfall in the region and has a surface<br />
run<strong>of</strong>f <strong>of</strong> about 122 billion cubic meters <strong>of</strong><br />
water, excluding ground water. The same<br />
document also states that “…a number <strong>of</strong><br />
studies made in the field confirm that if the<br />
country’s water resources are developed to<br />
cater for irrigation, it would be possible to<br />
attain agricultural surplus enough both for<br />
domestic consumption as well as for<br />
external markets.” pp VIII. However, even<br />
given this estimated potential, Ethiopia<br />
continues to be a recipient <strong>of</strong> food aid.<br />
Irrigation development is therefore<br />
perceived as one <strong>of</strong> the strategies for<br />
alleviating the paradox. The government <strong>of</strong><br />
Ethiopia has an irrigation development<br />
strategy which aims to develop over 470,000<br />
ha <strong>of</strong> irrigation by 2016. Fifty two percent<br />
<strong>of</strong> this development will be large and<br />
medium scale schemes while the remaining<br />
48 percent will be small scale schemes16<br />
(Federal Democratic Republic <strong>of</strong> Ethiopia,<br />
<strong>Water</strong> Sector Development Programme<br />
2002-2016). Small scale irrigation<br />
development is therefore envisaged to play a<br />
critical role in the government’s strategy for<br />
addressing the food security situation in<br />
Ethipoia and solving the paradox. However,<br />
the estimated area under small scale<br />
irrigation is owever, only 68,210 hectares in<br />
1996/97 (CSA, 1998), only 30 percent <strong>of</strong><br />
16 According to Awulachew et al (1999)<br />
irrigation projects in Ethiopia are identified as<br />
large-scale irrigation if the size <strong>of</strong> command area<br />
is greater than 3,000 ha, medium scale if it falls<br />
in the range <strong>of</strong> 200 to 3,000 ha, and small scale if<br />
it is covering less than 200ha.<br />
what the government plans to develop by<br />
2016, showing that this irrigation sub sector<br />
still has great potential for contributing to<br />
the Ethiopian’s government development<br />
objectives.<br />
During the former Derg17 regime, many<br />
small scale irrigation schemes were<br />
collectivized. They were generally poorly<br />
operated, managed and maintained and<br />
currently most, if not all, need for<br />
rehabilitation (CRS, 1999). Many smallscale<br />
irrigation infrastructures, especially<br />
traditional diversion weirs, which tend to be<br />
washed away by flash floods, need annual<br />
upkeep. Siltation and damage within the<br />
canal system from flooding are also major<br />
concerns for small scale irrigation (ibid).<br />
The degradation <strong>of</strong> upper catchments and<br />
watersheds in many areas does not help the<br />
situation (ibid).<br />
Because <strong>of</strong> the ambitious government plans<br />
to expand small scale irrigation in Ethiopia,<br />
it is important to study, among other<br />
performance parameters, the production<br />
efficiency <strong>of</strong> small scale irrigation schemes .<br />
Many believe that the existing irrigation<br />
schemes are not operating efficiently, and<br />
that much has to be done to improve their<br />
efficiency. For example, CRS (1999) has<br />
identified that the existing small scale<br />
irrigation schemes exhibited inefficient use<br />
<strong>of</strong> water, leakage from unlined canals and<br />
faulty usage <strong>of</strong> irrigation water. This study<br />
estimates the technical efficiency <strong>of</strong> small<br />
scale irrigation in Ethiopia.<br />
2. Objectives<br />
The objectives <strong>of</strong> the study are to:<br />
estimate and compare the technical<br />
efficiency <strong>of</strong> dryland and small scale<br />
irrigation farmers.<br />
compare the technical efficiency <strong>of</strong> different<br />
small scale irrigation schemes and<br />
17 Desalegn and Miheret, 2004 characterized the<br />
Derg regime in Ethiopia as a Marxist-Leninist<br />
unitary state with an ideologically driven state or<br />
command economy policy.<br />
194
make recommendations that lead to<br />
improved technical efficiency.<br />
3. The study sites<br />
Batu Degaga Irrigation project is located at<br />
8° 25′ North latitude and 39° 25′ longitude,<br />
in the upper Awash River Basin. The<br />
elevation <strong>of</strong> the project area is around 1350<br />
meters (Yusuf, 2004). The total developed<br />
irrigable area <strong>of</strong> the project is 140 ha <strong>of</strong><br />
which 60 ha is currently under cultivation.<br />
Batu Degaga was established by World<br />
Vision Ethiopia, a non-governmental<br />
organization in 1992. In 1993, a Farmers’<br />
<strong>Water</strong> Users Association was formed and<br />
was led by the selected administrative<br />
committee from the irrigation project. The<br />
numbers <strong>of</strong> beneficiaries in the project were<br />
varying from year to year but now there are<br />
120 members (ibid). Extension advice at<br />
Batu Degaga is being provided by six<br />
agricultural extension agents permanently<br />
residing around the irrigation system. They<br />
are graduates <strong>of</strong> the newly established<br />
agricultural training colleges.<br />
Doni irrigation project is located in the<br />
upper valley <strong>of</strong> Awash River Basin and 33<br />
Km North <strong>of</strong> Sodore Recreational Center.<br />
Geographical location <strong>of</strong> the project is 8°<br />
30′ N and 39°33′ E and the elevation varies<br />
from 1240m to 1280m above sea level. It<br />
has a different development path from Batu<br />
Degaga. Some 30 years ago, a private<br />
investor constructed a low head gravity weir<br />
in Awash River and about 3 km <strong>of</strong> main<br />
canal for the scheme. During the Derg, the<br />
land was nationalized and distributed to<br />
smallholders. A Producer Cooperative was<br />
established to administer and use the<br />
scheme. However, scheme operation and<br />
maintenance was not good enough to keep it<br />
functional and after few years it almost<br />
collapsed. Following the downfall <strong>of</strong> the<br />
Derg, a group <strong>of</strong> individual farmers who<br />
owned land within the boundary <strong>of</strong> the<br />
irrigation scheme started rehabilitating it and<br />
requested the assistance <strong>of</strong> CARE-<br />
<strong>International</strong> in Ethiopia (a nongovernmental<br />
organization). The request for<br />
rehabilitation was accepted in 1994 and the<br />
construction was completed in 1997 (ibid).<br />
At the time <strong>of</strong> study, there was no<br />
development agent assigned to the irrigation<br />
project to provide extension advice,<br />
however, Yusuf (2004) wrote that there was<br />
one development agent assigned by the<br />
Woreda’s Irrigation Bureau to assist, advice,<br />
organize and monitor the irrigation project<br />
activity and the farmers in the association.<br />
The Godino irrigation project is located in<br />
East Shewa zone <strong>of</strong> the Oromia region, Ada<br />
Liben Woreda. The water source is a big<br />
reservoir. The run<strong>of</strong>f <strong>of</strong> the surrounding<br />
catchments areas supplying the Wedecha<br />
and Belbela streams are made to run to the<br />
Reservoir and the water is distributed<br />
through canals. Though a <strong>Water</strong> Users<br />
Association does exist, Oromia Irrigation<br />
Authority and Woreda authorities control<br />
water distribution.<br />
At Batu Degaga and Doni farmers grow<br />
vegetables like onions and potatoes. At<br />
Godino a mixed farming system consisting<br />
<strong>of</strong> vegetables, namely, chickpea, pea,<br />
onions, potatoes and cereals like maize,<br />
wheat and teff are practiced.<br />
4. Data collection<br />
The selected small scale irrigation schemes,<br />
namely, Doni, Batu Degaga, and Godino,<br />
which are located in the Rift Valley <strong>of</strong><br />
Ethiopia, were chosen due to their relative<br />
proximity to the capital, Addis Ababa.<br />
Primary data were collected using the<br />
household as the unit <strong>of</strong> analysis. From each<br />
irrigation scheme, 50 randomly selected<br />
households were beneficiaries <strong>of</strong> irrigation<br />
and another 50 randomly selected<br />
households belonged to a control group who<br />
did not have access to irrigation. The control<br />
group is not far from the irrigation schemes.<br />
They are just bordering the irrigable area.<br />
Socio economic and production data were<br />
collected for the sample households for a<br />
year, between March 2004 and February<br />
2005. Production data was used to compute<br />
the gross value <strong>of</strong> production per household.<br />
195
The area planted was summed across<br />
irrigation seasons where applicable. Data on<br />
labor, family and hired, was collected for<br />
each cropping season by operation and also<br />
summed across seasons. The number <strong>of</strong><br />
corrugated iron sheets <strong>of</strong> on the ro<strong>of</strong> <strong>of</strong> the<br />
house <strong>of</strong> the farmer was used as a proxy for<br />
capital. Worku G. (1999) used the same<br />
methodology. Data were also collected on<br />
fertilizer applied, the number <strong>of</strong> oxen days<br />
used for plowing, money spent on seed and<br />
pesticides, and the total number <strong>of</strong><br />
irrigations. Household size and <strong>of</strong>f farm<br />
income were collected to give an idea <strong>of</strong> the<br />
household’s dependence on irrigation.<br />
The data were collected with funding from<br />
the <strong>International</strong> <strong>Water</strong> <strong>Management</strong><br />
<strong>Institute</strong> (IWMI).<br />
5. Methodology<br />
The study utilizes the stochastic frontier<br />
production function, as developed by<br />
Aigner, Lovell and Schmidt (1977) and<br />
Meeusen and Van den Broeck (1977), to<br />
estimate technical efficiency.<br />
For a cross section <strong>of</strong> firms, the stochastic<br />
frontier production function is given as:<br />
Yi = f ( Xi, b) + ei , i= 1,…,N………..1<br />
where Yi is the output <strong>of</strong> the ith firm, Xi is<br />
vector <strong>of</strong> inputs, and b is a vector <strong>of</strong><br />
production function parameters. ei is an<br />
error term made up <strong>of</strong> two components such<br />
that:<br />
ei = vi - ui ............2<br />
In equation 2 the error term vi is assumed to<br />
be a symmetric disturbance that is<br />
independently distributed as N(0, s2v). This<br />
error term is thought to exist due to<br />
favorable and unfavorable external shocks<br />
out <strong>of</strong> the firms control and also to errors <strong>of</strong><br />
measurement. It is this part <strong>of</strong> the error term<br />
that makes the frontier stochastic as firms<br />
can temporarily be above the frontier if the<br />
value <strong>of</strong> vi is large enough (Aigner et al.,<br />
1977).<br />
The error tern ui is assumed to be<br />
independent <strong>of</strong> vi and meets the condition<br />
that ui > 0, or is truncated above zero. This<br />
error term provides deviations from the<br />
frontier. The negative sign in equation 2<br />
along with positive values <strong>of</strong> ui cause<br />
negative deviations from the frontier for<br />
each observation. In their original paper<br />
Aigner at al.(1977) modeled this error term<br />
as a half–Normal and also as an exponential<br />
distribution.<br />
In this study the frontier production function<br />
is used for cross-sectional data as described<br />
by Jandrow et al (1982) to estimate farm<br />
level technical inefficiency. The computer<br />
s<strong>of</strong>tware FRONTIER Version 4.1 which<br />
gives the opportunity to specify the error<br />
term as half-Normal and truncated half-<br />
Normal was used to estimate the production<br />
function. The production function was<br />
specified as:<br />
Value <strong>of</strong> output = (A, L, F, S, R, O, I, P)<br />
where<br />
A = Total area planted (ha).<br />
L = labor used in person-days<br />
F = Fertilizer applied in kg<br />
S = Amount <strong>of</strong> money spent on seed<br />
(Ethiopian Birr, 1 USD = 8.65 Birr)<br />
R = number <strong>of</strong> sheets <strong>of</strong> corrugated iron <strong>of</strong><br />
the ro<strong>of</strong> <strong>of</strong> the house (what is the need <strong>of</strong><br />
including this variable if we are going to<br />
take it out <strong>of</strong> the estimation model.<br />
O = number <strong>of</strong> oxen days for plowing.<br />
I = total number <strong>of</strong> irrigations during the<br />
year.<br />
P = amount <strong>of</strong> money spent on pesticides<br />
(Birr)<br />
In all the three irrigation centers, average<br />
land holding family labor days used in<br />
production are higher in the dry land setting<br />
than that <strong>of</strong> the irrigation. However,<br />
irrigating farmers use much more hired<br />
labor. Output and <strong>of</strong>f farm income are also<br />
very high in the irrigation setting as<br />
compared to the control group. <strong>Table</strong> 1<br />
shows the mean values for the collected<br />
data.<br />
196
<strong>Table</strong>1: Mean values <strong>of</strong> collected data by irrigation system<br />
Batu Degaga Doni Godino<br />
Irrigation Dry land Irrigation Dry land Irrigation Dry land<br />
Off farm income<br />
(Birr)<br />
187.8 96.2 1,790 1520 422 192.8<br />
Household size 5.3 5.4 3.3 4.6 5.2 4.9<br />
Irrigated land in h<br />
(ha)<br />
0.55 1.53 0.44 1.78 0.36 0.67<br />
Family labor days 49.6 83.1 9.2 83.6 80.1 89.8<br />
Hired labor days 276.6 52.8 235 43.2 23.2 26.1<br />
Fertilizer (kg) 255.8 100.8 1,161 37.3 136 253.8<br />
Seed (Birr) 858.2 173 2,988 177 293 305<br />
Iron sheets 11.4 4.3 27.4 13.5 30 23<br />
Number <strong>of</strong> irrigations 27.2 ---- 61.7 ---- 15 ----<br />
Plowing oxen days 16.6 18.6 14.4 17.4 11.7 18.4<br />
Pesticides (Birr) 459.3 80.1 2008 9.5 50 33.7<br />
Value <strong>of</strong> output 16,374 4535.7 24,448 3,253 2,662 3294<br />
6. Model Specification<br />
An important issue in this study is the choice<br />
<strong>of</strong> functional form and the distribution <strong>of</strong> the<br />
error term. It is not assumed that the<br />
irrigation systems all have the same<br />
functional form which makes the<br />
comparison <strong>of</strong> technical inefficiencies<br />
somewhat complex. We started with a<br />
general translog functional form and then<br />
test whether the equations can reduce to<br />
either a partial translog or a Cobb Douglas<br />
using a one-sided generalized likelihood<br />
ratio test. The chow test is used to determine<br />
whether some <strong>of</strong> the schemes could be<br />
pooled together and thus estimate on<br />
equation. The same is done for the dryland<br />
data.<br />
The different Chow test showed that the data<br />
from Doni and Godino could be pooled<br />
together. The likelihood ratio test also<br />
showed that the equation for the combined<br />
Doni and Godino data could be reduced to a<br />
Cobb Douglas. The same test (LR test =<br />
36.4) showed that the half normal<br />
197
distribution <strong>of</strong> the error term was a better fit.<br />
The same result was arrived for the dry land<br />
data for Doni and Godino.<br />
The irrigation and dryland data for Batu<br />
Degaga is therefore treated separately.<br />
Model specification tests for the irrigation<br />
data showed that the equation for Batu<br />
Degaga was a full translog with a truncated<br />
half normal error term.<br />
7. Results<br />
Estimation is done using FRONTTIER<br />
Version 4.1, a computer program for<br />
stochastic frontier production and cost<br />
function estimation, which was developed<br />
by Tim Coelli<br />
7.I Production function analysis<br />
7.1.1 Irrigation Settings<br />
7.1.1.1 Doni and Godino together<br />
The combined data for Doni and Godino has<br />
a sample size <strong>of</strong> 93. The variables included<br />
in the production function are the natural<br />
logarithms <strong>of</strong> output, land, number <strong>of</strong><br />
irrigations, seed, fertilizers, pesticides, labor<br />
and the number <strong>of</strong> sheets <strong>of</strong> corrugated iron<br />
(as a proxy for capital) and the interactions<br />
<strong>of</strong> these variables. In the translog model the<br />
main variables with their interaction terms<br />
are 23 variables while there are 15 variables<br />
that are believed to explain inefficiency <strong>of</strong><br />
farmers.<br />
After some iterations, the likelihood ratio<br />
test showed that the Cobb-Douglas<br />
production function is the right specification<br />
for this data with 7 explanatory variables <strong>of</strong><br />
the production function and 14 variables that<br />
are believed to affect efficiency <strong>of</strong> farmers.<br />
The same test also showed that the half<br />
normal distribution <strong>of</strong> the error term is the<br />
better distribution.<br />
The final Maximum Likelihood Ratio<br />
estimates <strong>of</strong> Doni and Godino irrigation<br />
schemes combined:<br />
coefficient standard-error t-ratio<br />
constant 3.37 0.64 5.24<br />
land 0.08 0.13 0.58<br />
water 0.06 0.09 0.69<br />
seed 0.34 0.11 3.20<br />
fertilizer 0.28 0.08 3.39<br />
pesticide 0.02 0.05 0.46<br />
labor 0.36 0.10 3.50<br />
ro<strong>of</strong>ing -0.005 0.04 -0.11<br />
The dependent variable <strong>of</strong> this equation is the natural logarithm <strong>of</strong> output and all the explanatory<br />
variables are in natural logarithm form i.e the model is a double-log model.<br />
FRONTTIER Version 4.1 gives the level <strong>of</strong> inefficiency <strong>of</strong> each farmer and the mean efficiency<br />
<strong>of</strong> the system along with the production function estimates. Inefficiency effects (variables that are<br />
believed to explain farmers’ inefficiency) vary in number from scheme to scheme because<br />
variables that don’t have any variability were avoided from the model.<br />
7.1.1.2 Batu Degaga<br />
198
The data for Batu Degaga has a sample size <strong>of</strong> 51. The variables included in the production<br />
function are the natural logarithms <strong>of</strong> output, land, number <strong>of</strong> irrigations, seed, fertilizers,<br />
pesticides, labor and the number <strong>of</strong> sheets <strong>of</strong> corrugated iron (as a proxy for capital) and the<br />
interactions <strong>of</strong> these variables. In the translog model the main variables with their interaction<br />
terms are 23 while there are 13 variables that are believed to explain inefficiency <strong>of</strong> farmers.<br />
The different likelihood ratio tests showed that the production function for Batu Degaga can be<br />
represented by a full translog function while the error term has a truncated normal distribution.<br />
The Maximum Likelihood Estimation results <strong>of</strong> the production function for Batu Degaga<br />
irrigation scheme is:<br />
coefficient standard-error t-ratio<br />
constant 0.66 1.42 0.46<br />
land 0.48 1.20 0.40<br />
water 0.49 0.18 2.67<br />
seed 0.19 0.07 2.76<br />
fertilizer 0.03 0.72 0.04<br />
pesticide -0.40 0.41 -0.96<br />
labor 1.79 0.85 2.09<br />
ro<strong>of</strong>ing 0.33 0.51 0.64<br />
landsq -0.07 0.27 -0.27<br />
fertsq 0.07 0.04 1.81<br />
pestsq -0.04 0.03 -1.13<br />
laborsq -0.18 0.17 -1.05<br />
ro<strong>of</strong>sq -0.04 0.15 0.29<br />
landfert 0.09 0.30 0.30<br />
landpest -0.04 0.07 -0.58<br />
landlabor -0.11 0.35 -0.32<br />
fertpest -0.03 0.09 0.33<br />
fertlabor -0.04 0.17 -0.22<br />
pestlabor 0.15 0.10 1.50<br />
As was the case for Doni and Godino,<br />
elasticity <strong>of</strong> labor in Batu Degaga irrigation<br />
scheme possesses the highest magnitude<br />
from among the main factors <strong>of</strong> production.<br />
A unit percentage change in the amount <strong>of</strong><br />
labor days used will bring about a 1.8<br />
percentage change in the amount <strong>of</strong> output<br />
produced. This change is also statistically<br />
different from zero. This implies that labor<br />
is not an abundant resource in the irrigation<br />
scheme. We can increase output in this<br />
irrigation scheme by increasing the supply<br />
<strong>of</strong> labor. Since this labor variable is defined<br />
as a labor day, if the farmer increases the<br />
number <strong>of</strong> labor days he or she spent on<br />
their farms by one percent, they can increase<br />
their agricultural output by 1.8 percent.<br />
199
On the other hand, if we can somehow<br />
increase the water supply <strong>of</strong> the irrigations<br />
and hence increase the number <strong>of</strong> times<br />
farmers irrigate their land by one percent,<br />
we can bring about a 0.5 percentage increase<br />
in their agricultural production. This<br />
coefficient <strong>of</strong> water is also statistically<br />
significantly different from zero.<br />
A percentage increase in the size <strong>of</strong> land will<br />
also bring about a 0.48 percent increase in<br />
output. This is in line with many other<br />
studies whereby they confirm the very small<br />
size <strong>of</strong> land in Ethiopia being detrimental to<br />
agricultural production.<br />
The capital proxy (the number <strong>of</strong> sheets <strong>of</strong><br />
corrugated iron <strong>of</strong> the ro<strong>of</strong> <strong>of</strong> the house <strong>of</strong><br />
the farmer) also showed that a percentage<br />
change in the capital <strong>of</strong> the farmer brings<br />
about a 0.33 percent change in agricultural<br />
output.<br />
Fertilizer and seed are the other factors <strong>of</strong><br />
production with a positive influence on<br />
output. A percentage change in the amount<br />
<strong>of</strong> fertilizer used will bring about a 0.29<br />
percent change in output. A percentage<br />
change in seed also brings about a 0.18<br />
percent change on output, though the<br />
coefficients <strong>of</strong> both fertilizer and seed are<br />
not statistically significant. Pesticide has an<br />
unexpected negative sign.<br />
7.1.2 Dry land Settings<br />
As per the results <strong>of</strong> the Chow test, the dry<br />
land data surrounding Doni and Godino<br />
irrigation schemes were estimated together<br />
while those around Batu Degaga were<br />
treated separately.<br />
7.1.2.1 Doni and Godino dry land<br />
together<br />
The combined dry land data for Doni and<br />
Godino has a sample size <strong>of</strong> 100 and the<br />
better representation <strong>of</strong> the data according to<br />
the likelihood ratio tests is a Cobb-Douglas<br />
production function with a half-normal error<br />
distribution. The model has 6 explanatory<br />
variables <strong>of</strong> the production function and 11<br />
efficiency effect variables.<br />
The final Maximum Likelihood Ratio<br />
estimates <strong>of</strong> the model for the dry land<br />
agriculture for Doni and Godino combind<br />
coefficient standard-error t-ratio<br />
constant 3.82 0.51 7.54<br />
land 0.23 0.13 1.70<br />
seed 0.60 0.11 5.57<br />
pesticide -0.02 0.03 -0.77<br />
labor 0.35 0.13 2.71<br />
ro<strong>of</strong>ing 0.02 0.02 0.79<br />
oxen -0.18 0.11 -1.62<br />
In this dry land setting, increases in the<br />
usage <strong>of</strong> factors like labor, seed, land, and<br />
capital increases output, though at different<br />
percentage increases. A percentage increase<br />
in the value <strong>of</strong> seed increases agricultural<br />
output by 0.6 percent. Since close to all<br />
farmers reported to use local varieties <strong>of</strong><br />
seed, this coefficient showed that farmers<br />
are not using even local varieties <strong>of</strong> seed up<br />
to their full potential.<br />
As was the case for the irrigated agriculture,<br />
labor is not a very abundant resource even<br />
for the dry land agriculture. A unit<br />
percentage increase in labor still increases<br />
output by about 0.35 percent and this<br />
elasticity coefficient is statistically different<br />
from zero. This may also be because <strong>of</strong> the<br />
200
small family size <strong>of</strong> these areas from the<br />
national average or it could also be due to<br />
the nearby high demand <strong>of</strong> hired labor by<br />
the irrigation farms.<br />
The tiny holding size <strong>of</strong> land, as was the<br />
case for irrigated agriculture, is restricting<br />
agricultural output. A unit increase in the<br />
size <strong>of</strong> land increases agricultural production<br />
by 0.23 percent and this coefficient is<br />
statistically significant. This could be due to<br />
the very small size <strong>of</strong> farmers in the areas,<br />
though it is a bit higher when compared with<br />
that <strong>of</strong> irrigating farmers.<br />
Though statistically insignificant, a<br />
percentage change in the capital <strong>of</strong> farmers,<br />
as can be seen from the coefficient <strong>of</strong> the<br />
proxy variable, increases output by 0.18 per<br />
cent. The statistical insignificance may come<br />
from the fact that dry land farming is not<br />
capital intensive in Ethiopia.<br />
Farmers seem to use more oxen days on<br />
their farm as can be seen from the negative<br />
The final Maximum Likelihood Ratio<br />
estimates for dry land agriculture in Batu<br />
Degaga:<br />
coefficient standard-error t-ratio<br />
Constant 13.0 1.57 8.23<br />
Land 2.12 1.12 1.89<br />
Pesticide 0.44 0.23 1.93<br />
Labor -3.15 0.79 -4.0<br />
Ro<strong>of</strong>ing 0.35 0.16 2.17<br />
Oxen 1.45 0.90 1.61<br />
Landsq 0.81 0.21 3.80<br />
Pestsq 0.006 0.15 0.39<br />
Laborsq 0.28 0.14 1.96<br />
Ro<strong>of</strong>sq -0.09 0.04 -2.38<br />
Oxensq -0.43 0.34 -1.26<br />
Landpest -0.09 0.06 -1.49<br />
Landlabor -0.30 0.30 -1.00<br />
Landoxen -0.08 0.336 -0.23<br />
Pestlabor -0.03 0.05 -0.52<br />
sign <strong>of</strong> the ‘oxen’ coefficient. A unit<br />
increase in oxen (defined as the number <strong>of</strong><br />
pairs <strong>of</strong> oxen used for plowing the land<br />
times the number <strong>of</strong> days they plow) will<br />
decrease output by 0.17 per cent. The use <strong>of</strong><br />
pesticide also has an unexpected negative<br />
sign in the production function. However,<br />
both the oxen and pesticide coefficients are<br />
statistically insignificant.<br />
Batu Degaga Dry land<br />
The dry land data around Batu Degaga<br />
irrigation scheme has a sample size <strong>of</strong> 47.<br />
The estimation result showed that the better<br />
representation <strong>of</strong> this data is a translog<br />
model with a half-normal distribution <strong>of</strong> the<br />
error term. The five main variables in the<br />
production function with their squared and<br />
interaction terms make the total variables in<br />
the production function to be 16. There are<br />
also 11 inefficiency-explaining variables in<br />
the model.<br />
201
Pestoxen -0.06 0.05 -1.41<br />
Laboroxen 0.23 0.33 0.69<br />
Dry land farmers around Batu Degaga are<br />
highly constrained by their size <strong>of</strong> land. A<br />
unit percentage increase in the size <strong>of</strong> land<br />
will bring about a 2.1 % increase in<br />
agricultural output, showing the relative<br />
scarcity <strong>of</strong> land in the area.<br />
Labor seems to be deployed excessively on<br />
this agriculture. A percentage increase in<br />
labor days will bring about a 3.1 percent<br />
decrease <strong>of</strong> output. The redundant use <strong>of</strong><br />
labor may not be surprising in the face <strong>of</strong><br />
scarce land resource.<br />
A percentage increase in the number <strong>of</strong> oxen<br />
days brings about a 1.5 per cent increase in<br />
output. The coefficient is also statistically<br />
significantly different from zero. Increase in<br />
the level <strong>of</strong> pesticide use by one per cent<br />
also brings about a 0.4 per cent increase in<br />
agricultural output while that <strong>of</strong> capital<br />
brings 0.34 per cent increase.<br />
7.2 Inefficiency Effects<br />
7.2.1 Efficiency <strong>of</strong> Dry land settings<br />
7..2.1.1 Doni-Godino Irrigation Scheme<br />
There were 14 inefficiency effects that are<br />
believed to explain the inefficiency <strong>of</strong><br />
farmers in Doni and Godino irrigation<br />
schemes. The maximum likelihood<br />
estimation <strong>of</strong> FRONTTIER Version 4.1<br />
gives the estimates <strong>of</strong> these variables with<br />
that <strong>of</strong> the production function. In this<br />
computer program, the dependent variable is<br />
level <strong>of</strong> inefficiency (not efficiency). As a<br />
result, we expect the variable to have the<br />
opposite sign <strong>of</strong> its effect on the efficiency.<br />
Technical inefficiency effects for Doni and Godino irrigation schemes are:<br />
Coefficients standard errors t-ratios<br />
credit -0.09 0.19 -0.46<br />
advice -0.26 0.16 -1.61<br />
<strong>of</strong>ffarm -0.00004 0.00003 -1.39<br />
hhsize 0.07 0.04 1.89<br />
gender 0.31 0.16 1.91<br />
eduhh 0.03 0.02 1.75<br />
age -0.01 0.01 -0.87<br />
agesq 0.00006 0.0002 0.38<br />
edumem -0.05 0.18 -0.28<br />
extension 0.05 0.13 0.35<br />
medslope 0.08 0.13 0.65<br />
steeply 0.06 0.19 0.30<br />
mdummy 0.49 0.21 2.36<br />
tdummy 0.44 0.23 1.88<br />
sigma-squared 0.20 0.03 5.91<br />
gamma 0.0005 0.01 0.04<br />
202
As can be seen from the negative sign <strong>of</strong> the<br />
coefficients, farmers who get credit within<br />
the last three years and who are beneficiaries<br />
<strong>of</strong> agricultural advisory services, perform<br />
better in terms <strong>of</strong> efficiency than those who<br />
don’t. Since the coefficient on advice is<br />
statistically significant, we can say that<br />
advice makes a tangible improvement in<br />
efficiency <strong>of</strong> farmers.<br />
Farmers who have higher <strong>of</strong>f-farm income<br />
are also more efficient than those who don’t.<br />
This may be due to the fact that the extra<br />
income may enable them to invest on<br />
improved technologies. It might also be the<br />
case that farmers with high <strong>of</strong>f-farm income,<br />
especially those in small local trades, are<br />
more exposed to different ideas than those<br />
who don’t have.<br />
Males are found to be more efficient than<br />
females in Doni and Godino irrigation<br />
schemes. The coefficient <strong>of</strong> gender is also<br />
statistically different from zero.<br />
Farmers located at the middle and tail<br />
locations <strong>of</strong> the watercourse are less<br />
efficient than those at the head reaches. As<br />
can be seen from the dummy variable for<br />
medium location <strong>of</strong> farms (mdummy) and<br />
tail locations <strong>of</strong> farms (tdummy), farms at<br />
the head reach are more efficient. The<br />
coefficients <strong>of</strong> both <strong>of</strong> these variables are<br />
statistically significantly different from zero.<br />
The other inefficiency variables were found<br />
to be not statistically different from zero.<br />
The mean efficiency <strong>of</strong> farmers <strong>of</strong> Doni and<br />
Godino irrigation schemes is 55.6 %. That is<br />
we can increase output <strong>of</strong> these farmers by<br />
44.4% by just re-allocating their input use.<br />
Percentages <strong>of</strong> Technical Efficiency<br />
Estimates for Doni and Godino Irrigation<br />
Schemes Together<br />
Range <strong>of</strong> efficiency levels Frequency<br />
< 0.3 0<br />
0.3 to 0.39 17<br />
0.4 to 0.49 28<br />
0.5 to 0.59 17<br />
0.6 to 0.69 10<br />
0.7 to 0.79 9<br />
0.8 to 0.89 5<br />
0.9 to 0.99 3<br />
1 4<br />
7..2.1.2 Batu Degaga<br />
The model for this irrigation scheme has 12<br />
inefficieny-explaining variables.<br />
Mean efficiency <strong>of</strong> the irrigated scheme is<br />
76 %. That is without extra input, reallocations<br />
<strong>of</strong> the farmers’ resources can<br />
increase output by 24%.<br />
Percentages <strong>of</strong> Technical Efficiency<br />
Estimates for Batu Degaga Irrigation<br />
Scheme<br />
Efficiency Range<br />
< 0.3 1<br />
0.3 to 0.39 1<br />
0.4 to 0.49 6<br />
0.5 to 0.59 4<br />
Frequency<br />
0.6 to 0.69 3<br />
203
0.7 to 0.79 5<br />
0.8 to 0.89 16<br />
0.9 to 0.99 15<br />
1 0<br />
7.2.2 Efficiency <strong>of</strong> Dry land Farmers<br />
7.2.2.1 Doni and Godino dry land<br />
farmers:<br />
There are 11 inefficiency variables in this<br />
model. The highest level <strong>of</strong> efficiency <strong>of</strong><br />
farmers is exhibited in these areas. The<br />
mean efficiency <strong>of</strong> these farmers is 79.8%.<br />
However, we can increase the output <strong>of</strong> the<br />
farmers by 20.1% with the same level <strong>of</strong><br />
inputs that farmers are using.<br />
Percentages <strong>of</strong> Technical Efficiency<br />
Estimates for Dry Land Farmers Around<br />
Doni and Godino<br />
Range<br />
Efficiency<br />
< 0.3 2<br />
0.3 to 0.39 0<br />
0.4 to 0.49 6<br />
0.5 to 0.59 4<br />
0.6 to 0.69 8<br />
0.7 to 0.79 8<br />
0.8 to 0.89 50<br />
0.9 to 0.99 22<br />
1 0<br />
Frequency<br />
7.2.2.2 Batu Degaga dry land Areas<br />
The final model for these farmers includes<br />
11 inefficiency-explaining variables. The<br />
mean efficiency <strong>of</strong> the farmers is 65.6%,<br />
implying that we can increase agricultural<br />
output <strong>of</strong> the farmers by 34.4% by<br />
reallocating their resources.<br />
Percentages <strong>of</strong> Technical Efficiency<br />
Estimates <strong>of</strong> Dry Land Farmers in Batu<br />
Degaga<br />
Range<br />
Efficiency<br />
< 0.3 0<br />
0.3 to 0.39 7<br />
0.4 to 0.49 2<br />
0.5 to 0.59 13<br />
0.6 to 0.69 7<br />
0.7 to 0.79 3<br />
0.8 to 0.89 5<br />
0.9 to 0.99 8<br />
1 2<br />
Frequency<br />
7.2.3 Comparison <strong>of</strong> Efficiency between<br />
the irrigation schemes and rainfed<br />
agriculture<br />
In two irrigation schemes dry land farmers<br />
happened to be more efficient than irrigation<br />
farmers with respect to their own frontiers.<br />
In Doni and Godino areas, the efficiency <strong>of</strong><br />
irrigation farmers is 55.6 %. However, the<br />
mean efficiency <strong>of</strong> farmers with no access to<br />
irrigation around these irrigation areas is<br />
79.8 %. This may be due to the fact that low<br />
level <strong>of</strong> output <strong>of</strong> the dry land farming<br />
system is forcing the farmers to allocate the<br />
small resources they have more efficiently<br />
than the irrigation farmers. The difference<br />
204
etween the dry land and irrigation farmers<br />
in these areas is more than 24 percentage<br />
points.<br />
The mean efficiency <strong>of</strong> farmers in Batu<br />
Degaga irrigation scheme is 76% while dry<br />
land farmers around this scheme are 65.6 %<br />
efficient. The difference in efficiency <strong>of</strong><br />
these two groups <strong>of</strong> farmers is more than 10<br />
percentage points.<br />
But we should take note <strong>of</strong> the fact that the<br />
two types <strong>of</strong> farmers are facing two different<br />
frontiers. The irrigators are facing a higher<br />
frontier than the dry land farmers and are on<br />
average more far from their frontier while<br />
dry land farmers are closer to their low<br />
frontier. That is to say the availability <strong>of</strong><br />
water for irrigators has pushed their frontier<br />
outwards and made them productive. And<br />
yet, the high inefficiency <strong>of</strong> these farmers<br />
indicates that there is even more potential to<br />
be exploited and the potential presented by<br />
water isn’t yet exploited.<br />
To compare the frontiers <strong>of</strong> irrigators and<br />
dry land farmers, points on the frontier in<br />
each system are selected, specifically the<br />
average <strong>of</strong> the logarithmic transformations<br />
that were used to estimate the frontiers.<br />
These averages are then converted back to<br />
original, non-logged, levels to give<br />
comparable input combinations on the<br />
frontiers <strong>of</strong> each system. Makombe et al,<br />
2001, used this methodology. The results <strong>of</strong><br />
this evaluation show that Doni and Godino<br />
irrigation schemes require 0.77 ha <strong>of</strong> land,<br />
26.6 days <strong>of</strong> irrigation, Br 706.3 worth <strong>of</strong><br />
seed, 320 kg <strong>of</strong> fertilizer, Br 202 worth <strong>of</strong><br />
pesticide, and 114.4 labor days to produce<br />
Br 5, 271 worth <strong>of</strong> output. On the other hand<br />
the dry land farmers surrounding these two<br />
irrigation schemes require 1.22 ha <strong>of</strong> land,<br />
Br 194.4 worth <strong>of</strong> seed, Br 4.9 worth <strong>of</strong><br />
pesticide, 97.5 labor days, and 15.2 pairs <strong>of</strong><br />
oxen plowing days to produce Br 2,591<br />
worth <strong>of</strong> output. This implies that irrigators<br />
and dry land farmers don’t face the same<br />
frontier and the frontier for irrigators is<br />
much higher than that <strong>of</strong> dry land farmers.<br />
In Batu Degaga, irrigation requires 0.92 ha<br />
<strong>of</strong> land, 22.2 days <strong>of</strong> irrigation, Br 299<br />
worth <strong>of</strong> seed, 148.4 kg <strong>of</strong> fertilizer, Br<br />
181.3 worth <strong>of</strong> pesticide and 244.7<br />
labordays to produce Br 8,103 worth <strong>of</strong><br />
output; while dry land farmers in this area<br />
are required 1.3 ha <strong>of</strong> land, Br 22.2 worth <strong>of</strong><br />
pesticide, 121.5 labor days and 14 pairs <strong>of</strong><br />
oxen plowing days to produce Br 4,024<br />
worth <strong>of</strong> output. These show that irrigators<br />
face a higher frontier than dry land farmers.<br />
7.2.4 Marginal Productivities<br />
To compute for marginal Productivity <strong>of</strong><br />
inputs we first non-linearize the estimated<br />
production function and take the first<br />
derivative <strong>of</strong> output with respect to the<br />
specific input for which its marginal<br />
productivity is to be determined.<br />
For Doni and Godino irrigation schemes<br />
together, the estimated production function<br />
is:<br />
Lny = 0.34 + 0.78ln(land) + 0.6 lnwater +<br />
0.34lnseed + 0.28lnfert + 0.21lnpest<br />
+ 0.36lnlabor – 0.48lnro<strong>of</strong><br />
Y = 0.34(land) 0.78 (water) 0.6 (seed) 0.34 (fert) 0.8<br />
(pest) 0 .21 (labor) 0.36 (ro<strong>of</strong>) -0.48<br />
Taking the first derivative <strong>of</strong> Y with respect<br />
to each input and evaluating the resulting<br />
equation at the mean <strong>of</strong> regression variables<br />
gives the marginal productivity <strong>of</strong> each<br />
input.<br />
For the dry land farming around Doni and<br />
Godino<br />
Y = 0.38(land)0.23(seed)0.6(oxen)-<br />
0.18(pest)-0.2(labor)0.35(ro<strong>of</strong>)0.18<br />
Marginal productivity <strong>of</strong> inputs in Doni and<br />
Godino areas, based on frontier regression<br />
estimates:<br />
205
Doni Godino Irrigated<br />
Doni Godino dry land<br />
Attribute Level marginal productivity Level marginal productivity<br />
Value <strong>of</strong> output 5,271 2,591<br />
Land 0.77 32,529 0.2 18.6<br />
Irrigations 27 687 ---<br />
Seed 705 15.8 194 0.05<br />
Fertilizer 320 78 ---<br />
Pesticide 202 32.1 5 -0.66<br />
Labor 114 97.6 98 0.05<br />
Oxen --- 14 -0.2<br />
All inputs have higher marginal productivity in<br />
the irrigated agriculture compared with dry<br />
land agriculture. The result showed that any<br />
additional money spent on increasing land<br />
holdings, or to increase the number <strong>of</strong> times<br />
farmers can irrigate their land, to supply<br />
fertilizer and pesticide have high return in the<br />
irrigation schemes <strong>of</strong> Doni and Godino. The<br />
irrigation schemes can also accommodate more<br />
farmers or the existing farmers should spend<br />
more time on agriculture since an additional<br />
laborday spent on the farm will bring about a<br />
high return.<br />
8. Conclusion and recommendation<br />
8.1 Conclusion<br />
The paper tried to analyze the level <strong>of</strong><br />
efficiency <strong>of</strong> farmers between irrigated and dry<br />
land farmers based on three irrigation schemes<br />
in Ethiopia. These schemes are Doni, Godino<br />
and Batu Degaga irrigation schemes.<br />
The empirical findings showed that<br />
inefficiency <strong>of</strong> farmers prevail in Ethiopia very<br />
significantly, a result which is in conformity<br />
with other efficiency studies <strong>of</strong> Ethiopian<br />
farming by Abay and Assefa (1996), Abrar<br />
(1998), Croppenstedt and Abbi (1996) and<br />
many others. The contribution <strong>of</strong> this paper in<br />
efficiency studies <strong>of</strong> Ethiopian Agriculture is<br />
that it compares the efficiency levels <strong>of</strong><br />
irrigation and dry land farming. Though, there<br />
are very few irrigation schemes in Ethiopia,<br />
much inefficiency is exhibited in the existing<br />
schemes. In fact in two <strong>of</strong> the irrigation<br />
schemes, among three studied, their<br />
surrounding dry land farmers are more<br />
efficient than the irrigating farmers, compared<br />
<strong>of</strong> course, with respect to their own frontiers.<br />
Both for the combined data for Doni and<br />
Godino as well as Batu Degaga irrigation<br />
scheme, among all the explanatory variables,<br />
labor has the highest elasticity <strong>of</strong> output. In<br />
Doni and Godino, a one-percentage change in<br />
the amount <strong>of</strong> labor days will bring about a<br />
more than 0.36 percent change in output. We<br />
can also increase agricultural production in<br />
these two irrigation schemes by more than 0.28<br />
percent if we increase fertilizer use by one<br />
percent. A percentage change in the value <strong>of</strong><br />
seed also brings about a more than 0.34<br />
percent change in output. In Batu Degaga, a<br />
unit percentage change in the amount <strong>of</strong> labor<br />
days used will bring about a 1.8% percentage<br />
change in the amount <strong>of</strong> output produced. On<br />
the other hand, if we can somehow increase the<br />
water supply <strong>of</strong> the irrigations and hence<br />
increase the number <strong>of</strong> times farmers irrigate<br />
their land by one percent, we can bring about a<br />
0.5 percentage increase in their agricultural<br />
production. A percentage change in seed also<br />
brings about a 0.18 percent change on output.<br />
These coefficients are also statistically<br />
significantly different from zero.<br />
In terms <strong>of</strong> explaining the inefficiency <strong>of</strong><br />
farmers, agricultural advices, existence <strong>of</strong> <strong>of</strong>ffarm<br />
income and the location <strong>of</strong> farms on the<br />
watercourse appeared to have significant<br />
influence on the efficiency <strong>of</strong> farmers. Farmers<br />
at head reach are more efficient than farmers at<br />
the middle and tail locations <strong>of</strong> the<br />
watercourse. Males also happened to be more<br />
206
efficient than females. The coefficients <strong>of</strong><br />
these variables are statistically significantly<br />
different from zero. Moreover, availability <strong>of</strong><br />
credit, number <strong>of</strong> years <strong>of</strong> education <strong>of</strong> the<br />
head <strong>of</strong> the household (in Batu Degaga only),<br />
existence <strong>of</strong> a member <strong>of</strong> the household who<br />
completed primary school, age <strong>of</strong> the head <strong>of</strong><br />
the household and the slopes <strong>of</strong> farmlands have<br />
their expected signs, though statistically<br />
insignificant.<br />
The empirical findings also showed that there<br />
is significant inefficiency in the sampled<br />
irrigation schemes. The mean efficiency <strong>of</strong><br />
farmers <strong>of</strong> Doni and Godino irrigation schemes<br />
is 55.6 %. That is we can increase output <strong>of</strong><br />
these farmers by 44.4% by just re-allocating<br />
their input use. Mean efficiency <strong>of</strong> the Batu<br />
Degaga irrigation scheme is 76 % implying<br />
that without extra input, re-allocations <strong>of</strong><br />
farmers’ resources can increase output by 24%.<br />
In Doni and Godino irrigation schemes dry<br />
land farmers happened to be more efficient<br />
than irrigation farmers with respect to their<br />
own frontiers. The dry land farmers nearby<br />
these schemes have a mean efficiency <strong>of</strong> 79.8<br />
%. However, irrigators are more efficient than<br />
dry land farmers in Batu Degaga area.<br />
8.2 Recommendations<br />
In the face <strong>of</strong> resource constraint <strong>of</strong> many<br />
farmers and their high inefficiency levels,<br />
much attention should be given in affirming<br />
that farmers are using to the best <strong>of</strong> the little<br />
resource they have. Many farmers especially in<br />
the irrigated agriculture are performing way far<br />
from their frontier. In the irrigated agriculture,<br />
government and other relevant bodies should<br />
facilitate credit facilities since those farmers<br />
who were beneficiaries <strong>of</strong> credit are much<br />
closer to the frontier. Agricultural advices<br />
should also be given to farmers in a concerted<br />
manner since this variable was found to<br />
significantly affect the level <strong>of</strong> efficiency <strong>of</strong><br />
farmers. Education has also a positive impact<br />
in terms <strong>of</strong> farmers’ efficiency. Therefore<br />
government should intensify its efforts to<br />
expand education to the rural sector. The fact<br />
that families where there is at least one<br />
member who finished primary school are more<br />
efficient further justifies the need for<br />
expanding education. Activities that create<br />
more <strong>of</strong>f-farm income to the rural sector are<br />
also things to be encouraged since <strong>of</strong>f-farm<br />
income happens to increase the efficiency <strong>of</strong><br />
farmers.<br />
Since the marginal productivities <strong>of</strong> inputs in<br />
the irrigation schemes are very high, attention<br />
should also be given to increase the availability<br />
<strong>of</strong> these inputs. Government and other relevant<br />
bodies should try hard to bring more land to<br />
irrigations since the marginal productivity <strong>of</strong><br />
land <strong>of</strong> the irrigated agriculture is tremendous.<br />
The irrigation schemes <strong>of</strong> the lowland that<br />
follows the Awash River should find ways to<br />
attract more labor from the highlands where<br />
labor is expected to be abundant. The weather<br />
condition <strong>of</strong> this area along with the high<br />
demand for hired labor by the neighboring<br />
large commercial and state farms has made it<br />
difficult for the smallholders to obtain as much<br />
labor as they want. The marginal productivity<br />
<strong>of</strong> labor in these schemes is very high.<br />
Fertilizer, pesticides and seeds should also be<br />
better supplied to the irrigation schemes since<br />
the marginal productivity <strong>of</strong> these inputs<br />
happened to be very high.<br />
References:<br />
Abay A. and A. Assefa. (1996): The Impact <strong>of</strong><br />
Education on Allocative and Technical<br />
Efficiencies <strong>of</strong> farmers: The case <strong>of</strong><br />
Ethiopian Smallholders. Ethiopian Journal<br />
<strong>of</strong> Economics, V (1996) No. I<br />
Abrar S. (1998). Identifying the Sources <strong>of</strong><br />
Technical Inefficiency <strong>of</strong> Ethiopian<br />
Farmers Using the (Single Stage)<br />
Stochastic Frontier Inefficiency Model,<br />
WP-1998-09/04<br />
Amare H (2000). Integrated <strong>Water</strong> Resources<br />
Development and Opportunities for<br />
Irrigated Agriculture (Summary), 2000.<br />
Annual Report on the Ethiopian Economy,<br />
1999. Ethiopian Economic Association.<br />
Assefa A. and F. Heidhues. Estimation <strong>of</strong><br />
Technical Efficiency <strong>of</strong> smallholder<br />
farmers in the Central Highlands <strong>of</strong><br />
Ethiopia, Ethiopian Journal <strong>of</strong> Agricultural<br />
Economics I (1996) No I<br />
Awulachew, S.B., D.J. Merry, A.B. Kamara,<br />
B. Van Koppen, F. Penning de Vries, E.<br />
Boelee, G. Makombe (2005). Experiences<br />
and opportunities for promoting smallscale/micro<br />
irrigation and rainwater<br />
207
harvesting for food security in Ethiopia.<br />
Colombo, Sri Lanka: IWMI. V 86p<br />
(Working paper 98).<br />
Catholic Relief Services, Programmatic<br />
Environmental Assessment <strong>of</strong> Small-Scale<br />
Irrigation in Ethiopia, September 1999.<br />
Coelli T., P. Rao, G. Battese. Efficiency<br />
Measurement Using Stochastic Frontiers<br />
(1998)<br />
Croppenstedt A. and M. Abbi (1996). An<br />
Analysis <strong>of</strong> the extent <strong>of</strong> the Technical<br />
Efficiency <strong>of</strong> Farmers Growing Cereals in<br />
Ethiopia: Evidence from three Regions,<br />
Ethiopian Journal <strong>of</strong> Economics, V (1996),<br />
No. I<br />
Debertin L. D. Agricultural Production<br />
Economics. Macmillan Publishing<br />
Company, New York and Collier<br />
Macmillan Publishers, London.<br />
Federal Democratic Republic <strong>of</strong> Ethiopia<br />
(2001). Ethiopia -<strong>Water</strong> Sector Strategy,<br />
2001. -Ministry <strong>of</strong> <strong>Water</strong> Resources,<br />
<strong>Water</strong> Sector Development Programme,<br />
2002-2 016. Irrigation Development<br />
Programme.<br />
Forsund F., K. Lovell, P. Schmidt . A Survey<br />
<strong>of</strong> Frontier Production Functions and <strong>of</strong><br />
their relationship to Efficiency<br />
Measurement, Journal <strong>of</strong> Econometrics,<br />
13 (1980): 5-25<br />
Government <strong>of</strong> the Republic <strong>of</strong> Ethiopia<br />
(2003). Rural Development Policy<br />
Strategies. Ministry <strong>of</strong> Finance and<br />
Economic Development. Economic Policy<br />
and Planning Department. Addis Ababa,<br />
April, 2003.<br />
Greene W.. On the Estimation <strong>of</strong> a Flexible<br />
Frontier Production Model, Journal <strong>of</strong><br />
Econometrics, 13(1980): 101-115<br />
Gujarati N. D. Basic Econometrics (1995),<br />
Third Edition. McGraw-Hill, Inc<br />
Gulilat B.. <strong>Water</strong> Resources Policy and <strong>Water</strong><br />
Code as Related to Irrigated Agriculture<br />
(Summary), 2000.<br />
Hussain I., R. Sakthivadivel, U. Amrasinghe,<br />
M. Mudasser and D. Molden, 2003. Land<br />
and <strong>Water</strong> Productivity <strong>of</strong> Wheat in the<br />
Western Indo-Gangetic Plains <strong>of</strong> India and<br />
Pakistan: A Comparative Analysis.<br />
INTERNATIONAL WATER MANAGEMENT<br />
INSTITUTE, RESEARCH REPORT 65.<br />
Hussain I., M. Mudasser, M. A. Hanjra, U.<br />
Amrasinghe and D. Molden, 2004.<br />
Improving Wheat Productivity in Pakistan:<br />
Econometric Analysis Using Panel Data<br />
from Chaj in the Upper Indus Basin.<br />
<strong>International</strong> <strong>Water</strong> <strong>Management</strong> <strong>Institute</strong>,<br />
Colombo, Sri Lanka<br />
Jondrow J., K. Lovell, I. Materov, P.Schmidt.<br />
On the Estimation <strong>of</strong> Technical<br />
inefficiency in the Stochastic Frontier<br />
Production Function Model, Journal <strong>of</strong><br />
Econometrics, 19(1982): 233-238.<br />
Kamara A.B., B. Van Koppen, L. Magingxa<br />
(2002): Economic Viability <strong>of</strong> small-scale<br />
Irrigation Systems in the Context <strong>of</strong> State<br />
Withdrawal: the Arabie Scheme in the<br />
Northern Province <strong>of</strong> South Africa.<br />
Physics and Chemistry <strong>of</strong> the Earth (2002).<br />
Kloezen W. H. (1998). Measuring Land and<br />
<strong>Water</strong> Productivity in a Mexican Irrigation<br />
District, <strong>Water</strong> Resources Development,<br />
Vol. 14, No 2, pp 231-237, 1998.<br />
Makombe G., M. J.Makadho and R. K.<br />
Sampath (1998). An Analysis <strong>of</strong> the <strong>Water</strong><br />
<strong>Management</strong> Performance <strong>of</strong> smallholder<br />
irrigation schemes in Zimbabwe. Irrigation<br />
and Drainage Systems 12: 253-263, 1998.<br />
Makombe G., R. Meinzen-Dick, S. P. Davies<br />
and R.K. Sampath. An Evaluation <strong>of</strong> Bani<br />
(Dambo) Systems as a Smallholder<br />
Irrigation Development Strategy in<br />
Zimbabwe, Canadian Journal <strong>of</strong><br />
Agricultural Economics, 49 (2001): 203-<br />
216<br />
Ministry <strong>of</strong> <strong>Water</strong> Resources, 2000.<br />
Schmidt P., K. Lovell. Estimating Technical<br />
and Allocative Inefficiency relative to<br />
Stochastic Production and Cost Frontiers,<br />
Journal <strong>of</strong> Econometrics, 9 (1979): 343-<br />
366<br />
Schmidt P., K. Lovell. Estimating Stochastic<br />
Production and cost Frontiers when<br />
Technical and Allocative Inefficiency are<br />
Correlated, Journal <strong>of</strong> Econometrics, 13<br />
(1980): 83-100<br />
Stevenson R.. Likelihood Functions for<br />
Generalized Stochastic Frontier<br />
Estimation, Journal <strong>of</strong> Econometrics,<br />
13(1980)<br />
Sherlund S. M., C. B. Barrett, and A. A.<br />
Adesina. Smallholder Technical Efficiency<br />
with Stochastic Exogenous Production<br />
Conditions, 1998. WP 98-15, Cornell<br />
University.<br />
The Ethiopian Economic Association. Annual<br />
Report on the Ethiopian Economy. I<br />
(1999/2000)<br />
Yusuf K. (2004). Assessment <strong>of</strong> Small Scale<br />
Irrigation Using Comparative Performance<br />
208
Indicators on two Selected Schemes in<br />
Upper Awash River Valley. Msc THESIS,<br />
IRRIGATION ENGINEERING, ALEMAYA<br />
UNIVERSITY.<br />
Worku G., 1999. Technical Efficiency <strong>of</strong><br />
Cereal Producing Farmers: A Comparative<br />
Analysis <strong>of</strong> Own-Operators and Tenants<br />
(The Case <strong>of</strong> Ethiopia). MSc Thesis,<br />
Economics Department, Addis Ababa<br />
University.<br />
209
Impact <strong>of</strong> irrigation on livelihood and food security in the modern Hare river<br />
irrigation scheme in Southern Ethiopia<br />
Judt Christine 1 , Loiskand l Willibald1, Ruffeis Dominik 2 , Hauser Michael 2 ,<br />
Seleshi Bekele 3 , Hagos Fitsum 3<br />
1 University <strong>of</strong> Natural Resources and Applied Life Sciences, Vienna,<br />
2 BOKU Research for Development Forum (DEV-FORUM); Department <strong>of</strong> <strong>Water</strong> - Atmosphere<br />
Environment, <strong>Institute</strong> <strong>of</strong> Hydraulics and Rural <strong>Water</strong> <strong>Management</strong>, Vienna, Austria,<br />
3 <strong>International</strong> <strong>Water</strong> <strong>Management</strong> <strong>Institute</strong><br />
christine_judt@yahoo.com<br />
Abstract<br />
The purpose <strong>of</strong> the undertaken study was to<br />
evaluate the impact that the modern Hare river<br />
irrigation scheme had on household food<br />
security as well as on lifestyle changes <strong>of</strong> the<br />
population in the study site Chano Chalba.<br />
This was done on the basis <strong>of</strong> the FAO food<br />
security pillars access to food, availability <strong>of</strong><br />
food, utilization <strong>of</strong> food and the overall factor<br />
<strong>of</strong> food stability. RRA tools were used to<br />
conduct a before-after comparison, considering<br />
a ten years period. The quantitative data was<br />
analysed using SPSS and/or Excel and simple<br />
statistical measures such as cross tabulations,<br />
frequencies, percentages and means gave a<br />
visible overview <strong>of</strong> the outcomes.<br />
The modern irrigation scheme did not affect<br />
the livelihood and food situation directly but<br />
indirectly through other modernizations that<br />
came with and after the construction <strong>of</strong> the<br />
modern main canal, e.g. road, merchants,<br />
1. Introduction<br />
1.1. Background on food security and<br />
irrigation<br />
In the 1996 Rome Declaration on World Food<br />
Security, food security is defined as “Food that<br />
is available at all times, to which all persons<br />
have means <strong>of</strong> access, that is nutritionally<br />
adequate in terms <strong>of</strong> quantity, quality and<br />
variety, and is acceptable within the given<br />
culture.”<br />
Further, the FAO speaks <strong>of</strong> food security on<br />
household basis when all members <strong>of</strong> a<br />
household can be supplied with sufficient and<br />
adequate food, whether through their own<br />
production or through buying <strong>of</strong> food.<br />
agricultural <strong>of</strong>fice, health centre, drinking<br />
water points, school, electricity etc.<br />
The major trigger was the introduction <strong>of</strong> a<br />
new banana type so that farmers changed from<br />
food crops to cash crops to earn a higher<br />
income. Following, the wealth situation <strong>of</strong> the<br />
population ameliorated but less food crops are<br />
produced and people become more dependent<br />
on the local market. The infrastructure <strong>of</strong> the<br />
study site developed in a positive way but still<br />
education, especially on food issues, are<br />
needed to have a sustainable repercussion and<br />
to secure people’s health and food situation.<br />
Further positive changes on the food situation<br />
could be able if the higher income was utilized<br />
more efficiently and if the construction <strong>of</strong> the<br />
modern irrigation scheme had been more<br />
appropriate and by incorporating the farmer’s<br />
requests.<br />
Key-words: poverty, irrigation, livelihood,<br />
food security<br />
According to the Aggregate Household<br />
Food Security Index (AHFSI) 18 ,<br />
established by the FAO (1995), Ethiopia<br />
had an index below 65, i.e. critical food<br />
security status, between 1991 and 1993.<br />
18 .The AHFSI calculates the "food gap" between the<br />
undernourished and average national requirements, the<br />
instability <strong>of</strong> the annual food supply and the proportion <strong>of</strong><br />
undernourished in the total population. The index ranges<br />
from 0 to 100, with 100 representing complete, risk-free<br />
food security and zero, total famine (FAO, 1995).<br />
210
In Ethiopia, irrigation has a long tradition<br />
(Kloos, 1990). One <strong>of</strong> the main targets <strong>of</strong><br />
irrigation systems is to fortunate agricultural<br />
production in qualitative as well as in<br />
quantitative meaning (Mengistu, 2003).<br />
Harvests shall be enlarged so that people either<br />
produce enough food for the non-harvest time<br />
or to sell their overproduction and earn some<br />
money to buy food. Another opportunity to<br />
produce more food crops is irrigated<br />
gardening, an activity mainly done by women.<br />
In Ethiopia, there has been a revival <strong>of</strong><br />
irrigation during the last decades in order to<br />
enhance rural development and food security<br />
(FAO/WFP, 2006). Given that 85 percent <strong>of</strong><br />
the people are employed in agriculture<br />
(Mengistu, 2003), developing this sector could<br />
help to reduce poverty and enhance food<br />
security <strong>of</strong> the majority <strong>of</strong> the Ethiopian<br />
people.<br />
As Lankford (2003) argues there must be a<br />
positive balance <strong>of</strong> benefits against risks and<br />
costs <strong>of</strong> irrigation. A more secure and<br />
increased crop productivity, improved<br />
planning and timing <strong>of</strong> start <strong>of</strong> the cropping<br />
season and extended harvest season, raised<br />
number <strong>of</strong> jobs and income are some knock-on<br />
effects that show how irrigation facilitates<br />
economic transactions and improves<br />
livelihoods and the wealth and infrastructure <strong>of</strong><br />
whole villages (Lankford, 2003).<br />
1.2. Irrigation and food security in<br />
Ethiopia<br />
Case studies undertaken by Thompson (1991),<br />
Lall and Broadway (1994) and Adem (2001)<br />
already highlighted the positive impacts <strong>of</strong><br />
enhanced accessibility to water for irrigation.<br />
Besides an extended growing period, a higher<br />
variety in food and cash crops and, as a result,<br />
an increase <strong>of</strong> cash income, food shortages<br />
could be reduced. Nearby, the target<br />
communities improved the infrastructure <strong>of</strong><br />
their village and standard <strong>of</strong> living in general.<br />
Negative impacts <strong>of</strong> the projects were over<br />
watering <strong>of</strong> some fields, overproduction <strong>of</strong><br />
certain crops and competition for water from<br />
nearby communities.<br />
Kennedy et al. (1992) compared the effects <strong>of</strong><br />
cash crop schemes on health and nutrition in<br />
six countries. They concluded that “increases<br />
in income have to be accompanied by<br />
improvements in the health environment in<br />
order to have a significant effect in reducing<br />
preschooler morbidity and improving child<br />
nutritional status.”<br />
Among the reasons for negative impacts were<br />
reduction in the household’s production <strong>of</strong><br />
food crops, increased food prices, loss <strong>of</strong><br />
household access to land due to changing<br />
tenure relations and household expenditure<br />
patterns favouring durable consumer goods.<br />
1.3. Statement <strong>of</strong> the problem<br />
High reliance <strong>of</strong> the people on their own food<br />
production has a direct impact on local food<br />
availability and on accessibility. Some coping<br />
strategies, which are eroding the household<br />
asset base, are used by the most vulnerable<br />
population to survive (FAO/WFP 2006).<br />
As IFAD stated in 2005, irrigation has the<br />
potential to reduce food insecurity by several<br />
factors. “For the farmer, the soils, crops,<br />
livestock, weather, water, nutrients, pests,<br />
markets, income, outgoings, shelter, transport,<br />
fuel, property, family and social networks, and<br />
much more, all form part <strong>of</strong> the integrated<br />
environment in which he or she makes a<br />
livelihood. Improving food security through<br />
irrigation affects or is affected by each <strong>of</strong> these<br />
aspects. A major challenge is to design<br />
meaningful integrated solutions to the real<br />
problems faced by farmers” (IFAD, 2005).<br />
Therefore the consequences <strong>of</strong> irrigation<br />
systems both positive and negative have to be<br />
assessed so that policy makers, government<br />
and other NGOs can react and, finally, burst<br />
the vicious circle <strong>of</strong> poverty and enhance food<br />
security.<br />
1.4. Objectives <strong>of</strong> the study<br />
As irrigation development is <strong>of</strong>ten associated<br />
with cash crops, irrigation investments’<br />
contribution to food security is <strong>of</strong>ten<br />
questioned. This study gives, among other<br />
things, an answer to this question, in case <strong>of</strong><br />
Chano Chalba and the modern Hare river<br />
irrigation scheme.<br />
It is figured out how the modern irrigation<br />
canal changed the agricultural production and<br />
livestock holdings/population, income sources<br />
and expenditures, health situation, hygienic<br />
standards, market situation, lifestyle <strong>of</strong> the<br />
households and the infrastructure <strong>of</strong> the study<br />
site.<br />
211
For the purpose <strong>of</strong> investigating the<br />
perceptions <strong>of</strong> household food security, the<br />
research focused on the four dimensions <strong>of</strong><br />
food security: availability <strong>of</strong> food, access to<br />
food, utilization <strong>of</strong> food and the overall factor<br />
<strong>of</strong> food stability.<br />
Following, the established hypothesis<br />
concerning the four dimensions <strong>of</strong> food<br />
security,<br />
were:<br />
1. Availability:<br />
Since the modern irrigation scheme was introduced, households have a better and<br />
more sustainable availability to food than before (whether through their own<br />
production and/or buying).<br />
2. Access: The access to food and other assets are better developed today compared to ten<br />
years ago. (markets are better available; enough money to buy food)<br />
Since the construction <strong>of</strong> the modern canal, people have a more varying and<br />
balanced diet.<br />
3. Utilization:<br />
Since the construction <strong>of</strong> the modern canal, people have more time for cooking<br />
and education thus people have a better knowledge <strong>of</strong> a balanced diet and related<br />
effects.<br />
Since the construction <strong>of</strong> the modern canal, people have more meals a day, are not<br />
restricted in the choice <strong>of</strong> their food, and are healthier and physically stronger.<br />
4. Stability: The food security situation is more solid and <strong>of</strong>fers more stability throughout the<br />
year and periods <strong>of</strong> stresses, shocks and in terms <strong>of</strong> seasonality.<br />
In concrete, the results <strong>of</strong> this case study<br />
provide an insight <strong>of</strong> the impacts that the<br />
modern Hare irrigation scheme has primarily<br />
on household food-security but also on the<br />
environment, economy and society. It<br />
contributes to the project “Impact <strong>of</strong> Irrigation<br />
Development on Rural Poverty and<br />
Environment”, coordinated by the <strong>International</strong><br />
<strong>Water</strong> <strong>Management</strong> <strong>Institute</strong> (IWMI), the<br />
University <strong>of</strong> Natural Resources and Applied<br />
Life Sciences Vienna (BOKU) and ARC<br />
Seibersdorf Research in association with the<br />
BOKU Research for Development Forum<br />
(DEV-FORUM).<br />
The externalities shall also be valuable for<br />
other researchers and stakeholders and<br />
influence the thinking on approaches to<br />
irrigation development. The concerned<br />
population gets a better view <strong>of</strong> their present<br />
situation, impact <strong>of</strong> outside interventions on<br />
their livelihoods and consequently are enabled<br />
to make better-informed decisions about their<br />
future livelihood strategies.<br />
Thus the study focused only on the named<br />
study site, the gained results are just valid at<br />
local level and cannot be generalized to a<br />
larger population.<br />
2. Description <strong>of</strong> the study area<br />
2.1. General description <strong>of</strong> the<br />
country<br />
Ethiopia is a landlocked country in the horn <strong>of</strong><br />
Africa. It comprehends 1 120 000 square<br />
kilometres total land area, where<strong>of</strong> 8 percent<br />
are farmed by smallholder peasants and about<br />
3 100 000 hectares are fallow. The total area <strong>of</strong><br />
grazing and browse is estimated to be up to<br />
65 000 000 hectares, <strong>of</strong> which 12 percent is in<br />
mixed faming, the rest in pastoral areas (MoA,<br />
2000 as cited by Mengistu, 2003).<br />
Agriculture plays a central role in economic<br />
and social life. It is the leading sector in<br />
national economy, composing 40 – 50 percent<br />
<strong>of</strong> GDP and around 90 percent <strong>of</strong> export<br />
earnings. About 6 million people are<br />
chronically food insecure and depend on food<br />
aid throughout the year, another 10 million are<br />
considered as vulnerable (FAO/WFP, 2006).<br />
Subsistence agriculture is almost entirely rain<br />
fed and yields are generally low. The existing<br />
irrigation potential is far from being reached<br />
(Mengistu, 2003).<br />
The population is estimated to 76.5 million<br />
(World Bank, 2007) and is growing rapidly,<br />
with about 2.9 percent annually (Kebede,<br />
2003).<br />
38 percent <strong>of</strong> the population are underweight,<br />
another 47 percent stunted. Infant mortality<br />
rate is 107 per 1000, 47 percent <strong>of</strong> children<br />
212
aged under five are malnourished and 10.5<br />
percent affected by wasting (FAO/WFP,<br />
2006).<br />
2.2. Description <strong>of</strong> the study site 19<br />
2.2.1. Location <strong>of</strong> the study site and the<br />
modern irrigation scheme<br />
Chano Chalba is a Peasants Association that<br />
lies in the SNNPR, Gamo G<strong>of</strong>a Zone, in the<br />
South <strong>of</strong> Ethiopia. Hare River is one <strong>of</strong> the<br />
four main rivers draining to the nearby located<br />
Lake Abaya.<br />
The Hare irrigation scheme comprises a total<br />
irrigable area <strong>of</strong> 2224 ha and there exist three<br />
different irrigation schemes. In Chano Chalba,<br />
the modern Hare right side irrigation scheme is<br />
used (Bantero, 2006). The community has a<br />
common diversion weir with the neighboring<br />
Kebele Chano Mile. This weir is located next<br />
to the asphalt road, leading both to Addis<br />
Abeba and Arba Minch.<br />
2.2.2. Climate<br />
Chano Chalba, lying in the lowlands at 1169 m<br />
a.s.l. near to Arba Minch, has a tropical<br />
climate with maximum and minimum<br />
temperatures between 30.3°C and 17.4°C,<br />
respectively.<br />
February and March are the hottest months<br />
with rare rainfall, while June to August and<br />
November to January are more moderate with<br />
higher precipitation. The monthly average<br />
rainfall recorded from 1970 to 2006 at the<br />
Arba Minch Farm and Arba Minch University<br />
station is in total 829.3 mm, respectively<br />
(Bantero, 2006).<br />
2.2.3. Soil fertility<br />
Along the modern irrigation canal in Chano<br />
Chalba, soil is sandy at the head <strong>of</strong> the modern<br />
main canal where soil fertility is poor. In the<br />
middle parts, there is loam and soil fertility is<br />
very good. At the tail <strong>of</strong> the canal, people<br />
brought soil from another place to increase soil<br />
fertility. Beside this soil, there exists silty loam<br />
19 During the realisation <strong>of</strong> this study, rare data on<br />
the study site were available. Therefore, the<br />
information given in the chapter “Description <strong>of</strong> the<br />
study area” is based on the statements from key<br />
informant interviews and group discussions.<br />
and soil fertility is also good (Agricultural<br />
Office, 2007).<br />
2.2.4. Farming system and cropping<br />
season<br />
From February to May, food crops (e.g. maize,<br />
sweet potato) are planted while cash crops are<br />
both planted and harvested. During the<br />
summer months, from June to September, food<br />
crops are harvested and, as it is rainy season,<br />
cash crops are also planted and harvested.<br />
From November to January, when it is dry<br />
season and the most critical time during the<br />
year, there are no agricultural activities<br />
undertaken (Agricultural Office, 2007).<br />
The more recently introduced cash crops<br />
banana, mango, avocado and papaya have the<br />
advantage that they have to be planted only<br />
once (trees!). From then on, they are less time<br />
consuming because weeding is not that<br />
important compared to sweet potato or maize.<br />
Moreover, these cash crops, especially the<br />
banana, can be harvested nearly every two<br />
months depending on the effort the farmer has<br />
taken.<br />
2.2.5. Land holdings and distribution<br />
Chano Chalba comprises a total area <strong>of</strong> 799 ha<br />
<strong>of</strong> which 649 ha are cultivated, in average<br />
landholdings from 0.5 to 3.50 ha. 199 ha are<br />
cropped annual, 450 ha perennial, and all <strong>of</strong><br />
the agricultural land is irrigated. Forests cover<br />
40 ha, grassland 20 ha and 90 ha are occupied<br />
by others (Bantero, 2006).<br />
Because <strong>of</strong> the high population growth, the<br />
resettlement and return <strong>of</strong> soldiers, land<br />
holdings became smaller compared to former<br />
times and it is not possible to increase the land<br />
size. The only possibility is to rent land from<br />
poor people, their way to increase cash income<br />
(Group discussion, 2007).<br />
2.2.6. Population and family<br />
constitution<br />
As already mentioned, Ethiopia’s population is<br />
growing rapidly. In Chano Chalba, a total<br />
population <strong>of</strong> 2980 people was recorded in<br />
1988 and increased to 6200 inhabitants in 2005<br />
(Catholic Church Mission, 1988; Agricultural<br />
Office, 2007). Households increased from 445<br />
in 1998 up to 732 households in 2005<br />
(Agricultural Office, 2007).<br />
213
The interviewed households consisted in<br />
average <strong>of</strong> 8.5 members.<br />
2.2.7. Problems and advantages <strong>of</strong> the<br />
modern irrigation scheme<br />
The modern irrigation system was built up and<br />
paid by the Chinese Government in<br />
cooperation with the Ethiopian Government.<br />
Main purpose <strong>of</strong> its construction was to<br />
increase the amount <strong>of</strong> irrigation water,<br />
enhance cash crop (cotton) and food crop<br />
(beetroot) production and to decrease water<br />
losses (Agricultural Office, 2007; Belete,<br />
2006).<br />
During the construction, there was a<br />
disagreement between the Ethiopian and<br />
Chinese Government because the Chinese did<br />
not build the main canal the way the<br />
Ethiopians wanted so the Ethiopian<br />
Government redrew every responsibility for<br />
the project. However, the Ministry <strong>of</strong><br />
Agriculture brought the material to construct<br />
also modern field canals but unfortunately the<br />
Chinese had already stopped before the main<br />
canal was finished.<br />
Although the modern canal led to a lot <strong>of</strong><br />
advantages, one <strong>of</strong> the main objectives <strong>of</strong> the<br />
construction has failed because water loss is<br />
still a problem. Moreover, increased water<br />
usage by farmers and salinity are constraints<br />
for adequate irrigation practices.<br />
At the head <strong>of</strong> the modern canal, the field<br />
canals break when there is too much water,<br />
especially during rainy season. In the middle,<br />
the canal is lower than the fields and if there is<br />
not enough water in the canal, people cannot<br />
irrigate their fields. The construction <strong>of</strong> a dam<br />
is seen as solution to this problem. Further<br />
problems in this part <strong>of</strong> the canal are siltation<br />
and damage by farmers.<br />
One <strong>of</strong> the main advantages <strong>of</strong> the concrete<br />
canal is its robustness. Digging the destroyed<br />
and blocked canals (e.g. after heavy rains)<br />
again and again to make the water flow was a<br />
time consuming activity. Besides, if the water<br />
was standing too long, people as well as<br />
livestock that drank from that water became ill<br />
easily. Unfortunately, the field canals are still<br />
traditional.<br />
3. Methodology<br />
3.1. Sampling procedure<br />
Purposive sampling was used to examine the<br />
impacts the modern irrigation canal had all<br />
over its longitude. Indicators for the sampling<br />
were the household’s wealth situation, average<br />
size <strong>of</strong> land holdings, and the use <strong>of</strong> both the<br />
modern scheme today and the traditional<br />
before, so that the changes <strong>of</strong> a ten years<br />
period could be deducted. The sampling<br />
included 9 households each from the head and<br />
tail <strong>of</strong> the main canal while 11 are from the<br />
middle (<strong>Table</strong> 1). The difference <strong>of</strong> two more<br />
in the middle is a result <strong>of</strong> the unreliable<br />
sampling procedure <strong>of</strong> the Kebele <strong>of</strong>ficer that<br />
the researcher faced in the beginning.<br />
<strong>Table</strong> 1: Sampling scheme <strong>of</strong> households for household interviews<br />
Location <strong>of</strong> main<br />
farmland<br />
Head Middle Tail<br />
Wealth Category <strong>of</strong><br />
HH<br />
3 R 3 A 3 P 4 R 3 A 4 P 3 R 3 A 3 P<br />
Total HH interviewed 29<br />
3.2. Data collection methods<br />
observation, transect walks and questionnaires<br />
from the selected households.<br />
Maps and timelines were established in<br />
Due to time and finance limitations but to get cooperation with the participants and gave a<br />
reliable in-depth information, rapid rural visible overview about the construction <strong>of</strong> the<br />
appraisal tools were used.<br />
modern irrigation canal, availability <strong>of</strong><br />
Primary data was collected from key irrigation water throughout the year and<br />
informants, local people, focus groups, experts, agricultural practices.<br />
214
Rankings accompanied the household<br />
interviews and were used to evaluate<br />
preferences or importance <strong>of</strong> main crops<br />
planted, income sources and expenditures.<br />
Secondary data was obtained by<br />
comprehensive literature review and from<br />
<strong>of</strong>fices operating in the area, to get the<br />
necessary data on agricultural production data<br />
and market prices.<br />
3.3. Data management and analysis<br />
The collected data was recorded in a laptop to<br />
avoid data loss. Descriptive data was coded<br />
and analysed in the light <strong>of</strong> the literature<br />
reviews. Quantitative data was introduced into<br />
SPSS and/or Excel and simple statistical<br />
measures such as cross tabulations,<br />
frequencies, percentages and means were used<br />
to reduce the volume <strong>of</strong> data, making it easier<br />
to understand.<br />
4. Results and discussion<br />
4.1. Availability <strong>of</strong> food<br />
4.1.1. Agricultural practices: From<br />
food crops to cash crops<br />
Cropping patterns changed definitively since<br />
the modern irrigation system was built and<br />
since the Kebele got its own Agricultural<br />
Office in 1996 that introduced a new banana<br />
type (Asmara banana) in order to increase<br />
farmer’s income and to improve their<br />
livelihoods.<br />
This banana tree is smaller, easier to plant and<br />
harvest and harvest-outputs are higher; it needs<br />
less treatment thus is less labour- and timeconsuming.<br />
The linear form <strong>of</strong> the fruit makes<br />
it better transportable than the “older” banana<br />
type (Hawesh banana). The only disadvantage<br />
<strong>of</strong> the Asmara banana compared to the<br />
Hawesha banana is its higher water demand.<br />
In former times, farmers were mainly planting<br />
food crops (maize, teff, sweet potato, beetroot)<br />
for their own consumption as well as cotton as<br />
cash crop. In the meantime, nearly all <strong>of</strong> the<br />
farmers changed totally to cash crop<br />
production (banana, mango, avocado), defined<br />
as crops that are mainly planted for selling.<br />
Some <strong>of</strong> the farmers still have a little piece <strong>of</strong><br />
land where they plant at least some food crops<br />
for the household’s own consumption while<br />
others divide their plot into different parts to<br />
plant on one half cash crops and on the other<br />
half food crops.<br />
Data from the Agricultural Office in Chano<br />
Chalba showed the increase in production both<br />
<strong>of</strong> cash crops and food crops during the last ten<br />
years. The increase in food crops is explained<br />
with the growing population size, the higher<br />
cash crop production by the shift to<br />
monoculture <strong>of</strong> banana and mango.<br />
According to the statement above, the situation<br />
<strong>of</strong> food produced by the households for their<br />
own consumption was better in the past. At the<br />
time this study was carried out, cash crops<br />
supplied the households with the necessary<br />
money to buy food from the markets.<br />
The magnitude <strong>of</strong> the shift to cash crop banana<br />
is also shown in <strong>Table</strong> 2 below. For 27 <strong>of</strong> the<br />
29 interviewed farmers (93.1%), banana is the<br />
most important crop today. On second rank<br />
comes maize (13 people, 44.8%), followed by<br />
the recently introduced cash crop mango (8<br />
people, 27.6%).<br />
215
<strong>Table</strong> 2: Importance ranking <strong>of</strong> crops (CC = cash crops; FC = food crops); first three ranks<br />
Rank Today Before<br />
Maize Mango Cotton<br />
Banana<br />
1<br />
(FC) (CC) (CC)<br />
(CC) 93.1%<br />
44.8% 27.6% 37.9%<br />
2<br />
3<br />
Maize<br />
(FC)<br />
44.8%<br />
Mango<br />
(CC)<br />
27.6%<br />
Sweet<br />
potato (FC)<br />
17.2%<br />
Cotton (CC), Sweet potato (FC), Maize<br />
(FC)<br />
Each 20.7%<br />
Source: Household interviews/rankings, 2007.<br />
Sweet<br />
potato (FC)<br />
37.9%<br />
Maize<br />
(FC)<br />
34.5%<br />
Maize<br />
(FC)<br />
27.6%<br />
Cotton (CC)<br />
20.7%<br />
Sweet<br />
potato (FC)<br />
27.6%<br />
Sweet<br />
potato (FC)<br />
10.3%<br />
Maize<br />
(FC)<br />
17.2%<br />
Cotton (CC)<br />
24.1%<br />
Concerning the diversity <strong>of</strong> crops being grown,<br />
there is less different kind <strong>of</strong> food crops but<br />
more different kind <strong>of</strong> cash crops grown on the<br />
main field today.<br />
In average, farmers are planting 2.14 different<br />
kinds <strong>of</strong> food crops and 2.21 cash crops today,<br />
compared to 2.52 food crops and 1.72 cash<br />
crops before.<br />
Reason number one for the change to mono<br />
cropping is the higher income farmers get from<br />
the recently introduced cash crops banana and<br />
mango. Although the new banana type needs<br />
more water, it seems to be more resistant<br />
against drought, compared to maize.<br />
Moreover, food crops do not grow properly<br />
next to the big banana trees that consume all <strong>of</strong><br />
the water and give a big shadow.<br />
Other recently introduced fruit trees, especially<br />
mango but also papaya, already show to be a<br />
big success, not like the attempt <strong>of</strong> a local<br />
cereal called “Taleba” where soil-fertility did<br />
not fit and the crop was abolished soon.<br />
Since the farm size <strong>of</strong> the households has<br />
decreased, people have to make a more precise<br />
choice on what to grow thus food crops have<br />
declined for the benefit <strong>of</strong> cash crops and the<br />
related higher income.<br />
More detailed, 14 farmers (48.3%) use more, 9<br />
(31%) less and 6 (20.7%) the same space on<br />
their plot to grow cash crops today.<br />
4.1.2. Practices to keep soil fertility<br />
People had another cropping pattern before the<br />
modern canal was constructed. They changed<br />
the crops on the field or even left a part fallow<br />
so that it could regenerate; livestock was hold<br />
close to the fields and its dung was used as a<br />
natural fertilizer.<br />
Since changing to mono cropping banana, soil<br />
is loosing steadily its fertility (Agricultural<br />
Office, 2007). Furthermore, the farmers are not<br />
familiar with the use <strong>of</strong> industrial fertilizer and<br />
have little knowledge and practice. The<br />
attempt <strong>of</strong> the Agricultural Office (1994) to<br />
keep soil fertility by applying chemical<br />
fertilizer was abolished soon because <strong>of</strong> the<br />
high costs and the bad introduction and<br />
performance (Agricultural Office, 2007).<br />
Instead, the Agricultural Office started recently<br />
to give lessons on generating compost. While<br />
it was only 9 farmers out <strong>of</strong> 29 (31%) who<br />
were using organic fertilizer before, the<br />
number increased to 24 (82.8%) who started to<br />
use compost recently to keep and increase soil<br />
fertility.<br />
4.1.3. Use and practices <strong>of</strong> irrigation water<br />
Farmers in Chano Chalba were irrigating with<br />
a traditional system since long time ago.<br />
Today, all farmers in Chano Chalba are<br />
irrigating both their main field and garden.<br />
Regarding the irrigation time, the Head <strong>of</strong><br />
<strong>Water</strong> User Association who is in charge with<br />
coordinating the irrigation scheme, allows the<br />
farmers to irrigate two or three times a year but<br />
irrigation time also depends on soil type, crop<br />
type and on the weather conditions.<br />
From the 29 interviewed people, 25 (92.6%)<br />
are irrigating temporary, i.e. two to maximum<br />
four times during the year, and 2 persons<br />
(7.4%) use the irrigation water for their crops<br />
all over the year. No further explanations were<br />
given to explain this case.<br />
216
By contrast, ten years ago it was 15 farmers<br />
(57.7%) who irrigated temporary while 11<br />
(42.3%) irrigated all over the year.<br />
One <strong>of</strong> the main purposes <strong>of</strong> irrigation is to<br />
increase the agricultural production. But in<br />
case <strong>of</strong> Chano Chalba it is difficult to compare<br />
the different crop types and, comparing the<br />
information with the data given by the<br />
Agricultural Office it is hard to believe that<br />
half <strong>of</strong> the people stated that their harvest has<br />
decreased compared to ten years ago.<br />
It is more reasonable and believable that 25 <strong>of</strong><br />
the interviewees (86.2%) claimed that their<br />
agricultural production is still influenced by<br />
lack <strong>of</strong> rain.<br />
4.1.4. Storage <strong>of</strong> food crops and cash crops<br />
In the past, when people were mainly growing<br />
maize as food crop, they stored the harvest in a<br />
barn next to the house. Today, the cash crops<br />
banana and mango are usually sold directly to<br />
the merchants and the small amount <strong>of</strong> maize<br />
farmers still plant is <strong>of</strong>ten not necessary to<br />
store. While all <strong>of</strong> the 29 interviewed farmers<br />
had stocks ten years ago, it is only 16 (55.2%)<br />
today. From the ones who still have maize<br />
stocks today, 7 (24.1%) said that their reserves<br />
last longer, 8 (27.6%) shorter and for 1 farmer<br />
(3.4%) it remained the same.<br />
4.1.5 Home gardens<br />
The importance <strong>of</strong> the home gardens lies on<br />
the bigger variety <strong>of</strong> food for the household’s<br />
consumption and for women to get their own<br />
income by selling the surplus <strong>of</strong> these crops.<br />
In the study site, only 15 (51.7%) <strong>of</strong> the 29<br />
interviewed households had a home garden ten<br />
years ago while everyone (100%) is in<br />
possession <strong>of</strong> one today. One <strong>of</strong> the reasons is<br />
that their fields were nearer to their houses, so<br />
they did not need a garden but planted their<br />
food crops directly on the field.<br />
Concerning the above mentioned diversity <strong>of</strong><br />
food, farmers are planting 4.43 different crop<br />
types, mainly food crops, in their gardens<br />
today. Ten years ago, the 15 households who<br />
had a garden had only 1.46 different food<br />
crops.<br />
According to this result, the people have a<br />
bigger choice in food, especially in fruits like<br />
mango, avocado, papaya, and can enrich their<br />
diet above all with micro-nutrients like<br />
vitamins and minerals. The left-over is sold by<br />
the women and girls on the local market or on<br />
the street to earn some money that they can<br />
manage themselves.<br />
4.1.6. Livestock<br />
In Chano Chalba, oxen, cows, goats, chicken,<br />
donkeys and sheep are and were kept as cattle.<br />
Livestock is generally a household asset and<br />
needed to overcome periods <strong>of</strong> food shortages.<br />
Therefore, it is usually used for the households<br />
own consumption and only in certain cases,<br />
mainly from wealthier farmers, sold.<br />
Meat, eggs, milk and butter are incorporated in<br />
the daily diary but not consumed <strong>of</strong>ten. Milk is<br />
known to be healthy and therefore saved for<br />
young children and pregnant or lactating<br />
women.<br />
The given data on livestock changes are<br />
controversial. According to the information <strong>of</strong><br />
the Agricultural Office <strong>of</strong> the Kebele, livestock<br />
population on household basis doubled since<br />
1997. But 24 (82.8%) <strong>of</strong> the 29 interviewed<br />
people claimed that they have less livestock<br />
today compared to ten years ago.<br />
The reason for the decrease <strong>of</strong> livestock has<br />
nothing to do with the construction <strong>of</strong> the<br />
modern canal but is a problem <strong>of</strong> the small<br />
landholdings and the high population density.<br />
Thus, the cattle have to be brought to the<br />
highlands or near to the lake while ten years<br />
ago there was enough space near to the fields<br />
and the cattle’s dung was used as natural<br />
fertilizer.<br />
Moreover, most <strong>of</strong> the animals died because <strong>of</strong><br />
the sleeping-sickness that is transfused by the<br />
tse-tse-fly. That problem was removed five<br />
years ago when they got nylon nets that caught<br />
and killed the flies. Furthermore, the<br />
Agricultural Office started with livestock<br />
vaccinations in Chano Chalba once a week.<br />
Thus people have less livestock, the<br />
availability <strong>of</strong> livestock products like butter,<br />
milk, cheese and meat has declined. Prices at<br />
the market are considered as too expensive so<br />
there is less diversity <strong>of</strong> animal products,<br />
especially in proteins, in their diet.<br />
4.1.7. Income and expenditures<br />
As can be seen from Figure 1, the wealth<br />
situation <strong>of</strong> the Kebele developed in a positive<br />
217
way. There are more “richer” and “average”<br />
households today while the category “poor”<br />
decreased.<br />
Figure 1: Development <strong>of</strong> wealth categories in Chano Chalba, 1995-2006<br />
Wealth Categories in Chano Chalba<br />
Rich Average Poor<br />
% Wealth Category<br />
100%<br />
80%<br />
60%<br />
40%<br />
20%<br />
0%<br />
89%<br />
52%<br />
38%<br />
6%<br />
5%<br />
10%<br />
1995 1996 1997 1998 1999 2000 2001 2002 2003 2004 2005 2006<br />
Year<br />
Source: Agricultural Office, February 2007.<br />
• Income<br />
Since ever, cash crops were seen as main<br />
source <strong>of</strong> income in Chano Chalba. Due to the<br />
shift to cash crops, people have a higher and<br />
more constant income today, although the<br />
number <strong>of</strong> different income sources decreased<br />
significantly from 3.17 to 2.24.<br />
Selling <strong>of</strong> home made talla, arake or honey,<br />
income sources ten years ago, is considered as<br />
less important today. The production has<br />
decreased for both selling and own<br />
consumption. Reasons for the abandonment <strong>of</strong><br />
beehives, was spraying <strong>of</strong> DDT several years<br />
ago to kill the mosquitoes that transmit malaria<br />
but also displaced the bees.<br />
• Expenditures<br />
Income from cash crops is generally managed<br />
by the male household head, mostly in<br />
accordance with his wife. In female headed<br />
households it is the women who decided how<br />
to spend the income.<br />
Generally, people spend more money on food<br />
purchase, housing, education and medical<br />
expenses today than ten years ago while<br />
expenditures on clothes as well as<br />
governmental taxes play a minor role. Since<br />
electricity came recently, it was not <strong>of</strong><br />
importance in the ranking ten years ago,<br />
neither expenses on mobiles, television and<br />
else.<br />
218
Figure 2: Importance ranking <strong>of</strong> expenditures; (mentioned most <strong>of</strong>ten on rank 1 to 3)<br />
Most important expenditures<br />
before<br />
today<br />
25<br />
20<br />
15<br />
10<br />
5<br />
0<br />
housing<br />
food<br />
medicine<br />
livestock<br />
vaccination<br />
group<br />
payments<br />
car,<br />
television,<br />
radio<br />
Frequency<br />
Source: Household interviews/ranking, 2007.<br />
The result that most <strong>of</strong> the people placed<br />
housing on first rank is connected with the fact<br />
that people were <strong>of</strong>ten moved to another place<br />
<strong>of</strong> the Kebele during the resettlement and that<br />
they could afford iron sheet ro<strong>of</strong>s instead <strong>of</strong><br />
grass ro<strong>of</strong>s because <strong>of</strong> their higher income<br />
from the cash crops. Housing is seen as a big<br />
and important investment that is only made<br />
once. Some also put it on first place because it<br />
was an expenditure <strong>of</strong> a high amount <strong>of</strong> money<br />
that they had saved for a long time for exactly<br />
that purpose.<br />
When asking whether the households spend<br />
more, less or the same amount <strong>of</strong> their income<br />
to purchase food today, the answers were as<br />
shown in <strong>Table</strong> 3: Money spent on food<br />
purchase, today compared to ten years ago<br />
<strong>Table</strong> 3: Money spent on food purchase,<br />
today compared to ten years ago<br />
Answer Frequency %<br />
More 24 82.8<br />
Less 4 13.8<br />
Same 1 3.4<br />
Source: Household interviews, 2007.<br />
The reason for the bigger amount spent on<br />
food purchase is first because people have less<br />
food crops and livestock, thus they produce<br />
less themselves to eat, and second that food<br />
prices are higher today. That stands in relation<br />
with each other because if there are more<br />
people who need to buy food from the market<br />
but less who sell their food crops there, the<br />
competition is higher and following prices on<br />
the markets increase.<br />
When people spent money on food purchase<br />
ten years ago, it was because they wanted a<br />
bigger variety. They bought food they did not<br />
produce themselves but that were considered<br />
as healthy, like peas and beans. Others, on the<br />
contrary, just bought salt and oil. Today people<br />
do not have enough food crops so they need to<br />
buy even part <strong>of</strong> their staple food.<br />
4.2. Access to food<br />
4.2.6. General changes in the Kebele’s<br />
infrastructure<br />
The infrastructure developed to a great extent<br />
since the modern irrigation system was<br />
constructed and brought a lot <strong>of</strong> benefits to the<br />
Kebele: the Agricultural Office, the Health<br />
Centre, a road, electricity, the school, a<br />
telephone station, potable water points, flour<br />
mills, etc. The money for these improvements<br />
was provided both by the Government and the<br />
inhabitants <strong>of</strong> Chano Chalba.<br />
Farmers consider the road as most important<br />
innovation because it made the access to the<br />
markets easier, merchants came from Addis<br />
Ababa and people could sell their crops. That<br />
is underlined by the 15 people (53.6%) who<br />
abnegated that they would have got the same<br />
219
income from cash crops ten years ago while 5<br />
people (17.2%) answered in the affirmative<br />
and 8 (28.6%) could not give an answer.<br />
Explanations when abnegating never included<br />
the irrigation scheme but the lack <strong>of</strong><br />
knowledge about the value <strong>of</strong> the bananas and<br />
the absence <strong>of</strong> the road, thus the missing<br />
merchants.<br />
4.2.7. Markets and market prices<br />
Chano Market takes place every Monday and<br />
is the most important market for the people <strong>of</strong><br />
Chano Chalba. People are coming from the<br />
surrounding Kebeles (Chano Mile, Chano<br />
Dorga, Kola Shara), the highlands (Dorze,<br />
Chencha), Arba Minch and from Lante, to<br />
participate in this social event.<br />
The next bigger market people tend to go is in<br />
Arba Minch, a 2 hours walk, while the<br />
preferred Chano Market is reached within half<br />
an hour by all the inhabitants.<br />
The better transportation system to<br />
surrounding villages is connected to the new<br />
road because people could catch one <strong>of</strong> the<br />
minibuses that cruised between Lante and<br />
Arba Minch if they had the necessary money.<br />
Although there is more food available on the<br />
markets today, both in quantity and quality, it<br />
is also a fact that people get less food for the<br />
same amount <strong>of</strong> money.<br />
Data on retail prices at Arba Minch from 1996<br />
until 2005 were looked up on the most<br />
important foodstuffs and show the steady<br />
increase.<br />
4.3. Utilization <strong>of</strong> food<br />
4.3.6. Local food<br />
Ethiopia is famous for “enjera”, a flat, pancake<br />
like bread made from teff. Enjera is eaten with<br />
different kind <strong>of</strong> sauces, that consist,<br />
depending if fasting day or not, in meat or<br />
vegetables.<br />
The situation is different in Chano Chalba.<br />
There, maize is staple food and they usually<br />
make the local bread, or other dishes like<br />
porridge, from it. Because <strong>of</strong> the higher price,<br />
enjera made from teff is mostly eaten for<br />
holidays, when people afford “better” food.<br />
“Halakko”, moringa stenopetala, grows in<br />
nearly every garden and contributes a lot to the<br />
daily diet. Although it is not among the most<br />
preferred dishes <strong>of</strong> the people it is eaten up to<br />
2 or 3 times a day. Moringa stenopetala is<br />
related to the moringa oleifera which has its<br />
origin in the North <strong>of</strong> the Himalaya and was<br />
already used as a nutritious supplement by old<br />
traditional healers in Asia and Africa to help<br />
sickly people. The fruits contain important<br />
minerals, vitamins, amino acids and enzymes.<br />
It has sufficient amounts <strong>of</strong> iron, zinc and<br />
copper as well as 17 to 18 amino acids that are<br />
the most important components for the<br />
construction <strong>of</strong> proteins and the immune<br />
system (Schulz, 2006).<br />
Studies in Senegal, Malawi and Tanzania<br />
confirmed its positive effect on child growth<br />
when consumed regularly and it was diagnosed<br />
that it decreased the proneness to coldinfections,<br />
worms and certain skin allergies up<br />
to 70%.<br />
Moreover, it is <strong>of</strong> special interest because it<br />
stimulates lactation and it was proved that it<br />
removes hazardous materials from water<br />
(Schulz, 2006).<br />
Usually, people eat the same the whole day or<br />
two different kinds <strong>of</strong> meals, depending<br />
whether they are on the field or not. The<br />
typical daily meal consists <strong>of</strong> roasted maize or<br />
beans, tea made from the c<strong>of</strong>fee leave,<br />
“halakko”, served with the local bread or sweet<br />
potatoes. All around the day, people eat<br />
bananas, mangos and avocados, some fresh<br />
made bread and drink water with lemon.<br />
People are used to eat maize, in best case<br />
differently prepared, three to four times a day.<br />
12 <strong>of</strong> the interviewed farmers (41.4%) stated<br />
that they can afford to prepare their meals from<br />
different kind <strong>of</strong> ingredients and 3 households<br />
(10.3%) eat the same dish all over the day.<br />
4.3.7. Number <strong>of</strong> meals<br />
The number <strong>of</strong> meals depends whether people<br />
spend the whole day on the field and how far<br />
away the field is located. As mentioned before,<br />
the banana trees do not need so much<br />
treatment as the time-and work consuming<br />
cash crops.<br />
That is why 7 (24.1%) <strong>of</strong> the 29 farmers eat<br />
more meals today, 4 (13.8%) less and for 18<br />
interviewees (62.1%) there was no change in<br />
number <strong>of</strong> meals.<br />
When it comes to the choice <strong>of</strong> food and<br />
according to the FAO definition <strong>of</strong> food<br />
security that “...food is acceptable within the<br />
220
given culture”, only 7 people (25%) said that<br />
they can eat whatever they want today while it<br />
was 21 (75%) ten years ago. The reasons are<br />
again connected with the decreased food crop<br />
production and the increase <strong>of</strong> market prices.<br />
4.3.8. Healthiness <strong>of</strong> food and “food<br />
education”<br />
Concerning the healthiness <strong>of</strong> food, it is<br />
difficult to make a clear statement. As already<br />
mentioned, people have a bigger variety both<br />
from fruits in their garden as well as on the<br />
market. Although some products became more<br />
expensive, they could be substituted by<br />
cheaper ones, and as it turned out during the<br />
interviews, people have quite a good<br />
knowledge about food preparation, also due to<br />
the lessons they got from the Health Centre. It<br />
depends on the people how important they<br />
consider a healthy diet and how they spend<br />
their income.<br />
Although 9 (31%) <strong>of</strong> the 29 farmers stated to<br />
have more times <strong>of</strong> food shortages today<br />
compared to ten years ago, the author thinks<br />
differently because all the people seen in the<br />
study site did not show any observable signs <strong>of</strong><br />
under nutrition and, furthermore, if people<br />
have enough money to renew their houses,<br />
they should have enough money to eat, too.<br />
Information <strong>of</strong> the Health Centre also showed<br />
that there are no noteworthy problems with<br />
malnutrition and data gathered from the Arba<br />
Minch Catholic Church Medical Section<br />
showed that the low incidence <strong>of</strong> malnourished<br />
children that existed in former times also<br />
decreased. If there are still cases <strong>of</strong><br />
malnourished children, the UNICEF distributes<br />
food and supplements (Alimi) to the Health<br />
Centre <strong>of</strong> the Kebele where women can get it<br />
for free.<br />
4.3.9. Health situation, sanitation<br />
and nutrition<br />
Reasons that the health situation improved in<br />
Chano Chalba was induced by the construction<br />
<strong>of</strong> the potable water pumps as well as by the<br />
lessons from the Health Centre on food<br />
preparation and water storage, the distribution<br />
<strong>of</strong> mosquito-nets, a family planning model,<br />
antenatal examination, free vaccinations and<br />
education on topics like hygiene in kitchens,<br />
FAO breastfeeding recommendations, toilets,<br />
hand washing and cleaning practices.<br />
5. Conclusion and recommendations<br />
• For the irrigation scheme and its<br />
stakeholders<br />
As can be seen from the results <strong>of</strong> Chano<br />
Chalba, irrigation requires not only<br />
governmental support. <strong>Management</strong> and<br />
rehabilitation should be done from a bottom-up<br />
viewpoint and pro-poor, so that farmers “own”<br />
the irrigation schemes and make it more<br />
efficient.<br />
Although it is difficult for a non-irrigationexpert<br />
to say whether the dam, that is wished<br />
from the farmers <strong>of</strong> the study site, made sense<br />
and provided the necessary water that is<br />
needed during dry season or not, it is clear that<br />
people would make a bigger effort to sustain<br />
the irrigation system. <strong>Water</strong> losses might also<br />
be smaller if the field canals were made the<br />
modern way, from concrete.<br />
• For Chano Chalba and its<br />
inhabitants<br />
Chano Chalba developed step by step and is<br />
still moving on since they got the modern<br />
irrigation scheme. The road, the Agricultural<br />
Office, the Health Centre, electricity etc., all<br />
interventions improved the situation <strong>of</strong> the<br />
inhabitants to some extent. Only regarding<br />
their food situation, it seems that the positive<br />
change has not taken place yet. In contrary,<br />
people are somehow restricted in their choice<br />
<strong>of</strong> food. The explanation <strong>of</strong> this problem from<br />
the author’s point <strong>of</strong> view is both the missing<br />
education <strong>of</strong> most <strong>of</strong> the people as well as the<br />
focus on other targeted values <strong>of</strong> the<br />
population.<br />
Although the author would say that the food<br />
situation <strong>of</strong> the study site is not in a bad state,<br />
yet no one is starving or suffering from under<br />
nutrition and people look quite healthy, there is<br />
no doubt that it could be much better.<br />
Regarding the people’s values, they have to<br />
decide themselves what is most important to<br />
them.<br />
Questions pop up when thinking about what<br />
would happen if the market for the cash crop<br />
banana changed and people lost their (only)<br />
source <strong>of</strong> income. Then there would be a lack<br />
<strong>of</strong> food crops grown, people would not have<br />
the necessary money to buy food from the<br />
market where prices might rise even more.<br />
A shift to producing again more and maybe<br />
different kind <strong>of</strong> food crops could be helpful,<br />
although farmers would have to accept a<br />
221
smaller income. But as the experiences <strong>of</strong><br />
some <strong>of</strong> the interviewees showed, people who<br />
plant food crops and cash crops to the same<br />
extent are not worse <strong>of</strong>f at all.<br />
Moreover, as already recognized by the<br />
farmers and experts, mono cropping has<br />
negative impacts on the agricultural area by<br />
reducing soil fertility. But first, farmers have to<br />
be aware <strong>of</strong> the problem so that they give more<br />
effort and place bigger emphasis on strategies<br />
on keeping soil fertility.<br />
The ongoing strategy <strong>of</strong> family planning to<br />
slow down the rapid population growth <strong>of</strong> the<br />
past years might show its success in the<br />
coming years and hopefully it will change the<br />
situation <strong>of</strong> landholdings in a positive way.<br />
Also the lessons people got in sanitation and<br />
health care practices should show a positive<br />
impact in the livelihood <strong>of</strong> people.<br />
References:<br />
ADEM F. Small-Scale Irrigation and<br />
Household Food Security. A case study<br />
from Central Ethiopia. FSS Discussion<br />
Paper No. 4; Forum for Social Studies,<br />
Addis Ababa, February 2001.<br />
BANTERO B. Across systems comparative<br />
assessment <strong>of</strong> Hare community managed<br />
irrigation schemes performance. Arba<br />
Minch University, October 2006.<br />
KEBEDE H. Country Presentation on an<br />
Overview <strong>of</strong> Food Insecurity and FIVIMSrelated<br />
Activities in Ethiopia. IAWG –<br />
Annual Meeting from Oct. 1-3, 2003.<br />
KENNEDY E, BOUIS H, VON BRAUN J.<br />
Health and Nutrition Effects <strong>of</strong> Cash Crop<br />
Production in Developing Countries. A<br />
Comparative Analysis Reprinted from<br />
Social Science and Medicine, Vol. 35,<br />
No.5, IFPRI, 1992.<br />
KLOOS H. Small Scale Irrigation and Food<br />
Production in Ethiopia. A review. In:<br />
Ethiopian Journal <strong>of</strong> Development<br />
Research Vol.12, No.2. <strong>Institute</strong> <strong>of</strong><br />
Development Research, Addis Ababa<br />
University, April 1990.<br />
LALL A C, BROADWAY A C. An appraisal<br />
<strong>of</strong> the integrated rural development<br />
program in Allahabad. The Indian Journal<br />
<strong>of</strong> Economics LXXV, 1994, no.296, pp.<br />
127-135.<br />
LANKFORD B. Irrigation-based livelihood<br />
trends in river basins: theory and policy<br />
implications for irrigation development.<br />
In: Physics and Chemistry <strong>of</strong> the Earth, Nr.<br />
28; 2003¸ pp. 817-825.<br />
MENGISTU A. Ethopia: Country<br />
Pasture/Forage Resource Pr<strong>of</strong>iles. Suttie<br />
and Reynolds, July 2003.<br />
Web:<br />
http://www.fao.org/ag/agp/agpc/doc/counp<br />
r<strong>of</strong>/ethiopia/ethiopia.htm. [7.7.2006].<br />
ROBINSON W I, LIEBERG A T, TREBBI L.<br />
FAO/WFP Crop and Food Supply<br />
Assessment Mission to Ethiopia. 24 th<br />
February 2006; Web:<br />
http://www.who.int/hac/crises/eth/sitreps/E<br />
thiopia_fao_Feb06.pdf. [7.7.2006].<br />
Rome Declaration on World Food Security and<br />
World Food Summit Plan <strong>of</strong> Action.<br />
Rome, 1996. Web:<br />
http://www.fao.org/docrep/003/w3613e/w<br />
3613e00.htm. [24.6.2006].<br />
SCHULZ H. Moringa Oleifera - das<br />
vergessene Kind der Ayurveda. Web:<br />
http://www.ayurvedagesundheit.de/moring<br />
a_oleifera_das_vergessene_kind_der_ayur<br />
veda.html. [23.01.2006].<br />
Sustainable Livelihoods Guidance Sheets:<br />
Section 1. DFID, April 1999; Web:<br />
http://www.livelihoods.org/info/guidance_<br />
sheets_pdfs/section1.pdf. [25.6.2006].<br />
The Evaluation. Ethiopia, Special Country<br />
Programme Phase II, Report # 1643-ET,<br />
#April 2005, Office <strong>of</strong> Evaluation, IFAD,<br />
Rome;<br />
Web:<br />
http://www.ifad.org/evaluation/public_htm<br />
l/eksyst/doc/country/pf/ethiopia.pdf.<br />
[9.7.2006].<br />
THOMPSON J. Combining local knowledge<br />
and expert assistance in natural resource<br />
management: Small-scale irrigation in<br />
Kenya. Acts Press, Nairobi, 1991.<br />
World Bank. Country Brief. August 2007.<br />
http://go.worldbank.org/WA1RL12OL0,<br />
[8.10.2007]<br />
222
Impact Assessment <strong>of</strong> Rainwater Harvesting Ponds:<br />
The Case <strong>of</strong> Alaba Woreda, Ethiopia<br />
Rebeka Amha<br />
ILRI, Addis Ababa, Ethiopia.<br />
r.amha@cgiar.org<br />
Abstract<br />
Rainfall in the arid and semi-arid areas is<br />
generally insufficient to meet the basic<br />
needs <strong>of</strong> crop production. Thus, there is now<br />
increasing interest to the low cost alternative<br />
generally referred to as ‘water harvesting’<br />
especially for small scale farming systems.<br />
In Alaba, even if government efforts <strong>of</strong><br />
household level water harvesting schemes<br />
are wide spread, the performance obtained<br />
was not assessed. Due to this reason, there<br />
was a need to asses the impact <strong>of</strong> the<br />
existing rainwater harvesting systems in<br />
Alaba Woreda.<br />
The study assesses the determinants <strong>of</strong><br />
households’ adoption <strong>of</strong> rainwater<br />
harvesting ponds, and its impact on<br />
agricultural intensification and yield in<br />
Alaba Woreda, southern Ethiopia. Results<br />
are based on data collected from a survey <strong>of</strong><br />
152 households and 1036 plots operated by<br />
the households. Households were stratified<br />
into those with rain water harvesting ponds<br />
and those without from which equal number<br />
<strong>of</strong> sample households ware drawn. Analysis<br />
<strong>of</strong> descriptive information (mainly focusing<br />
on cropping pattern) and econometric<br />
methods are used. Analysis <strong>of</strong> qualitative<br />
information supplemented the econometric<br />
results.<br />
The finding in the cropping pattern shows<br />
that, farm households have started to grow<br />
new crops (vegetables and perennial crops)<br />
as a result <strong>of</strong> water availability from the<br />
water harvesting ponds. Results <strong>of</strong> Probit<br />
analysis on the determinants <strong>of</strong> adoption <strong>of</strong><br />
rainwater harvesting ponds shows that<br />
household size, education status <strong>of</strong><br />
household head, ownership <strong>of</strong> livestock<br />
(cattle, oxen and pack animals), homestead<br />
plots and type <strong>of</strong> pond explained adoption<br />
statistically significantly. Results <strong>of</strong> analysis<br />
<strong>of</strong> qualitative information, consistent, with<br />
the Probit model results, also showed that<br />
labor requirement, economic problem to use<br />
simpler water lifting and watering<br />
equipments, inability to easily understand<br />
the benefit <strong>of</strong> the technology and problems<br />
related with the structure <strong>of</strong> the RWH<br />
technology adopted were some <strong>of</strong> the major<br />
problems faced by households, and have a<br />
negative impact on the technology adoption<br />
rate.<br />
The Ordinary Least Square estimation <strong>of</strong> the<br />
determinants <strong>of</strong> the value <strong>of</strong> crop production<br />
shows that adoption <strong>of</strong> RWH has a positive<br />
and statistically significant effect on value <strong>of</strong><br />
crop production, after controlling for input<br />
use and other factors. This shows that RWH<br />
ponds have direct and significant impact on<br />
value <strong>of</strong> crop production. We also find that<br />
households with RWH technology use more<br />
labor and seed but less oxen power<br />
compared with those households who have<br />
not adopted the technology. Moreover, labor<br />
and seed inputs have positively significant<br />
impact on yield while the effect <strong>of</strong> oxen<br />
power is insignificant. These results show<br />
that in addition to its direct impact, RWH<br />
has significant indirect impact on value <strong>of</strong><br />
crop production through its effect on<br />
intensity <strong>of</strong> input use.<br />
Labor requirements and cost considerations<br />
appear to be important factors that influence<br />
household’s adoption <strong>of</strong> RWH technology.<br />
This implies that research and development<br />
interventions need to take account <strong>of</strong> the<br />
labor and cost demands <strong>of</strong> the technology.<br />
The effectiveness <strong>of</strong> the technology<br />
adoption is mainly constrained by problems<br />
related to water lifting and watering<br />
equipments, and accidents occurring due to<br />
223
absence <strong>of</strong> ro<strong>of</strong> cover and fence to the<br />
ponds. This implies that support will be<br />
needed to provide affordable but improved<br />
water lifting and watering equipments, and<br />
give training to farm households on<br />
construction and use <strong>of</strong> ro<strong>of</strong> covers and<br />
fences to the ponds. As households shift to<br />
high value but perishable commodities due<br />
to the RWH, emphasis needs to be given to<br />
marketing extension, especially in<br />
facilitating markets and market linkages to<br />
farmers.<br />
Future intervention to promote RWH<br />
technologies need to provide due attention to<br />
quality, rather than focusing on the number<br />
<strong>of</strong> adopters. Households appear to neglect<br />
the community ponds since they focus on<br />
using cleaner water obtained from<br />
household ponds and other sources <strong>of</strong> clean<br />
water. In this process the community ponds<br />
are becoming a cause <strong>of</strong> health problems.<br />
Thus, it is important that appropriate<br />
attention be given to the community ponds<br />
as well.<br />
Finally, it was found out that women are<br />
getting benefit from the technology<br />
adoption as any member <strong>of</strong> the family.<br />
Their participation in the technology<br />
adoption is mainly in watching the<br />
ponds. They also have contribution in<br />
planning and decision making stage, and<br />
in giving support during construction,<br />
maintenance and clearance <strong>of</strong> the pond.<br />
Female headed households are being<br />
constrained to be beneficiaries due to<br />
economic and manpower shortage.<br />
1. Background<br />
Ethiopia, like other Sub-Saharan African<br />
(SSA) countries, is an agrarian economy,<br />
with a very small industrial sector. The<br />
agricultural sector, on average, accounts for<br />
about 45% <strong>of</strong> the GDP, 90% <strong>of</strong> merchandise<br />
export earnings, 80% <strong>of</strong> employment, more<br />
than 90% <strong>of</strong> the total foreign exchange<br />
earnings, 70% <strong>of</strong> the raw material supplies<br />
for agro-industries, and is also a major<br />
supplier <strong>of</strong> food stuff for consumers in the<br />
country. Smallholders who produce more<br />
than 90% <strong>of</strong> the total agricultural output and<br />
cultivate close to 95% <strong>of</strong> the total cropped<br />
land dominate the sector. Agricultural<br />
production is highly dependent on the<br />
vagaries <strong>of</strong> nature with significant<br />
variability in production and actual<br />
production patterns (Demeke et al, 2005).<br />
Due to population increase in the highland<br />
areas, more and more marginal areas are<br />
being used for agriculture which led to the<br />
degradation <strong>of</strong> the natural resources .One <strong>of</strong><br />
the major challenges to rural development in<br />
the country is how to promote food<br />
production to meet the ever-increasing<br />
demand <strong>of</strong> the growing population. Rainfall<br />
in the arid and semi-arid areas is generally<br />
insufficient to meet the basic needs <strong>of</strong> crop<br />
production. In degraded areas with poor<br />
vegetation cover and infertile soil, rainfall is<br />
lost almost completely through direct<br />
evaporation or uncontrolled run<strong>of</strong>f. Thus,<br />
overcoming the limitations <strong>of</strong> these arid and<br />
semi-arid areas and making good use <strong>of</strong> the<br />
vast agricultural potential under the<br />
Ethiopian context, is a necessity rather than<br />
a choice. Thus, there is need for appropriate<br />
interventions to address the prevailing<br />
constraints using suitable technologies for<br />
improved and sustainable agricultural<br />
production.<br />
With regard to agricultural water<br />
development, small scale irrigation seems to<br />
be preferred to large scale schemes. The<br />
reason for the preference <strong>of</strong> small-scale<br />
irrigation to large scale irrigation includes<br />
the high capital requirement and cost <strong>of</strong><br />
constructing large scale scheme which can<br />
only benefit a fortunate few but easy<br />
adaptability <strong>of</strong> small scale irrigation (Turner,<br />
1994).<br />
There is now increasing interest to the low<br />
cost alternative generally referred to as<br />
‘water harvesting’ especially for small scale<br />
farming systems. Run<strong>of</strong>f, instead <strong>of</strong> being<br />
considered as a problem, can be harvested<br />
and used for different purposes, which<br />
otherwise is lost and causes soil erosion.<br />
Various methods <strong>of</strong> rainwater harvesting are<br />
available, through which rainwater is<br />
captured, stored and used at times <strong>of</strong> water<br />
224
scarcity. Rainwater harvesting can be<br />
broadly defined as a collection and<br />
concentration <strong>of</strong> run<strong>of</strong>f for productive<br />
purposes like crop, fodder, pasture or trees<br />
production, livestock and domestic water<br />
supply (Ngigi, 2003).<br />
Collection and storage <strong>of</strong> rainwater for<br />
different purposes has been a common<br />
practice since ancient times. The system was<br />
used thousand years ago in many parts <strong>of</strong> the<br />
world. There are also evidences indicating<br />
ancient churches, monasteries and castles in<br />
Ethiopia used to collect rainwater from<br />
ro<strong>of</strong>tops and ground catchments. Birkas in<br />
Somalia region and different run<strong>of</strong>f basins in<br />
Konso are good examples <strong>of</strong> the traditional<br />
rainwater harvesting practices in Ethiopia.<br />
Moreover embankment and excavated<br />
ponds20 for agriculture use and water<br />
supply, run<strong>of</strong>f farming and various types <strong>of</strong><br />
soil moisture conservation techniques for<br />
crop production could be mentioned as<br />
examples (Nega, 2004).<br />
In Ethiopia, promotion and application <strong>of</strong><br />
rainwater harvesting techniques as<br />
alternative interventions to address water<br />
scarcity were started through government<br />
initiated soil and water conservation<br />
programmes. It was started as a response to<br />
the 1971-1974 drought in Tigray, Wollo and<br />
Hararge regions with the introduction <strong>of</strong><br />
food-for-work (FFW) programme which<br />
were intended to generate employment<br />
opportunities to the people affected by the<br />
drought. Since then, however, the<br />
interventions have been extended to the<br />
other parts <strong>of</strong> the country with very limited<br />
coverage. The low level <strong>of</strong> community<br />
participation and declining attention were<br />
20 According to (Nega, 2005) they are defined as<br />
follows.<br />
Pond: is small tank or reservoir and is<br />
constructed for the purpose <strong>of</strong> storing the surface<br />
run<strong>of</strong>f<br />
Excavated pond: is a pond type constructed by<br />
digging the soil from the ground<br />
Embankment pond: type <strong>of</strong> pond constructed<br />
across stream or water course consisting <strong>of</strong> an<br />
earthen dam.<br />
some <strong>of</strong> the major reasons for the limited<br />
coverage (Ngigi, 2003).<br />
After the fall <strong>of</strong> the military government,<br />
both the Transitional Government <strong>of</strong><br />
Ethiopia (TGE), established in 1991, and the<br />
Federal Democratic Republic <strong>of</strong> Ethiopia<br />
(FDRE), established in 1995, have adopted<br />
an economic development policy to achieve<br />
food self sufficiency and sustainable<br />
development, based on a strategy called<br />
Agricultural<br />
Development-led<br />
Industrialization (ADLI) , which gives more<br />
emphasis to improvement in agricultural<br />
productivity. Besides, recognizing the<br />
problem <strong>of</strong> variability in the rainfall<br />
distribution in the country, the 1995 strategy<br />
advocates for water centered sustainable<br />
rural development (Desta, 2004). Based on<br />
this, several rain water harvesting<br />
technologies have been constructed by<br />
regional states, NGOs, communities, and<br />
individual farmers through out the country.<br />
To mitigate the erratic nature <strong>of</strong> rain fall in<br />
the arid and semi-arid parts <strong>of</strong> the country,<br />
which threatens the lives <strong>of</strong> millions <strong>of</strong><br />
people, a national food security strategy<br />
based on the development and<br />
implementation <strong>of</strong> rainwater harvesting<br />
technologies either at a village or household<br />
level was adopted after 1991. The Federal<br />
Government had allocated a budget for food<br />
security programs in the regions, an amount<br />
equal to ETB 100 million and ETB one<br />
billion during the 2002 and 2003 fiscal<br />
years, respectively. Of the total budget, most<br />
<strong>of</strong> it was used by regional states for the<br />
construction <strong>of</strong> rainwater harvesting<br />
technologies including household ponds, in<br />
collaboration with the Federal Ministry <strong>of</strong><br />
Agriculture and Rural Development (Rami,<br />
2003).<br />
Even if government efforts <strong>of</strong> household<br />
level water harvesting schemes are wide<br />
spread in Alaba, the performance obtained<br />
was not assessed. Due to this reason, there<br />
was a need to asses the impact <strong>of</strong> the<br />
existing rainwater harvesting systems in<br />
Alaba Woreda to determine their<br />
effectiveness and sustainability. In addition,<br />
there was a need to assess the condition <strong>of</strong><br />
indigenous rainwater harvesting<br />
225
technologies and practices in Alaba. Hence,<br />
this study is aimed to fill this gap <strong>of</strong><br />
knowledge in the region.<br />
The purpose <strong>of</strong> impact assessment is to<br />
determine the welfare changes from a given<br />
intervention on individual, households and<br />
institutions and whether those changes are<br />
attributable to the project, programme, or<br />
policy intervention. Impact assessments are<br />
<strong>of</strong>ten undertaken ex ante, evaluating the<br />
impact <strong>of</strong> current and future interventions,<br />
or ex post, evaluating the impact <strong>of</strong> past<br />
intervention. It can also be made<br />
concurrently within the project cycle<br />
(Shiferaw et.al, 2005). Our focus in this<br />
study is the ex post impact assessment. Ex<br />
post assessment attempts to understand the<br />
pathway through which observed impacts<br />
have occurred and why interventions fail or<br />
succeed in attaining stated objectives.<br />
Hence, ex post assessments can inform<br />
policy choices as to whether related planned<br />
programme interventions should be<br />
discontinued, modified, improved or<br />
sustained in the future (Ibde).<br />
Hence, this study is aimed at assessing the<br />
impact <strong>of</strong> rainwater harvesting ponds on<br />
crop yield using a quantitative approach<br />
supplemented by a qualitative approach in<br />
Alaba. In particular the study focuses on:<br />
• Identifying the determinants <strong>of</strong><br />
household decision to adopt rainwater<br />
harvesting ponds.<br />
• Examining the impact <strong>of</strong> rainwater<br />
harvesting ponds on crop yield, input<br />
use and cropping pattern.<br />
• Assess the constraints and options to<br />
improve rainwater harvesting ponds<br />
• Assess the differential impact <strong>of</strong> the<br />
technology by gender<br />
• Derive policy implications to improve<br />
the performance <strong>of</strong> the rainwater<br />
harvesting ponds.<br />
The study is expected to identify problems<br />
encountered, so that possible measures are<br />
taken when these interventions are<br />
replicated in other parts <strong>of</strong> the Woreda or the<br />
country. Besides, being an empirical study it<br />
will help to add to the empirical literature<br />
that uses the combination <strong>of</strong> both<br />
quantitative and qualitative approach in<br />
assessing the impact <strong>of</strong> RWH technology<br />
interventions on agricultural production.<br />
Finally, understanding the impact <strong>of</strong> the<br />
RWH technologies on agricultural<br />
productivity and the determinant factors <strong>of</strong><br />
rainwater harvesting ponds, which affect<br />
productivity or level <strong>of</strong> yield, is a vital issue<br />
for designing appropriate agricultural<br />
development policies and strategies, as well<br />
as technology interventions. Therefore, the<br />
outcome <strong>of</strong> this study may serve as a source<br />
<strong>of</strong> additional information which may be <strong>of</strong><br />
significant use to policy makers and<br />
planners during the designing and<br />
implementation <strong>of</strong> RWH technology<br />
strategies.<br />
The study was conducted amid some<br />
limitations. One <strong>of</strong> the limitations is the<br />
unavailability <strong>of</strong> base line data. Such data<br />
would reflect the condition <strong>of</strong> the farm<br />
household’s agricultural production process<br />
pre-technology intervention, and would have<br />
been helpful to compare more<br />
comprehensively and evaluate the relative<br />
effect <strong>of</strong> the technology intervention on<br />
agricultural productivity overtime. The other<br />
limitation <strong>of</strong> this study is related to the lack<br />
<strong>of</strong> accurate measures and valuation<br />
techniques to include the environmental<br />
benefits and costs that accrue from the RWH<br />
technology intervention.<br />
2. Literature Review<br />
Agriculture is the most water-demanding<br />
sector, in addition to being a major source <strong>of</strong><br />
employment and a major contributor <strong>of</strong> the<br />
national gross domestic product (GDP) <strong>of</strong><br />
many developing countries in Africa.<br />
Agriculture in Ethiopia provides 86 percent<br />
<strong>of</strong> the country’s employment and 57 percent<br />
<strong>of</strong> its GDP. Rain fed crop cultivation is the<br />
principal activity and is practiced over an<br />
area <strong>of</strong> 27.9 million hectares (ha) <strong>of</strong> land<br />
(Gebeyehu, 2006).<br />
Some empirical studies suggest that<br />
irrigation has shown some positive impacts<br />
in increasing agricultural productivity and<br />
thereby increase the income <strong>of</strong> farm<br />
households, who participate in the irrigation<br />
226
schemes (FAO, 1993). In the context <strong>of</strong><br />
farm households living in the Sub-Saharan<br />
African countries, irrigation has, however,<br />
proved costly and can only benefit farm<br />
households with large plots in addition to<br />
concerns related with the environmental and<br />
health side effects <strong>of</strong> the schemes.<br />
Large-scale dam and irrigation projects have<br />
not been widely implemented in Ethiopia as<br />
they have <strong>of</strong>ten proved to be too expensive<br />
and demanding in construction and<br />
maintenance. Therefore, water harvesting<br />
tanks and ponds at the village or household<br />
level are proposed as a practical and<br />
effective alternative to improve the lives <strong>of</strong><br />
rural people at little cost and with minimal<br />
outside inputs. In theory, household water<br />
harvesting can be done mainly through the<br />
effort <strong>of</strong> the individual farmer. Use <strong>of</strong> stored<br />
rainwater could supplement natural rainfall<br />
and make farming families less vulnerable to<br />
drought and therefore less dependent on<br />
outside help in harder times (Takele, 2002)<br />
The experience in China on the development<br />
<strong>of</strong> rainwater harvesting shows that since the<br />
1980’s , Gansu, Sichuan, Guangxi, Guizhou<br />
and Yunnan provinces adopted rainwater<br />
harvesting techniques. To date, rainwater<br />
harvesting projects have been carried out in<br />
about 700 counties <strong>of</strong> 15 provinces in semiarid<br />
and humid areas covering two million<br />
km 2 and with a total population <strong>of</strong> 0.36<br />
billion. By the end <strong>of</strong> 2001, about 12 million<br />
water cellars, tanks and small ponds were<br />
built with a total storage capacity <strong>of</strong> 16<br />
billion m3, supplying water for domestic use<br />
for 36 million people and supplemental<br />
irrigation for 2.6 million m2 <strong>of</strong> dry farming<br />
land. This has helped the people access<br />
water and engages in agricultural production<br />
hence improving food security and<br />
alleviating poverty. Rainwater harvesting<br />
has also been known to benefit ecological<br />
and environmental conservation (UNEP,<br />
2005).<br />
Impact <strong>of</strong> rainwater harvesting as shown in a<br />
case study <strong>of</strong> Mwala division, Kenya<br />
indicates that harvesting run<strong>of</strong>f water for<br />
supplemental irrigation is a risk-averting<br />
strategy, pre-empting situations where crops<br />
227<br />
have to depend on rainfall that is highly<br />
variable both in distribution and amounts.<br />
By using underground spherical tanks<br />
having a combined capacity <strong>of</strong> 60 m3,<br />
seasonal water for supplemental irrigation<br />
for an area about 400 m2 was guaranteed.<br />
With rainwater harvesting, farmers have<br />
diversified to include horticultural cash<br />
crops and the keeping <strong>of</strong> dairy animals. For<br />
instance households with supplemental<br />
irrigation earn US$735(per ha) from cash<br />
crop compared with US$146 normally<br />
earned from rain fed maize. This has<br />
contributed to food security; better nutrition<br />
and higher family income (RELMA-in-<br />
ICRAF, 2004).<br />
India has a long tradition <strong>of</strong> rainwater<br />
harvesting so much so that it is regarded as<br />
one <strong>of</strong> the dying tradition <strong>of</strong> the country21.<br />
However, it has been reviving apace in<br />
many parts <strong>of</strong> the country, particularly in<br />
rain scarce areas. Derwadi village, a village<br />
in the central state <strong>of</strong> Maharashtra, is one <strong>of</strong><br />
such dry villages <strong>of</strong> India. A remote village<br />
with no assurance to drinking water, with<br />
farming being mainly rain fed based and<br />
agricultural production can’t meet more than<br />
three-month food <strong>of</strong> the village, Derwadi<br />
used to be a desperate village with no<br />
employment opportunity for the community<br />
and where schooling is a distant dream for<br />
the kids <strong>of</strong> the community. The villagers<br />
established a link with an Indo-German<br />
watershed Development NGO called<br />
<strong>Water</strong>shed Organization Trust (WOTR),<br />
which later assisted them to construct<br />
contour trenches, farm and contour bunds,<br />
and check dams. A degraded land then<br />
stared to provide adequate water both for<br />
drinking and for irrigation, thus paving the<br />
way for transformation <strong>of</strong> the lives <strong>of</strong> the<br />
villagers. They not only managed to<br />
diversify from traditional pearl millet to<br />
other host <strong>of</strong> crops ranging from various<br />
vegetables to cotton, but also managed to<br />
produce the crops in surplus and be able to<br />
21 This document on India’s experience is<br />
obtained from website<br />
www.rainwaterharvesting.org/rural, where an<br />
interesting account <strong>of</strong> experience with rainwater<br />
harvesting in more than 20 Indian villages is<br />
presented.
sell, perhaps for the first time, to big towns.<br />
They managed to send their kids to school.<br />
With the help <strong>of</strong> the NGO they also<br />
managed to form self help association that<br />
enabled them to organize and carry out such<br />
activities as construction <strong>of</strong> toilet, kitchen<br />
garden and improved cocking devices.<br />
The other experience with rainwater<br />
harvesting from India is Gandhigram village<br />
<strong>of</strong> Gujarati state. This village is also one <strong>of</strong><br />
the water scarce areas <strong>of</strong> the country,<br />
constantly suffering from acute water<br />
scarcity both for consumption and<br />
production. Assisted by a local NGO called<br />
Shri Vivekanand Research and Training<br />
<strong>Institute</strong>, the community started to build<br />
communal dams- small and big- in 1995 so<br />
as to store rainwater and use it during dry<br />
season. A committee was formed from<br />
among the beneficiaries to oversee the<br />
distribution <strong>of</strong> the water and maintenance <strong>of</strong><br />
the dams. They evolved an interesting<br />
management mechanism where each<br />
household is asked to pay Rs 3 (equivalent<br />
<strong>of</strong> $0.067) per month for water supply for<br />
consumption purpose, and Rs<br />
250(equivalent to $5.56) per ha for irrigation<br />
purpose. The community managed not only<br />
to secure sustained supplies <strong>of</strong> water for<br />
domestic consumption, but also was able to<br />
embark upon producing high value crops<br />
like ground nuts, wheat, onion and cumin.<br />
They managed to increase their agricultural<br />
yield and work availability has also<br />
increased for land less laborers. As it has<br />
become beneficial, the momentum for<br />
rainwater harvesting continued in the village<br />
as is evident from community’s interest to<br />
increase the number <strong>of</strong> dams by constructing<br />
new ones. Interestingly enough, they are<br />
now on the stage <strong>of</strong> forming a cooperative<br />
for processing and marketing their<br />
agricultural products.<br />
By the 1990’s, Zambia’s southern province<br />
was recording unprecedented levels <strong>of</strong> food<br />
insecurity, hunger and general poverty.<br />
Government food, seed and fertilizer relief<br />
support become the norm rather than the<br />
exception for many households. During the<br />
2002/2003 season, over 12% <strong>of</strong> the farm<br />
households were estimated to have adopted<br />
conservation agriculture technologies which<br />
included the use <strong>of</strong> rainwater harvesting.<br />
This was estimated to involve at least 50,000<br />
hectares. The experience <strong>of</strong> Zambia shows<br />
that crop yields have on the minimum<br />
doubled. Maize yield rose from under<br />
0.5t/ha to above 2t/ha and cotton from<br />
1.5t/ha to 3t/ha under conventional as<br />
compared to conservation agriculture<br />
respectively. This has been attributed to<br />
improved rainwater harvesting made<br />
possible by the planting stations and surface<br />
cover. Most farmers have diversified their<br />
cropping system to include crops such as<br />
maize, beans and sunflower. Increased<br />
production at the household level in the last<br />
five years has introduced the rapid re-birth<br />
<strong>of</strong> a cash economy among the communities.<br />
This has propelled private entrepreneurship<br />
in agricultural related trading. Large and<br />
small private entrepreneurs have emerged<br />
and are selling agricultural inputs and other<br />
household commodities as well as buying<br />
<strong>of</strong>f the crop. Most households are able to put<br />
up for sale 20-30% <strong>of</strong> their produce. The<br />
ultimate effect is enhanced livelihoods<br />
(UNEP, 2005).<br />
Hatibu et al (2004) tried to quantify the<br />
effect on farmers’ income and living<br />
standards <strong>of</strong> different rainwater harvesting<br />
methods, taking two districts, Maswa from<br />
north and Same districts from Eastern parts,<br />
<strong>of</strong> Tanzania. All types, viz. in-situ, micro<br />
and macro catchments and rainwater<br />
harvesting with storage are all practiced in<br />
the two regions in descending order <strong>of</strong><br />
prevalence; in-situ is more prevalent in both<br />
regions followed by micro and macro<br />
catchments, with rainwater harvesting with<br />
storage being the least. The harvested<br />
rainwater is used mainly to grow maize in<br />
Same area while it is used for rice in Maswa<br />
region. Good rainwater harvesting increases<br />
yield <strong>of</strong> maize (in Same area) by four fold <strong>of</strong><br />
rain fed yield level, and two fold for rice (in<br />
Maswa area)(Ibid).<br />
It is only recently that rainwater harvesting<br />
has started to receive significant attention<br />
from Ethiopian government though it has a<br />
long history. It has been regarded as one <strong>of</strong><br />
the crucial tools to achieve food self-<br />
228
sufficiency, and is being implemented on a<br />
large scale particularly in water scarce areas<br />
<strong>of</strong> the country. As the phenomenon is quite<br />
recent, detailed study hasn’t been made.<br />
However, some preliminary studies have<br />
been made on some parts <strong>of</strong> the country.<br />
Rami (2003) is one <strong>of</strong> such studies, and is<br />
basically an account <strong>of</strong> two weeks field visit<br />
in Amhara and Tigray regions. The<br />
emphasis is mainly on rainwater harvesting<br />
implementation related problems in the<br />
regions and the prospects <strong>of</strong> using it for the<br />
stated objective <strong>of</strong> attaining food selfsufficiency.<br />
It has been found that RWH is<br />
top <strong>of</strong> the agenda in the two regions, as is<br />
the case at national level, with some times<br />
over ambitious plans <strong>of</strong> constructing wells<br />
and ponds.<br />
The success in attaining the planed amounts<br />
<strong>of</strong> tanks and ponds to be constructed and the<br />
perceptions <strong>of</strong> the beneficiaries are found<br />
mixed. Shortages <strong>of</strong> required construction<br />
raw materials, lack <strong>of</strong> timely dispersal <strong>of</strong><br />
finance and shortage <strong>of</strong> skilled labor have<br />
been among the factors inhibiting the<br />
attainments <strong>of</strong> the stated goals. This is<br />
evident from Amhara region where it once<br />
was planned to construct 29005 tanks made<br />
<strong>of</strong> cement and plastic and 27955 wells were<br />
excavated for the purpose but only 12614<br />
tanks were constructed. Furthermore, the<br />
tanks constructed so far are found to be<br />
substandard, many collapsed and majority<br />
leak and seep water, the main factor being<br />
lack <strong>of</strong> experienced masons and supervisors<br />
and mismatch between the type <strong>of</strong> soil in the<br />
area and the tank construction method. The<br />
tanks were first tested in Adama area and<br />
implemented in the two regions, with<br />
basically different soil structures from<br />
Adama area, without-taking into account the<br />
specificities <strong>of</strong> the two regions (Rami,<br />
2003). In addition, most <strong>of</strong> the construction<br />
was assigned to each Woreda as a quota<br />
resulting in less attention being paid to<br />
quality as compared to number. Further, the<br />
implementation tended to be top-down<br />
approach, particularly in Amhara region,<br />
and this has also contributed its share to the<br />
problems (Ibid).<br />
Besides, rainwater harvesting is found to<br />
have undesirable, but not unexpected, health<br />
side effects. For instance many people and<br />
livestock have been drowned into the tanks<br />
and ponds, with <strong>of</strong>ten no fences and live<br />
saving mechanisms like ladder and ropes<br />
(Ibid). It is also cited by people living near<br />
the ponds as a source <strong>of</strong> malaria out break.<br />
However, it doesn’t mean that rainwater<br />
harvesting didn’t have any positive effects<br />
on the community. It has enabled them to<br />
grow crops <strong>of</strong> short growing periods like<br />
vegetables. And some have had good<br />
experience, as is the case in Tigray region<br />
where, for instance, “a farmer and his wife<br />
were able within a single season to pay their<br />
old extension credit <strong>of</strong> more than 1000 Birr<br />
through the planting and sale <strong>of</strong> vegetables<br />
(cabbages, tomatoes, beans and peppers)<br />
(Ibid). The upshot is that rainwater<br />
harvesting is beset with challenges and can<br />
be an utter failure and end up in undesirable<br />
negative consequences if not cautiously<br />
approached. However, it can play immense<br />
role in helping attain food security if<br />
implemented with thorough consultations<br />
with the beneficiaries and is accompanied<br />
with other activities like afforestation and<br />
soil conservation and fertility enhancing<br />
practices.<br />
The econometric approach has some<br />
limitations in accurately and fully measuring<br />
the changes resulting from NRM<br />
interventions, especially those changes<br />
which are non-quantifiable. Hence, as a<br />
remedy to the shortcomings <strong>of</strong> the<br />
econometric approach, at present<br />
,researchers like Kerr et.al (2005) are<br />
advocating that better results could be<br />
obtained using an integrated quantitative and<br />
qualitative approach in assessing the impact<br />
<strong>of</strong> NRM interventions.<br />
Kerr et.al (2005) employed quantitative<br />
analysis (as with and without design mainly<br />
employing instrumental variable approach)<br />
and also qualitative information to better<br />
understand interest in relation to relevant<br />
research questions, and to identify the<br />
projects’ unintended consequences in<br />
evaluating the performance <strong>of</strong> watershed<br />
projects in India. Specifically, the study tries<br />
229
to identify: the successful projects, the<br />
approaches adopted which lead to the<br />
success and additional characteristics <strong>of</strong><br />
particular villages’ contribution to achieve<br />
improved natural resource management,<br />
higher agricultural productivity, and reduced<br />
poverty. The results <strong>of</strong> the study show that<br />
in both <strong>of</strong> the states, participatory projects<br />
combined with sound technical inputs<br />
performed better as compared to<br />
technocratic, top-down counterpart.<br />
Evidence also found on the existence <strong>of</strong><br />
potential poverty alleviation trade-<strong>of</strong>f during<br />
an effort to increase agricultural productivity<br />
and conserve natural resources through<br />
watershed development. Particularly, the<br />
empirical result indicates the existence <strong>of</strong><br />
strong evidence on the skewed distribution<br />
<strong>of</strong> benefits towards largest land holders in<br />
projects, which are more successful in both<br />
conservation and productivity .The shortterm<br />
costs imposed on ‘losers’ (i.e. the poor)<br />
may be substantial and projects would gain<br />
from a greater focus on mechanisms to share<br />
projects benefits (Shiferaw et.al, 2003).<br />
Apart from the qualitative analysis approach<br />
used in the early periods, the literature on<br />
quantitative analysis approaches for<br />
assessing the impact <strong>of</strong> natural resource<br />
management policy or technology<br />
interventions can include the econometric<br />
approach (Shiferaw et.al, 2003).The<br />
commonly applied method in natural<br />
resource management intervention impact<br />
assessment, i.e., the econometric approach,<br />
is developed by linking the measures <strong>of</strong><br />
current output, cost or pr<strong>of</strong>its directly to past<br />
research investments. In this approach,<br />
either a primal function, based on estimated<br />
production function, or a dual function,<br />
using a pr<strong>of</strong>it or cost function and their<br />
related system <strong>of</strong> supply and factor demand<br />
functions are employed. In general, once the<br />
econometric approach is adopted, the impact<br />
<strong>of</strong> the natural resource management<br />
technology or policy intervention is obtained<br />
by translating the parameter estimates <strong>of</strong> the<br />
function used, into economic benefit value<br />
(Shiferaw et.al, 2003).<br />
For instance, Pender et al. (200l) employed a<br />
structural econometric approach, to explore<br />
the impact <strong>of</strong> land management and<br />
investment on the value <strong>of</strong> crop production<br />
in Uganda .The data for the analysis<br />
obtained from a survey <strong>of</strong> 451 households.<br />
Selected regressors include several variables<br />
at the village, household and plot levels. The<br />
study has shown that improvement in land<br />
management can lead to higher productivity<br />
and lower land degradation. Participation in<br />
technical assistance programs, pursuit <strong>of</strong><br />
certain livelihood strategies, investment in<br />
irrigation, and promotion <strong>of</strong> more<br />
specialized production <strong>of</strong> cereals or export<br />
crops are found to achieve “Win-Win”<br />
outcomes, increasing agricultural<br />
productivity while reducing land<br />
degradation. The results <strong>of</strong> the study don’t<br />
support the optimistic ‘more people-less<br />
erosion’ hypothesis, though the results are<br />
consistent with population induced<br />
agricultural intensification’, as hypothesized<br />
by Boserup. In addition it indicates the need<br />
to make further research to identify<br />
pr<strong>of</strong>itable as well as sustainable land<br />
management options, as no land<br />
management practices except irrigation were<br />
found to be very pr<strong>of</strong>itable in the short-run<br />
(Shiferaw et.al, 2003).<br />
Gebremedhin et al.(2002, 2000), have<br />
applied an econometric analysis to examine<br />
the nature and impact <strong>of</strong> community<br />
woodlot and grazing land management’s<br />
respectively; and identify the determinant<br />
factors <strong>of</strong> collective action and its<br />
effectiveness, in Tigray, Ethiopia. Empirical<br />
results <strong>of</strong> the analysis indicated that, more<br />
collective action exists manage community<br />
woodlots in areas with intermediate<br />
population density. In relation to community<br />
grazing land management, results from the<br />
regression analysis depict that, while<br />
population pressure has resulted in reduction<br />
<strong>of</strong> violations <strong>of</strong> use restrictions <strong>of</strong> grazing<br />
land in areas with low and intermediate level<br />
<strong>of</strong> population density, intermediate<br />
population pressure has the tendency to<br />
reduce the development <strong>of</strong> use restrictions<br />
and the enforcement <strong>of</strong> penalties<br />
(Gebremedhin et.al, 2000). Besides, while<br />
negative relationship has been observed<br />
between communities access to market and<br />
household’s contribution to collective<br />
230
action, tree planting, and the survival rate <strong>of</strong><br />
trees (Gebremedhin et.al, 2002). However,<br />
the result from both studies reveal that, the<br />
presence <strong>of</strong> external organizations is<br />
negatively associated with the probability <strong>of</strong><br />
community payment to guard, survival rate<br />
<strong>of</strong> trees, and collective action for grazing<br />
land management Gebremedhin et. al (2002,<br />
2000).<br />
3. Methods <strong>of</strong> the study<br />
Sampling and data<br />
The data for the analysis is obtained from a<br />
household and plot level survey in Alaba<br />
Woreda. The Woreda is located 310 km<br />
south <strong>of</strong> Addis Ababa and about 85km<br />
southwest <strong>of</strong> the Southern Nations<br />
Nationalities and Peoples Regional<br />
(SNNPR) state capital <strong>of</strong> Awasa. A semistructured<br />
questionnaire has been employed<br />
to interview household heads.<br />
A total <strong>of</strong> 152 households which are selected<br />
using a stratified sampling technique have<br />
been surveyed. Based on farming system<br />
practiced, the 73 peasant associations in the<br />
Woreda are stratified in to two, namely 43<br />
peasant associations with Teff/ Haricot Bean<br />
Livestock and 30 peasant associations with<br />
Pepper/ Livestock farming system. From<br />
each stratum 2 peasant associations were<br />
selected randomly and the households<br />
within each <strong>of</strong> the four peasant associations<br />
were further stratified by adoption <strong>of</strong> RWH<br />
technology. In the end, from each <strong>of</strong> the four<br />
randomly selected peasant associations, a<br />
total <strong>of</strong> 38 households were randomly<br />
selected, where 19 <strong>of</strong> the farm households<br />
adopting the technology and 19 farm<br />
households without the technology stratum.<br />
Moreover, interview has been done with<br />
experts working in the OoARD (<strong>of</strong>fice <strong>of</strong><br />
Agricultural and Rural Development).<br />
Secondary data was also used from<br />
publications, books, articles etc. to<br />
supplement the data.<br />
DATA ANALYSIS<br />
Qualitative approaches are increasingly used<br />
in conjunction with quantitative approaches<br />
and such combinations can enhance the<br />
validity and reliability <strong>of</strong> impact evaluations.<br />
While quantitative approaches allow<br />
statistical tests for causality and isolation <strong>of</strong><br />
programme effects from other confounding<br />
influences, quantitative methods excel at<br />
answering impact assessment questions<br />
about ‘what’ and ‘how much’, whereas<br />
qualitative methods are preferred for<br />
exploring questions <strong>of</strong> ‘how’ and ‘why’. A<br />
mix <strong>of</strong> quantitative and qualitative<br />
approaches is ideal because it provides the<br />
quantifiable impacts <strong>of</strong> the intervention as<br />
well as an explanation <strong>of</strong> the processes and<br />
relationships that yielded such outcomes<br />
(Shiferaw et.al, 2005).<br />
Descriptive Analysis<br />
This part mainly focuses on describing the<br />
impact <strong>of</strong> rainwater harvesting ponds on the<br />
cropping pattern. Cropping pattern <strong>of</strong> the<br />
farm household’s has been assessed based<br />
on the farming system.<br />
Econometrics approach<br />
Empirical model and econometric<br />
estimation<br />
Since there is no predetermined model that<br />
can be used in the quantitative estimation,<br />
following Pender and Gebremedhin (2004),<br />
models for the use <strong>of</strong> inputs on each plot<br />
(from equation 2 up to equation 6); adoption<br />
<strong>of</strong> RWH ponds (equation 1); and the value<br />
<strong>of</strong> crop production on each plot in 2005/06<br />
(from equation 7 to equation 9) are adopted<br />
in this study.<br />
To identify the determinant factors that<br />
influence the farm households’ decision to<br />
adopt RWH pond or to invest on various<br />
types <strong>of</strong> RWH ponds, a probit model is<br />
estimated. Hence, a RWHp dummy variable<br />
(where 1=household with RWH technology<br />
and 0=household without RWH technology)<br />
231
is modeled as a function <strong>of</strong> village-level<br />
factors (X V ), plot-level factors (X p ),<br />
household-level factors (X h ) and pond type<br />
which can be plastic covered or concert<br />
basement (P).These can be written as<br />
follows:<br />
RWHp = f (X V , X P , X h , P) ……. (1)<br />
Where, Household- level factor (X h )<br />
includes:<br />
• Human capital (demographic<br />
features) - age, household size,<br />
educational status.<br />
• Physical capital - land holding, value<br />
<strong>of</strong> all assets owned, value <strong>of</strong> livestock<br />
which includes oxen, packed animals,<br />
poultry, cattle etc.<br />
• Social capital- membership in local<br />
organization and associations.<br />
• Financial capital-households saving<br />
and credit access.<br />
Village-level factors (X v ) includes:<br />
• Indicators <strong>of</strong> agricultural potential:<br />
rainfall condition(here due to lack <strong>of</strong><br />
adequate information at PA level,<br />
during estimation, location dummies<br />
has been used in order to capture the<br />
difference in rainfall, altitude,<br />
population density and other<br />
environmental factors for the four PAs<br />
included in the study).<br />
• Household access to services and<br />
infrastructure: walking time from the<br />
farm household’s residence to the<br />
nearest input/ output town market,<br />
village market, Cooperative shops and<br />
all-weather and seasonal road.<br />
Plot-level factors (X p ) - Natural<br />
capital<br />
• Indicators <strong>of</strong> quality <strong>of</strong> the plot (size<br />
<strong>of</strong> plot, slope <strong>of</strong> the plot, soil depth,<br />
soil type and soil fertility <strong>of</strong> the plot),<br />
how the household acquired the plot,<br />
the purpose for which the plot is used<br />
and walking time from farm<br />
household’s residence to the plot in<br />
hours.<br />
In the crop production regression and input<br />
use regressions, a logarithmic Cobb-Douglas<br />
specification is used. This leads to a<br />
theoretically consistent specification for<br />
output and input demands, and reduces<br />
problems due to outliers and non-normality<br />
<strong>of</strong> the error term found when using a linear<br />
specification (Pender and Gebremedhin,<br />
2004).<br />
Thus, the use <strong>of</strong> inputs – Labor days/ha<br />
(lnL), Oxen power days/ha (lnO), Seeds<br />
kg/ha (lnS), use <strong>of</strong> Fertilizer (F), and use <strong>of</strong><br />
Manure/Compost (M/C), are modeled as a<br />
function <strong>of</strong> explanatory variables including<br />
village-level factors (X V ), plot-level factors<br />
(X p ), household-level factors (X h ) and the<br />
predicted value <strong>of</strong> adoption <strong>of</strong> rainwater<br />
harvesting ponds (RWHp).The models for<br />
the variable inputs can be written as follows:<br />
lnL = f (X V , X P , X h , RWHp) ………. .(2)<br />
lnX K = f (X V , X P , X h , RWHp ) …..…(3)<br />
lnS = f (X V , X P , X h , RWHp) …….... (4)<br />
F = f (X V , X P , X h , RWHp) ………. (5)<br />
M/C= f (X V , X P , X h , RWHp) …….. .(6)<br />
Where, ln stands for logarithm<br />
The econometric model used depends on the<br />
nature <strong>of</strong> the dependent variable. For use <strong>of</strong><br />
labor, oxen power and seeds on cultivated<br />
plots, the least squares regression is used<br />
while the regression equations for the<br />
variable inputs, fertilizer and<br />
manure/compost, Probit model is used since<br />
the dependent variable is dummy variable.<br />
Finally, in assessing the impact <strong>of</strong> RWH<br />
ponds on agricultural output, the value <strong>of</strong> the<br />
agricultural output harvested from a plot is<br />
modeled in three different alternatives. First,<br />
a full model <strong>of</strong> the value <strong>of</strong> crop production<br />
from a plot is modeled as a function <strong>of</strong><br />
village-level factors (X V ), plot-level factors<br />
(X p ) and household-level factors (X h ).<br />
Besides, the use <strong>of</strong> variable inputs Labor<br />
(lnL), Oxen power (lnO), Seeds (lnS),<br />
Fertilizer (F), Manure or Compost (M/C)<br />
and the predicted value for adoption <strong>of</strong><br />
RWH ponds (RWHp) are included.A full<br />
model <strong>of</strong> the value <strong>of</strong> crop production from<br />
a plot can be written as follows:<br />
LnY= f (lnL, lnO, lnS, F, M/C, X V , X P, X h,<br />
RWHp) ……. (7)<br />
232
However, in the second regression,<br />
household-level characteristics (X h ) and<br />
adoption <strong>of</strong> RWH pond (RWHp) are<br />
omitted. This is because the effect <strong>of</strong> these<br />
variables on production may be indirectly<br />
through the use <strong>of</strong> inputs. Thus, the second -<br />
structural model <strong>of</strong> the value <strong>of</strong> crop yield is<br />
modeled as a function <strong>of</strong> all factor inputs by<br />
excluding household-level factors (X h ) and<br />
adoption <strong>of</strong> RWH pond (RWHp) from the<br />
regression. Thus the second model <strong>of</strong> the<br />
value <strong>of</strong> crop yield from a plot is given as<br />
follows:<br />
LnY= f (lnL, lnO, lnS, F, M/C, X V , X P )<br />
………………………………………… (8)<br />
The third model developed in this study for<br />
the value <strong>of</strong> crop production is a reducedform<br />
equation, which includes all villagelevel,<br />
plot-level, household-level<br />
characteristics as explanatory variables and<br />
the predicted value for adoption <strong>of</strong> RWH<br />
ponds. However, it excludes the use <strong>of</strong><br />
inputs like Labor (lnL), Oxen power (lnO),<br />
Seeds (lnS), Fertilizer (F) and Manure or<br />
Compost (M/C) from the model. This<br />
specification can avoid the potential for<br />
endogenity bias. And also to examine the<br />
total effect <strong>of</strong> all factors on crop production,<br />
and whether it is a direct effect on<br />
production or indirectly through its effect on<br />
the use <strong>of</strong> inputs and adoption <strong>of</strong> RWH<br />
ponds.<br />
The models for reduced- form specification<br />
<strong>of</strong> the value <strong>of</strong> crop production from a plot<br />
can be written as follows:<br />
LnY = f (X v , X p , X h, RWHp) ……….. (9)<br />
In all cases, the least square regression was<br />
used to estimate the value <strong>of</strong> crop<br />
production.Generally, one important point<br />
that should be noted is that, for equation<br />
2,3,4,7 and 8 robust regression is undertaken<br />
to avoid the hetroskedasticity problem that<br />
was observed during estimation. And also<br />
problem <strong>of</strong> multicolinearity and omission <strong>of</strong><br />
variables has been checked.<br />
Qualitative Analysis<br />
These approach analysis the perception <strong>of</strong><br />
experts and farmers regarding the<br />
constraints and opportunities <strong>of</strong> RWH<br />
technologies. The qualitative information<br />
was gathered using an open-ended question<br />
that was included in the questionnaire in<br />
order to augment the results <strong>of</strong> the<br />
econometrics analysis.<br />
4. Results and Discussions<br />
Impact on Cropping Pattern<br />
As part <strong>of</strong> the assessment for the impact <strong>of</strong><br />
RWH technology intervention on the farm<br />
household’s crop choice decision, the study<br />
has employed a descriptive analysis <strong>of</strong> the<br />
crop mix for those with RWH technology in<br />
the different farming systems. Here, the crop<br />
types are classified into categories such as<br />
annual crops, perennial crops, vegetables,<br />
spices, others and no new crops. As can be<br />
seen from the table below, <strong>of</strong> the total<br />
number <strong>of</strong> the crop types sawn by all the<br />
sample households (382 plots), 188<br />
observations are in the teff/haricot<br />
bean/livestock farming system category and<br />
194 observations are under the<br />
pepper/livestock farming system category.<br />
In the teff /haricot bean/livestock farming<br />
system, <strong>of</strong> the total 188 observations, 60.1%<br />
grow vegetables where as 4.3%, 6.9%, 4.3%<br />
represent annuals crops, perennial crops and<br />
spices, respectively. In the vegetable crop<br />
category cabbage, onions and carrot account<br />
16.5%, 14.9% and 12.2%, respectively. On<br />
the other hand, in the pepper/ livestock<br />
farming system, <strong>of</strong> the total 194<br />
observations 67% is vegetables category<br />
where as 6.2%, 4.1%, 2.1% represent annual<br />
crops, perennial crops and spices. In the<br />
vegetable category which have great share<br />
from the different classifications cabbage,<br />
beet root, tomato, carrot and onion, account<br />
for 16.5, 12.9, 10.3, 9.8 and 8.8 percent,<br />
respectively.<br />
The result <strong>of</strong> the crop mix analysis imply<br />
that, the shift in farm household’s crop<br />
choice decision towards highly priced and<br />
marketable agricultural products like<br />
vegetables and perennial crops or increment<br />
233
in the number <strong>of</strong> harvesting per<br />
year(intensification), could have a positive<br />
impact on the farm households income as<br />
well as level <strong>of</strong> living. However, the level<br />
and magnitude <strong>of</strong> benefit accrue to the farm<br />
household will significantly depend on<br />
market and infrastructure accessibility. This<br />
is because most <strong>of</strong> the crop categories sawn<br />
in farm households with rainwater<br />
harvesting technology are perishable; for<br />
example, vegetable represent the highest<br />
percentage <strong>of</strong> (60.1%) in Teff/Haricot bean/<br />
livestock farming system and (67%) in<br />
pepper/ livestock farming system. Hence,<br />
unless these products are able to reach to<br />
consumers immediately after harvested,<br />
either their market value will decrease with<br />
time or it might be a loss to the farm<br />
household. Besides, an examination <strong>of</strong> the<br />
type <strong>of</strong> crops grown under the vegetable<br />
category witnessed that most farm<br />
households have concentrated on specific<br />
crops (tomato, cabbage, onions, and carrot)<br />
and the production and supply <strong>of</strong> these crops<br />
in large quantities might reduce the price <strong>of</strong><br />
the commodities and there by affect the<br />
economic feasibility <strong>of</strong> the technology.<br />
Thus, effort should be made to supply<br />
variety seeds to farmers so as to diversify<br />
the type <strong>of</strong> crops grown.<br />
<strong>Table</strong> 1: Types <strong>of</strong> crop grown after start to use the technology based on farming system<br />
Category <strong>of</strong> crop types grown<br />
Total<br />
Farming<br />
system<br />
Te<br />
ff/<br />
Ha<br />
ric<br />
Type <strong>of</strong><br />
crops grown<br />
Nothi<br />
ng<br />
new<br />
Annu<br />
als<br />
Peren<br />
nial<br />
crops<br />
Vegeta<br />
bles<br />
Spice<br />
s<br />
Oth<br />
ers<br />
crops<br />
No new crop 40<br />
40<br />
grown (21.3)<br />
Chat 1 (.5) 1<br />
C<strong>of</strong>fee 12<br />
12<br />
(6.4)<br />
Banana 1(.5) 1<br />
Sugarcane 1 (.5) 1<br />
Avocado 2<br />
2<br />
(1.1)<br />
Papaya 4<br />
4<br />
(2.1)<br />
Onions 28<br />
28<br />
(14.9)<br />
Ginger(Jinjibl<br />
1 (.5) 1<br />
e)<br />
Pepper 6<br />
6<br />
(3.2)<br />
Carrot 23<br />
23<br />
(12.2)<br />
Tomato 7 (3.7) 7<br />
Cabbage 31<br />
31<br />
(16.5)<br />
Chilli Pepper 2<br />
2<br />
(1.1)<br />
Kale 4 (2.1) 4<br />
Sweet 1 (.5) 1<br />
234
Pe<br />
pp<br />
er/<br />
liv<br />
potatoes<br />
Garlic 3 (1.6) 3<br />
Beet root 15 (8) 15<br />
If other<br />
6 6<br />
specify<br />
(3.2)<br />
Total 40<br />
(21.3)<br />
8<br />
(4.3)<br />
13<br />
(6.9)<br />
113<br />
(60.1)<br />
8<br />
(4.3)<br />
6<br />
(3.2)<br />
188<br />
No new crop 38<br />
38<br />
grown (19.6)<br />
Chat 2 (1) 2<br />
C<strong>of</strong>fee 8 (4.1) 8<br />
Orange 1 (.5) 1<br />
Banana 2 (1) 2<br />
Pineapple 1 (.5) 1<br />
Avocado 2 (1) 2<br />
Mango 1 (.5) 1<br />
Papaya 2 (1) 2<br />
Onions 17 (8.8) 17<br />
Pepper 4<br />
4<br />
(2.1)<br />
Carrot 19 (9.8) 19<br />
Tomato 20<br />
20<br />
(10.3)<br />
Cabbage 32<br />
32<br />
(16.5)<br />
Lettuce/'Selat<br />
5 (2.6) 5<br />
a'/<br />
Kale 6 (3.1) 6<br />
'Kosta' 4 (2.1) 4<br />
Sweet<br />
1 (.5) 1<br />
potatoes<br />
Garlic 1 (.5) 1<br />
Mandarin 1 (.5) 1<br />
Beet root 25<br />
25<br />
(12.9)<br />
If other<br />
2 (1) 2<br />
specify<br />
Total 38 12 8 (4.1) 130 4 2 (1) 194<br />
(19.6) (6.2)<br />
(67)<br />
*The number in the bracket shows percentage value<br />
(2.1)<br />
*The number out <strong>of</strong> the bracket<br />
shows<br />
frequency<br />
235
Determinants <strong>of</strong> adoption <strong>of</strong> RWH pond,<br />
input use and crop yield<br />
Determinants <strong>of</strong> Households Decision to<br />
Adopt RWH Pond<br />
The estimation results <strong>of</strong> the Probit model<br />
for the determinants <strong>of</strong> household’s decision<br />
to adopt RWH technology is presented in<br />
<strong>Table</strong> 2. As can be shown in the table, from<br />
the locational dummies, Ulegeba Kukke<br />
shows stastical significance at 10% level.<br />
No association has been found between<br />
village level factors and technology<br />
adoption decision.<br />
Household human capital<br />
Household size is positively correlated with<br />
the adoption decision <strong>of</strong> rainwater<br />
harvesting ponds at 5% level <strong>of</strong> significance.<br />
This means households with large family<br />
size are more likely to adopt the technology<br />
since they can compensate costs involved in<br />
hiring labor for any activity that the<br />
technology demands. This implies that<br />
research and development interventions<br />
need to take account <strong>of</strong> the labor and cost<br />
demand <strong>of</strong> the technology. Households who<br />
can read and write, and those who are<br />
educated up to grade seven are more likely<br />
to adopt RWH. The positive association<br />
with the technology adoption can occur with<br />
the expectation that they can understand the<br />
benefit more easily and are more open to<br />
access information than illiterate<br />
households. This implies that expansion <strong>of</strong><br />
education in the woreda will have a positive<br />
impact in increasing the adoption decision<br />
rate.<br />
Household physical capital endowment<br />
From the household physical resource<br />
endowment indicators included in the<br />
model, oxen, cattle and pack animals have<br />
depicted positive correlation with adoption<br />
decision <strong>of</strong> the technology. This indicates<br />
that adoption <strong>of</strong> the technology requires<br />
large resources, thus households with a<br />
better physical resource are more likely to<br />
invest on technology interventions than<br />
those with few physical resource. The<br />
positive correlation with oxen power may be<br />
due to households focus on agricultural<br />
production. However, it should be noted that<br />
the significant explanatory variables have<br />
insignificant effect in magnitude implying<br />
its less importance to make policy<br />
implication.<br />
Plot level factors<br />
Among the plot level factors, household<br />
decision to adopt RWH pond is more likely<br />
in homestead plot. The result indicates farm<br />
household’s effort to fully utilize family<br />
labor so as to meet the human resource<br />
requirement during construction and<br />
utilization <strong>of</strong> water, thereby reduce the<br />
finance that could otherwise be needed for<br />
hiring labor. It can also show the capital<br />
constraint faced by households to buy<br />
modern water lifting equipment. The most<br />
interesting implication <strong>of</strong> this result is that,<br />
the accumulated water is used to produce<br />
crops with high market value rater than used<br />
as supplementary source <strong>of</strong> water during dry<br />
spells, as initially intended by government<br />
when the technology was introduced as<br />
country level. Ponds with concrete basement<br />
have shown stastically significant negative<br />
correlation with adoption <strong>of</strong> rainwater<br />
harvesting pond at 1% level. This implies<br />
that the higher cost involved in pond<br />
construction will result in less technology<br />
adoption decision.<br />
Determinants <strong>of</strong> Agricultural Input Use<br />
The estimation result for the agricultural<br />
inputs <strong>of</strong>: labor person days per hectare,<br />
oxen power days per hectare, seed - kg/ha,<br />
fertilizer and manure or compost is<br />
presented in <strong>Table</strong> 3.<br />
Impact on use <strong>of</strong> Oxen Power<br />
The estimation regression analysis also<br />
indicates that, adoption <strong>of</strong> rainwater<br />
harvesting technology has a negative<br />
stastically significant association with use <strong>of</strong><br />
236
oxen power, more likely due to lower use <strong>of</strong><br />
oxen power and more human labor on<br />
homestead plots where the technology is<br />
mostly adopted.<br />
The locational dummies <strong>of</strong> Ulegeba Kukke,<br />
Andegna Hansha and Hamata are positively<br />
associated with value <strong>of</strong> oxen power used<br />
relative to Mudda Dinokosa. From the<br />
household access to services and<br />
infrastructure indicator, only nearness to<br />
village market is significantly correlated<br />
with more use <strong>of</strong> oxen power. Probably the<br />
correlation could be because <strong>of</strong> the<br />
possibility to get more seed and fertilizer<br />
enabling them to use more oxen power in<br />
order to increase their agricultural<br />
productivity. Moreover, it is shown that<br />
medium rainfall condition is positively<br />
correlated with the use <strong>of</strong> oxen power than<br />
low rainfall condition.<br />
In the household level factors, household<br />
size, heads who can read and write, and<br />
those who are educated up to fourth grade<br />
are positively associated with the use <strong>of</strong><br />
oxen power at 1% level <strong>of</strong> significance. This<br />
implies those households having large<br />
family size and educated members are more<br />
likely to use oxen power to utilize labor<br />
available in the family to produce more<br />
output. From the household physical<br />
resource endowment indicators, owned land<br />
has shown positive correlation with the use<br />
<strong>of</strong> oxen power at 5% level <strong>of</strong> significance,<br />
which implies that more oxen power will be<br />
used by heads who own more land. In<br />
addition, ownership <strong>of</strong> goats and sheep, and<br />
beehive are stastically significant at 10%<br />
level. The significance might imply<br />
household’s involvement in sheep, goat or<br />
honey trading to get extra income and use<br />
more oxen power in order to increase<br />
agricultural production especially in cases<br />
when the household has large land size.<br />
In relation to household head’s membership<br />
in various associations, the study showed<br />
that relative to households with heads a<br />
member in association, households with<br />
heads not a member in associations are<br />
negatively correlated with oxen power use.<br />
This might imply, non-members may<br />
depend on activities that don’t use oxen<br />
power as their source <strong>of</strong> livelihood. Farm<br />
households with saving have depicted<br />
significant negative association with oxen<br />
power use, more likely households with<br />
saving are engaged in livestock production,<br />
trading or use the money for health<br />
expenditure and for some other purposes.<br />
The amount <strong>of</strong> oxen power used has shown<br />
significant positive association with flat and<br />
moderately sloped plots in comparison to<br />
steep plots. The result might indicate<br />
farmers risk aversion behavior due to crop<br />
failure which could be caused by high run<strong>of</strong>f<br />
problem. Plots with medium soil depth are<br />
less likely to use oxen power compared to<br />
plots with deep soil depth. Homestead plots<br />
have stastically significant negative<br />
correlation at 1% level. This means, it is less<br />
likely that households will use oxen power<br />
on homestead plots. However, the likely use<br />
<strong>of</strong> oxen power is shown to be significantly<br />
higher in crop land plots. An interesting<br />
result is found in the relationship between<br />
plot size and oxen power use, where larger<br />
plot size is significantly associated with<br />
lower oxen power use.<br />
Impact on use <strong>of</strong> Seed<br />
As expected the estimation <strong>of</strong> the regression<br />
analysis indicates that, adoption <strong>of</strong> RWH<br />
pond has stastically significant association<br />
with more likely use <strong>of</strong> seed. This could<br />
probably imply the impact <strong>of</strong> the RWH<br />
technology on crop production is indirectly<br />
through its effect on intensity <strong>of</strong> agricultural<br />
inputs.<br />
The regression result depicts that no<br />
evidence has been found between locational<br />
dummies and amount <strong>of</strong> seed used. From the<br />
village level indicators, closeness to town<br />
and village market is significantly associated<br />
with more use <strong>of</strong> seed, probably the<br />
household heads are less likely to be<br />
engaged in non-farm labor employment and<br />
hence, more emphasis be given to crop<br />
production.<br />
With respect to household size, large family<br />
size is significantly associated with more use<br />
<strong>of</strong> seed, probably indicating that the<br />
237
members in the household utilize labor by<br />
working in agricultural activity which<br />
demands more seed. From the education<br />
status, households with heads who can read<br />
and write, and those with formal education<br />
up to fourth grade have shown positive<br />
association with use <strong>of</strong> seed relative to<br />
illiterate headed households. Households<br />
endowed with large sized land are<br />
significantly associated with more use <strong>of</strong><br />
seed. No significant correlation has been<br />
observed between social and financial<br />
factors, and amount <strong>of</strong> seed used. The result<br />
in the correlation between plot level factors<br />
and intensity in use <strong>of</strong> seed, more likely use<br />
<strong>of</strong> seed is shown on cropland and homestead<br />
plots.<br />
Impact on labour use<br />
As anticipated the estimation <strong>of</strong> the<br />
regression analysis indicate that,<br />
adoption <strong>of</strong> RWH technology has a<br />
positive stastically significant<br />
association with use <strong>of</strong> higher labor,<br />
most likely due to the higher level <strong>of</strong><br />
labor requirement during watering ,<br />
construction an other activities involved.<br />
As can be seen from the result <strong>of</strong> the<br />
regression analysis, location dummy <strong>of</strong><br />
Hamata PA is associated with more likely<br />
use <strong>of</strong> labor input at 5% level <strong>of</strong><br />
significance. From the correlation between<br />
household access to infrastructure and<br />
service indicators and use <strong>of</strong> labor input,<br />
closeness to village market, town market<br />
and seasonal roads are associated with<br />
higher intensity in use <strong>of</strong> labor input.<br />
Probably household heads are engaged in<br />
farming activity by utilizing more seed,<br />
oxen and fertilizer use. Areas with high<br />
rainfall depict statistically negative<br />
association with labor input use, suggesting<br />
the need for more labor input in areas where<br />
there is low rainfall.<br />
The result <strong>of</strong> the regression analysis shows<br />
that, a farm household with large family size<br />
has stastically significant association with<br />
use <strong>of</strong> more labor. Probably the positive<br />
correlation with labor input could be<br />
because <strong>of</strong> either inability <strong>of</strong> the economy to<br />
absorb the excess labor force in extended<br />
families or constrained by transaction cost in<br />
the labor market and there by the family<br />
members are compelled to engage in crop<br />
production at the existing plot. Stastically<br />
significant negative correlation exists<br />
between the age <strong>of</strong> the household head and<br />
use <strong>of</strong> labor input. That means older-headed<br />
households are less likely to supply labor.<br />
Furthermore, in relation to the household<br />
physical resource endowment, ownership <strong>of</strong><br />
more oxen power is likely to utilize more<br />
labor input than in cattle and pack animal<br />
ownership. This is probably due to<br />
complementarity. An important point that<br />
should be noted is the insignificant impact<br />
<strong>of</strong> this variables when consider the<br />
magnitude. In relation to household head’s<br />
membership in local organization, the study<br />
witnessed that, members in Edir and other<br />
related local organization are more likely to<br />
use labor input than those who are members<br />
in Edir only. In addition, households with<br />
saving are less likely to use labor input,<br />
probably suggesting household’s<br />
involvement in activities other than<br />
agriculture.<br />
The result also shows a mixed correlation<br />
between plot level factors and labor input<br />
use. For instance, labor input use is<br />
significantly greater on plots with flat and<br />
medium slope than plots with steep slope,<br />
perhaps indicating farmers risk aversion<br />
behavior and their emphasis on short term<br />
benefit. Since steep sloped plots are more<br />
exposed to soil erosion problem. More over,<br />
less <strong>of</strong> labor input is used on inherited and<br />
plots with medium soil depth. Homestead<br />
plots have stastically significant negative<br />
association at 1% level. However, more use<br />
<strong>of</strong> labor input is observed on cropland plots.<br />
An interesting result is found in the<br />
relationship between plot size and labor<br />
input use, where larger plot size is<br />
significantly associated with lower labor<br />
input use.<br />
238
Impact on use <strong>of</strong> Fertilizer<br />
As can be seen on table 3, the adoption <strong>of</strong><br />
RWH technology is shown to have<br />
insignificant impact on use <strong>of</strong> fertilizer<br />
suggesting that its impact on crop<br />
production isn’t seen indirectly through its<br />
effect on fertilizer input.<br />
From the village level factors, walking time<br />
to the nearest village market has a negative<br />
correlation with fertilizer use at 10% level <strong>of</strong><br />
significance. That means households closer<br />
to the village market are more likely to use<br />
fertilizer. No evidence has been found on the<br />
existence <strong>of</strong> correlation between the likely<br />
use <strong>of</strong> fertilizer and factors like human,<br />
social and financial capital part <strong>of</strong> the<br />
household level indicators. Further more,<br />
strong positive correlation has been found<br />
between value <strong>of</strong> beehives and the likely use<br />
<strong>of</strong> fertilizer, which is perhaps due to<br />
households focus on beekeeping activity<br />
enabling them to buy more fertilizer using<br />
the incremental income.<br />
In relation to the association between plot<br />
level factors and the likely use <strong>of</strong> fertilizer,<br />
crop land plots are shown to have positive<br />
association with the use <strong>of</strong> fertilizer at 1%<br />
level <strong>of</strong> significance. Less fertilizer use is<br />
observed on homestead plots due to more<br />
possibility to use manure or compost than<br />
buy fertilizer. In small plot size it is more<br />
likely to use higher amount <strong>of</strong> fertilizer<br />
which is mainly due to an increase in<br />
efficiency when household’s own small<br />
sized plots. Moreover, plots closer to the<br />
residence <strong>of</strong> the farm household have<br />
depicted significant correlation with more<br />
likely use <strong>of</strong> fertilizer.<br />
Impact on use <strong>of</strong> Manure or Compost<br />
As can be depicted from table 3, adoption <strong>of</strong><br />
RWH technology is found to have<br />
insignificant impact on manure or compost.<br />
No evidence has been found on the<br />
existence <strong>of</strong> correlation between the use <strong>of</strong><br />
manure or compost and the locational<br />
dummies. From the locational dummies,<br />
household’s nearness to village market,<br />
town market and seasonal road is more<br />
likely to use manure or compost inputs.<br />
Probably this is due to the use <strong>of</strong> more labor<br />
seed input when the household is closer to<br />
this services. In areas where there is high<br />
rainfall, more use <strong>of</strong> manure or compost is<br />
observed.<br />
Further more, from the household level<br />
factors, households with large family are<br />
more likely to use manure or compost,<br />
probably due to the availability <strong>of</strong> labor to<br />
carry manure or compost to the farm land.<br />
With respect to educational status,<br />
household heads with formal education up to<br />
fourth grade are less likely to use manure or<br />
compost relative to illiterate heads. Most<br />
likely this could be affected either by<br />
educated headed households positive<br />
correlation with more likely use <strong>of</strong> fertilizer<br />
there by reducing the likely use <strong>of</strong> manure or<br />
compost , or these households are<br />
constrained by labor required to carry<br />
manure or compost to the farm.<br />
In relation to household’s physical resource<br />
endowment, ownership <strong>of</strong> large sized land is<br />
correlated with less likely use <strong>of</strong> manure or<br />
compost, probably due to its high demand<br />
for labor input to carry manure or compost<br />
to wider farm lands. Ownership <strong>of</strong> large<br />
number <strong>of</strong> oxen is correlated with more<br />
likely use <strong>of</strong> manure or compost. Those<br />
engaged in livestock production as shown by<br />
ownership <strong>of</strong> large number <strong>of</strong> cattle and<br />
beehives are less likely to use manure or<br />
compost.<br />
With respect to the financial capital part,<br />
households who have access to credit are<br />
more likely to use manure or compost input.<br />
Probably due to the possibility <strong>of</strong> using the<br />
credit to buy seed, oxen etc. which might<br />
lead to demand more manure or compost .In<br />
addition, those with saving are also more<br />
likely to use manure or compost. Probably<br />
due to their preference to spent it on other<br />
things than on fertilizer by replacing it with<br />
manure or compost.<br />
239
Finally, in relation to the association<br />
between plot level factors and the likely use<br />
<strong>of</strong> manure or compost, the result witnessed<br />
that, state owned and inherited plots are<br />
positively correlated with more use <strong>of</strong><br />
manure or compost. On the other hand, on<br />
flat and moderately steep plots, households<br />
are more likely to use manure or compost<br />
than on those steep sloped plots, probably to<br />
avoid risk <strong>of</strong> crop failure. Medium soil depth<br />
is more likely to use manure or compost.<br />
Plots that are highly fertile are more likely to<br />
use manure or compost than those infertile<br />
once because it will be risky for the<br />
household to use the input on infertile plot<br />
than fertile once. Households are less likely<br />
to use manure or compost on cropland plots<br />
but more likely to use it on homestead plots,<br />
probably due to its closeness to the<br />
residence <strong>of</strong> the farm household.<br />
Impact on Crop Yield<br />
<strong>Table</strong> - 4 presents the full model <strong>of</strong> the value<br />
<strong>of</strong> crop yield (column-2). Here, variables<br />
such as household level factors; household –<br />
human, social, physical, and financial capital<br />
endowment; and adoption decision <strong>of</strong> RWH<br />
technology that were included in the<br />
unrestricted OLS regression have been<br />
found to be jointly statistically insignificant.<br />
In column – 3 and column– 4 results <strong>of</strong> the<br />
structural and reduced models are shown<br />
respectively.<br />
The impact <strong>of</strong> adoption <strong>of</strong> RWH technology<br />
on crop production can be explained in two<br />
ways, directly or indirectly. The direct<br />
impact is, if the accumulated water is used<br />
to supplement the shortage <strong>of</strong> water during<br />
dry spell periods in rain fed crop production,<br />
where as the indirect impact is through its<br />
effect on intensity in use <strong>of</strong> agricultural<br />
inputs. The estimation result <strong>of</strong> the study<br />
indicate that, adoption <strong>of</strong> RWH technology<br />
is shown to be positively correlated with<br />
value <strong>of</strong> yield at 1% level <strong>of</strong> significance.<br />
This might imply that the direct impact <strong>of</strong><br />
the technology adoption on crop production<br />
is significant. An examination <strong>of</strong> the indirect<br />
impact shows that, households with RWH<br />
technology are significantly correlated with<br />
higher use <strong>of</strong> labor and seed but lower use <strong>of</strong><br />
oxen power than those without the<br />
technology. Intensity in use <strong>of</strong> labor and<br />
seed input has a positively significant impact<br />
on yield while oxen power has insignificant<br />
impact on yield.<br />
As can be seen from the structural model for<br />
the value <strong>of</strong> crop yield, in the village level<br />
factors, seasonal road have negative stastical<br />
significance at 10%. With respect to the<br />
impact <strong>of</strong> plot fertility on value <strong>of</strong> crop<br />
yield, households are more likely to produce<br />
more output in moderately fertile plots than<br />
infertile once. As can be observed from the<br />
table, cropland and homestead plots are<br />
more likely to produce more yield. Besides,<br />
the result indicates the positive impact <strong>of</strong><br />
use <strong>of</strong> labor, fertilizer and seed on value <strong>of</strong><br />
crop yield. In the reduced model <strong>of</strong> crop<br />
yield, depicted in column 4 <strong>of</strong> table 4,<br />
village level factors, plot level factors,<br />
household level factors and household<br />
rainwater harvesting technology adoption<br />
decision were included in the regression and<br />
assessed with respect to their impact on the<br />
value <strong>of</strong> crop yield.<br />
The village level factors don’t explain<br />
variation in the value <strong>of</strong> crop production.<br />
Moreover, from the household level factors,<br />
household size has shown positive<br />
association with value <strong>of</strong> crop yield at 10%<br />
level <strong>of</strong> significance. This implies that<br />
households having large family size are<br />
more likely to produce more output. With<br />
respect to the impact <strong>of</strong> household physical<br />
capital endowment, greater ownership <strong>of</strong><br />
cattle has shown association with higher<br />
value <strong>of</strong> crop yield (and stastically<br />
significant at 10% level).From the plot level<br />
factors included, state owned plot are more<br />
likely to produce more output than rented<br />
plots. Possibly indicating household’s high<br />
future discount rate and become less likely<br />
to invest on productivity enhancing<br />
activities on rented plot. Plots with shallow<br />
and medium soil depth are less likely to<br />
produce more output than plots with deep<br />
240
soil depth. It is also shown that, cropland<br />
and homestead plots are more likely to<br />
produce more output compared with<br />
grazing, woodlots and spice plots. In<br />
addition, a negative significant association is<br />
observed between plot size and value <strong>of</strong><br />
crop yield.<br />
As can be depicted from the result <strong>of</strong> the<br />
reduced model, household family size is<br />
positively correlated with value <strong>of</strong> yield at<br />
10% level <strong>of</strong> significance implying that<br />
large family will produce more output. From<br />
the determinant factors <strong>of</strong> input use table,<br />
households with large family size have<br />
shown significant association with use <strong>of</strong><br />
higher labor, seed, oxen and more likely use<br />
<strong>of</strong> manure or compost. Intensity in use <strong>of</strong><br />
labor has a positive impact on yield at 1%<br />
level <strong>of</strong> significance. This suggests that<br />
yield averages 11% higher per additional<br />
labor a household uses. Moreover, average<br />
yield increases by around 9% per additional<br />
seed amount used by the household. Even<br />
though fertilizer isn’t significantly affected<br />
by household size, fertilizer is positively<br />
correlated with value <strong>of</strong> yield at 1% level <strong>of</strong><br />
significance. That means yield is more likely<br />
to increase with more use <strong>of</strong> fertilizer input.<br />
Household age and education have<br />
insignificant impact on value <strong>of</strong> yield.<br />
However, household age has a significant<br />
impact on labor. Old age is negatively<br />
associated with labor input use. Educational<br />
status has a positive impact on seed and<br />
oxen input use.<br />
Variations in resource endowment among<br />
households will obviously have an impact<br />
on the level <strong>of</strong> crop yield either directly or<br />
indirectly through their effect on the<br />
household’s demand for agricultural inputs.<br />
Of the factors, which are used to measure<br />
household physical capital endowment,<br />
ownership <strong>of</strong> cattle has a positive impact on<br />
the value <strong>of</strong> crop yield. However, it has<br />
insignificant impact when consider the<br />
magnitude to make policy implication.<br />
Households with saving are negatively<br />
associated with labor and oxen inputs use.<br />
Probably they might prefer to be involved in<br />
non-farm activities. Credit access and saving<br />
have a positive impact on manure or<br />
compost input use. Household access to<br />
services and infrastructure facilitates the<br />
movement <strong>of</strong> inputs to and outputs from<br />
rural parts to towns, where large market is<br />
available. The regression result shows an<br />
increase in yield when the household is<br />
located closer to seasonal road and is<br />
stastically significant. Households closer to<br />
village market are able to use higher amount<br />
<strong>of</strong> seed, labor, oxen and more likely to use<br />
fertilizer and manure or compost input. In<br />
addition, households closer to cooperative<br />
shops and seasonal roads are more likely to<br />
use labor input and those nearer to town<br />
market are able to increase seed amount.<br />
The result <strong>of</strong> the value <strong>of</strong> crop yield also<br />
shows that, state owned plots witnessed<br />
stastically significant association with higher<br />
value <strong>of</strong> crop yield. Probably, suggesting<br />
that farmers are more likely to invest on<br />
productivity enhancing activities on state<br />
owned plots. It is also shown that shallow<br />
and medium soil depth has stastically<br />
significant association with lower yield than<br />
on deep soil depth. Finally, crop land and<br />
homestead plots are shown to have positive<br />
association with value <strong>of</strong> yield.<br />
Perceptions <strong>of</strong> the constraints and<br />
opportunities in adoption and use <strong>of</strong><br />
RWH technologies<br />
Farmers were asked to rank the purpose for<br />
which the accumulated water was used<br />
based on the amount <strong>of</strong> water utilized in<br />
each activity. As can be seen in table 5<br />
below, households use the pond water for<br />
different purposes including as source <strong>of</strong><br />
drinking water for animals and households.<br />
In addition to using the water for washing<br />
cloths and cooking, households use the<br />
water for nursering some plants, for<br />
vegetable and fruit production. About 40.8%<br />
<strong>of</strong> households responded that they use the<br />
water for vegetable production as a<br />
supplementary during dry spell periods to be<br />
their first choice. In the second rank, 27.6%<br />
<strong>of</strong> the households use the water for<br />
241
nursering. About 23.7% and 18.4% <strong>of</strong> the<br />
households use it for drinking and for<br />
livestock respectively.<br />
<strong>Table</strong> 5. The purpose <strong>of</strong> the pond water<br />
Rank1 Rank 2 Rank 3 Rank 4<br />
Freq(%) Freq(%) Freq(%) Freq(%)<br />
For HHH drinking water 7(9. 2) 15 (19. 74) 18(23.7) 2 (2.6)<br />
Drinking water for livestock 4(5. 3) 13 ( 17.11) 9(11.8) 14(18.4)<br />
Nursering 26(34.2) 21 (27.6) 12 (15.8) 1(1. 32)<br />
Vegetable production 31(40.8) 14 (18.4) 1 (1. 32) 3(3. 95)<br />
Spices production 2(2.6) 1 (1. 32)<br />
Fruit production 2 (2.6)<br />
Washing cloths and food 6(7.9) 10(13.16) 19 (25) 4(5. 3)<br />
cooking<br />
Total 76(100) 76(100) 59(77.6) 24(31.6)<br />
<strong>Table</strong> 6 depicts cross tabulation <strong>of</strong> the type<br />
<strong>of</strong> RWH technologies adopted at plot level<br />
with their corresponding equipments used<br />
for water lifting and application. As shown<br />
in the table, 65.3% <strong>of</strong> the households<br />
represent those who adopted plastic-lined<br />
RWH pond and those waiting for plastic<br />
sheet. Concrete structures made <strong>of</strong> clay<br />
and/or cement accounts 34.7%. Of the total<br />
47 households with plastic cover and none<br />
basement, 38.3% use metal Bucket for<br />
lifting and watering plants while 29.8% <strong>of</strong><br />
the households use big plastic container<br />
‘Jerikan’. Besides, households with concrete<br />
based ponds mainly use mental bucket<br />
followed by big plastic container, pulley and<br />
‘commendary’ each accounting 20% <strong>of</strong> the<br />
households.<br />
<strong>Table</strong> 6. Cross tabulation between type <strong>of</strong> RWH technology and type <strong>of</strong> water lifting equipments<br />
used<br />
Type <strong>of</strong> water lifting equipments used<br />
Ponds<br />
covered<br />
with plastic<br />
and none<br />
covered<br />
basement<br />
Total<br />
Pulley ‘Commendary’ Pot Tridle Jog 'Jerikan' 'Tanika' Bucket<br />
pump<br />
2(4.3) b 7(14.9) 2(4.3) 1(2.13) 14(29.8) 3(6.4) 18(38.3) 47(65.3)<br />
% <strong>of</strong> Total 2.8 9.7 2.8 1.4 19.4 4.2 25<br />
Ponds with 5(20) 5(20) 1(4) 5(20) 1(4) 8(32) 25(34.7)<br />
concrete<br />
basement<br />
% <strong>of</strong> Total 6.9 6. 9 1. 4 6. 9 1. 4 11.1<br />
Total 7(9.7) 12(16.7) 2(2.8) 1(1. 1(1.4) 19(26.4) 4(5.6) 26(36.1) 72(100)<br />
4)<br />
b<br />
Values in brackets are percentages.<br />
application equipments used in the total 72<br />
In addition, the last raw <strong>of</strong> table 6 shows the<br />
distribution <strong>of</strong> each type <strong>of</strong> water lifting and<br />
plots with RWH technology. Thus, from the<br />
total households with RWH technology<br />
242
majority <strong>of</strong> them (36.1%) use metal Bucket<br />
for lifting and watering plants followed by<br />
use <strong>of</strong> big plastic container (26.4%) and<br />
‘commendary’ (16.7%).The highest<br />
percentage in the use <strong>of</strong> metal Bucket for<br />
water lifting and watering plants indicates<br />
the difficulty for a farm household in terms<br />
<strong>of</strong> time as well as labor days required to<br />
irrigate the entire plantation in the plot. This<br />
difficulty is due to lack <strong>of</strong> capital for buying<br />
or renting simpler equipments which is a<br />
major detrimental factor affecting the rater<br />
<strong>of</strong> rainwater harvesting technology adoption.<br />
As can be seen on table 7 below, only 19.7%<br />
<strong>of</strong> the households that adopt the technology<br />
have a cover for their pond while 80.3% <strong>of</strong><br />
them respond that they didn’t put a cover for<br />
their ponds. This might result in lots <strong>of</strong><br />
problems like accident on animals or kids,<br />
bad smell when the volume <strong>of</strong> water lowers<br />
which could be source <strong>of</strong> malaria, high<br />
evaporation rate. Of the households with a<br />
cover for their ponds 33.3% and 26.7% <strong>of</strong><br />
them use wood (trees) and Satera<br />
respectively. Besides, 13.3% <strong>of</strong> them use<br />
Cob, wood with kenchibe and wood with<br />
Sinkita each. On the other hand, with regard<br />
to those who use fence to avoid risks, 68.4%<br />
<strong>of</strong> them use it while the rest 24 households<br />
don’t use fence for their ponds. Most <strong>of</strong> the<br />
households use wood as a material to do the<br />
fence followed by using wood with kenchibe<br />
accounting 25% and 23.1% <strong>of</strong> them<br />
kenchibe alone.<br />
<strong>Table</strong> 7. If the pond has a cover and fence<br />
Does<br />
If yes, what<br />
your<br />
are the<br />
RWH<br />
pond<br />
have<br />
cover?<br />
materials<br />
used?<br />
Does the<br />
pond<br />
have<br />
fence to<br />
avoid<br />
risk?<br />
If yes, what are<br />
the materials<br />
used ?<br />
Freq(%) Freq(%) Freq(%) Freq(%)<br />
Yes 15(19.7) Wood 5(33.3 ) Yes 52<br />
(68.4)<br />
Wood(acacia<br />
tree)<br />
20 (38.5<br />
)<br />
no 61(80.3) Cob 2 (13. 3 no 24 Cob 2(3.85 )<br />
)<br />
(31.6)<br />
Total 76(100) ‘Satera’ 4(26.7 ) Total 76(100) ‘Kenchibe’ 12 (23.1<br />
)<br />
Wood and 2(13. 3<br />
Cob and 3(5.77 )<br />
‘kenchibe’ )<br />
‘kenchibe’<br />
Wood and 2(13. 3<br />
Wood and 13 (25 )<br />
‘Sinkita’ )<br />
‘kenchibe’<br />
Total 15(100<br />
)<br />
‘Kenchibe’ and<br />
thorn<br />
2 (3.85<br />
)<br />
Total 52(100<br />
)<br />
* Sinkita and kenchibe are kinds <strong>of</strong> bush trees. Satera is a grass material<br />
Households with RWH technology were<br />
asked to list problems they encountered<br />
during implementation and utilization <strong>of</strong> the<br />
technology. These include problems related<br />
to RWH pond (33.7%), 37.9% <strong>of</strong> the total<br />
frequency <strong>of</strong> responses represents problems<br />
related with lack <strong>of</strong> equipments, 5.76% <strong>of</strong><br />
responses mentioned problems related with<br />
agricultural inputs and 9.47% cited problems<br />
related with health. Thus, problem <strong>of</strong><br />
equipment for water lifting and application<br />
is shown to be the dominant one with<br />
37.9%.<br />
243
Of the pond related problems, accident on<br />
animals and kids, absence <strong>of</strong> ro<strong>of</strong> cover<br />
followed by quick dry up <strong>of</strong> the accumulated<br />
water problems take the highest share <strong>of</strong><br />
39.4, 36.8 and 14.4 percent respectively.<br />
The highest percentage observed in the<br />
accident could be due to absence <strong>of</strong> cover<br />
for the pond, absence <strong>of</strong> fence to the pond,<br />
and wrong location <strong>of</strong> the pond which might<br />
increase accident on kids due to closeness to<br />
the house. The high proportion <strong>of</strong> uncovered<br />
ponds could be due to lack <strong>of</strong> finance or<br />
may be due to less awareness given by the<br />
experts or probably due to weakness <strong>of</strong> the<br />
households. Quick dry up <strong>of</strong> the pond water<br />
could be related to the RWH technology or<br />
structural design <strong>of</strong> the technology which<br />
emanates from lack <strong>of</strong> extension workers<br />
with the necessary skill about the technology<br />
during construction or even lack <strong>of</strong> ro<strong>of</strong><br />
cover for the pond.<br />
Furthermore, <strong>of</strong> the problems related to<br />
equipments used during pond utilization, the<br />
respondents mainly focused on the problem<br />
<strong>of</strong> water lifting equipment and lifting <strong>of</strong><br />
water from the pond representing (around<br />
78%). This is followed by problem <strong>of</strong> water<br />
application by using heavy materials<br />
reducing interest to produce vegetables in a<br />
wider place accounting around 42%.In<br />
summary, majority <strong>of</strong> the problems cited by<br />
respondent households revolves around two<br />
issues: those related to RWH ponds and<br />
equipment problems.<br />
Possible solutions were suggested by<br />
households with RWH technology to<br />
overcome the aforementioned problems.<br />
Most <strong>of</strong> the solutions suggested focuses<br />
mainly on the need for government support<br />
in terms <strong>of</strong> finance, arranging training or<br />
experience sharing tour to household heads.<br />
Lack <strong>of</strong> equipments needed and problems<br />
related to RWH pond being the dominant<br />
problems observed, 81.5% <strong>of</strong> the households<br />
responded that they need government<br />
support or other organization to supply them<br />
with more simple modern materials either by<br />
sharing 50% <strong>of</strong> the cost or via long term<br />
credit so that they can produce more. About<br />
40.8% <strong>of</strong> the households suggest support<br />
from government to avoid waste <strong>of</strong> labor<br />
power and time in the process <strong>of</strong> water<br />
application; we need more simple modern<br />
materials either in the market at lower cost<br />
or via long term credit since the price <strong>of</strong><br />
water lifting and watering equipments are<br />
unaffordable at household level.<br />
In addition, for problems related to RWH<br />
ponds, governments or other organizations<br />
help or credit to make them buy iron ro<strong>of</strong><br />
since other raw material don’t stay long and<br />
the need for pr<strong>of</strong>essional help on the need <strong>of</strong><br />
having cover and fence to minimize risk<br />
accounts 38.1% each. On the other hand,<br />
18.3% indicates the need to have continuous<br />
assessment to have positive impact on how<br />
to use and produce in each season and will<br />
help to give solution for problems that<br />
household face.<br />
Households with RWH technology were<br />
asked to list benefits they get after they start<br />
to use the technology, and in general the<br />
total frequency <strong>of</strong> responses (251) reported<br />
the benefits sited by farmers are classified in<br />
to four major categories. As can be seen<br />
from <strong>Table</strong> 8, these includes new things<br />
found after they start to utilize pond<br />
(48.21%), 39.4% <strong>of</strong> the total frequency <strong>of</strong><br />
responses represents benefits related to<br />
water supply or availability, 11.6% <strong>of</strong> the<br />
responses mentioned benefits related with<br />
production side and 0.8% are those related<br />
to individual opinions.<br />
244
<strong>Table</strong> 8. List <strong>of</strong> Benefits<br />
Se<br />
.N<br />
o<br />
CATEGORY OF THE BENEFITS<br />
REPORTED<br />
<strong>Water</strong> New Productio Individua<br />
supply things n side l<br />
for<br />
opinions<br />
1 domestic use 33 (43.4) 33<br />
(13.15)<br />
2 new food varieties in our diet 47(61.7) 47(18.7<br />
3)<br />
3 Reduce consumption expenditure by<br />
producing what we used to buy from the<br />
market<br />
4 For animals especially for those who<br />
can’t go long distance to drink water.<br />
5 It was able to get water for households<br />
easily and timely<br />
6 Produce vegetable beyond home<br />
consumption and get money to be used<br />
for different purposes by selling the<br />
remaining amount.<br />
7 Helps to use water for permanent plants<br />
during the dry season e.g. Chat, C<strong>of</strong>fee,<br />
Papaya etc<br />
8 Enable us to produce more than once in<br />
a year by using the pond water during<br />
dry spell period<br />
9 create new job opportunity by<br />
developing the habit <strong>of</strong> working in dry<br />
season and use their time better than<br />
before<br />
10 Can avoid dry up <strong>of</strong> pepper nursering<br />
by using water in the pond<br />
11 The negative side out weights positive<br />
one because the pond construction isn’t<br />
dome well and it has no plastic cover<br />
12 I’m glad that the pond isn’t covered by<br />
plastic or cement basement because it<br />
will help not to create bad smell when<br />
small animals died<br />
Total 99(39.4 ) 121(48.2<br />
1 )<br />
Total<br />
28(36.8) 28(11.1<br />
6)<br />
37(48.7) 37(14.7<br />
)<br />
29(38. 2) 29(11.<br />
55)<br />
26(34.1) 26(10.<br />
36)<br />
6(7.8) 6(2.<br />
39)<br />
9(11.8) 9(3.<br />
59)<br />
20(26. 3) 20(7.97<br />
)<br />
14(18.4) 14(5.58<br />
)<br />
1(1. 3) 1(0.4 )<br />
1(1. 3) 1(0.4 )<br />
29(11.6 ) 2( 0.8) 251(10<br />
0)<br />
Of the new benefits observed, 61.7% <strong>of</strong> the<br />
households respond the existence <strong>of</strong> new<br />
food varieties in their diet while 36.8, 34.1<br />
and 26.3 percent are reduction in<br />
consumption expenditure by producing what<br />
we used to buy from the market, produce<br />
vegetable beyond home consumption and<br />
sell the remaining to use the money for<br />
different purposes and creation <strong>of</strong> new job<br />
opportunity by developing the habit <strong>of</strong><br />
working in dry season and use their time<br />
which isn’t known before respectively. In<br />
245
addition, the existence <strong>of</strong> water in their<br />
compound was seen as beneficial for<br />
animals especially for those who can’t travel<br />
long distance to drink water and help the<br />
household to get water easily and timely<br />
instead <strong>of</strong> holding heavy material for a long<br />
distance to fetch water with 48.7% and<br />
38.2% respectively. Finally, from the<br />
production side, 18.4% <strong>of</strong> the households<br />
responded that it is used to avoid nursering<br />
<strong>of</strong> pepper from being dried while 11.8% <strong>of</strong><br />
them responded that it helps to produce<br />
more than once in a year using the water<br />
during dry season and 7.8% use the water<br />
for permanent plants during the dry season.<br />
Finally, half <strong>of</strong> the sampled households<br />
were asked about the factors hindering<br />
them from adopting the technology. Of<br />
the total responses reported, reasons<br />
mentioned related to lack <strong>of</strong> financial<br />
capital problems represent 41.8%<br />
particularly related to poor economic<br />
situation to cover cost involved in pond<br />
implementation. Besides, 17.2% <strong>of</strong> them<br />
are related with lack <strong>of</strong> knowledge and<br />
follow up on the technology and most<br />
people don’t think that it will give that<br />
much benefit. Where as, problem <strong>of</strong> raw<br />
materials mainly due to unfair<br />
distribution <strong>of</strong> raw materials needed to<br />
take out the water inside, plot/farm land<br />
due to small size land around the<br />
homestead and other reasons which<br />
mainly includes less work initiation<br />
mentioned account for 10.7% each from<br />
the total responses reported.<br />
Gender and RWH Technologies<br />
At present, there is a growing tendency<br />
towards the adoption <strong>of</strong> low cost and simple<br />
alternative water management technologies<br />
like rainwater harvesting technologies.<br />
RWH technologies have the potential to<br />
contribute towards the Millennium<br />
Development Goals (MDGs) with a view <strong>of</strong><br />
eradicating poverty and hunger, provision <strong>of</strong><br />
safe drinking water and sanitation, ensuring<br />
environmental sustainability, promoting<br />
gender equity and women empowerment. It<br />
is one way <strong>of</strong> improving the living<br />
conditions <strong>of</strong> millions <strong>of</strong> people, particularly<br />
those living in the dry areas. <strong>Water</strong> scarcity<br />
especially for domestic and agricultural<br />
purposes compromises the role <strong>of</strong> women in<br />
food production. Hence, provision <strong>of</strong> water<br />
by promoting rainwater harvesting and<br />
management technologies reduces the<br />
burden on rural women and thus increasing<br />
their productivity.<br />
This part tries to see the participation <strong>of</strong><br />
women in male headed households in<br />
planning and decision making stage,<br />
construction, maintenance, clearance and<br />
watching stages. In addition, it will try to<br />
address the question if women are benefited<br />
and in what terms, and the reasons if they<br />
aren’t benefited from adoption <strong>of</strong> the<br />
technology. Besides, female headed<br />
households were asked if they are selected<br />
as beneficiaries and how they are selected,<br />
and if not, why not. The constraints that they<br />
face to use RWH technology are also<br />
considered.<br />
Most households replied that there is equal<br />
responsibility among women and men to<br />
participate in planning and decision making<br />
accounting for 85.5% <strong>of</strong> the total rainwater<br />
harvesting technology adopters. This is<br />
followed by 17.1% <strong>of</strong> households who have<br />
mentioned that during planning, the women<br />
suggest the time for the work to provide a<br />
better food service. With regard to<br />
construction, 57.9% <strong>of</strong> the households said<br />
that, women participated directly (by<br />
supplying water) and indirectly (by<br />
preparing food and c<strong>of</strong>fee) for workers. And<br />
about 33% <strong>of</strong> the households suggested that,<br />
women assisted by providing the needed raw<br />
material (like stone, sand, cement from<br />
home to where they work etc) and removing<br />
the soil from around the pond to a bit far<br />
area.<br />
In the case <strong>of</strong> women participation in<br />
maintenance, clearance and watching,<br />
246
72.4% <strong>of</strong> the households responded that they<br />
mainly participate in watching kids and<br />
animals from getting into the pond<br />
accidentally since they spent most <strong>of</strong> their<br />
time at home. This is followed by their<br />
participation in cleaning the area <strong>of</strong> the pond<br />
accounting 55.3%. Women participation<br />
during the dry season to carry out soil or<br />
sand that enters into the ponds in rainy<br />
season has taken 50% <strong>of</strong> the household’s<br />
response. And about 30% <strong>of</strong> the households<br />
participated in maintenance by bringing<br />
water, raw material, food service and<br />
protecting the pond from being destroyed.<br />
In relation to female headed households,<br />
67.1% <strong>of</strong> the households who adopt RWH<br />
technology responded that they aren’t<br />
selected as beneficiaries whereas the<br />
remaining 32.9% replied that they are<br />
selected to be beneficiaries. Out <strong>of</strong> those<br />
households who responded that femaleheaded<br />
households are not selected to be<br />
beneficiaries, 68.6% <strong>of</strong> them mentioned that<br />
the main reason is economic and manpower<br />
problem. Less interest and initiation due to<br />
less participation in agricultural work<br />
account for 17.6% <strong>of</strong> the household’s<br />
response. About 16% <strong>of</strong> the households<br />
responded that bias exists towards male<br />
headed households on the ground that the<br />
ladies can’t go through the hard work, and<br />
the same percentage for the reason that they<br />
don’t have anyone to teach them about its<br />
use and purpose indicating less knowledge<br />
about the work. On the other hand, out <strong>of</strong><br />
those households who responded that<br />
female-headed households are selected to be<br />
beneficiaries, 52% said that government or<br />
agricultural extension is voluntary to give<br />
chance for anybody depending on their<br />
working ability in agriculture. About 44%<br />
replied that it depends on their capacity to<br />
cover cost involved in pond construction.<br />
Moreover, 36% <strong>of</strong> them responded that it is<br />
their own initiation that matters.<br />
With regard to the benefits achieved by<br />
women from the adoption <strong>of</strong> the technology,<br />
about 78% <strong>of</strong> the households responded that<br />
they are beneficiaries in terms <strong>of</strong> reduction<br />
in expenditure by using vegetable produced<br />
for home consumption and selling the<br />
remaining. More over, 61.8% <strong>of</strong> the<br />
households consider the time saved that<br />
would have been wasted in fetching water<br />
and 22.4% on ability to eat different and<br />
new food varieties.<br />
Generally, the result implies that women are<br />
getting benefit from the technology adoption<br />
as any member <strong>of</strong> the family. Their<br />
participation in the technology adoption is<br />
mainly in watching the ponds. They also<br />
have contribution in planning and decision<br />
making stage, and in giving support during<br />
construction, maintenance and clearance <strong>of</strong><br />
the pond. Female headed households are<br />
being constrained to be beneficiaries due to<br />
economic and manpower shortage.<br />
5. Conclusions and Recommendations<br />
Conclusions<br />
Due to population increase in the highland<br />
areas, more and more marginal areas are<br />
being used for agriculture which led to the<br />
degradation <strong>of</strong> the natural resources .One <strong>of</strong><br />
the major challenges to rural development in<br />
the country is how to promote food<br />
production to meet the ever-increasing<br />
demand <strong>of</strong> the growing population. Rainfall<br />
in the arid and semi-arid areas is generally<br />
insufficient to meet the basic needs <strong>of</strong> crop<br />
production. In degraded areas with poor<br />
vegetation cover and infertile soil, most <strong>of</strong><br />
the rainfall is lost through direct evaporation<br />
or uncontrolled run<strong>of</strong>f. Thus, overcoming<br />
the limitations <strong>of</strong> these arid and semi-arid<br />
areas and making good use <strong>of</strong> the vast<br />
agricultural potential under the Ethiopian<br />
context, is a necessity rather than a choice.<br />
Hence, to alleviate these development<br />
constraints, the Federal government and<br />
Regional states, and NGOs working in<br />
research and development, have invested<br />
huge resource on rainwater harvesting<br />
technology.<br />
In this study, methodologies including<br />
descriptive(cropping pattern), econometrics<br />
and qualitative analysis are used to assess<br />
247
the determinants <strong>of</strong> households’ adoption <strong>of</strong><br />
rainwater harvesting ponds, and its impact<br />
on agricultural intensification and yield in<br />
Alaba Woreda, southern Ethiopia. Interview<br />
has also been done with experts on rainwater<br />
harvesting ponds.<br />
The finding in the cropping pattern shows<br />
that, farm households have started to grow<br />
new crops (vegetables and perennial crops)<br />
as a result <strong>of</strong> water availability from the<br />
water harvesting ponds. The crops are those<br />
which are highly priced and marketable ones<br />
implying the potential <strong>of</strong> RWH technologies<br />
to enhance a farm household’s income.<br />
However, the benefit depends on market and<br />
infrastructure accessibility, and<br />
diversification in the types <strong>of</strong> the crops.<br />
Results <strong>of</strong> Probit analysis on the<br />
determinants <strong>of</strong> adoption <strong>of</strong> rainwater<br />
harvesting ponds shows that household size,<br />
education status <strong>of</strong> household head,<br />
ownership <strong>of</strong> livestock (cattle, oxen and<br />
pack animals), homestead plots and type <strong>of</strong><br />
pond explained adoption statistically<br />
significantly.<br />
In accordance with government’s target, the<br />
Ordinary Least Square estimation <strong>of</strong> the<br />
determinants <strong>of</strong> the value <strong>of</strong> crop production<br />
shows that adoption <strong>of</strong> RWH has a positive<br />
and statistically significant effect on value <strong>of</strong><br />
crop production, after controlling for input<br />
use and other factors. This shows that RWH<br />
ponds have direct and significant impact on<br />
value <strong>of</strong> crop production. We also find that<br />
households with RWH technology use more<br />
labor and seed but less oxen power<br />
compared with those households who have<br />
not adopted the technology. Moreover, labor<br />
and seed inputs have positively significant<br />
impact on yield while the effect <strong>of</strong> oxen<br />
power is insignificant. These results show<br />
that in addition to its direct impact, RWH<br />
has significant indirect impact on value <strong>of</strong><br />
crop production through its effect on<br />
intensity <strong>of</strong> input use.<br />
Results <strong>of</strong> the qualitative information,<br />
consistent, with the crop mix and<br />
econometric results, also showed that<br />
households started to grow crops that<br />
weren’t grown previously. In addition, it<br />
indicates that effectiveness <strong>of</strong> the<br />
technology adoption is mainly constrained<br />
by problems related to water lifting and<br />
watering equipments, and accidents<br />
occurring due to absence <strong>of</strong> ro<strong>of</strong> cover and<br />
fence to the ponds. Generally, directly or<br />
indirectly, labor requirements and cost<br />
considerations appear to be important<br />
factors that influence household’s adoption<br />
<strong>of</strong> RWH technology.<br />
Recommendations<br />
The benefit found from the high valued and<br />
perishable commodities due to RWH,<br />
depends on market and infrastructure<br />
accessibility, and diversification in the types<br />
<strong>of</strong> the crops. Thus, efforts should be made to<br />
assess various agricultural commodities as<br />
well as giving emphasis to marketing<br />
extension, especially in facilitating markets<br />
and market linkages to farmers.<br />
The impact <strong>of</strong> household RWH technology<br />
adoption on the value <strong>of</strong> crop yield has been<br />
found to be stastically significant. Therefore,<br />
to mitigate the erratic nature <strong>of</strong> rain fall in<br />
the arid and semi-arid parts <strong>of</strong> the country,<br />
development and implementation <strong>of</strong> rain<br />
water harvesting technologies will be<br />
helpful to promote productivity and<br />
sustainable intensification <strong>of</strong> the rain fed<br />
agriculture.<br />
However, the success <strong>of</strong> the technology<br />
adoption is mainly constrained by problems<br />
related to water lifting and watering<br />
equipments, and accidents occurring due to<br />
absence <strong>of</strong> ro<strong>of</strong> cover and fence to the<br />
ponds. This implies that support will be<br />
needed to provide affordable but improved<br />
water lifting and watering equipments, and<br />
give training to farm households on<br />
construction and use <strong>of</strong> ro<strong>of</strong> covers and<br />
fences to the ponds.<br />
Labor requirements and cost considerations<br />
appear to be important factors that influence<br />
household’s adoption <strong>of</strong> RWH technology.<br />
This implies that research and development<br />
interventions need to take account <strong>of</strong> the<br />
labor and cost demands <strong>of</strong> the technology.<br />
248
RESULTS OF ECONOMETRIC ESTIMATION<br />
<strong>Table</strong>-2 Determinants <strong>of</strong> adoption <strong>of</strong> RWH pond (Probit)<br />
Probit use <strong>of</strong> RWH technology<br />
Explanatory Variables<br />
Coefficient Z<br />
P>z<br />
(dF/dx) ‡<br />
Peasant association dummy,cf., Mudda Dinokosa<br />
Ulegebba Kukke -0.0007837* -1.85 0.065<br />
Andegna Hansha -0.0004302 -1.01 0.312<br />
Hamata -0.0003513 -0.72 0.472<br />
Household access to services and infrastructure<br />
Walking time to the nearest town market (in hrs) -0.0001269 -0.61 0.545<br />
Walking time to the nearest village market (in hrs) 0.0001965 1 0.316<br />
Walking time to the nearest cooperative shops (in hrs) 0.0001392 0.52 0.603<br />
Walking time to the nearest all weather road (in hrs) 0.0002143 1.02 0.308<br />
Walking time to the nearest seasonal road (in hrs) -0.0000296 -0.06 0.954<br />
Rain fall condition, cf., low<br />
Medium -0.0004712 -0.84 0.401<br />
High -0.000446 -1.46 0.145<br />
Household size 0.000111** 1.96 0.05<br />
Age <strong>of</strong> household head ( in Ln) 0.0002167 0.29 0.772<br />
Education level <strong>of</strong> household head, cf., illiterate<br />
Read and write 0.0079635*** 3.25 0.001<br />
Up to 4th grade 0.0018686 1.44 0.149<br />
Up to 7th grade 0.00026301* 1.86 0.063<br />
Up to 10th grade 7.41E-06 0.01 0.991<br />
Household resource endowment<br />
Land owned (in ha) -0.000184 -0.85 0.395<br />
Value <strong>of</strong> cattle (both local & cross bred cows, calves, heifers, yearling, bulls) 3.59E-07** 1.98 0.048<br />
Value <strong>of</strong> oxen (local and breed) 5.24E-07** 2.2 0.027<br />
Value <strong>of</strong> sheep and goat -4.44E-07 -0.72 0.472<br />
Value <strong>of</strong> pack animals (donkey, horse, mule) 6.69E-07* 1.88 0.06<br />
Value <strong>of</strong> poultry (both local & improved) 2.19E-07 0.64 0.519<br />
Value <strong>of</strong> beehives (improved, modified, traditional) 3.85E-08 0.27 0.79<br />
Value <strong>of</strong> all assets owned (plow set, farm equip, motor pump, radio,.. -3.23E-08 -0.33 0.74<br />
Household membership in local organization,<br />
cf., members in Edir and other local organizations<br />
Membership in Edir only 0.0002847 0.7 0.487<br />
Household membership in associations, cf., association members<br />
No membership in association -9.37E-06 -0.02 0.985<br />
Household financial capital , 1= yes<br />
Household with credit Access,1= yes -0.0000753 -0.17 0.865<br />
Household savings, yes=1 -0.0002764 -0.71 0.478<br />
How household acquired the plot, cf., rented and share cropping<br />
Allocated by the state 0.5627719 0.00 0.997<br />
Inherited 0.5999944 0.00 0.998<br />
Slope <strong>of</strong> the plot, cf., steep slope<br />
Flat 0.0044407 0.00 0.999<br />
Moderate 0.0686505 0.00 0.999<br />
Soil depth <strong>of</strong> the plot, cf., deep<br />
Shallow -0.0002766 -0.32 0.751<br />
Medium -0.0001365 -0.11 0.912<br />
Soil fertility level <strong>of</strong> the plot, cf., low fertility<br />
High fertility 0.0141321 1.25 0.21<br />
Moderate fertility 0.0010029 1.11 0.267<br />
Purpose for which the land is used, cf., grazing ,woodlots and spice land<br />
Cropland -0.0002559 -0.33 0.74<br />
Homestead 0.0695164*** 4.8 0.000<br />
Plot size in ha (in Ln) 0.0005554 0.94 0.345<br />
Walking distance from household's residence to the plot (in hrs) -0.00168 -0.72 0.472<br />
Type <strong>of</strong> pond, cf., ponds with plastic cover and those without a cover<br />
Ponds with concrete basement -0.377571*** -4.54 0.000<br />
Number <strong>of</strong> observations 1036<br />
LR chi2 (41) 350.92<br />
Prob > chi2 0.0000<br />
Pseudo R2 0.6399<br />
*** is significant at 1%; ** is significant at 5%; * is significant at 10%<br />
‡Reported coefficients represent effect <strong>of</strong> a unit change in explanatory variable on probability <strong>of</strong> adopting RWH technology.<br />
249
<strong>Table</strong> – 3 Determinant factors <strong>of</strong> input use during 2005/06 agricultural fiscal year<br />
Whether<br />
fertilizer<br />
were used<br />
Whether<br />
manure/compos<br />
t were used<br />
Ln (Oxendays/haday/ha)<br />
Ln (Labor-<br />
Explanatory Variables Ln (Seed/ha)<br />
Peasant association dummy,cf., Mudda Dinokosa<br />
Ulegebba Kukke -0.245172 0.15099* 0.058052 0.0655231 -0.0197904<br />
Andegna Hansha 0.214534 0.203828*** 0.039733 -0.1935646*** 0.079232<br />
Hamata 0.001953 0.168604** 0.172659** -0.1475076** -0.0190538<br />
Household access to services and infrastructure<br />
Walking time to the nearest town market (in hrs) -0.104291** -0.016135 0.020109 0.206203 -0.0265866*<br />
Walking time to the nearest village market (in hrs) -0.125701** -0.072537*** -0.117138*** -0.0425217* -0.0363848**<br />
Walking time to the nearest cooperative shops (in hrs) 0.034241 -0.02963 -0.057824* -0.0280787 -0.0054926<br />
Walking time to the nearest all weather road (in hrs) 0.040986 -0.011034 0.022569 -0.0090631 0.0078478<br />
Walking time to the nearest seasonal road (in hrs) 0.184175 0.097555 -0.110871* 0.0753763 -0.129366***<br />
Rain fall condition, cf., low<br />
Medium -0.084553 0.112657** -0.054333 0.0087776 0.0026803<br />
High -0.091135 0.008501 -0.212387*** 0.0527761 0.2818222***<br />
Household size 0.026266* 0.021049*** 0.043193*** -0.0024128 0.0094189*<br />
Age <strong>of</strong> household head ( in Ln) 0.125784 0.108762 -0.181818* -0.0654953 0.0254648<br />
Education level <strong>of</strong> household head, cf., illiterate<br />
Read and write 0.230052* 0.231572*** -0.087174 -0.0931605 0.0654167<br />
Up to 4th grade 0.257753* 0.192213*** -0.078671 0.0288443 -0.0862418**<br />
Up to 7th grade 0.083556 -0.024551 0.002305 -0.0171464 0.0307067<br />
Up to 10th grade 0.071938 0.080617 -0.053017 -0.0293807 -0.0785635<br />
Household resource endowment<br />
Land owned (in ha) 0.007845* 0.006203** 0.00167 0.0027194 -0.0037889**<br />
Value <strong>of</strong> cattle (both local & cross bred cows, calves, heifers,<br />
yearling, bulls) -1.73E-05 -5.90E-05 -6.98E-05*** 4.99E-06 -0.0000345**<br />
Value <strong>of</strong> oxen (local and breed) 4.28E-05 2.83E-05 4.82E-05* 0.0000103 0.0000485***<br />
Value <strong>of</strong> sheep and goat 0.000167 0.000129* -9.97E-07 -5.99E-06 -5.83E-06<br />
Value <strong>of</strong> pack animals (donkey, horse, mule) -0.000118 -0.000051 -8.93E-05** 7.97E-06 -5.84E-06<br />
Value <strong>of</strong> poultry (both local & improved) -0.000809 0.000172 0.000323 -0.00039 0.0003529<br />
Value <strong>of</strong> beehives (improved, modified, traditional) -0.00041 0.000376* 0.000197 0.0003235* -0.0004251***<br />
Value <strong>of</strong> all assets owned (plow set, farm equip, motor pump,<br />
radio, ...) 3.62E-06 -1.66E-05 -2.19E-05 7.05E-06 -3.57E-06<br />
Household membership in local organization,<br />
cf., members in Edir and other local organizations<br />
Membership in Edir only -0.215644 -0.115894 -0.210552*** -0.089469 0.0591204<br />
Household membership in associations, cf., association members<br />
No membership in association -0.094869 -0.191782*** 0.042779 -0.0621948 -0.0014808<br />
Household financial capital , 1= yes<br />
Household with credit Access,1= yes -0.137139 0.070683 -0.06814 0.0624094 0.056192*<br />
Household savings, yes=1 -0.072473 -0.327655*** -0.114424** 0.0126967 0.1128724***<br />
250
<strong>Table</strong> – 3 continued<br />
Explanatory Variables Ln (Seed/ha)<br />
How household acquired the plot, cf.,<br />
rented and share cropping<br />
Ln (Oxenday/ha)<br />
Ln (Laborday/ha)<br />
Whether<br />
fertilizer<br />
were used<br />
Whether<br />
manure/compost<br />
were used<br />
Allocated by the state -0.506682*** -0.141824* 0.084312 -0.1988535*** 0.158752***<br />
Inherited -0.382232*** -0.169708** -0.111456* -0.1364283** 0.1498123**<br />
Slope <strong>of</strong> the plot, cf., steep slope<br />
Flat -0.119189 0.530278* 0.446515* 0.1701381 0.3856669*<br />
Moderate -0.10287 0.51544* 0.547266** 0.1265144 0.2790531**<br />
Soil depth <strong>of</strong> the plot, cf., deep<br />
Shallow -0.021532 0.129045 -0.117212 -0.0475644 0.2127672<br />
Medium -0.000324 -0.300583*** -0.315847*** 0.0428845 0.1378711*<br />
Soil fertility level <strong>of</strong> the plot,<br />
cf., low fertility<br />
High fertility 0.048873 0.101733 0.035063 -0.0829447 0.1586607**<br />
Moderate fertility 0.144556 0.089368 0.062933 -0.0517906 0.479061<br />
Purpose for which the land is used,<br />
cf., grazing ,woodlots and spice land<br />
Crop land 0.419156*** 0.37224*** 0.614584*** 0.4647761*** -0.0924947**<br />
Homestead 3.09079*** -0.340097*** -0.472505*** -0.5890224*** 0.4247779***<br />
Plot size in ha (in Ln) -0.180882 -0.912926*** -0.779754*** -0.2589599*** 0.539933<br />
Walking distance from household's<br />
residence to the plot (in hrs) 3.312421 0.011153 -0.12605 0.2058507** -0.1616669<br />
Adoption <strong>of</strong> Rain <strong>Water</strong> Harvesting<br />
technology (predicted value), 1=yes 3.312421*** -0.291091* 0.265723* 0.1043238 0.0748814<br />
Constant 4.448353*** 4.83144*** 6.78531***<br />
Number <strong>of</strong> observations 1036 1036 1036 1036 1036<br />
F (41,994) 8.80 14.08 14.46<br />
Prob > F 0.0000 0.0000 0.0000<br />
R squared<br />
LR chi2 (41) 281.62 353.37<br />
Prob > chi2 0.0000 0.0000<br />
Pseudo R2 0.1964 0.3137<br />
*** is significant at 1%; ** is significant at 5%; * is significant at 10%<br />
Reported coefficients represent effect <strong>of</strong> a unit change in explanatory variable on probability <strong>of</strong> use <strong>of</strong> the mean <strong>of</strong> the data<br />
Ln represents natural logarithm<br />
251
<strong>Table</strong> – 4 Determinants factors <strong>of</strong> value <strong>of</strong> crop yield<br />
Ln (Value <strong>of</strong> yield/ha)<br />
Reduced<br />
Explanatory Variables Full Model ‡ Structural Model Model<br />
Peasant association dummy,cf., Mudda Dinokosa<br />
Ulegebba Kukke -0.240465** -0.16942** -0.272749***<br />
Andegna Hansha -0.091321 -0.05626 -0.101886<br />
Hamata -0.332615*** -0.29741*** -0.387513***<br />
Household access to services and infrastructure<br />
Walking time to the nearest town market (in hrs) -0.037325 -0.02798 -0.037513<br />
Walking time to the nearest village market (in hrs) 0.039986 0.041098 0.01502<br />
Walking time to the nearest cooperative shops (in hrs) -0.017744 -0.03863 -0.016557<br />
Walking time to the nearest all weather road (in hrs) -0.020955 -0.01405 -0.020943<br />
Walking time to the nearest seasonal road (in hrs) -0.13985* -0.16159** -0.083644<br />
Rain fall condition, cf., low<br />
Medium 0.016212 0.01092 0.003531<br />
High 0.10563 0.095822 0.08433<br />
Household size 0.008924 0.015446*<br />
Age <strong>of</strong> household head ( in Ln) -0.1558997 -0.13447<br />
Education level <strong>of</strong> household head, cf., illiterate<br />
Read and write 0.007438 -0.059152<br />
Up to 4 th grade 0.064804 0.110153<br />
Up to 7 th grade 0.058197 0.079857<br />
Up to 10th grade 0.123428 0.107066<br />
Household resource endowment<br />
Land owned (in ha) 0.00154 0.0031<br />
Value <strong>of</strong> cattle (both local & cross bred cows, calves, heifers, yearling, bulls) 4.44E-05* 4.55E-05*<br />
Value <strong>of</strong> oxen (local and breed) -3.44E-05 -1.22E-05<br />
Value <strong>of</strong> sheep and goat 9.65E-05 8.20E-05<br />
Value <strong>of</strong> pack animals (donkey, horse, mule) 8.94E-06 -3.14E-05<br />
Value <strong>of</strong> poultry (both local & improved) 0.000275 0.00021<br />
Value <strong>of</strong> beehives (improved, modified, traditional) 4.64E-06 -3.61E-05<br />
Value <strong>of</strong> all assets owned (plow set, farm equip, motor pump, radio, ..) -8.60E-06 -7.41E-07<br />
Household membership in local organization,<br />
cf., members in Edir and other local organizations<br />
Membership in Edir only -0.12421 -0.14033<br />
Household membership in associations, cf., association members<br />
No membership in association 0.133489* 0.077884<br />
Household financial capital , 1= yes<br />
Household with credit Access,1= yes 0.084706 0.045664<br />
Household savings, yes=1 0.01175 -0.000479<br />
How household acquired the plot, cf., rented and share cropping<br />
Allocated by the state 0.285989*** 0.220717*** 0.175439**<br />
Inherited 0.14397* 0.09171 0.047545<br />
252
<strong>Table</strong> – 4 continued<br />
Ln (Value <strong>of</strong> yield/ha)<br />
Explanatory Variables Full Model Structural Model Reduced Model<br />
Slope <strong>of</strong> the plot, cf., steep slope<br />
Flat 0.107935 -0.05085 0.157219<br />
Moderate 0.213 0.052619 0.253161<br />
Soil depth <strong>of</strong> the plot, cf., deep<br />
Shallow -0.342699** -0.2061 -0.276843*<br />
Medium -0.320594** -0.2085 -0.269564*<br />
Soil fertility level <strong>of</strong> the plot, cf.,low fertility<br />
High fertility 0.083002 0.12039 0.042061<br />
Moderate fertility 0.10888 0.136898* 0.099062<br />
Purpose for which the land is used, cf.,grazing ,woodlots and spice land<br />
Cropland 0.545698*** 0.53749*** 0.692927***<br />
Homestead 0.22273* 0.273696*** 0.376867***<br />
Plot size in ha (in Ln) -0.056483 -0.02842 -0.123963*<br />
Walking distance from household's residence to the plot (in hrs) 0.085783 0.101174 0.077678<br />
Labor-day/ha (in Ln) 0.101176*** 0.110689***<br />
Oxen-day/ha (in Ln) 0.018104 0.006066<br />
Seed/ha (in Ln) 0.086711*** 0.086715***<br />
Use <strong>of</strong> fertilizer,1= yes 0.164603*** 0.171696***<br />
Use <strong>of</strong> manure/compost, 1= yes -0.115259* -0.11909*<br />
Adoption <strong>of</strong> Rain <strong>Water</strong> Harvesting technology (predicted value),1=yes 0.055424 0.510136***<br />
Constant 6.686813* 6.272492*** 7.859654***<br />
Number <strong>of</strong> observations 1036 1036 1036<br />
F (46,989) 8.11<br />
F(27,1008) 12.18<br />
F (41,994) 6.14<br />
Prob > F 0.0000 0.0000 0.0000<br />
R squared 0.125 0.0967 0.0953<br />
*** is significant at 1%; ** is significant at 5%; and * is significant at 10%.<br />
Ln= natural logarithm.<br />
‡ Reported coefficients represent effect <strong>of</strong> a unit change in explanatory variable on probability <strong>of</strong> use <strong>of</strong> the mean <strong>of</strong> the data.<br />
Variables that were jointly statistically insignificant in the unrestricted OLS regression were excluded from the structural model<br />
253
Reference:<br />
Demeke M. and Ferede T., (2005). The<br />
Performance <strong>of</strong> Grain Marketing in<br />
Ethiopia: The Case <strong>of</strong> Addis<br />
Ababa Central Market, in S. W. Omamo,<br />
S. Babu, and A. Temu (eds) “The Future<br />
<strong>of</strong> Smallholder Farming in Eastern<br />
Africa: The Roles <strong>of</strong> states, markets and<br />
civil society”, IFPRI Eastern Africa<br />
Food Policy Network Report.<br />
Desta L., 2004. Concepts <strong>of</strong> Rainwater<br />
Harvesting and Its Role in Food Security<br />
– The Ethiopian Experience. Paper<br />
presented on a National <strong>Water</strong> Forum,<br />
Addis Ababa October 25-26, 2004.<br />
Ministry <strong>of</strong> <strong>Water</strong> Resources.<br />
FAO. 1993. Irrigation <strong>Water</strong> Delivery<br />
Model. Food and Agriculture<br />
Organization; <strong>Water</strong> Reports No. 7<br />
Rome, Italy.<br />
Gebeyehu A., 2006.<strong>Water</strong> for growth and<br />
poverty alleviation. Paper submitted to<br />
Ethiopian Economic Association.<br />
Gebremedhin B., Pender J. and Tesfaye G.,<br />
2000.Community<br />
Resource<br />
<strong>Management</strong>: The case <strong>of</strong> grazing lands<br />
In Tigray, Northern Ethiopia. In: Jabbar<br />
M. A., Pender J., and Ehui S. (Eds.),<br />
Policies for Sustainable Land<br />
<strong>Management</strong> in the Highlands <strong>of</strong><br />
Ethiopia. Proceeding <strong>of</strong> a workshop held<br />
at The <strong>International</strong> Livestock Research<br />
<strong>Institute</strong> (ILRI). Addis Ababa, Ethiopia,<br />
22-23 May 2000. Workshop Summary<br />
Paper No.9.<br />
Gebremedhin B., Pender J. and Tesfaye G.,<br />
2002. Nature and determinants <strong>of</strong><br />
collective action for Woodlot<br />
management in northern Ethiopia. Socio-<br />
Economic and Policy Research Working<br />
Paper40. ILRI (<strong>International</strong> Livestock<br />
Research <strong>Institute</strong>), Addis Ababa,<br />
Ethiopia.<br />
Hatibu N., Senkondo M. , Mutabazi K. and<br />
Msangi K. “Economics <strong>of</strong> Rainwater<br />
Harvesting for Crop Enterprise in Semi-<br />
Arid Areas” downloaded from<br />
www.regional.org.au/cs/2004/symposia/<br />
1/4/276_hatibu.htm , accessed in<br />
October 2004<br />
Kerr, J. M. and Kimberly, R. C., 2005.<br />
Evaluating <strong>Water</strong>shed Project<br />
Performance in India: A Practical<br />
Econometric Approach. In: Shiferaw, B.,<br />
Freeman, H. A., and Swinton, S. M.<br />
(Eds.) Natural Resource <strong>Management</strong> in<br />
Agriculture: Methods for Assessing<br />
Economic and Environmental Impacts.<br />
UK: CABI Publishing in association<br />
with The <strong>International</strong> Crops Research<br />
<strong>Institute</strong> for the Semi-Arid Tropics<br />
(ICRISAT), Patancheru 502 324, Andhra<br />
Pradesh, India; 2005.<br />
Nega H., 2004.Managing rainwater in dry<br />
land areas <strong>of</strong> Ethiopia for improved<br />
agricultural development: The Ministry<br />
<strong>of</strong> Agriculture experience. Paper<br />
presented in the second General<br />
Assembly Proceedings <strong>of</strong> Ethiopian<br />
Rainwater Harvesting Association.<br />
Nega H., 2005.Training manual on<br />
Rainwater Harvesting and Utilization<br />
Techniques. Addis Ababa, Ethiopia<br />
Ngigi, S.N., 2003.Rain water harvesting for<br />
Improved Food Security. Promoting<br />
Technologies in the Greater Horn <strong>of</strong><br />
Africa. Greater Horn <strong>of</strong> Africa<br />
Rainwater Partnership (GHARP).Kenya<br />
Rainwater Association (KRA).<br />
Pender J. and Gebremedhin B., 2004.<br />
Impacts <strong>of</strong> policies and technologies in<br />
dry land agriculture: Evidence from<br />
northern Ethiopia. In Challenges and<br />
Strategies for Dry land Agriculture.<br />
CSSA Special Publication no.32.<br />
Pender J., Nkonya E., Jagger P. and<br />
Sserunkuuma D., 2001. An econometric<br />
approach to NRM impact assessment: an<br />
example from Uganda. In: Shiferaw B.,<br />
Freeman H. A. (2003Eds.)<br />
Rämi H., 2003.Ponds filled with challenges.<br />
<strong>Water</strong> harvesting-experiences in Amhara<br />
and Tigray. UN OCHA-Ethiopia<br />
RELMA-in-ICRAF, 2004. Sear Net Briefs.<br />
Supported by A Net work for “Green”<br />
<strong>Water</strong> Harvesting (GWH) in Southern<br />
and Eastern Africa and South Asia.<br />
Nairobi-Kenya.<br />
254
Shiferaw B. and Freeman, H.A., 2003.<br />
Methods for Assessing the Impacts <strong>of</strong><br />
Natural Resource <strong>Management</strong><br />
Research. A summary <strong>of</strong> the<br />
proceedings.ICRISAT, Patancheru 502<br />
324, Andhra Pradesh, India.<br />
Shiferaw B., Freeman, H.A. and Swinton,<br />
S.M., 2005.Natural Resource<br />
<strong>Management</strong> in<br />
Agriculture. Methods for Assessing<br />
Economic and Environmental Impacts.<br />
CABI publishing<br />
Takele E., 2006. Review on the effectiveness<br />
and impacts <strong>of</strong> small- scale irrigation in<br />
Ethiopia. World Bank.<br />
Turner B., 1994. Small – Scale Irrigation in<br />
Developing Countries. Land Use Policy<br />
11 251 – 61.<br />
UNEP, 2005.Rainwater Harvesting and the<br />
Millennium Development Goals.<br />
www.rainwaterharvesting.org/rural, An<br />
interesting account on Rainwater<br />
harvesting Experience <strong>of</strong> India<br />
255
Discussion on Theme 2: Irrigation Impact Poverty and Economy<br />
Chair: Dr. Birhanu G/Medhin<br />
Rapporture: Micheal Menkir<br />
The chairman for this session introduced the theme and the floor was opened for<br />
questions, comments and suggestions.<br />
Questions and Discussions<br />
2.1 What are the inefficiencies<br />
variables, that the government<br />
policy makers can take up and<br />
go for improvement<br />
2.2 What is the level <strong>of</strong><br />
inefficiency/efficiency within<br />
irrigated agriculture itself?<br />
Since it is obvious that the<br />
production level <strong>of</strong> farmers<br />
cannot fell on the frontier line.<br />
How much is the efficiency or<br />
inefficiency difference between<br />
irrigated and rainfed<br />
agriculture?<br />
2.3 The year 2005/2006 was a high<br />
rainfall year; so percentage<br />
contribution <strong>of</strong> irrigation on<br />
GDP would be less than in a<br />
draught year.<br />
Ans-yes analyses may have<br />
underestimated percentage<br />
contribution slightly. clearly the<br />
percentage contribution <strong>of</strong><br />
irrigation varies b/n good and<br />
poor rainfall year<br />
2.4 How sustainable is use <strong>of</strong><br />
irrigation from experiences <strong>of</strong><br />
salinity?<br />
2.5 Development especially in high<br />
evaporation areas in large scale<br />
irrigation schemes. It is<br />
suggested that future studies<br />
should consider this aspect.<br />
2.6 What should be the size <strong>of</strong> the<br />
sample area <strong>of</strong> irrigated<br />
agriculture to be representative<br />
to talk about its contribution the<br />
national economy (GDP)<br />
2.7 Using chow´s test you were<br />
able to pool the data <strong>of</strong> Doni<br />
and Godino but not Batu<br />
Degaga. Does this mean<br />
features were behaving in the<br />
same manner? Given that their<br />
location is different.<br />
2.8 Area expansion increases<br />
agricultural production which<br />
has some contribution to<br />
poverty reduction. However<br />
extensive agriculture has its<br />
negative impact on the natural<br />
resource i.e degradation. Your<br />
analysis is based on extensive<br />
agriculture rather it is better to<br />
consider intensive agriculture<br />
for land and water productivity<br />
development. Therefore how do<br />
you see the natural resource<br />
degradation and environmental<br />
deterioration in your poverty<br />
analysis<br />
2.9 Efficiency issue should be seen<br />
with respect to rainfall<br />
availability. In Godino water is<br />
abundant, rainfall rich.<br />
Therefore irrigators are less<br />
efficient. However in Batu<br />
Degaga water is pumped and it<br />
has a cost. So this is incentive<br />
for higher efficiency. The area is<br />
also dry land with highly<br />
variable rainfall. Therefore<br />
while considering efficiency<br />
water availability and rainfall<br />
should be an important<br />
parameters.<br />
2.10 Increase <strong>of</strong> water supply by 1<br />
percent leads to 0.5 percent<br />
output what should be the limit<br />
o f applying more water, since<br />
over application will lead to<br />
miss management and<br />
256
inefficient water use. In the<br />
future farmers may be able to<br />
pay for the water they use for<br />
irrigation (from experience <strong>of</strong><br />
other water scarce countries like<br />
Morocco, Jordan and Israel. Is<br />
there a possibility <strong>of</strong> using this<br />
in terms <strong>of</strong> cost recovery and<br />
operational and management<br />
cost <strong>of</strong> irrigation projects?<br />
2.11 While talking about the need for<br />
irrigation need for the countries<br />
GDP growth. Are we<br />
considering other sectors using<br />
the same source like<br />
hydropower, water supply<br />
2.12 Quality <strong>of</strong> water definitely<br />
decreases as consumptive use<br />
(irrigation ) increases. so is not<br />
important to consider the<br />
decrease in the value <strong>of</strong> same<br />
volume <strong>of</strong> water in the future in<br />
calculating or equating<br />
monetary value <strong>of</strong> water?<br />
2.13 How do you say that irrigation<br />
time increases production?<br />
Irrigation time usually depends<br />
on the stream size a farmer is<br />
receiving.<br />
2.14 How is it possible that farmers<br />
located at the tail end <strong>of</strong> the<br />
system are less efficient and at<br />
the same time dry land farmers<br />
are more efficient. Answer-<br />
Found the comment valid but<br />
could not consider during the<br />
study due to the complexity <strong>of</strong><br />
determining the volume <strong>of</strong><br />
water received by a farmer.<br />
Answer , Tail end users are less<br />
efficient due to water limitation<br />
because <strong>of</strong> over abstraction <strong>of</strong><br />
water by upstream users<br />
2.15 In your recommendation you<br />
stated that households with<br />
access to irrigation will remain<br />
poor what does this indicate?<br />
2.16 The reason for livestock<br />
absence is not only because <strong>of</strong><br />
less grazing land but mainly due<br />
to sleeping sickness<br />
(Trzpanosomiassis),<br />
livestock disease.<br />
lowland<br />
2.17 In your conclusion less choice is<br />
put as a negative aspect but we<br />
found those who specialised<br />
(follow one cropping pattern)<br />
are the richest <strong>of</strong> the<br />
beneficiaries as they can buy<br />
their food crops.<br />
Ans- the livestock disease<br />
happened some 10 years ago,<br />
but now lack <strong>of</strong> grazing land is<br />
the main reason. And less<br />
choice <strong>of</strong> food is related to the<br />
education status<br />
2.18 There is a confounding effect<br />
between irrigation and rain fed<br />
agriculture. Farmers with access<br />
to irrigation could be making<br />
more money or income from<br />
their rain fed production. How<br />
can we deal with this problem?<br />
2.19 What are the differences<br />
between depth <strong>of</strong> poverty and<br />
severity <strong>of</strong> poverty? What are<br />
the parameters that are required<br />
to address these two terms?<br />
2.20 What is the optimal investment<br />
cost per hectare <strong>of</strong> irrigation<br />
projects specially small scale<br />
projects<br />
2.21 What are the inefficiency<br />
variables which can be taken by<br />
the government<br />
2.22 Definition <strong>of</strong> technical<br />
efficiency. Due to inherent<br />
nature <strong>of</strong> inefficiency every<br />
farmers cannot fall towards the<br />
frontier line<br />
2.23 There are different kinds <strong>of</strong><br />
small scale irrigation which<br />
irrigation systems are viable<br />
from the 25 SSI<br />
2.24 Did you see the effect <strong>of</strong><br />
supplementary irrigation in your<br />
analysis<br />
257
2.25 Have you considered the cost <strong>of</strong><br />
the dam? Is the water free?<br />
2.26 No one mentioned about<br />
sustainability <strong>of</strong> the irrigation<br />
projects. Salinity in middle<br />
awash valley....?<br />
2.27 Why did you leave commercial<br />
farmer like the one in Maki<br />
Ziway area in your analysis<br />
2.28 Change in quality <strong>of</strong> water what<br />
is the economic impact <strong>of</strong> low<br />
quality water<br />
2.29 Input-output pricing are they<br />
incorporated in your analysis<br />
2.30 How do you identify poverty in<br />
the beneficiaries <strong>of</strong> irrigation<br />
schemes<br />
2.31 Female Household are they<br />
included? what is the finding<br />
with respect to Female<br />
households<br />
2.32 What is the difference between<br />
depth and severity <strong>of</strong> poverty<br />
2.33 Interaction between rain fed and<br />
irrigation systems. How do you<br />
deal with confounding effect<br />
2.34 Do you see the size <strong>of</strong> irrigable<br />
land which should be allocated<br />
example in Tigray it is 0.2 ha if<br />
tit is more it is not manageable?<br />
So did you come across <strong>of</strong> such<br />
kind <strong>of</strong> analysis.<br />
2.35 What is the limit for<br />
investment? what kind <strong>of</strong><br />
marketing is essential to impact<br />
the GDP? The other problem is<br />
the discrepancy between land<br />
and water availability<br />
2.36 Share cropping is widely<br />
practiced. farmers lease their<br />
land. Do you consider this when<br />
you talk <strong>of</strong> impact <strong>of</strong> irrigation<br />
2.37 What is the reason behind for<br />
female household to be more<br />
food secured than male headed<br />
household?<br />
2.38 In the Alaba presentation the<br />
positive impact <strong>of</strong> water<br />
harvesting structures is shown<br />
what about its impact on health?<br />
Is the adoption continued even<br />
after its introduction by the<br />
government?<br />
258
Theme three:<br />
Irrigation Institutions and Support Services<br />
Papers<br />
1. Status <strong>of</strong> irrigation institutions and support services in Ethiopia<br />
2. Does access to small scale irrigation promote market oriented production in Ethiopia?<br />
3. Multiple Effects <strong>of</strong> Small Scale Irrigation in Ethiopia<br />
259
Status <strong>of</strong> Irrigation Institutions and Support Services in Ethiopia<br />
1 Tena Alamirew, 1 Desalegn Chemeda, 1 Tesfay Beshah, 2 Sileshi Bekele<br />
1 Haramaya University, 2 IWMI-NBEA<br />
alamirew2004@yahoo.com<br />
Abstract<br />
Ethiopia is investing good amount <strong>of</strong> scarce<br />
resources on irrigation development. But the<br />
performance <strong>of</strong> many <strong>of</strong> the irrigation schemes<br />
is <strong>of</strong>ten far from satisfactory with<br />
disappointing results <strong>of</strong> public investments. In<br />
this study, the type and performance <strong>of</strong><br />
irrigation institutions and availability <strong>of</strong><br />
support services were investigated taking three<br />
large and nine small scale irrigation schemes<br />
from different parts <strong>of</strong> the country.<br />
It was noted that at the macro-scale, the<br />
mandates the Ministry <strong>of</strong> Agriculture and<br />
Rural Development and the Ministry <strong>of</strong> <strong>Water</strong><br />
Resources in irrigation development were not<br />
clearly articulated and scrupulously tended.<br />
The set up <strong>of</strong> irrigation institutions from<br />
Federal to Woreda level is frequently changing<br />
ensuing institutional memory lapse,<br />
duplication <strong>of</strong> efforts, and lack <strong>of</strong><br />
accountability. The roles <strong>of</strong> <strong>Water</strong> Bureaus and<br />
the Agriculture and Rural Development<br />
Bureaus with respect to irrigation development<br />
are not clearly defined to date. Irrigation<br />
extension service was observed as an<br />
unsatisfactory and the training <strong>of</strong> farmers in<br />
irrigated crop production was wanting.<br />
Only the agro-industrial state schemes -<br />
sugarcane and cotton farms - are relatively<br />
well managed with little or no institutional and<br />
support service problems. Many <strong>of</strong> modern<br />
small scale irrigation schemes (86%) are<br />
nominally managed by <strong>Water</strong> User Association<br />
(WUA) with well crafted bylaws. However,<br />
many <strong>of</strong> them lack the authority to enforce<br />
them. The use <strong>of</strong> local courts to fine <strong>of</strong>fenders<br />
was noted to be ineffective. Compared to<br />
formal institutions like water user association,<br />
traditional institutions were found to be better<br />
efficient for their penalty sanction mechanisms<br />
are stronger.<br />
Beneficiaries lack skills and institutions to<br />
manage common property resources;<br />
consequently, irrigation infrastructure quickly<br />
falls into a state <strong>of</strong> disrepair. Substantial<br />
numbers <strong>of</strong> the beneficiaries don’t feel that<br />
they own/control the water. In the perception<br />
<strong>of</strong> the many irrigators, maintenance <strong>of</strong> the<br />
headwork and main canal are the responsibility<br />
<strong>of</strong> the ‘government’. But government<br />
organizations are more focused on the<br />
development <strong>of</strong> new schemes. Maintenance<br />
was observed to be the most serious problem<br />
(74%) that caused underperformance <strong>of</strong> many<br />
schemes. The main cause was attributed to<br />
lack <strong>of</strong> fund (37%) and poor organization and<br />
planning.<br />
<strong>Water</strong> shortage ensued water theft and<br />
unauthorized canal breaching are said to be the<br />
major (78.1%) sources <strong>of</strong> conflict and water<br />
shortage in the irrigation schemes under<br />
investigation.<br />
Marketing problem caused by absence <strong>of</strong><br />
communal planning, contractual farming,<br />
transport access and staggered production<br />
system targeted for market was cited as the<br />
disincentive to expand irrigated crop<br />
production. Supply <strong>of</strong> seed, pesticide and<br />
insecticide is also identified to be the major<br />
challenges in diversifying production. The<br />
availability <strong>of</strong> support service in terms <strong>of</strong><br />
inputs (seeds, fertilizer, herbicides, fuel, farms<br />
implements) was noted to be below<br />
satisfactory. The Bureaus <strong>of</strong> Agriculture are<br />
said to be the major provider <strong>of</strong> support<br />
services (35%). The service from research<br />
institution was reported as minimal. Service<br />
Cooperatives organized by the Cooperatives<br />
Promotion Agency have stared to deliver<br />
fertilizer in their cooperative shops recently.<br />
In conclusion, irrigation water management<br />
institution is to be established and empowered<br />
with appropriate statutes. It is to be provided<br />
with extension and support services. The<br />
beneficiaries should be consulted in the<br />
260
planning and they should be accountable for<br />
the public investment.<br />
261
Does Access To Small Scale Irrigation Promote Market Oriented<br />
Production In Ethiopia?<br />
Fitsum Hagos 1 , Godswill Makombe 1 , Regassa Namara 2 , and Seleshi Bekele Awulachew 1<br />
1<br />
<strong>International</strong> <strong>Water</strong> <strong>Management</strong> <strong>Institute</strong> for the Nile Basin and East Africa,<br />
2 <strong>International</strong> <strong>Water</strong> <strong>Management</strong> <strong>Institute</strong> (IWMI), Africa Regional Office. Accra, Ghana.<br />
f.hagos@cgiar.org<br />
Abstract<br />
The study examined the extent and nature <strong>of</strong><br />
market oriented production in irrigated<br />
compared to rainfed systems in Ethiopia. By<br />
doing so the paper identifies the role <strong>of</strong><br />
irrigation in market-oriented production,<br />
while at the same time highlighting the main<br />
constraints to market oriented development.<br />
Our results indicate that irrigation<br />
contributes significantly to increases in<br />
market participation, volume <strong>of</strong> marketed<br />
produce and, hence, income, by inducing<br />
shifts in farmers’ cropping mix. The impact<br />
<strong>of</strong> commercialization <strong>of</strong> production on<br />
household food security is not direct and<br />
immediate mainly because <strong>of</strong> failures in the<br />
food market.<br />
While irrigation enhances market<br />
production, there are series <strong>of</strong> factors that<br />
pose serious constraints to market<br />
production. Land size, oxen holding, access<br />
to market and means <strong>of</strong> transport were found<br />
to be important determinants <strong>of</strong> market<br />
oriented production calling for policy<br />
interventions in land markets, access to<br />
productive assets and infrastructure<br />
development and policy measures to<br />
improve the performance <strong>of</strong> agricultural<br />
markets. The study also found education has<br />
market promoting effect in terms <strong>of</strong><br />
increasing the probability <strong>of</strong> participation<br />
and volume <strong>of</strong> sale. Increased support to<br />
education can, thus, help in the long-term to<br />
transform traditional subsistence agriculture<br />
into more market-oriented agriculture.<br />
Finally there are unobserved site specific<br />
effects, related to location and other<br />
covariates, which influence market<br />
participation and volume decisions.<br />
Key terms: irrigation, change in cropping<br />
mix, market participation, volume <strong>of</strong> sale,<br />
Probit and Truncated regression; Ethiopia,<br />
Africa.<br />
1. Introduction<br />
Irrigation development is expected to<br />
increase market participation <strong>of</strong> producers<br />
(Rosegrant et al., 1995; MoFED, 2006).<br />
Higher yields, higher cropping intensity and<br />
all year round farm production leads to<br />
increased market-oriented production,<br />
implying a shift in supply (marketable<br />
surplus production) and perhaps food<br />
security. Irrigation is also expected to lead to<br />
changes in crop mix (cash crop orientation)<br />
which is expected to have far reaching<br />
consequences on household welfare (Joshi et<br />
al., 2003). Crop-switching as Hussain and<br />
Hanjra (2004) noted involves substituting<br />
low yielding and low pr<strong>of</strong>itable crops with<br />
new high-yielding and more pr<strong>of</strong>itable<br />
crops. Implicitly this implies switching from<br />
subsistence production to market-oriented<br />
production (ibid.). There are reports,<br />
however, that indicate that increased market<br />
orientation may not necessarily ensure food<br />
security especially if the macroeconomic
environment is not conducive or there are<br />
distorted trade policies or there is poor<br />
infrastructure development (Van Braun,<br />
1995) or social protection for food security<br />
is not provided through markets and<br />
government interventions (de Janvry et<br />
al.1991).<br />
In risky environments such as Ethiopia,<br />
smallholder farmers, who constitute the bulk<br />
<strong>of</strong> the population, are <strong>of</strong>ten caught in<br />
production <strong>of</strong> low-risk/low-return food<br />
grains. With insufficient cash funds, and<br />
unpredictable outcomes, they cannot afford<br />
to take the risk <strong>of</strong> diversifying from<br />
subsistence food production into potentially<br />
higher-return ventures (such as growing<br />
cash crops for market), or <strong>of</strong> spending their<br />
limited cash on purchased agricultural<br />
inputs, because if they fail – either because<br />
<strong>of</strong> crop failure, price collapse, or lack <strong>of</strong><br />
demand – they will not have either the basic<br />
food they would otherwise have produced,<br />
nor the cash to purchase it, and their families<br />
will go hungry (MOFED, 2006 p.6).<br />
Irrigation removes some <strong>of</strong> the risks<br />
associated with rainfall variability and<br />
thereby increases the likelihood <strong>of</strong> using<br />
purchased quality inputs due to the reduced<br />
risk <strong>of</strong> crop failure. Irrigation is, hence,<br />
expected to remove or ease risk so that<br />
farmers can venture into an inherently high<br />
risk-high return production pathway, which<br />
may have a significant effect on poverty<br />
reduction (MoFED, 2006).<br />
While irrigation development is expected to<br />
induce such changes, the realization <strong>of</strong> these<br />
effects cannot be taken for granted. This<br />
could be especially true in countries like<br />
Ethiopia, where many <strong>of</strong> the preconditions<br />
for market production seem to be missing.<br />
The households’ orientation towards market<br />
production is <strong>of</strong>ten hampered by various<br />
factors at the household and village levels,<br />
by market access conditions and other<br />
institutional and policy factors. The World<br />
Bank (2006) indicated that current limited<br />
access to transportation and markets<br />
undermines incentives for surplus<br />
agricultural production and reinforces the<br />
highly vulnerable subsistence-oriented<br />
structure <strong>of</strong> the economy. It further indicated<br />
that smallholder farmers, generally with less<br />
than 1 hectare <strong>of</strong> land, account for about 95<br />
percent <strong>of</strong> the agricultural output. In times <strong>of</strong><br />
good weather, roughly 75-80 percent <strong>of</strong> the<br />
output is consumed at the household level<br />
(World Bank, 2006). Bhattarai and Pandy<br />
(1997) in their study in Nepal indicated that<br />
wheat production was economically more<br />
pr<strong>of</strong>itable in locations with better access to<br />
irrigation and rural infrastructure. They also<br />
found that farmers with access to irrigation<br />
and markets are found to be much more<br />
responsive to changes in wheat prices than<br />
farmers without access to such<br />
infrastructure, indicating the<br />
complementarity between infrastructure<br />
development and access to market and crop<br />
productivity. Lapar et al. (2003) pointed out<br />
that smallholders generally have inadequate<br />
capital resources—including, physical and<br />
financial resources, but also intellectual<br />
capital resources such as experience,<br />
education and extension— which limits their<br />
ability to diversify production portfolios.<br />
Lapar et al. (2003) further indicated that the<br />
inability <strong>of</strong> smallholder producers to take<br />
advantage <strong>of</strong> economies <strong>of</strong> scale in<br />
production and marketing is a significant<br />
impediment to market participation.<br />
Smallholders are <strong>of</strong>ten disadvantaged due to<br />
poor access to information and marketprecipitating<br />
services such as extension<br />
visitation and credit assistance and these<br />
impediments <strong>of</strong>ten give rise to low rates <strong>of</strong><br />
adoption <strong>of</strong> improved technologies that<br />
could potentially increase productivity,<br />
diversification and, hence, market<br />
participation. In addition, poor infrastructure<br />
<strong>of</strong>ten increases the transaction costs <strong>of</strong><br />
smallholder market participation.<br />
However, there is little empirical evidence<br />
on market participation in developing<br />
countries, particularly in Africa. The limited<br />
studies there are focus on smallholder<br />
producers’ decision to participate in coarse<br />
grain markets (Goetz, 1992) or in livestock<br />
markets (Lapar et al. 2003; Bellemare and<br />
Barrett, 2006). To our knowledge there is no<br />
263
study, which has systematically investigated<br />
the role <strong>of</strong> irrigation in inducing marketoriented<br />
production in Sub-Saharan Africa.<br />
A sound understanding <strong>of</strong> the patterns <strong>of</strong><br />
market oriented production and the<br />
constraints it faces could contribute to the<br />
development <strong>of</strong> more appropriate policies<br />
regarding institutional arrangements and the<br />
creation <strong>of</strong> adequate infrastructure, which<br />
could benefit a large mass <strong>of</strong> smallholder<br />
producers. This study is an attempt in this<br />
direction. Specifically it aimed to: (i)<br />
examine the extent and nature <strong>of</strong> market<br />
oriented production in irrigated sites in<br />
contrast to rainfed areas in Ethiopia; (ii)<br />
identify the determinants <strong>of</strong> market-oriented<br />
production, including the role <strong>of</strong> irrigation in<br />
the process, and (iii) draw implications <strong>of</strong><br />
market oriented production on food security<br />
and poverty reduction.<br />
We used a unique dataset covering various<br />
small and medium scale irrigation schemes,<br />
both traditional and modern. Corresponding<br />
data from rainfed systems were used as a<br />
control. We explored the differential impact<br />
<strong>of</strong> irrigation development on market<br />
production as contrasted to rainfed systems.<br />
In explaining a household’s decision to<br />
participate in the market we introduced the<br />
distinction between participation per se and<br />
volume decisions (i.e. level <strong>of</strong> participation).<br />
Where participation investigated whether the<br />
household produces and sells products to the<br />
market regardless <strong>of</strong> the amount (value) <strong>of</strong><br />
sale and the level <strong>of</strong> participation<br />
investigated the factors that influence the<br />
quantity <strong>of</strong> sale. It is difficult to assume a<br />
priori that the factors that influence the<br />
household’s decision to participate in the<br />
market are different from the factors that<br />
influence volume decisions. Hence, we also<br />
tested whether the decision to participate<br />
and the volume <strong>of</strong> sale are made<br />
simultaneously using appropriate<br />
econometric techniques.<br />
The paper is presented as follows. Part two<br />
presents a theoretical model for modeling<br />
participation and volume decisions followed<br />
by the presentation <strong>of</strong> testable hypotheses<br />
and econometric approaches in parts three<br />
and four. In section five the study site and<br />
data description and some descriptive<br />
statistical summary results are presented.<br />
Part six discusses the econometric results<br />
and part seven concludes and draws policy<br />
conclusions.<br />
2. Modeling participation and supply<br />
decisions<br />
We developed a simple conceptual<br />
framework that captures interactions,<br />
processes and outcomes that result from<br />
irrigation development. Unlike rainfed<br />
agriculture, irrigation development enhances<br />
cropping intensity as households are able to<br />
produce more than once in a year. Irrigation<br />
also opens new horizons for growing new<br />
crops which are not usually possible under<br />
rainfed conditions (Joshi et al., 2003;<br />
Hussain and Hanjra 2004; Hussain, 2005;<br />
Huang et al., 2006). Furthermore, irrigation<br />
development enhances increased use <strong>of</strong><br />
purchased inputs by reducing the risk <strong>of</strong><br />
crop failure and increasing returns to<br />
agriculture and, hence, increasing<br />
household’s willingness to use purchased<br />
farm inputs such as fertilizer, herbicides and<br />
pesticides and also hired labor (Hussain and<br />
Hanjra, 2004). These changes in cropping<br />
intensity and shift in cropping choice<br />
(diversification) are expected to have far<br />
reaching consequences on food security and<br />
poverty, not least through the market<br />
behavior <strong>of</strong> smallholder farmers (Pandey<br />
and Sharma, 1996; Hussain and Hanjira,<br />
2003; Hussain and Hanjra 2004; Huang et<br />
al., 2006).<br />
Irrigation development is expected to trigger<br />
this host <strong>of</strong> processes. However, while<br />
irrigation is the necessary condition to<br />
induce these changes, it is not as such a<br />
sufficient condition as there are various<br />
factors that influence these processes. First<br />
we present the theoretical model that focuses<br />
on the household’s decision to produce for<br />
the market before we present the possible<br />
factors that influence market participation<br />
and volume decisions.<br />
264
We consider market participation and supply<br />
decisions in the context <strong>of</strong> traditional Probit<br />
and Tobit models applied to household<br />
production data (see Lapar et al. 2003). For<br />
each household, i , i = 1, 2,…N, assume<br />
that the observed data, namely y i<br />
= 1 if<br />
participation is observed and y<br />
i<br />
= 0<br />
otherwise, is conditioned by a K-vector <strong>of</strong><br />
household-specific covariates, x<br />
i<br />
. The<br />
decision rule is to participate when the<br />
utility <strong>of</strong> doing so, say, U<br />
i<br />
( x i<br />
) exceeds<br />
V , which is the utility reaped<br />
utility ( )<br />
i<br />
x i<br />
from some alternative enterprise ( e.g. to<br />
produce food crops). Taking Taylor-series<br />
expansions <strong>of</strong> these two utility functions<br />
around the point x i<br />
= 0, yields the linear<br />
model, y<br />
i<br />
= 1 if x i<br />
γ ≥ x i<br />
μ , y<br />
i<br />
= 0 if<br />
x iγ < x i<br />
μ , where γ and μ are K-vectors<br />
<strong>of</strong> first-order effects depicting the impacts<br />
on the two utilities <strong>of</strong> changes in the levels<br />
<strong>of</strong> the covariates. Subtracting the left-handside<br />
from both sides <strong>of</strong> the inequalities,<br />
equating the result to a latent variable, Z<br />
i<br />
,<br />
and permitting the equality to hold with<br />
error, μ<br />
i<br />
, we are left with<br />
Z<br />
pi<br />
= x i<br />
β<br />
p<br />
+ μip<br />
, Z<br />
i<br />
≥ 0 if y<br />
i<br />
= 1, Z<br />
i<br />
≤ 0 ,<br />
otherwise. (1)<br />
Here β<br />
p<br />
≡ γ − μ measures the difference<br />
in allocating resources to either enterprise,<br />
i.e. food or cash crop production.<br />
Supply decisions are modeled in a similar<br />
way. We assume that the quantity supplied<br />
on the market is a linear function <strong>of</strong> another<br />
set <strong>of</strong> household characteristics, which may<br />
be the same as the set represented by the<br />
covariates xi, above. Specifically, the supply<br />
relationship is:<br />
Z<br />
si<br />
= x i<br />
β<br />
s<br />
+ μ<br />
si<br />
, (2)<br />
where Z<br />
si<br />
denotes householdi ’s the volume<br />
supplied; x<br />
i<br />
denotes covariates relevant to<br />
the supply decision; β<br />
s<br />
denotes a vector <strong>of</strong><br />
unknown parameters depicting the<br />
relationship between supply and the<br />
household covariates; and<br />
μ<br />
si<br />
~ N( 0,<br />
σ si<br />
) denotes random error.<br />
Unlike the latent specification in the Probit<br />
model, the dependent variable in (2) takes<br />
on positive and zero values. When a zero<br />
value is observed, we assume this to imply<br />
that the household in question, rather than<br />
possessing an excess <strong>of</strong> the marketable<br />
product, actually has a demand for the<br />
commodity (that is, a negative supply).<br />
Hence, sales quantities are left-censored at<br />
zero.<br />
3. Hypotheses<br />
In this section we present, in the form <strong>of</strong><br />
testable hypothesis, various factors that<br />
influence the irrigation-market production<br />
nexus.<br />
In most rural economies, farm households<br />
are dominant decision-makers when it<br />
comes to the management <strong>of</strong> land and water<br />
resources. Farm households appear to<br />
represent an extremely robust and dominant<br />
decision-making unit in relation to<br />
production, consumption and market<br />
exchange in the types <strong>of</strong> economies we<br />
studied. Farm households, therefore, become<br />
the natural core units in our models and<br />
analysis. Various development<br />
interventions, including irrigation<br />
development, may have changed their<br />
decision-making environment, however, in<br />
terms <strong>of</strong> their capacity to produce, access<br />
markets and the prices and price variability<br />
they face in these markets.<br />
In a world with well developed markets,<br />
households will participate in all factor and<br />
commodity markets when these factors are<br />
used in production and commodities are<br />
produced and/or consumed by the<br />
households, as long as factors and<br />
commodities are imperfect substitutes and<br />
distribution <strong>of</strong> factors and commodities vary<br />
across households. There will always be<br />
gains from trade when trade is costless (zero<br />
transaction costs). Such a world favors<br />
specialization. Under such scenario,<br />
irrigation development is expected to<br />
promote market oriented production<br />
265
egardless <strong>of</strong> the households’ consumption<br />
demand.<br />
In the real world there are transaction costs<br />
causing there to be price bands where<br />
purchase prices are higher than selling<br />
prices. Significant positive transaction costs<br />
and information asymmetries can lead to<br />
market imperfections (de Janvry et al.,<br />
1991). For an economy where there are both<br />
sellers and buyers <strong>of</strong> a factor or commodity,<br />
in the so called two-sided markets, positive<br />
transaction costs and information<br />
asymmetries lead to non-participation and a<br />
“self-sufficiency orientation” for factors that<br />
are owned and used in production and<br />
commodities that are produced and<br />
consumed by households. In general, we<br />
expect that the higher the transaction costs,<br />
the wider the price band and the larger share<br />
(%) <strong>of</strong> households that will be nonparticipating.<br />
An implication <strong>of</strong> this is that<br />
market non-participation can be an indicator<br />
<strong>of</strong> the size <strong>of</strong> the transaction costs in a<br />
specific two-sided market. However, the<br />
distribution among households and<br />
substitutability <strong>of</strong> factors in production and<br />
commodities in consumption within<br />
households may also influence the degree <strong>of</strong><br />
non-participation. The higher the elasticity<br />
<strong>of</strong> substitution in production and<br />
consumption the higher we expect the<br />
probability <strong>of</strong> non-participation to be.<br />
Overall, significant market non-participation<br />
is a sign <strong>of</strong> significant market imperfections<br />
in an economy. On the basis <strong>of</strong> these<br />
broader perspectives, we developed some<br />
testable hypothesis.<br />
H1. Smallholder producers with access to<br />
irrigation are more likely to participate in<br />
markets than farmers under rainfed systems.<br />
H2. Smallholder farmers with better access<br />
to markets (i.e., close to larger markets) are<br />
expected to be much more likely to<br />
participate in the market than farmers<br />
without access to such infrastructure.<br />
H3. Households with better endowments<br />
such as labor, capital (including livestock),<br />
land and other resources such as information<br />
and education are more likely to participate<br />
in markets than households with fewer<br />
endowments.<br />
H4. Smallholder farmers are <strong>of</strong>ten<br />
disadvantaged due to poor access to<br />
information and market-supporting services<br />
such as extension services and credit<br />
assistance and these impediments <strong>of</strong>ten give<br />
rise to low rates <strong>of</strong> adoption <strong>of</strong> improved<br />
technologies that could potentially increase<br />
productivity, diversification and, hence,<br />
market participation.<br />
Hypothesis three implies that poverty may<br />
limit households’ participation in markets.<br />
Besides, food insecure households may<br />
allocate most <strong>of</strong> their resources to meet their<br />
food demands, even if growing for the<br />
market is economically more rewarding.<br />
Hypothesis four implies that availability <strong>of</strong><br />
inputs and new technologies also facilitate<br />
market oriented production. In this case, the<br />
functioning <strong>of</strong> input markets and extension<br />
services play an important role in facilitating<br />
increased adoption <strong>of</strong> new technologies<br />
(improved seeds, agronomic practices, etc)<br />
by farmers. Adoption <strong>of</strong> new technologies<br />
plays a critical role in farmers’ increased<br />
market oriented production as technological<br />
change without increased commercialization<br />
seems unlikely because <strong>of</strong> the increased use<br />
<strong>of</strong> purchased inputs and<br />
diversification/specialization are inherent<br />
elements <strong>of</strong> most technological innovations<br />
in agricultural production. Hence, policies to<br />
speed up commercialization and<br />
technological change move jointly in a<br />
reinforcing way (von Braun, 1995). Hence,<br />
we propose that households with good<br />
access to services (input and capital<br />
markets) are more likely to participate.<br />
These hypotheses were tested<br />
systematically. The results are reported in<br />
the subsequent sections.<br />
4. Econometric estimation<br />
266
Let the amount <strong>of</strong> crops supplied by a<br />
household i be given by:<br />
y si<br />
= x β +<br />
(3)<br />
1 1<br />
μ1<br />
ysi<br />
where is the volume <strong>of</strong> sales supplied by<br />
the household that is expected to depend on<br />
the vector<br />
x1<br />
regressors outlined in equation<br />
y<br />
(2). As<br />
si is censored this can be estimated<br />
using variants <strong>of</strong> censored regression<br />
models. The most <strong>of</strong>ten used model is the<br />
Tobit model (Wooldridge, 2002).<br />
The participation equation, whether the<br />
household decides to participate or not, is<br />
given by:<br />
= xδ<br />
+ v 0<br />
y pi<br />
[ ]<br />
1<br />
2 2<br />
><br />
( x, y )<br />
where pi<br />
(4)<br />
are always observed whereas<br />
y y = 1<br />
si is observed only when pi<br />
. Eq. (4)<br />
can be estimated using variants <strong>of</strong> the binary<br />
choice model, in our case we used the Probit<br />
model. We assumed that ( u ,v ) 1 2 is<br />
independent <strong>of</strong> x with mean <strong>of</strong> zero<br />
implying that x is exogenous,<br />
and<br />
v 2<br />
~ N( 0,1)<br />
.<br />
One <strong>of</strong> the assumptions in, and important<br />
limitation <strong>of</strong>, the Tobit model is a single<br />
mechanism determines the choice between<br />
y<br />
pi<br />
= 0 versus y<br />
pi<br />
> 0 and the amount <strong>of</strong><br />
y<br />
si<br />
given y<br />
i<br />
> 0 . However, in reality<br />
participation decisions and volume decision<br />
could be separate, and are influenced by<br />
different factors. Estimating these decisions<br />
simultaneously while the decisions are<br />
separate may lead to inconsistent estimates<br />
and wrong conclusions. Alternatives to<br />
censored Tobit have been suggested to allow<br />
the initial decision <strong>of</strong> y<br />
pi<br />
= 0 versus<br />
y<br />
pi<br />
> 0 to be separate from the decision <strong>of</strong><br />
how much y<br />
si<br />
given y<br />
pi<br />
> 0 . These include<br />
Cragg’s double hurdle model (Probit plus<br />
Truncated regression model) (Cragg, 1971)<br />
or Wooldridge’s model using Probit plus<br />
lognormal regression models (Wooldridge,<br />
2002). Hence, nested (log-likelihood ratio<br />
test) and non-nested Voung test (Voung,<br />
1989) model test statistics were derived to<br />
determine whether to use the Tobit model<br />
formulation or either the Cragg or<br />
Wooldridge model. If these test results<br />
showed that these were separate decisions,<br />
then we used the double hurdle model<br />
(Cragg, 1971) or Probit plus lognormal<br />
regression models (also known as<br />
Wooldridge model) along with other<br />
explanatory variables to explain volume<br />
decisions <strong>of</strong> households.<br />
The Cragg model has the advantage that it<br />
nests the Tobit model and a likelihood ratio<br />
test can be performed easily to determine if<br />
the household market supply decision is best<br />
modeled by a one-step or a two-step<br />
procedure. The difficulty in comparing the<br />
Wooldridge model against the Cragg model<br />
is that they are not nested to each other. The<br />
same is true for Tobit model and<br />
Wooldridge model. We used the Voung<br />
(1989) non-nested model selection test.<br />
Following, Greene (2000) and Fin and<br />
Schmidt (1984) the restriction imposed by<br />
the Tobit model is tested against the Cragg<br />
model by performing a likelihood ratio test<br />
<strong>of</strong> the following.<br />
L = 2(ln<br />
L<br />
probit<br />
+ ln Ltruncatedregression<br />
− ln LTobit<br />
)<br />
…………………………………………(5)<br />
where L is distributed as chi-square<br />
with k degree <strong>of</strong> freedom ( K is the number<br />
<strong>of</strong> independent variables including a<br />
constant). The Tobit model was rejected in<br />
favor <strong>of</strong> the Cragg model if L exceeded the<br />
chi-square critical value. The likelihood<br />
ratio test statistics <strong>of</strong> chi2 (37) = 4574.21,<br />
p=0.0000, indicated that the restrictions<br />
imposed by the Tobit model is rejected in<br />
favor <strong>of</strong> the Cragg model. Thus, the same<br />
household and farm characteristics did not<br />
have equal influence on both the<br />
participation decision and the decision for<br />
how much to sell. It also implies that the<br />
participation decision and volume decision<br />
267
are not made simultaneously. However,<br />
hypothesizing that a given variable is<br />
interrelated with the participation decision<br />
and not with volume decision or vice versa<br />
is difficult. Consequently, the three models<br />
are estimated with the same variables.<br />
Once the Tobit model was rejected, the<br />
Cragg model could be compared with<br />
Wooldridge model using Voung’s nonnested<br />
model specification test. Voung’s<br />
non-nested model specification test is given<br />
by<br />
− 2<br />
V = n<br />
1 LR ( ˆ , ˆ ) ˆ<br />
n<br />
θ<br />
n<br />
υ<br />
n<br />
ω → N(0,1)<br />
(6)<br />
n<br />
where LR ( ˆ , ˆ<br />
n<br />
θ<br />
n<br />
υ<br />
n<br />
) is the difference<br />
between the log-likelihood values for the<br />
two models, θˆ n<br />
andυˆ n<br />
is the maximum<br />
likelihood estimators from the two models,<br />
respectively and V is distributed as a<br />
standard normal variable. The Voung test<br />
statistic <strong>of</strong> (V= -27.858, p= 0.000), strongly<br />
indicated that the Cragg model dominates<br />
the Wooldridge model. The critical<br />
values (c)<br />
for the 1 and 5 percent<br />
significance level are 2.58 and 1.96,<br />
respectively. Consequently the results<br />
presented below are derived from the Cragg<br />
model.<br />
Finally, we also corrected the standard<br />
errors for clustering effects by assuming that<br />
observations are not independent within the<br />
cluster although they are independent<br />
between clusters, in this case the household<br />
(Rogers, 1993). This is fair assumption as<br />
management could vary across households<br />
but not within plots run by the same<br />
household.<br />
5. Study site description and data<br />
description<br />
This study is part <strong>of</strong> a comprehensive<br />
nationwide study on the multiple impacts <strong>of</strong><br />
irrigation on poverty and environment run<br />
between 2004 and 2007 in Ethiopia. It was a<br />
component <strong>of</strong> the Impact <strong>of</strong> Irrigation on<br />
Poverty and Environment (IIPE) research<br />
project run by the <strong>International</strong> <strong>Water</strong><br />
<strong>Management</strong> <strong>Institute</strong> (IWMI) with support<br />
from the Austrian government. The socioeconomic<br />
survey, which investigated the<br />
impact <strong>of</strong> irrigation on poverty and irrigation<br />
contribution to national economy, addressed<br />
a total sample size <strong>of</strong> 1024 households from<br />
eight irrigation sites from 4 regional states<br />
involving traditional, modern and rainfed<br />
systems (see Fig. 1 and <strong>Table</strong> 1A). The total<br />
sample constitutes 397 households<br />
practicing purely rainfed agriculture and 627<br />
households (382 modern and 245<br />
traditional) practice irrigated agriculture.<br />
These households operate a total <strong>of</strong> 4,953<br />
plots (a household operating five plots on<br />
average). Of the total 4,953 plots covered by<br />
the survey, 25 percent (1,250 plots) are<br />
under traditional irrigation, 43 percent<br />
(2,137 plots) are under modern while the<br />
remaining 32 percent (1,566 plots) are under<br />
rainfed agriculture. The data collected<br />
include demographics, asset holdings, access<br />
to services, plot level production and sale<br />
and input use data (distinguished between<br />
irrigated and rainfed), constraints to<br />
agricultural production and household<br />
perceptions about the impact <strong>of</strong> irrigation on<br />
poverty, environment and health and other<br />
household and site specific data. The data<br />
was collected for the 2005/2006 cropping<br />
season.<br />
6. Results and discussion<br />
Summary statistics<br />
We present a summary <strong>of</strong> some <strong>of</strong> the most<br />
important variables here (for details see<br />
<strong>Table</strong> 1 below). Of the total households<br />
surveyed, about 54 percent <strong>of</strong> the<br />
households participated in the market by<br />
selling a product and earning an average <strong>of</strong><br />
Birr 591 (SD 2169) †††††† . The gross value <strong>of</strong><br />
sales realized by households varies greatly<br />
†††††† 1 US Dollar (USD) = 8.39625 Ethiopian<br />
Birr (ETB) in May 2006.<br />
268
as can be seen from the high variance. This<br />
variation is also stronger between farmers<br />
working in different irrigation types.<br />
Households in traditional irrigation and in<br />
modern schemes earn an average income <strong>of</strong><br />
Birr 699 (SD 2679) and Birr 779 (SD 4090)<br />
respectively from crop sales in contrast to<br />
rainfed Birr 476.10 (1076.1). It seems that<br />
average gross value <strong>of</strong> sales from modern<br />
irrigation schemes is higher than those from<br />
traditional schemes. However, testing for<br />
equality <strong>of</strong> the mean, in sales between the<br />
three irrigation types, indicated that there is<br />
a statistically significant difference (p-value<br />
0.0001). However, a separate test for<br />
traditional and modern scheme indicated<br />
that the mean difference is not statistically<br />
different (p-value 0.5354). This indicates<br />
that there was no difference in mean value<br />
<strong>of</strong> sales between traditional and modern<br />
schemes, although average sales from both<br />
sources are higher than those obtained from<br />
the rainfed system.<br />
When asked about whether the households<br />
faced any output market and marketing<br />
problems about 59 percent responded that<br />
they did not face any problems while the<br />
remaining 41 percent said that they did.<br />
There is a difference in the perception <strong>of</strong> the<br />
presence <strong>of</strong> a market and marketing<br />
problems between farmers working in<br />
rainfed systems and under irrigation<br />
systems. More farmers under irrigation<br />
systems seem on average to face market and<br />
marketing related problems than those<br />
working under rainfed systems. The major<br />
problems include: market problem (low<br />
demand and low selling price) (30.7%),<br />
distance to market, road and transport<br />
problems (23%), same product & peak time<br />
supply (20 %), unstable prices (11%), lack<br />
<strong>of</strong> services (information, service<br />
cooperatives, high tax) (5.3%), high<br />
purchase prices <strong>of</strong> agriculture goods when<br />
they want to buy them (4.4%), low supply<br />
and poor quality (3.3%), exploitation by<br />
local traders (1%), and others (additional<br />
costs) (0.7%).<br />
The functioning <strong>of</strong> input markets is expected<br />
to influence the functioning <strong>of</strong> output<br />
markets through its influence on production.<br />
Hence, we wanted to understand whether<br />
farmers faced any input access problem<br />
during the 2005/06 cropping season.<br />
Reporting on their experience <strong>of</strong> input<br />
access, about 53 percent <strong>of</strong> the households<br />
responded that they had no input access<br />
problem, compared with 47 percent who<br />
indicated that they did. The problems<br />
included: high input prices (45.8%),<br />
shortage <strong>of</strong> capital (high down payment, not<br />
member <strong>of</strong> service cooperatives and lack <strong>of</strong><br />
access to credit) (18 %), lack/shortage <strong>of</strong><br />
supply <strong>of</strong> inputs (mainly pesticides and<br />
herbicides but also fertilizer) (16 %), lack <strong>of</strong><br />
timely supply (10 %), shortage <strong>of</strong> equipment<br />
and materials and skilled labor to apply<br />
these inputs (2.4), and distance to input<br />
markets and lack <strong>of</strong> supply locally (1.9%).<br />
The most important problems are, hence,<br />
high input prices, lack <strong>of</strong> credit access and<br />
lack <strong>of</strong> availability <strong>of</strong> inputs in space and<br />
time. There is a significant difference in the<br />
perception <strong>of</strong> the presence <strong>of</strong> input related<br />
problems between farmers working in<br />
rainfed systems and under irrigation<br />
systems. On average more farmers under<br />
rainfed systems seem to face input access<br />
problems than those working under<br />
irrigation.<br />
Moisture stress and water shortages could<br />
pose serious constraints to agricultural<br />
production and, hence, to market supply <strong>of</strong><br />
agricultural outputs. Asked if households<br />
faced any shortfall in rain during the<br />
production season about 61 percent <strong>of</strong> the<br />
respondents indicated they did not, while the<br />
remaining 39 percent indicated that they did.<br />
Similarly, irrigation farmers asked if they<br />
faced water shortage during the irrigation<br />
season, 73 percent responded that they did<br />
not, while 27 percent <strong>of</strong> the respondents did.<br />
We present the composition <strong>of</strong> crops under<br />
different irrigation systems. The percentage<br />
values indicated the percentage <strong>of</strong> the plots<br />
covered by these crops (Figure 3). The<br />
dominant crops under traditional irrigation<br />
269
system, in order <strong>of</strong> importance are: maize,<br />
wheat, teff, followed by horticultural crops<br />
such as mango, potato, banana and tomato<br />
(Figure 3a). In the modern irrigation<br />
schemes, in the order <strong>of</strong> importance, the<br />
dominant crops are teff, maize, onion,<br />
wheat, tomato, barley and potato (Figure<br />
3b).<br />
In the rainfed agricultural system cereals are<br />
the dominant crops: teff, wheat, maize,<br />
sorghum, barley and pulses and oil crops.<br />
Horticultural crops such as onion, potato and<br />
perennial crops such as mango and gesho<br />
(local hops) each cover less than 1 percent<br />
<strong>of</strong> the total plots (Figure 3c).<br />
Finally we looked into the nature <strong>of</strong> market<br />
production, i.e. whether households are<br />
really exercising shifts in their cropping<br />
choice? Or is it just the produced surplus<br />
which is supplied to the market? How are<br />
the quantity <strong>of</strong> sales and value <strong>of</strong> sales<br />
correlated? We estimated a simple<br />
correlation coefficient between quantity and<br />
value <strong>of</strong> sales. A calculated correlation<br />
coefficient <strong>of</strong> 0.18 indicates that there is low<br />
linear association between quantity and<br />
value <strong>of</strong> outputs. Therefore, it could be that<br />
farmers are shifting to more valuable<br />
products as the crop composition also attest.<br />
Explaining market participation<br />
The results from the Probit regression model<br />
on factors that determine households’<br />
market participation, are reported in <strong>Table</strong> 2<br />
below. The fitted binary choice model is<br />
found to explain the observed variation with<br />
the observed probability <strong>of</strong> 0.60 and<br />
predicated probability 0.62. We also<br />
estimated the marginal effects for the Probit<br />
model and these are reported here.<br />
Farmers working under different irrigation<br />
management schemes may have different<br />
probabilities to participate in the market.<br />
Households working in modern irrigation<br />
schemes were found, albeit at 10 percent<br />
level <strong>of</strong> significance, less likely to<br />
participate in the market compared to<br />
rainfed farmers. Similarly, farmers working<br />
under the traditional irrigation scheme are<br />
found to have not significant difference in<br />
participating in output markets. These<br />
results show that participation per se is not<br />
influenced by whether the household works<br />
under irrigation system or not. However,<br />
when we disaggregate by crop types,<br />
farmers growing irrigated annuals and<br />
irrigated perennials are more likely to<br />
participate in the market in contrast to<br />
farmers that grew rainfed annual crops, with<br />
marginal effects 0.21 and 0.29 respectively.<br />
It is believed that this is because the rainfed<br />
annual crops tend to be mainly food crops.<br />
The participation <strong>of</strong> the farmers growing<br />
rainfed perennials is found not to be<br />
significantly different from those growing<br />
rainfed annuals perhaps indicating the<br />
inherently low scale <strong>of</strong> cash crop production<br />
in the former. Hence, the result strongly<br />
indicates that irrigation significantly<br />
contributes to market participation by<br />
enabling farmers to grow crops that are<br />
marketable although rainfed growers also<br />
sell crops for various reasons.<br />
Various household characteristics and<br />
resource level endowment variables were<br />
found to have a significant effect on any<br />
households’ decision to participate in the<br />
market. From among the household<br />
characteristics education attainment <strong>of</strong> the<br />
head <strong>of</strong> the household and family size were<br />
found to be significant in explaining market<br />
participation. The number <strong>of</strong> years <strong>of</strong><br />
education <strong>of</strong> the head was found to be<br />
positively and significantly associated with<br />
the households’ decision to participate in the<br />
market implying that educated households<br />
are more likely to participate in the market.<br />
As education increases by a unit, the<br />
probability <strong>of</strong> participation increases by<br />
about 2 percents. On the other hand family<br />
size was found to have a negative effect on<br />
market participation indicating that<br />
households with more family members are<br />
more likely to focus on food production to<br />
meet family food requirements. This is<br />
typical <strong>of</strong> economies where food markets are<br />
not well developed and, hence, households<br />
choose to first be food-self sufficient, before<br />
they produce for the market. From among<br />
the household resource endowments, the<br />
270
size <strong>of</strong> the operated land area has a positive<br />
and highly significant effect on the decision<br />
to participate in markets. A unit increase in<br />
area <strong>of</strong> operated holding leads to a 23%<br />
increase in the likelihood <strong>of</strong> participation.<br />
This result indicates that land holding size<br />
could be an important constraint to market<br />
participation even if irrigation access is<br />
ensured. Other resources such as labor (both<br />
female and male), oxen holding were found<br />
to be insignificant in explaining market<br />
participation perhaps indicating that these<br />
resources may not pose as significant<br />
constrains to participation per se in rural<br />
Ethiopia.<br />
Distance to the market where produce is<br />
sold and type <strong>of</strong> means <strong>of</strong> transport had also<br />
significant effect on market participation.<br />
Market participation per se increased with<br />
distance to market where the products are<br />
sold. Although this sounds counter intuitive,<br />
this may be related to the fact that<br />
households who manage to transport to<br />
distant but larger markets are likely to<br />
benefit from the high price differentials<br />
manifest in fragmented markets. As<br />
agricultural markets in Ethiopia, as in most<br />
rural economies <strong>of</strong> the developing world, are<br />
not well developed, price effects are not<br />
easily transferred across locations. This<br />
implies that farmers need to select markets<br />
where their products can fetch good prices<br />
and the incentive to take a product further<br />
afield requires market knowledge as a<br />
precondition. Below we test this theory by<br />
determining if the value <strong>of</strong> output increases<br />
with distance to the market where the output<br />
is sold. Conversely, this may also suggest<br />
that irrigation schemes are not positioned<br />
close to markets. Participation also seems to<br />
increase with the use <strong>of</strong> donkeys as a means<br />
<strong>of</strong> transport in reference to use <strong>of</strong> human<br />
power. Those who used donkeys are 6 %<br />
more likely to participate in the market<br />
compared to those who used human power.<br />
Access to input markets were also found to<br />
have significant effect on market<br />
participation <strong>of</strong> households. The households<br />
who reported to have faced input access<br />
problems were found to be the most likely<br />
ones to participate. This may reflect a<br />
reverse causality in that those who<br />
participated in the market ones most likely<br />
to face input access problems. Households<br />
producing for the market were about 6<br />
percent more likely to face input access<br />
problems such as untimely availability <strong>of</strong><br />
seeds, seedlings, and chemicals. This result<br />
was reflected during the rapid appraisal<br />
study which indicated that farmers had a<br />
hard time getting vegetable seeds and<br />
pesticides. This may call for reorientation <strong>of</strong><br />
the input supply system to meet the<br />
requirements <strong>of</strong> the irrigation system.<br />
Community (site) level effects were also<br />
found to be significant in explaining<br />
variations in the probability <strong>of</strong> participation.<br />
These effects could be related to village<br />
level covariates (such as location <strong>of</strong> the site,<br />
agro-ecology and crop suitability factors,<br />
irrigation experience, weather conditions<br />
and other external effects) which may<br />
influence market conditions. So taking<br />
Debre Zeit (Wedecha Belbela systems) as a<br />
reference, we found that households in<br />
Endris (marginal effect -0.20), Golgol Raya,<br />
Haiba (marginal effect -0.17) and Hare<br />
(marginal effect -0.11) are less likely to<br />
participate in the market while households in<br />
Golgotha are more likely to participate<br />
(marginal effect 0.28). Both the Wedecha<br />
and Golgotha irrigation schemes are located<br />
close to the major markets, Addis Ababa and<br />
Nazareth, on a well established marketing<br />
route for vegetables (see Fig. 1). However,<br />
from the results we have here it is difficult<br />
to attribute to one factor, e.g. distance to<br />
market, as being the principal factor<br />
influencing market participation. It is likely<br />
that the dummy variables confound various<br />
factors. Hence, we can only say that there<br />
are site level covariates influencing market<br />
participation.<br />
Finally, although less expected plot level<br />
characteristics such as slope <strong>of</strong> the land and<br />
soil quality were found to be significant in<br />
explaining market participation.<br />
Accordingly, households operating land<br />
271
with medium (marginal effect 0.07) and<br />
steep slope (marginal effect 0.08) were<br />
found to be more likely to participate than<br />
those operating flat lands. One possible<br />
explanation could be that the slope <strong>of</strong> land<br />
may influence crop choice, so irrigated<br />
annuals and/or perennials are grown on such<br />
lands. Households operating medium<br />
(marginal effect 0.06) and good quality<br />
lands (marginal effect 0.08), i.e. with more<br />
productive soils, were found to be more<br />
likely to participate. The effect <strong>of</strong> these plot<br />
characteristics on market participation could<br />
be through their influence on crop choice<br />
and productivity. Below we will explore<br />
further if the same set <strong>of</strong> factors also affect<br />
the level <strong>of</strong> participation, the volume <strong>of</strong> sale<br />
made by households.<br />
Explaining volume decisions<br />
The most important determinants <strong>of</strong> volume<br />
decisions (measured by the value <strong>of</strong> sale) are<br />
reported below. But for the truncated model<br />
we did not report the calculated marginal<br />
effects as the purpose <strong>of</strong> our analysis is not<br />
confined to the sub population. Hence we<br />
report the coefficients as indicated in <strong>Table</strong><br />
3.<br />
Households operating both modern and<br />
irrigation schemes supply more to the<br />
market than farmers working in the rainfed<br />
system. In line with the results from the<br />
binary choice model, farmers growing<br />
irrigated annuals and irrigated perennials<br />
supply more to the market in comparison to<br />
farmers that grow rainfed annuals because,<br />
as indicated above, the rainfed annual crops<br />
tend to be mainly food crops. The results<br />
here, hence, strongly indicate that irrigation<br />
significantly contributes not only to market<br />
participation but also to increased supply <strong>of</strong><br />
produce to the market. This could be the<br />
result <strong>of</strong> increased cropping intensity and<br />
diversification into more cash crops, mainly<br />
horticultural crops. Households that<br />
reported to have faced shortages in rainfall<br />
supplied significantly lower volumes <strong>of</strong><br />
produce, and hence, earned less from the<br />
market. This indicates that shortfalls in rain,<br />
may pose a serious constraint to market<br />
development.<br />
In line with the results in the probability<br />
model, education and family size were also<br />
found to be significant in explaining the<br />
amount <strong>of</strong> sale. The education level <strong>of</strong> the<br />
head <strong>of</strong> household was found to be<br />
positively and significantly associated with<br />
high value <strong>of</strong> sale, implying that educated<br />
households are more likely to be market<br />
oriented. This may be because they are well<br />
positioned to choose high return crops and<br />
introduce innovative technologies. In<br />
contrast to the negative influence <strong>of</strong> family<br />
size on explaining market participation, here<br />
family size was found to have a significant<br />
and positive effect on volume <strong>of</strong> sale. This<br />
suggests that once households have decided<br />
to grow for the market, the family size does<br />
not negatively influence volume <strong>of</strong> sale.<br />
Furthermore, households’ resource<br />
endowments, specifically the size <strong>of</strong> the<br />
operated land area and oxen holding, have<br />
positive and highly significant effects on the<br />
volume <strong>of</strong> sale. Farmers usually allocate part<br />
<strong>of</strong> their land to grow high value crops after<br />
they have allocated sufficient land to grow<br />
food crops. Oxen holding increases the<br />
chance <strong>of</strong> increasing operating land holding<br />
through informal land transaction such as<br />
sharecropping and fixed renting. Therefore,<br />
households endowed with more land and<br />
oxen holding are more likely to sell more to<br />
the market than households with smaller<br />
land holding and no oxen.<br />
Distance to market where the output was<br />
sold has significant effect on the volume <strong>of</strong><br />
sale strengthening our conjecture that<br />
households who are able to participate<br />
transport their produce further but to more<br />
attractive markets. In line with this, the<br />
volume <strong>of</strong> sale was found to be significantly<br />
influenced by the choice <strong>of</strong> transport. In this<br />
case, households who rent vehicles have<br />
higher volumes <strong>of</strong> sale compared to those<br />
using human power. Moreover, unlike the<br />
result in the Probit model, use <strong>of</strong> donkeys as<br />
a means <strong>of</strong> transport has a negative effect on<br />
the volume <strong>of</strong> sale indicating perhaps that<br />
higher volume <strong>of</strong> sale requires other means<br />
272
<strong>of</strong> transport than pack animals or human<br />
power (e.g. ISUZUs, the famous small<br />
trucks which can operate deep in rural<br />
areas.)<br />
In contrast to the participation decision,<br />
reported market related problems were<br />
found to have no significant effect on the<br />
amount <strong>of</strong> goods sold. This implies that<br />
market and marketing related problems may<br />
deter households from participation but once<br />
they have made the decision to participate<br />
they supply what they can. However, those<br />
who reported input access problem were<br />
also found to be supplying more produce to<br />
the market. This may reflect, as argued<br />
earlier, a reverse causality in that those who<br />
participated in the market are more likely to<br />
face inputs access problems. It could also be<br />
related to the location <strong>of</strong> the irrigation<br />
schemes in relation to input supply centers<br />
and the orientation <strong>of</strong> the input supply<br />
system <strong>of</strong> the country. Access to <strong>of</strong>f-farm<br />
income was found to have a negative effect<br />
on the value <strong>of</strong> sale perhaps indicating that<br />
those who have access to <strong>of</strong>f-farm income<br />
do not consider it worth the effort <strong>of</strong><br />
growing for markets.<br />
The same community (site) level effects<br />
were also found to be significant in<br />
explaining variations in the volume <strong>of</strong> sale.<br />
So taking Debre Zeit (Wedecha Belbela<br />
systems) as a reference, we found that<br />
households in Haiba, Hare and Tikurit<br />
supply low volumes <strong>of</strong> output while<br />
households in Golgotha and Zengeny supply<br />
more output (i.e., more valuable),<br />
Disentangling which specific site level<br />
variables are important in explaining market<br />
participation is something that needs further<br />
inquiry.<br />
Finally, the same plot level characteristics<br />
such as slope <strong>of</strong> the land and soil quality<br />
were also found to be significant variables in<br />
explaining volume decisions. Accordingly,<br />
households operating lands with steep slopes<br />
were found to supply more than those<br />
operating flat lands. One possible<br />
explanation is that the slope <strong>of</strong> land<br />
influences crop choice, so irrigated seasonal<br />
or perennials are grown on such lands.<br />
Households operating medium and good<br />
quality lands, i.e. with more productive<br />
soils, were found to be supplying higher<br />
volumes <strong>of</strong> output, underlining that<br />
production enhancing factors have also<br />
market participation enhancing effects.<br />
7. Conclusions and recommendations<br />
The objective <strong>of</strong> this study was to examine<br />
the extent and nature <strong>of</strong> market oriented<br />
production under irrigated systems in<br />
contrast to rainfed systems in Ethiopia. The<br />
study t identified determinants <strong>of</strong> marketoriented<br />
production, including the role <strong>of</strong><br />
irrigation in the process, in order to<br />
understand the main constraints and<br />
opportunities for market oriented<br />
development. Based on the study findings<br />
we have drawn policy implications relating<br />
to institutional arrangements and the<br />
creation <strong>of</strong> adequate infrastructure, which<br />
could benefit a large mass <strong>of</strong> smallholder<br />
producers.<br />
One <strong>of</strong> the most important findings <strong>of</strong> this<br />
study is that irrigation contributes to a<br />
significant increase in market participation,<br />
volume <strong>of</strong> marketed produce and, hence,<br />
income. Farmers working under irrigation,<br />
traditional or modern, supply more marketed<br />
produce and earn more income than farmers<br />
operating under the rainfed system. The bulk<br />
<strong>of</strong> the contribution comes from irrigated<br />
annual and perennial crops, which indicates<br />
that farmers are shifting their cropping mix<br />
as a result <strong>of</strong> access to irrigation.<br />
While irrigation enhances marketed oriented<br />
production, there are a series <strong>of</strong> factors that<br />
pose serious constraints to the process.<br />
Households having on average relatively<br />
larger plots are found to be more market<br />
oriented. This implies that those who have<br />
smaller plots on average have access<br />
problems and tend to focus on food<br />
production. This is especially true with<br />
households that have bigger family sizes.<br />
This calls for policy intervention in the area<br />
<strong>of</strong> easing land transactions and assisting<br />
273
household’s to access important productivity<br />
increasing assets such as oxen.<br />
The study also shows while the impact <strong>of</strong><br />
market oriented production on income<br />
poverty is direct and immediate; households<br />
are faced with a possible trade-<strong>of</strong>f between<br />
growing for the market and growing for<br />
home consumption. Growing for the market<br />
may not ensure household food security in a<br />
situation where food markets function<br />
poorly. Under this situation <strong>of</strong> market failure<br />
households prefer first to be food selfsufficient<br />
and only then become involved in<br />
market production. Another entry point for<br />
policy could, therefore, be to create the<br />
necessary infrastructure and policy<br />
environment to improve the performance <strong>of</strong><br />
food markets. Such measures could induce<br />
farmers to be more market oriented.<br />
Market problems and input access problems<br />
seem to be pervasive in Ethiopia, and more<br />
so in areas where irrigation-induced market<br />
oriented production is high. The study<br />
indicated that farmers face diverse market<br />
problem such as low demand and low<br />
selling price, distance to market, road and<br />
transport problem, same product and peak<br />
time supply, unstable prices, lack <strong>of</strong> services<br />
(information, service cooperatives, etc) and<br />
high tax. Similarly farmers reported that<br />
they faced diverse input access problems the<br />
most important <strong>of</strong> which were high input<br />
prices, lack <strong>of</strong> credit access and lack <strong>of</strong><br />
availability <strong>of</strong> inputs in all seasons and sites.<br />
Transport problems seem to pose a serious<br />
problem as well. Households who are able to<br />
rent vehicles supply more to the market.<br />
Those unable to transport their produce are<br />
unable to reap the benefits <strong>of</strong> better markets.<br />
The implication <strong>of</strong> this evidence is that<br />
irrigation development and market<br />
infrastructure development are poorly<br />
linked. Hence, there is a need to link<br />
irrigation development with road<br />
infrastructure development and<br />
improvements in other marketing services.<br />
There is also a need for reorientation <strong>of</strong> the<br />
input supply system to fit the requirements<br />
<strong>of</strong> the irrigation system.<br />
The study also found that education has<br />
market promoting effects in terms <strong>of</strong><br />
increasing the probability <strong>of</strong> participation<br />
and volume <strong>of</strong> sale. Adequate support to<br />
education can, thus, help in the long-term<br />
transform traditional subsistence agriculture<br />
into more market oriented and modern<br />
agriculture. Finally there are unobservable<br />
site specific effects that influence market<br />
participation and volume decisions.<br />
Identification <strong>of</strong> the most important village<br />
level effects requires further inquiry.<br />
References<br />
Bellemare, M. F., and Barret, C.B. (2006).<br />
An ordered Tobit model <strong>of</strong> market<br />
participation: Evidence from Kenya and<br />
Ethiopia. American Journal <strong>of</strong><br />
Agricultural Economics, 88(2), 324-337.<br />
Bhattarai, M., and Pandy, S. (1997). The<br />
economics <strong>of</strong> wheat production in the<br />
rice-wheat system in Nepal. A chapter in<br />
a book series in P.S. Teng, et al. (Eds.).<br />
1997. Application <strong>of</strong> systems approach<br />
at the farm and regional levels 1:45-57.<br />
Kuluwer Academic Publishers. IRRI,<br />
ICASA. Netherlands.<br />
Bingen, J. Serrano, A. Howard, J. (2003).<br />
Linking farmers to markets: different<br />
approaches to human capital<br />
development. Food Policy 28, 405–419.<br />
Cragg, J. G. (1971). Some statistical models<br />
for limited dependent variables with<br />
application to demand for durable<br />
goods. Econometrica 39, 829-844.<br />
de Janvry, A., Fafchamps, M. and Sadoulet,<br />
E. (1991). Peasant Household Behaviour<br />
with Missing Markets: Some Paradoxes<br />
Explained. Economic Journal 101,<br />
1400-1417.<br />
Fin, T. and P. Schmidt (1984). A test <strong>of</strong> the<br />
Tobit specification against an alternative<br />
suggested by Cragg. Review <strong>of</strong><br />
Economics and Statistic, 66, 174-177.<br />
Greene, W. (2000). Econometric Analysis.<br />
4th edition. Macmillan. New York<br />
Goetz, S. J. (1992). A selectivity model <strong>of</strong><br />
household food marketing behavior in<br />
Sub-Saharan Africa. American Journal<br />
274
<strong>of</strong> agricultural Economics 74(2), 444-<br />
452.<br />
Huang, Q., Rozelle, S. Lohmar, B. Huang,<br />
and J, Wang, J. (2006). Irrigation,<br />
agricultural performance and poverty<br />
reduction in China. Food policy 31, 30-<br />
52.<br />
Hussain, I. (2005). Pro-poor intervention<br />
strategies in irrigated agriculture in<br />
Asia. Poverty in irrigated agriculture:<br />
Realities, issues, and options with<br />
guidelines. <strong>International</strong> <strong>Water</strong><br />
<strong>Management</strong> <strong>Institute</strong>. Final synthesis<br />
report.<br />
Hussain and Hanjira (2003). Does irrigation<br />
water matter for rural poverty<br />
alleviation? Evidence from South and<br />
South-East Asia. <strong>Water</strong> policy 5, 429-<br />
442.<br />
Hussain I. and Hanjra, A. (2004) Irrigation<br />
and poverty alleviation: Review <strong>of</strong> the<br />
empirical evidence. Irrigation and<br />
Drainage 53, 1-15.<br />
Lapar, M.L., Holloway, G., Ehui, S. (2003).<br />
Policy options promoting market<br />
participation among smallholder<br />
livestock producers: a case study from<br />
the Philippines. Food Policy 28, 187–<br />
211<br />
Rogers, W.H., (1993). Regression standard<br />
errors in clustered samples. STATA<br />
Technical Bulletin 13, 19-23. STATA<br />
Corporation.<br />
Rosegrant, W. Mark, Renato Gazmuri<br />
Schleyer and Satya N. Yadav (1995).<br />
<strong>Water</strong> policy for efficient agricultural<br />
diversification: market-based<br />
Approaches. Food Policy 20(3), 203-<br />
223.<br />
von Braun, J. (1995). Agricultural<br />
commercialization: Impact on income<br />
and nutrition and implications for<br />
policy. Food Policy 20(3), 187-202.<br />
Wooldridge, M.J., (2002). Econometric<br />
analysis <strong>of</strong> cross section and panel data.<br />
MIT, Cambridge, Massachusetts, 752<br />
pp.<br />
World Bank (2006). Managing water<br />
sources to maximize sustainable growth:<br />
A World Bank <strong>Water</strong> Resource<br />
Assistance Strategy for Ethiopia.<br />
Agriculture and Rural Development<br />
Department. World Bank. 91 pp.<br />
Ministry <strong>of</strong> Finance and Economic<br />
Development (MOFED). (2006).<br />
Ethiopia: Building on Progress. A Plan<br />
for Accelerated and Sustained<br />
Development to End Poverty (MOFED).<br />
(2005/06-2009/10). Volume I: Main<br />
Text. Ministry <strong>of</strong> Finance and Economic<br />
Development (MoFED). September,<br />
2006. Addis Ababa. 229 pp.<br />
Pandey, V.K. and Sharma, K.C. (1996).<br />
Crop diversification and self sufficiency<br />
in food grains. Indian Journal <strong>of</strong><br />
Agricultural Economics 51 (4), 644-651.<br />
275
Fig. 1: Sample sites<br />
276
<strong>Table</strong> 1A: Study sites<br />
Region Scheme name Typology Closer town Irrigation type Sample<br />
size<br />
Oromiya Endris System Small Ambo<br />
Modern 55<br />
Oromiya<br />
Wedecha-<br />
Belbella System<br />
Medium<br />
Debre Zeit<br />
Oromiya Golgotha Medium Nazareth<br />
Amhara Zengeny Medium Gimjabet<br />
Amhara Tikurit Small Bahir Dar<br />
Tigray Haiba Medium Samre/ Mekelle<br />
Tigray Golgol Raya Microirrigation<br />
Alamata<br />
SNNPR Hare Medium Arba Minch<br />
Traditional 55<br />
Dryland 55<br />
Modern 55<br />
Traditional 53<br />
Dryland 57<br />
Modern 55<br />
Dryland 55<br />
Modern 55<br />
Dryland 53<br />
Traditional 83<br />
Dryland 47<br />
Modern 54<br />
Dryland 54<br />
Modern 53<br />
Dryland 46<br />
Modern 55<br />
Traditional 54<br />
Dryland 55<br />
277
<strong>Table</strong> 1: Summary statistics<br />
Variable name<br />
Mean (Standard deviation in parenthesis)<br />
Overall Rainfed Irrigated<br />
Age <strong>of</strong> household head, years (n= 4915) 46 (15) 45.0 (15.09) 46.29 (15.05)<br />
Years <strong>of</strong> education <strong>of</strong> household head 2.0 (3.1) 2.05 (3.06) 1.98 (3.07)<br />
(n= 4900)<br />
Family size, (n= 4948) 5.7 (2.4) 5.54 (2.35) 5.87 (2.48)<br />
No. <strong>of</strong> Female adults (n= 4948) 1.4 (0.85) 1.34 (0.74) 1.39 (0.89)<br />
No. <strong>of</strong> male adults (n= 4948) 1.5 (1.0) 1.45 (0.94) 1.58 (1.07)<br />
Amount <strong>of</strong> income from non-farm, Birr 537 (3067) 705.54 (4125.69) 459.60 (2422.15)<br />
(n= 4948)<br />
Remittances, Birr (n= 4948) 243 (1973) 27.38 (646.05) 342.89 (2339.14)<br />
Number <strong>of</strong> oxen (n= 4923) 1.4 (1.2) 1.56 (1.07) 1.32 (1.21)<br />
Number <strong>of</strong> donkeys (n= 4923) 0.5 (0.9) 0.65 (0.94) 0.50 (0.86)<br />
Number <strong>of</strong> contacts <strong>of</strong> household with 1.6 (3.2) 2.36 (3.97) 1.25 ( 2.73)<br />
extension agent (n= 4948)<br />
Number <strong>of</strong> contacts <strong>of</strong> extension agent 2.5 (5.3) 3.79 (6.38) 1.89 (4.59)<br />
with households (n= 4948)<br />
Land area, ha (n= 4786) 1.4 (1.2) 1.34 (1.39) 1.42 ( 1.19)<br />
Distance to market where output was 7.6 (6.9) 8.36 (7.49) 7.18 (6.67)<br />
sold, km (n= 4947)<br />
Gross value <strong>of</strong> Sales, birr (n= 4948) 591 (2169) 476.10 (1076.1) 645.14 (518.65)<br />
Market problem Dummy (yes =1) (n= 40.7 37.7 42.1<br />
4953)<br />
Input access problem Dummy (yes =1) 46.6 53.3 43.4<br />
(n= 4953)<br />
Rain/water shortage Dummy (yes =1)<br />
(n= 4953)<br />
39.1 26.8<br />
278
% <strong>of</strong> plots<br />
% <strong>of</strong> plots<br />
20<br />
18<br />
16<br />
14<br />
12<br />
10<br />
8<br />
6<br />
4<br />
2<br />
0<br />
maize<br />
w heat<br />
teff<br />
mango<br />
potato<br />
banana<br />
tom ato<br />
Ense t<br />
sugar cane<br />
pepper<br />
onion<br />
chick pea<br />
25<br />
20<br />
15<br />
10<br />
5<br />
0<br />
teff<br />
maize<br />
wheat<br />
onion<br />
tom ato<br />
barley<br />
potato<br />
c abba ge<br />
sorghum<br />
banana<br />
chick p ea nu g<br />
Fig. 3a: Dominant crops under traditional irrigation system (n= 1240) Fig. 3b: Dominant<br />
crops under modern irrigation system (n= 2092)<br />
% <strong>of</strong> plots<br />
30<br />
25<br />
20<br />
15<br />
10<br />
5<br />
0<br />
teff<br />
wheat<br />
maize<br />
sorghum<br />
barley<br />
nug<br />
bean<br />
eucalyptus<br />
lathyrus<br />
gesho<br />
mango<br />
onion<br />
potato<br />
Fig. 3c: Dominant crops under modern rainfed system (n= 1533)<br />
279
<strong>Table</strong> 2: Determinants <strong>of</strong> the probability <strong>of</strong> participation (standard errors adjusted for<br />
cluster effects)<br />
Dependent variable : Whether the household sells a product to the market or not (0/1)<br />
Variable description Coefficient Standard errors<br />
Female headed household (dummy variable male =0) 0.022 0.078<br />
Age <strong>of</strong> the household head 0.001 0.002<br />
Education level <strong>of</strong> head 0.017 .010*<br />
family size -0.026 0.016*<br />
Female adult -0.050 0.037<br />
Male adult 0.038 0.032<br />
Off-farm income 1.02e-06 7.69e-06<br />
Remittance income 0.0001 0.00003<br />
Oxen holding -0.013 0.025<br />
Distance to the market where output is sold (in km) 0.016 0.005***<br />
Means <strong>of</strong> transport (donkey) (reference= human) 0.151 0.090*<br />
Means <strong>of</strong> transport (horse) (reference= human) 0.228 0.171<br />
Means <strong>of</strong> transport (mule) (reference= human) 0.115 0.199<br />
Means <strong>of</strong> transport (vehicle) (reference= human) 0.059 0.118<br />
Household’s contact with extension agent 0.003 0.011<br />
Land area (in ha) 0.062 0.023***<br />
Rain shortage (dummy 1= yes) 0.026 0.074<br />
Irrigation water shortage (dummy 1= yes) -0.021 0.085<br />
traditional scheme (dummy reference =rainfed) -0.050 0.084<br />
Modern scheme (dummy reference =rainfed) -0.278 0.075***<br />
Input access problem (dummy 1= yes) 0.171 0.065***<br />
Marketing problem (dummy 1= yes) 0.042 0.059<br />
Dry land perennial (reference dry land seasonal) 0.109 0.120<br />
Irrigated seasonal (reference dry land seasonal) 0.582 0.070***<br />
Irrigated perennial (reference dry land seasonal) 0.996 0.158***<br />
Endris irrigation scheme (reference= Debere Zeit) -0.506 0.095***<br />
Golgol Raya irrigation scheme (reference= Debere Zeit) -0.448 0.136***<br />
Golgota irrigation scheme (reference= Debere Zeit) 0.921 0.192***<br />
Haiba irrigation scheme (reference= Debere Zeit) -0.441 0.112***<br />
Hare irrigation scheme (reference= Debere Zeit) -0.281 0.152*<br />
Tikurit irrigation scheme (reference= Debere Zeit) -0.020 0.128 *<br />
Zenegeny irrigation scheme (reference= Debere Zeit ) -0.038 0.184<br />
Medium Slope (dummy reference= flat) | 0.190 0.0622***<br />
Steep slope (dummy reference= flat) 0.215 0.102**<br />
Medium fertility (dummy reference= poor) 0.165 0.077**<br />
good fertility (dummy reference= poor) | 0.228 0.078***<br />
_cons | -0.194 0.176<br />
Number <strong>of</strong> obs = 3754<br />
Wald chi2(36) = 300.17<br />
Prob > chi2 = 0.0000<br />
Log pseudo-likelihood = -2276.33<br />
Pseudo R2 = 0.0969<br />
*, **, *** significant at 10, 5 and 1 percent level <strong>of</strong> significance.<br />
280
<strong>Table</strong> 3: Level <strong>of</strong> participation (Value <strong>of</strong> sale)<br />
Dependent variable: Value <strong>of</strong> sale (in Birr)<br />
Variable description Coefficient Standard errors<br />
Female headed household (dummy variable male =0) -3679.5 (473.846)<br />
Age <strong>of</strong> the household head 37.04 (79.00)<br />
Education level <strong>of</strong> head 2001.188 (486.2001)***<br />
family size 2831.62 (689.7989 )***<br />
Female adult -4731.888 (1960.598)**<br />
Male adult -2636.161 (1702.532)<br />
Off-farm income -1.124729 (.3445668)***<br />
Remittance income -.5153223 (.7632368)<br />
Oxen holding -2780.298 (1304.623)**<br />
Distance to market 160.1715 (107.3297)<br />
Means <strong>of</strong> transport (donkey) (reference= human) -23025.99 6164.656***<br />
Means <strong>of</strong> transport (horse) (reference= human) -2342.406 6569.129<br />
Means <strong>of</strong> transport (mule) (reference= human) 7528.12 8567.152<br />
Means <strong>of</strong> transport (vehicle) (reference= human) 19583.99 5675.037***<br />
Household’s contact with extension agent -1264.534 (688.0457)*<br />
Land area 6722.116 (728.9046)***<br />
Rain shortage (dummy 1= yes) -7626.328 (4227.934)*<br />
Irrigation water shortage (dummy 1= yes) -3272.534 (4214.353)<br />
traditional scheme (dummy reference =rainfed) 20030.93 (5983.328)***<br />
Modern scheme (dummy reference =rain fed) 17768.58 (5768.995)***<br />
Input access problem (dummy 1= yes) 13467.66 (3457.655)***<br />
Marketing problem -4479.403 (3194.229)<br />
Dry land perennial (reference dry land seasonal) -11678.92 (10525.31)<br />
irrigated seasonal (reference dry land seasonal) 17526.23 (4057.36)***<br />
irrigated perennial (reference dry land seasonal) 24931.89 (7034.23)***<br />
Endris irrigation scheme (reference= deberezeit) -5600.18 (5543.335)<br />
Golgol Raya irrigation scheme (reference= deberezeit) -9191.548 (6577.918)<br />
Golgota irrigation (reference= deberezeit) 11853.08 (6385.049) *<br />
Haiba irrigation scheme (reference= deberezeit) -197758 (24293.52)***<br />
Hare irrigation scheme (reference= deberezeit) -47682.18 (11743.92)***<br />
Tikurit irrigation scheme (reference= deberezeit) -28460.84 (7124.578)***<br />
Zenegeny irrigation scheme (reference= deberezeit) 39782.97 (9889.322)***<br />
Medium Slope (dummy reference= flat) | 2169.702) (3414.557<br />
Steep slope (dummy reference= flat) 26719.8 (6862.004)***<br />
Medium fertility (dummy reference= poor) 11340.24 (6171.729)*<br />
good fertility (dummy reference= poor) | 12887.67 (6265.083)**<br />
_cons -106551.5 (13938.39)***<br />
sigma _cons | 8990.92 (327.1781)***<br />
Number <strong>of</strong> obs = 4610<br />
(2086 left-censored observations at<br />
gvout chi2 = 0.0000<br />
Log likelihood = -32017.082<br />
Pseudo R2 = 0.0046<br />
*, **, *** significant at 10, 5 and 1 percent level <strong>of</strong> significance.<br />
281
Small Scale Irrigation Interventions for System Productivity and<br />
Natural Resource <strong>Management</strong> in Ethiopian Highlands:<br />
Benefits and Best-bets<br />
Tilahun Amede 1 , Ayele Gebre-Mariam 2 and Fabrizio Felloni 3<br />
1 <strong>International</strong> <strong>Water</strong> <strong>Management</strong> <strong>Institute</strong> (IWMI)/ <strong>International</strong> Livestock Research <strong>Institute</strong><br />
(ILRI), Addis Ababa, Ethiopia<br />
2 Private consultant, Addis Ababa, Ethiopia<br />
3 Evaluation <strong>of</strong>fice, IFAD, Rome<br />
T.amede@cgiar.org<br />
Abstract<br />
<strong>Water</strong> scarcity became a common<br />
phenomenon in Ethiopia with drought<br />
frequency <strong>of</strong> at least once in three years<br />
while the country owns a large irrigation<br />
potential that should be exploited<br />
sustainably. Various national and<br />
international institutions are currently<br />
engaged in developing small scale irrigation<br />
(SSI) schemes for poverty alleviation. A<br />
monitoring and evaluation exercise was<br />
conducted in 2004 and in 2006 in four<br />
administrative regions <strong>of</strong> Ethiopia, namely<br />
Tigray, Southern regions, Oromia and<br />
Amhara, to assess the benefits and<br />
associated environmental effects <strong>of</strong> SSI<br />
investments <strong>of</strong> the <strong>International</strong> Fund for<br />
Agricultural Development (IFAD). A<br />
combination <strong>of</strong> participatory M&E tools<br />
namely, individual interviews, group<br />
discussions, key informants, review <strong>of</strong><br />
relevant documents and field observations<br />
were used. The mission was supported by an<br />
in depth pre-mission socio-economic survey<br />
in three representative irrigation schemes.<br />
Data from the sites indicated that 50 % <strong>of</strong><br />
the respondents had improved food security<br />
and higher income, while 26% <strong>of</strong> the<br />
respondents did not see any change on their<br />
livelihoods. Crop yield under irrigation was<br />
by 35% to 200% higher than under rain fed<br />
conditions, with much higher benefit<br />
obtained from high potential areas and in<br />
farms where external inputs (fertilizer,<br />
improved seeds and pesticides) are<br />
accessible. The positive effect was more<br />
visible with horticultural crops. There has<br />
been also a shift towards improved varieties<br />
with access to irrigation. Farmers replaced<br />
early maturing but low yielding varieties<br />
with high yielding varieties. Crop<br />
diversification increased significantly, in<br />
some sites from three to about 15 species,<br />
although this decision making process did<br />
not favour legumes. The apparent effect was<br />
on crop rotation, intercropping and land<br />
management with in the order <strong>of</strong> 79, 42 and<br />
35%, respectively. On the other hand, there<br />
is a decline in number <strong>of</strong> livestock per<br />
household, but an increased number <strong>of</strong><br />
draught oxen. The decline is associated with<br />
reduced grazing area due to conversion <strong>of</strong><br />
dry season fallow to vegetable fields and an<br />
increase in area enclosure in the sloppy<br />
landscapes. The shift from cereal to<br />
vegetable-dominated cropping increased the<br />
competition for water between downstream<br />
and upstream users and between resourcerich<br />
and poor farmers. The impact <strong>of</strong><br />
irrigation schemes should be evaluated<br />
better on long term benefits than short term<br />
fixes, as farmers initiated long term<br />
investments like planting perennial fruits,<br />
bought calves and other retail trade<br />
investments. The communities would<br />
benefit most from further integration <strong>of</strong><br />
livestock into the schemes by adopting feed<br />
sourcing strategies for dairy and fattening.<br />
The paper also presented best-bets for<br />
improved irrigation management in<br />
Ethiopia.<br />
Introduction<br />
282
<strong>Water</strong>, land and finance are becoming the<br />
scarcest resources in the agricultural system<br />
<strong>of</strong> Ethiopia, scarcity being severe in regions<br />
where population pressure is high, access to<br />
market infrastructure is low and<br />
environmental calamities are frequent.<br />
Inefficient water management in the rainfed<br />
agriculture coupled with accelerated land<br />
degradation plays an important role in<br />
aggravating the recurrent food insecurity in<br />
the country. In the recent years, drought<br />
became a common phenomenon, happening<br />
in any part <strong>of</strong> the country at any time <strong>of</strong> the<br />
year, with a frequency <strong>of</strong> at least once in<br />
three years. Four different drought scenarios<br />
were identified in the mixed crop-livestock<br />
systems <strong>of</strong> Ethiopia namely, terminal<br />
drought, intermittent drought, foreseeable<br />
drought and definite drought (Amede, et al.,<br />
2004a). In situations where agricultural<br />
production is operating under these various<br />
drought scenarios, with annual rain fall<br />
variability <strong>of</strong> 40 to 50%, supplementary<br />
irrigation became a necessity for food<br />
production, particularly for intensifying<br />
systems through high yielding and input<br />
responsive varieties and breeds. Currently,<br />
the growth in food production in Ethiopia is<br />
primarily due to expansion <strong>of</strong> agricultural<br />
land while production pre unit <strong>of</strong> investment<br />
remained stagnant.<br />
On the other hand, Ethiopia owns a wide<br />
range <strong>of</strong> irrigation opportunities with about<br />
9.85 million ha <strong>of</strong> potentially irrigable<br />
arable land, while only 3 to 5% <strong>of</strong> the<br />
potential is currently under irrigation (WCD,<br />
2000) accounting for approximately 3 per<br />
cent <strong>of</strong> total food crop production. Current<br />
yield from rain-fed land is only about 50%<br />
<strong>of</strong> the irrigated land, given all other inputs<br />
remain the same, thanks to the recurrent<br />
drought and limited adoption <strong>of</strong> water<br />
management practices. If the country is to<br />
achieve its stated aims <strong>of</strong> food selfsufficiency<br />
and food security, the current<br />
production shortfalls call for drastic<br />
measures to improve production efficiency<br />
<strong>of</strong> both irrigated and rain-fed agriculture. In<br />
response, the government <strong>of</strong> Ethiopia as<br />
stated in its Poverty Reduction Strategy<br />
Paper (PRSP) emphasized the importance <strong>of</strong><br />
improved water resource development and<br />
its utilization to achieve food security<br />
through enhanced use <strong>of</strong> small scale<br />
irrigation. Since the early 1990s’ the federal<br />
and regional governments <strong>of</strong> Ethiopia, with<br />
financial assistance from donors, have been<br />
attempting to upgrade traditional small scale<br />
schemes, built small scale dams, diversions<br />
and water harvesting ponds to respond to<br />
these environmental calamities. However,<br />
the performance <strong>of</strong> the irrigation systems<br />
has been poor. There exists a substantial<br />
yield gap in irrigated farms between<br />
achievable and actual yield both in terms <strong>of</strong><br />
yield per unit <strong>of</strong> land but also yield per unit<br />
<strong>of</strong> water depleted.<br />
Moreover, there exists conflicting reports<br />
regarding the agricultural benefits <strong>of</strong> small<br />
scale irrigation and its impact on natural<br />
resource management (Tafesse, 2003; IFAD,<br />
2003; Kijne, FAO; Ersado, 2005). In<br />
some sites, small scale irrigation has<br />
significantly increased crop yield, and<br />
households using irrigation have higher<br />
agricultural production than nonintervention<br />
communities (Ersado, 2005). In<br />
others, small scale irrigation didn’t bring<br />
significant increase in crop yield and<br />
livestock productivity directly but increased<br />
yield by about 26& by promoting increased<br />
use <strong>of</strong> improved seeds and fertilizer (Pender<br />
and Gebremedhin, 2004). These differences<br />
on impact <strong>of</strong> irrigation on agricultural<br />
productivity may have appeared because <strong>of</strong><br />
the fact that small scale irrigation for food<br />
security is more than just technologies; but<br />
comprises production, marketing, credit,<br />
social, policy and institutional issues<br />
(Tafesse, 2003). It could be also because <strong>of</strong><br />
differences in methodologies. In general,<br />
irrigation farming is expected to reduce<br />
farmers’ exposure to variability in crop and<br />
livestock yields and therefore improve food<br />
insecurity, especially in the more remote,<br />
disadvantaged and poorer areas; to raise<br />
agricultural production and rural incomes<br />
where crop diversification and marketoriented<br />
agriculture can be promoted; and to<br />
283
enhance the capacity <strong>of</strong> communities to<br />
demand for better services but also to test,<br />
modify and adopt improved technologies.<br />
The objectives <strong>of</strong> this paper are i) to<br />
quantify the negative and positive effects <strong>of</strong><br />
small scale irrigation on small holder<br />
farmers and their systems and ; ii) to identify<br />
the biophysical and socio-economic factors<br />
affecting the performance <strong>of</strong> small scale<br />
irrigation schemes .<br />
Materials and Methods<br />
Sites and regions<br />
Four major administrative regions <strong>of</strong><br />
Ethiopia, namely Amhara, Oromia, Southern<br />
Regions and Tigray were considered for the<br />
study. These areas are characterized by food<br />
insecurity, drought prone and very high<br />
human and animal population. Based on<br />
altitude, annual rain fall and average<br />
temperature, these sites fall into two <strong>of</strong> the<br />
major traditional agroecological zones<br />
namely; i) Weinadega: mid highlands<br />
between 1 500 and 2 300 mts above sea<br />
level with wheat, teff, barley, maize,<br />
sorghum, faba beans and chickpeas as<br />
predominant crops while cattle, donekeys<br />
and small ruminants are the predominant<br />
animals and; ii) Dega: highlands between<br />
2 300 and 3 200 meters with barely, wheat,<br />
oilseeds, and lentils as predominant crops<br />
and sheep and cattle being dominant<br />
livestock enterprises.<br />
During the field work a total <strong>of</strong> 16 <strong>of</strong> the<br />
IFAD SCP II irrigation schemes, those<br />
established in 1988?? in Tigray, 5 in<br />
Oromia, and 2 in SNNPR were considered.<br />
In addition discussions were held in all four<br />
project regions, and with a total <strong>of</strong> 14<br />
project woredas. Most <strong>of</strong> these woredas are<br />
considered by the Disaster Prevention and<br />
Protection Commission (DPPC) as food<br />
insecure (Fig 1). Since time did not permit<br />
visits to all 58 schemes <strong>of</strong> the project, a<br />
sampling approach was taken. A variety <strong>of</strong><br />
scheme characteristics was identified<br />
(including distance from roads/markets; age;<br />
perceived performance), but nevertheless<br />
some compromises had to be made due to<br />
accessibility. In Oromia and SNNPR the<br />
opportunity was taken to visit older and new<br />
schemes while in Tigray schemes were<br />
selected covering a range <strong>of</strong> remoteness<br />
from Mekelle.<br />
The studied schemes have been selected<br />
through a two-stage procedure. First a list<br />
was compiled <strong>of</strong> schemes constructed under<br />
SCP II and operated for at least three years<br />
(i.e. the more “mature” sites for impact<br />
assessment). Next one scheme in each <strong>of</strong><br />
SNNPR, Oromia and Tigray has been<br />
extracted by simple random sampling.<br />
Data Collection<br />
The quantitative and qualitative date about<br />
the impact <strong>of</strong> small scale irrigation on<br />
system productivity and food security was<br />
collected in two rounds; between 13th<br />
September and 14th October 2004 and from<br />
12 November to 2 December 2006, as part<br />
<strong>of</strong> an IFAD field evaluation mission. The<br />
study team started the mission by<br />
interviewing and discussing with IFAD<br />
stakeholders at different hierarchies starting<br />
from the federal ministry <strong>of</strong> water resources<br />
in Addis Ababa down to the scheme site<br />
team members. The data collection<br />
considers interviews <strong>of</strong> farmers, community<br />
leaders, extension agents, key informants,<br />
district subject matter specialists, bureau<br />
heads and federal authorities. We used PRA<br />
tools including transect walks, community<br />
group discussions, sample measurements<br />
and secondary data from actors at all levels.<br />
The mission was supported by a pre-mission<br />
socio-economic survey, which was carried<br />
out to obtain in-depth understanding <strong>of</strong> three<br />
small scale irrigation schemes (Hizaeti Afras<br />
in Tigrai, Nadhi Gelansedi in Oromia and<br />
Dobena in Southern regions) in the period<br />
June-September (IE Preliminary survey,<br />
2004). Prior to the field trips a checklist was<br />
prepared considering relevant agronomic,<br />
natural resource management and livelihood<br />
indicators and considered during data<br />
collection from the respective sites,<br />
284
communities and stakeholders. The premission<br />
survey also considered three<br />
information sources namely literature<br />
review, focus group discussion for<br />
communities and questionnaire for<br />
interviewing selected households. A PRA<br />
tool has been administered for focus group<br />
discussions with WUAs consisting <strong>of</strong> men<br />
and women. The focus group participants<br />
were 15-20, with 5-6 women per meeting. A<br />
prepared checklist was used as a guide for<br />
the exercise. A questionnaire was prepared<br />
for a household survey and 84 farmers in<br />
Dobena and 155 farmers in Nadhi Gelan<br />
Sadi and 136 farmers in Hizaeti Afras were<br />
interviewed. The interview was carried out<br />
by random walk from homestead to<br />
homestead: adult heads <strong>of</strong> household with<br />
irrigated land were interviewed. In the case<br />
<strong>of</strong> Dobena, all households were interviewed,<br />
as the scheme users were fewer than the<br />
planned sample (100 to 150 respondents per<br />
scheme).<br />
During the main mission, a combination <strong>of</strong><br />
five participatory M&E tools were used to<br />
assemble information and data namely,<br />
individual interviews, group discussions,<br />
key informant interviews, review <strong>of</strong> relevant<br />
documents and field observations. On site,<br />
the information gathering techniques<br />
included quantitative (through structured<br />
questionnaires) and qualitative (through<br />
semi-structured interviews) methods with<br />
both individual informants and groups, and<br />
observations combined with discussions.<br />
Secondary data and information from<br />
woreda, regional and federal institutions that<br />
have had a stake in respective projects were<br />
also carefully studied.<br />
Results and Discussion<br />
Scheme development<br />
The project sites were identified for SSI<br />
development either because the respective<br />
communities contacted the woreda <strong>of</strong>ficials<br />
through their local representatives (e.g.<br />
Nazre in Tigrai) demanding the<br />
development <strong>of</strong> irrigation schemes. In other<br />
sites, the schemes were identified by<br />
irrigation engineers through a pilot survey in<br />
assessing various water resources, including<br />
perennials rivers. The need for upgrading<br />
the traditional irrigation schemes arose from<br />
the fact that traditional schemes were<br />
underperforming despite years <strong>of</strong> experience<br />
<strong>of</strong> communities in irrigation management.<br />
The results <strong>of</strong> the interviews indicated that<br />
the reasons why communities demanded for<br />
upgrading traditional schemes were 1)<br />
continual distraction <strong>of</strong> canals by erosion,<br />
siltation, animals and human activities; 2)<br />
extremely high labor demand to maintain<br />
and clean traditional irrigation canals; 3)<br />
considerable loss <strong>of</strong> irrigation water from<br />
the traditional canals due to seepage and<br />
easy destruction <strong>of</strong> canals by heavy rains; 4)<br />
the difficulties faced by the respective<br />
communities to build permanent crossovers<br />
over gullies to reach communities on the<br />
other sides <strong>of</strong> gullies and river sides, as it<br />
was observed in Mumicha in Oromia; 5)<br />
most <strong>of</strong> the traditional command areas were<br />
those on flat lands and valley bottoms, but it<br />
excluded fields even with very slight slopes<br />
and; 6) there was very limited institutional<br />
support in accessing marketable enterprises,<br />
technological innovations, and integrated<br />
extension services to crop, livestock, land<br />
and water management.<br />
1. Impact on system productivity<br />
The impact <strong>of</strong> irrigation schemes on system<br />
productivity could be seen from the<br />
perspective <strong>of</strong> its effect on crop, livestock<br />
and labour productivity in the respective<br />
sites. Though the time period was very short<br />
to evaluate the impact <strong>of</strong> irrigation on the<br />
productivity <strong>of</strong> some <strong>of</strong> the systems, as the<br />
schemes were 2 to 10 years old, there are<br />
variable results emerging from different<br />
sites and regions.<br />
1.1 Crop yield<br />
In average, crop yield under irrigation was at<br />
least by 35% higher compared to non-<br />
285
irrigated farms (<strong>Table</strong> 1), with benefits<br />
being much higher in high potential areas<br />
and in farms where external inputs<br />
(fertilizer, improved seeds and pesticides)<br />
were accessible. Maize was one <strong>of</strong> the most<br />
preferred crops farmers have been producing<br />
under irrigation across sites, accompanied<br />
by vegetables. Farmers have indicated a<br />
significant yield increase, particularly in<br />
drought sensitive crops like maize (<strong>Table</strong>s 1<br />
and 2), which otherwise could completely<br />
fail if the terminal or intermittent drought<br />
coincides with the drought sensitive stage <strong>of</strong><br />
the crop i.e. flowering period. Most farmers<br />
with market access produced green maize<br />
(about 20% <strong>of</strong> the area across Tigray)<br />
(COSART, 2001) with high stover quality<br />
for fodder. A case study in Tigray showed<br />
that in good years a farmer obtained about 6<br />
and 3.5 tonnes ha-1 <strong>of</strong> maize under irrigated<br />
and rain-fed conditions, respectively, with<br />
about 60% yield advantage. A comparable<br />
amount <strong>of</strong> yield advantage was displayed by<br />
a farmer in Burka Woldiya, Oromia. Across<br />
sites, crop yield under irrigation was by 35%<br />
to 200% higher than under rain fed<br />
conditions (<strong>Table</strong>s 1 and 2), with much<br />
higher benefit in high potential areas and in<br />
farms where external inputs (fertilizer,<br />
improved seeds and pesticides) are<br />
accessible.<br />
In drought prone sites, farmers replaced the<br />
early maturing but low yielding variety (e.g.<br />
Katumani) by a high yielding maize cultivar<br />
(e.g. Awassa 511) thanks to access to<br />
irrigation and obtained a 200% grain yield<br />
increase (BOA, Wukro Woreda, 09/2004). A<br />
similar trend was obtained with wheat and<br />
faba beans (<strong>Table</strong> 2). Farmers in Nazre<br />
(Tigray) indicated that they got up to 4x<br />
more onion yield today because <strong>of</strong> the<br />
combination <strong>of</strong> access to irrigation, good<br />
varieties, access to pesticides and better<br />
extension support. Crop yield increase was<br />
substantial particularly for horticultural<br />
crops not only because <strong>of</strong> improved access<br />
to irrigation but also associated trainings and<br />
improved flow <strong>of</strong> information in pest<br />
management, organic manure application<br />
and improved water management skills.<br />
Moreover, the survey conducted in the three<br />
representative schemes indicated differences<br />
in crop yield among sites. For instance, in<br />
Dobena, the yield <strong>of</strong> tomato, potato<br />
cabbages and onions were 102, 94, 82 and<br />
44 qt/ha while in Nadhi Gelan Sadi, it was<br />
35, 37, 24 and 38 qt/ha, respectively (data<br />
not presented), which could be explained by<br />
difference in agricultural potential <strong>of</strong> the<br />
sites, particularly due to soil fertility and<br />
rain fall amount and distribution. In general,<br />
an increase in crop yield was accounted not<br />
only to improved access to irrigation but<br />
also to associated services in extension and<br />
input delivery. Moreover, the current<br />
distribution <strong>of</strong> water by water masters<br />
followed the principle <strong>of</strong> rotational irrigation<br />
for priority crops known to the majority and<br />
exceptionalities are established only after<br />
strong negotiation. For instance in Nazre,<br />
the order <strong>of</strong> priority for getting access to<br />
water was faba beans, tomato, pepper,<br />
onions, and spices. This form <strong>of</strong> bylaws may<br />
limit farmer innovation and responsiveness<br />
<strong>of</strong> individuals to market demands.<br />
They consumed 71% <strong>of</strong> the cereals, pulses<br />
and oil seeds, 26% <strong>of</strong> the vegetables and<br />
about 2% <strong>of</strong> the fruits while they sold the<br />
rest to generate cash income. An economic<br />
analysis done with 10 representative heads<br />
<strong>of</strong> households indicated that their total gross<br />
earnings from the sales <strong>of</strong> these products<br />
was EB 22,602. Their net cash income per<br />
household after deducting costs was EB<br />
1,141. In addition each household retained<br />
produce to a value <strong>of</strong> EB 1,181 which they<br />
used for home consumption (IFAD, 2004).<br />
In few schemes (e.g. Belessa), irrigation had<br />
no significant effect on crop yield for<br />
various reasons. In some it was because <strong>of</strong><br />
shortage <strong>of</strong> water at the critical crop stages,<br />
while in others it was because <strong>of</strong> poor<br />
agronomic practices related to very low<br />
population density, late weeding, lack <strong>of</strong><br />
fertilizer application and absence <strong>of</strong> pest<br />
control.<br />
1.2 Crop diversification<br />
286
Traditionally, most <strong>of</strong> the sites were cereal<br />
growers, except for Chat in Harer and<br />
Onions and Pepper in few sites near to major<br />
roads. The primary cereal crops grown<br />
under supplementary irrigation were maize,<br />
wheat, and barley. With the development <strong>of</strong><br />
irrigation schemes farmers have shifted<br />
towards growing diverse crop, in some sites<br />
up to 10 new marketable crops,<br />
predominantly vegetables. The bureau <strong>of</strong><br />
agriculture played a key role in the<br />
introduction <strong>of</strong> new crops through<br />
establishing multiple demonstration plots in<br />
farmers’ fields. Access to irrigation and<br />
opening up <strong>of</strong> new market opportunities<br />
encouraged farmers to systematically<br />
allocate their land to various enterprises,<br />
both in rain fed and irrigable fields. For<br />
instance in Lalay agula, Tigray, farmers<br />
allocate 30, 31, 25, 10 and 3% <strong>of</strong> their land<br />
to wheat, maize, pepper, barley, and teff,<br />
respectively under rainfed conditions, while<br />
under irrigation the land allocation was 35,<br />
10, 50, 2 and 1.5% for pepper, onions,<br />
maize, tomato and cabbage, respectively<br />
(COSART, 2001). Besides, almost all<br />
varieties <strong>of</strong> crops grown in the sites at the<br />
time <strong>of</strong> the mission were improved varieties<br />
came along with the diversion schemes via<br />
the Woreda bureaus. For instance in Lalay<br />
agula, there has been a shift from the local<br />
maize variety Birhu to improved varieties,<br />
Katumani and Awassa 511 due to better<br />
access to irrigation water. Moreover, the<br />
diversion <strong>of</strong> the canals helped the extension<br />
to easily establish seed multiplication sites<br />
for non-traditional vegetables and spices,<br />
mainly onions, potato and tomato and hence<br />
it facilitated the growing <strong>of</strong> non-traditional<br />
crops in the area (data not presented).<br />
Cropping Sequence and <strong>Management</strong><br />
Access to irrigation in most sites created an<br />
opportunity for double and in few cases for<br />
triple<br />
cropping. However, due to the decreasing<br />
water availability and an overwhelmingly<br />
increasing demand for water by downstream<br />
users, the possibility to expand irrigable land<br />
became unattainable, as it was the case in<br />
Dobena, Southern region. In the current<br />
rain-fed cropping systems cereals and<br />
legumes are grown in rotation, while in the<br />
irrigable fields with vegetables and fruit<br />
trees are grown primarily in rotation with<br />
cereals. This cropping practice limited the<br />
possibility <strong>of</strong> integrating nitrogen fixing, soil<br />
improving legumes like faba bean in the<br />
irrigation systems. It is partly because <strong>of</strong> the<br />
small land size <strong>of</strong> irrigable plots (about 0.20<br />
ha per household) and partly due to market<br />
preference for selected crops. In situation<br />
where crop rotation was not practiced the<br />
risk to deplete the soil in a very short time<br />
and the possibility <strong>of</strong> pest incidence is<br />
obvious. For example, growing potato and<br />
tomato rotatively on the same land, without<br />
a break crop, may create a favorable ground<br />
for pests like potato late blight that would<br />
make it difficult to grow both crops next<br />
time. Hence, crop rotation as a component<br />
<strong>of</strong> integrated pest and soil fertility<br />
management should be sought as it was also<br />
a concern shared by practicing farmers<br />
across sites.<br />
Despite the above mentioned concerns,<br />
interviewees indicated that irrigation<br />
brought in considerable changes on the<br />
farming system through improved crop<br />
rotation (cereals in the main rainy season<br />
and vegetable in the <strong>of</strong>f season using<br />
irrigation), intercropping and improved land<br />
management (particularly terracing and use<br />
<strong>of</strong> organic manure) within the order <strong>of</strong> 79,<br />
42 and 35%, respectively. In the three<br />
sample sites the farmers who practiced<br />
improved agronomic management <strong>of</strong> crops<br />
across the various practices after irrigation<br />
scheme was developed were 22.2, 41 and<br />
36% in Dobena, Geland Sedi and Hizaeti<br />
Afras, respectively (<strong>Table</strong> 6).<br />
Livestock systems<br />
Feed shortage was apparent short before the<br />
main rains, between the months <strong>of</strong> April and<br />
June across sites. The decline in forage<br />
availability was associated partly to<br />
287
conversion <strong>of</strong> dry season fallow to vegetable<br />
fields and an increase in area enclosure <strong>of</strong><br />
the traditional grazing areas in the sloppy<br />
landscapes, accompanied by frequent<br />
drought. Contrary to earlier reports, there is<br />
a decline in the number <strong>of</strong> livestock per<br />
household as a consequence <strong>of</strong> introduction<br />
<strong>of</strong> schemes across the regions regardless <strong>of</strong><br />
agro ecology, but again there are also an<br />
increased number <strong>of</strong> draught oxen (data not<br />
presented). Other research findings also<br />
reported that increased irrigation was<br />
associated with a reduction in ownership <strong>of</strong><br />
livestock but with increased adoption <strong>of</strong><br />
technologies that enhanced productivity<br />
(Benin etal. 2003).With access to irrigation<br />
semi-pastoralist communities (e.g.<br />
Gedemmso, Oromia) have been converted to<br />
a crop-livestock system with significant<br />
reduction in stock.<br />
In theory, the expansion <strong>of</strong> the irrigable area<br />
should have allowed farmers to produce<br />
more biomass all year round, partly as crop<br />
residues and grasses on strips, borders and<br />
hilly patches. However, the biomass<br />
produced from the vegetable fields was<br />
rarely used as feed source as the livestock<br />
rejected to it unless there were no other feed<br />
options in the system. Moreover, some<br />
farmers complained to the mission that the<br />
local authorities did not allow them to grow<br />
forages using irrigation as the current<br />
bylaws established by the water user<br />
associations gave priority mainly to food,<br />
fruit and vegetable crops. These bylaws may<br />
limit innovations in promoting livestock<br />
enterprises (e.g. Dairy and fattening). With<br />
increased vegetable production from<br />
irrigated plots and subsequent income some<br />
farmers, e.g. Amhara region, afforded to<br />
upgrade part <strong>of</strong> their stock with fewer but<br />
more productive breeds and in the process<br />
released part <strong>of</strong> their crop land for pasture<br />
development (Benin, et al., 2003).<br />
Seed and fertilizer use<br />
According to farmers view across the sites,<br />
decline in land productivity was strongly<br />
associated with soil fertility decline,<br />
prevalence <strong>of</strong> new pests and diseases in the<br />
system, excessive soil erosion and in some<br />
cases soil salinity.<br />
The majority <strong>of</strong> farmers across the regions<br />
have been introduced to use <strong>of</strong> inorganic<br />
fertilizers only very recently, mainly through<br />
the extension systems. The potential effect<br />
<strong>of</strong> fertilizers on crop yield and farm income<br />
is much better understood than 10 years a<br />
go, though this capacity building process<br />
may not have been explicitly associated with<br />
the irrigation projects. However, only about<br />
55% <strong>of</strong> the farmers across the sites 55% use<br />
fertilizers (mainly DAP), particularly for<br />
maize (data not presented). The government<br />
was their major input source for chemical<br />
fertilizer, mainly through credit<br />
arrangements. For instance, in Gereb koky,<br />
Tigray, the typical use <strong>of</strong> inorganic<br />
fertilizers in the irrigated fields was about 50<br />
kg/ha, applied mainly to high value<br />
vegetables and green maize. On the other<br />
hand, perennial crops like c<strong>of</strong>fee and chat<br />
did not receive any inorganic fertilizer<br />
across the visited sites, partly because they<br />
are commonly grown in fertile homesteads.<br />
The increased use <strong>of</strong> irrigation and fertilizer,<br />
however, did not attract much use <strong>of</strong><br />
improved seeds because either they were<br />
unavailable or unaffordable to farmers. The<br />
local extension agents were multiplying<br />
seeds <strong>of</strong> only selected crops, mainly maize,<br />
potato and onions. Hence most farmers in<br />
the sites still use their own seed (<strong>Table</strong> 3).<br />
The source <strong>of</strong> seeds in three schemes was<br />
55, 23 and 22% for own seeds, government<br />
sources and purchased, respectively (IE<br />
Preliminary survey, 2004). While seeds for<br />
cereal crops, vegetable and c<strong>of</strong>fee are<br />
secured from multiple sources, seedlings for<br />
fruit trees are commonly purchased from the<br />
local market.<br />
Similarly, recent reports from the region (G.<br />
Medhin etal. 2003) indicated that there is<br />
decreased use <strong>of</strong> chemical fertilizer with<br />
irrigation after the credit service for<br />
fertilizers was abandoned. Credit and<br />
financial services are not yet sufficiently<br />
addressing the needs <strong>of</strong> irrigation users to<br />
288
move into sizable market oriented<br />
enterprises. As an effect, there is a shift<br />
towards use and management <strong>of</strong> organic<br />
fertilizers namely manure, compost and crop<br />
byproducts in most sites, with an increasing<br />
number <strong>of</strong> practitioners adopting these<br />
practices (IE Preliminary survey, 2004) For<br />
instance in Burka Woldiyaa six out <strong>of</strong> seven<br />
randomly interviewed farmers practiced<br />
composting for the last two years. A farmer<br />
in Nazre, who conducted an informal<br />
experimentation described that on a 200 m 2<br />
farm land he got a maize grain yield <strong>of</strong> 5, 4<br />
and 1 qt from organic fertilizer, inorganic<br />
fertilizer and no fertilizer, respectively<br />
(personal communication).<br />
Impact on household food security<br />
The major effect <strong>of</strong> the irrigation projects on<br />
the communities was through the attitudinal<br />
change that they could produce for the<br />
market and could buy their food from the<br />
income they generate on farm. This is not<br />
yet a common knowledge in the rain-fed<br />
agricultural systems <strong>of</strong> Ethiopian Highlands.<br />
Farmer interviews across the regions in the<br />
high potential areas (with at least 5 or more<br />
months long growing season) and low<br />
potential areas (with four or less months<br />
long growing season) (Engida, 2001),<br />
revealed that crop yield <strong>of</strong> cereals (e.g.<br />
maize) increased by about 70 and 20%,<br />
respectively, not only due to access to<br />
supplementary irrigation but also due to<br />
increased support <strong>of</strong> government institutions<br />
in extension and input delivery. In general,<br />
crop diversification has significantly<br />
increased, in some cases from only three<br />
crops before the construction <strong>of</strong> the scheme<br />
up to 15 crop species, encompassing various<br />
vegetable and high value crops (e.g.<br />
Gedemmso in Oromia). With access to<br />
irrigation, intercropping and relay cropping<br />
are also becoming common practices even in<br />
monocropping-dominated systems (<strong>Table</strong> 5).<br />
About 40% <strong>of</strong> the farmers produced more<br />
food than before the scheme was<br />
constructed, particularly apparent in the<br />
drought-prone environments (e.g. Amhara)<br />
and in areas where there was no access to<br />
irrigation earlier (Benin etal. 2003). Data<br />
from three sites also indicated that 34, 26<br />
and 16% <strong>of</strong> the respondents had access to<br />
more food, no change or obtained increased<br />
income, respectively (IE Preliminary survey,<br />
2004). In some cases, vegetables became<br />
part <strong>of</strong> the daily dish <strong>of</strong> farmers (e.g.<br />
Chelekot in Tigray). This should have a<br />
positive effect on household health,<br />
particularly through the integration <strong>of</strong><br />
calorie, vitamin and micronutrient rich<br />
vegetables and fruit crops (Amede et al.,<br />
2004b). However, food security has not yet<br />
been fully achieved in almost all sites due to<br />
the small land holdings, low soil fertility<br />
status and other calamities. However, 83%<br />
<strong>of</strong> the interviewed farmers still consider lack<br />
<strong>of</strong> enough irrigation water responsible for<br />
low crop yield in irrigated crops (<strong>Table</strong> 4).<br />
Impact on natural resource management<br />
There were both negative and positive<br />
impacts <strong>of</strong> the irrigation projects on the<br />
environment. The major negative impact<br />
was done during the construction phase<br />
whereby new farm gullies were created and<br />
debris from the construction plots were<br />
placed on farmlands.<br />
Soil Conservation and land rehabilitation<br />
There are differences among regions, the<br />
longest physical structure being made in<br />
Tigray and the lowest in Oromia. In the<br />
selected sites between 21 and 54% <strong>of</strong> the<br />
households indicated that small scale<br />
irrigation attracted soil and water<br />
conservation practices (<strong>Table</strong> 5). The<br />
difference in performance was dictated by<br />
the historical view and understanding the<br />
status <strong>of</strong> land degradation in the regions and<br />
the subsequent regional policies. In situation<br />
where extensive soil conservation was made<br />
in the 1980s (e.g. Burke Woldiyaa and<br />
Mumicha in Oromia), erosion and run<strong>of</strong>f<br />
was considerably reduced with very limited<br />
active siltation seen on the valley bottoms<br />
and diversion canals (Personal<br />
communication, 2004). In some regions (e.g.<br />
289
Tigray), a considerable amount <strong>of</strong> work in<br />
managing the upper slope <strong>of</strong> the schemes<br />
was done through the construction <strong>of</strong> soil<br />
conservation terraces and tree bund<br />
stabilizers, which was a necessity to sustain<br />
the future performance <strong>of</strong> the schemes. This<br />
was done by introducing regional policies<br />
since 1992, whereby an obligatory 20 days<br />
per year labour contribution by every<br />
resident in the region was adopted. This<br />
labour was mostly used to construct and<br />
rehabilitate terraces and landscapes. This<br />
type <strong>of</strong> policy could reverse land<br />
degradation especially if it is done in a<br />
participatory way. It could lead to<br />
community action with apparent economic<br />
and social benefits in terms <strong>of</strong> fodder, fuel<br />
wood, water and other resources.<br />
However, although terraces are in place in<br />
most <strong>of</strong> the sites the effectiveness <strong>of</strong> these<br />
structures in reducing erosion, in improving<br />
water infiltration and in performing other<br />
environmental services was not assessed.<br />
Participatory impact assessment <strong>of</strong> the<br />
structures to display the positive and<br />
negative effects on the system could attract<br />
investors and the interest <strong>of</strong> communities to<br />
manage them sustainably. Moreover,<br />
integrating niche compatible trees on the soil<br />
bunds may reduce the pressure on cow dung,<br />
which is currently used as a cooking fuel, to<br />
be used for soil fertility restoration. Burning<br />
dung is one <strong>of</strong> the practices aggravating land<br />
degradation, particularly in the Amhara and<br />
Tigray regions, as it breaks the nutrient<br />
recycling in crop-livestock systems.<br />
There is a huge land area which became<br />
under area enclosure in all regions though<br />
the size and management modalities differ<br />
from region to region. It was done<br />
particularly to protect schemes and upper<br />
slopes from producing silts but also to<br />
rehabilitate exhausted upper slopes. In most<br />
cases it was done in consultation and<br />
agreement with the local communities. In<br />
sites where area enclosure is practiced for at<br />
least two or more years, like in Gereb koky,<br />
with an area enclosure <strong>of</strong> 30ha, the<br />
vegetative cover <strong>of</strong> the system increased<br />
considerably. It was valued by the<br />
communities as a means to recharge the<br />
springs, as sources <strong>of</strong> bee forage, and also as<br />
a strategy to restore indigenous trees like<br />
Dodonaea viscose and Olea africana. In<br />
some cases farmers were allowed to graze<br />
their oxen in the protected areas during<br />
ploughing times. However, the sustainability<br />
<strong>of</strong> the enclosure would heavily depend on<br />
the immediate benefits communities and<br />
household will obtain and the strength <strong>of</strong> the<br />
local institutions.<br />
Labor availability<br />
In situation where the cropping season is<br />
doubled because <strong>of</strong> increasing access to<br />
irrigation during the dry seasons, the<br />
pressure on household labor was apparent.<br />
The shift in systems from less labor<br />
intensive cereals to labor intensive<br />
vegetables (<strong>Table</strong> 6) caused an increasing<br />
labor demand. When a vegetable farmer was<br />
compared to a cereal farmer the demand for<br />
labor was 1638 and 406 man days per ha,<br />
respectively, which was about 400 % higher,<br />
indicating that there could be a need for an<br />
additional labor through hiring, debo (local<br />
labour sharing arrangement among age<br />
groups) or any other arrangements. Farmers’<br />
interviews in Lalay agula revealed that lined<br />
canales and cemented diversions reduced the<br />
pressure on farm labor, about 5 to 8 man<br />
days per family per season, which otherwise<br />
used to be invested in cleaning and repairing<br />
furrows after the main rainy seasons. This<br />
has created a job opportunity for the land<br />
less youth across the regions.<br />
Upstream and Downstream<br />
Relationships<br />
The presence <strong>of</strong> very few perennial rivers<br />
aggravated by recurrent drought, and<br />
extensive awareness creation campaigns<br />
towards a shift to vegetable farming in<br />
almost all schemes incurred a considerable<br />
competition for water in the command areas<br />
and beyond across regions, and caused<br />
shortage <strong>of</strong> water for down stream users<br />
290
(<strong>Table</strong> 4). Competition for irrigation water<br />
between upstream and downstream users,<br />
between vegetable growers and chat<br />
growers, between farmers with big irrigable<br />
plots and small plots, and between water<br />
users and water managers have been<br />
surfaced during the various formal and<br />
informal discussions. Farmers in two sites in<br />
Harer, Oromia indicated that there is less<br />
water for down stream communities than<br />
ever due to the need for frequent watering <strong>of</strong><br />
the vegetables in the upstream fields. The<br />
traditional system, which has a considerable<br />
Chat farming, demanded watering only once<br />
in a month and used to release a<br />
considerable amount <strong>of</strong> water to<br />
downstream users. On the other hand,<br />
recently introduced vegetable crops like<br />
tomato require water once in a week,<br />
particularly in areas where the evapotranspiration<br />
is very high. The consequence<br />
was that there was an emerging conflict<br />
between upstream and down steam users,<br />
and in some sites (e.g. in Burka Woldiyaa)<br />
the case is presented to the local court.<br />
Additionally, some farmers started to divert<br />
the water to non-traditional farms using<br />
motor pumps and gravity, commonly<br />
without asking for consent with the<br />
traditional water users. In some cases, these<br />
were people highly protected by local and<br />
regional authorities with very limited chance<br />
for the small farmers to maintain the<br />
statuesque.<br />
In situations where there is an absolute<br />
water scarcity, it is only households residing<br />
on the source who could benefit from the<br />
limited water flows. Communities residing<br />
down stream tend to send their water master<br />
to negotiate with upstream communities in<br />
times <strong>of</strong> critical demand.<br />
Lessons Learned<br />
In areas where institutions and market<br />
incentives are in place (e.g. Ziwai in the Rift<br />
Valley <strong>of</strong> Ethiopia), farmers have doubled or<br />
tripled their incomes in a very short period<br />
<strong>of</strong> time. In other isolated, less accessible<br />
areas (e.g. Belessa in the Amhara region),<br />
there is no visible change on the income and<br />
livelihood <strong>of</strong> the people, even four years<br />
after the irrigation infrastructure is in place<br />
and being operational (personal<br />
observation).<br />
In general, there are very few operational<br />
SSI schemes in the country that could be<br />
labeled as optimum because <strong>of</strong> the various<br />
difficulties facing them at different times<br />
and scales, ranging from shortage <strong>of</strong><br />
technologies to imperfect markets. An<br />
innovation systems approach is required to<br />
enable the schemes bring the expected<br />
impact on the livelihoods <strong>of</strong> the people,<br />
including the identification <strong>of</strong> various<br />
challenges small scale irrigators are facing at<br />
farm, community, district and higher scales.<br />
There is also a need to look for success<br />
stories where combination <strong>of</strong> technological,<br />
policy, institutional and market interventions<br />
made some irrigation investment worth<br />
investing to make the respective rural<br />
communities food secured and keen to<br />
protect the environment. <strong>Table</strong> 7 displays<br />
interventions that made few irrigation<br />
schemes success story.<br />
a. Access to irrigation and the associated<br />
institutional services given by<br />
governmental and non governmental<br />
institutions helped farmers to improve<br />
their income and enhanced their<br />
capacity to shift towards marketoriented<br />
agriculture. Unfortunately,<br />
priority was given only to the crop<br />
sector while livestock, particularly<br />
dairy and fattening, could have<br />
increased the benefits by much higher<br />
orders.<br />
b. Although crop diversity is one key<br />
way <strong>of</strong> minimizing risk and exploiting<br />
opportunities, too much diversity in<br />
the farmers’ fields may prevent them<br />
from more efficiently developing their<br />
production skills and creating<br />
functional market links with<br />
specialized traders and consumers.<br />
Too little diversity may again lead to<br />
deteriorated market prices during the<br />
291
peak season. Hence farmers’ should<br />
be assisted to optimize the number<br />
and type <strong>of</strong> enterprises that are<br />
managing and minimize market trade<strong>of</strong>fs<br />
for better decision making.<br />
c. Although there is a better use <strong>of</strong><br />
land based resource under irrigation,<br />
farmers are still dependent on low<br />
input management, which may not<br />
bring the expected quantity and<br />
quality reflecting market demands.<br />
Hence there is a need for<br />
diversifying the inputs supply<br />
systems including credit<br />
opportunities.<br />
d. <strong>Water</strong> is a very scarce resource, and<br />
the demand for irrigation water is on<br />
the rise. Hence irrigation<br />
investments should be supported by<br />
water saving agronomic and<br />
technical measures, including<br />
mulching, tie-ridging, minimum<br />
tillage, lining <strong>of</strong> canals and drip<br />
irrigation.<br />
e. The current extension support on<br />
irrigation agronomy is far from<br />
responding to farmers’ expectations.<br />
Participatory on-farm research on<br />
irrigation frequency, crop water<br />
demand, crop rotation, organic<br />
resource management, micro dose<br />
application <strong>of</strong> chemical fertilizers,<br />
management <strong>of</strong> perishable seeds and<br />
related issues should be promoted.<br />
The process should give farmers the<br />
chance to innovate.<br />
f. It could be necessary to distribute<br />
demonstration fields to various farm niches<br />
and landscape positions to reflect field<br />
variability. Promoting the capacity <strong>of</strong> elite<br />
farmers ‘like the Hirsha Cadre’s in Tigray’<br />
will enhance the scaling-up process to reach<br />
more farmers and communities sustainably.<br />
References<br />
Amede, T., Stroud, A., and Aune, J., 2004a.<br />
Advancing human nutrition without<br />
degrading land resources through<br />
modeling cropping systems in the<br />
Ethiopian Highlands. Food and<br />
Nutrition Bulletin, Vol 25, No 4.<br />
Amede, T., Kimani, P., Ronno, W., and<br />
Lubanga, L., 2004b. Coping with<br />
Drought. CIAT Occasional Publications<br />
Series No. 38. Pp 39.<br />
IE Preliminary survey, 2004. Preliminary<br />
Impact Assessment: Case studies <strong>of</strong><br />
three selected small scale irrigation<br />
schemes. Interim Evaluation, IFAD.<br />
Benin, S., Pender, J. and Ehui, S. 2003.<br />
Policies for sustainable development in<br />
the highlands <strong>of</strong> Amhara region.<br />
Overview <strong>of</strong> findings. In: Amede, T.<br />
(ed). Natural resource degradation and<br />
environmental concerns in the Amhara<br />
region. Pp 185-207.<br />
Bureau <strong>of</strong> Agriculture-Tigrai, 2004. Report<br />
on achievements in seed multiplication,<br />
field demonstration and field trials.<br />
Unpublished.<br />
COSART, 2001. Study and design<br />
department feasibility study report on<br />
agronomy and soils. Regional Bureau <strong>of</strong><br />
<strong>Water</strong> Resources, Tigrai.<br />
Dessie, Shiferaw, 2004. Impact assessment<br />
on Shoba irrigation scheme. Ministry <strong>of</strong><br />
<strong>Water</strong> resources, Addis Ababa, Ethiopia<br />
Engida, Mersha, 2001. Agroclimatic<br />
classification <strong>of</strong> Ethiopia. Ethiopian<br />
Journal <strong>of</strong> Natural Resources 2(2):115-<br />
135.<br />
G.Medhin, B., Pender, J., Ehui, S. and Haile,<br />
M., 2003. Policies for sustainable land<br />
management in the highlands <strong>of</strong> Tigrai,<br />
Northern Ethiopia. EPTD workshop<br />
summary paper No. 14.<br />
292
Gezahagn, Aynalem, 2003. Agricultural<br />
extension policy and strategy in the<br />
Amhara Regional state. In: Amede, T.<br />
(ed). Natural resource degradation and<br />
environmental concerns in the Amhara<br />
region. Pp 185-207.<br />
OIDA, 2004. Assessment report, Burka<br />
Woldiyaa and Nedhi Gelan Sadi. Addis<br />
Ababa.<br />
Pender, J. and B. Gebremedhin, 2004.<br />
Impacts <strong>of</strong> policies and technologies in<br />
dry land agriculture: Evidence from<br />
Northern Ethiopia. Crop Science Society<br />
<strong>of</strong> America and American Society <strong>of</strong><br />
Agronomy. Challenges and Strategies<br />
for dryland agriculture. CSSA Special<br />
Publication no. 32.<br />
WCD (World Commission on Dams), 2000.<br />
Assessment <strong>of</strong> irrigation options.<br />
Technical review IV.2. Cap town, South<br />
Africa.<br />
UNOPS, 2003. Special country programme-<br />
Phase II. Supervision report.<br />
293
<strong>Table</strong> 1. Comparison <strong>of</strong> yield <strong>of</strong> various food and vegetable crops <strong>of</strong> irrigated and non-irrigated<br />
farms in Lalay agula, Tigrai (SCPII scheme). N= 6<br />
Crop type<br />
Yield (qt/ha)<br />
Non –irrigated Irrigated %<br />
farms<br />
farmers increase<br />
Maize 25.75 43.75 69<br />
Onions 102 172 68<br />
Pepper 11 17.75 61<br />
Tomato 200 300 50<br />
Carrot 226 305.25 35<br />
Potato 174.8 250 43<br />
Cumin 4.25 7.50 76<br />
Source: Woreda Bureau <strong>of</strong> Agriculture, Wukro, 09/2004.<br />
<strong>Table</strong> 2. Crop yield before and after the irrigation project in Shoba, Oromia (SCPI scheme).<br />
n= 10, nd= not determined.<br />
Yield (Qt/ha)<br />
Crop type Land area Before the After the<br />
(ha) project<br />
project crease<br />
Barley Nd 10 12 20<br />
Wheat Nd 8 16 100<br />
Maize Nd 15 25 66<br />
Faba bean Nd 4 12 200<br />
Source: Dessie, 2004<br />
<strong>Table</strong> 3. Seed source for major crops in IFAD sites (Mean <strong>of</strong> 3 sites) SD<br />
Seed source No <strong>of</strong><br />
sample rce<br />
Own seed 708 1<br />
Government 294 9<br />
Purchase 284 1<br />
Total 1286 .0<br />
Source: IE Preliminary Survey, 2004<br />
294
<strong>Table</strong> 4. Experiences in access to irrigation water in three schemes <strong>of</strong> IFAD sites in Ethiopia.<br />
<strong>Management</strong> practices<br />
Irrigation site<br />
Total<br />
Dobena N.GalanSadi Hizaeti Afras<br />
sample<br />
%<br />
Users sample<br />
%<br />
users sample<br />
%<br />
users sample<br />
%<br />
users<br />
Practice crop rotation 51 61.4 109 70.3 135 99.3 295 78.9<br />
Mulching 68 43.9 7 5.1 75 20.1<br />
Intercropping 52 62.7 106 68.4 158 42.2<br />
Contour farming 46 29.7 12 8.8 58 15.5<br />
Physical soil conservation 16 19.3 84 54.2 29 21.3 129 34.5<br />
Biological soil conservation 9 5.8 5 3.7 14 3.7<br />
Other change in farm 2 2.4 5 3.2 1 0.7 8 2.1<br />
<strong>Table</strong> 5. Change in farming practice as an effect <strong>of</strong> the SSI schemes, n=374.<br />
Experience in water supply<br />
Irrigation site<br />
Total<br />
Dobena N.GalanSadi Hizaeti Afras<br />
Count Col % Count Col % Count Col % Count Col %<br />
Sufficient water not available 73 90.1 125 82.2 106 80.3 304 83.3<br />
Sufficient water available 5 6.2 27 17.8 25 18.9 57 15.6<br />
Poor management <strong>of</strong> water 3 3.7 - - 1 .8 4 1.1<br />
Total 81 100.0 152 100.0 132 100.0 365 100.0<br />
<strong>Table</strong> 6. Labor requirement <strong>of</strong> various vegetable and field crops (man days/ha) in irrigated farms <strong>of</strong><br />
Northern Ethiopia.<br />
Crop Pre-planting Cropping Post harvest Total<br />
operation operation operation<br />
Onions 110 255 10 375<br />
Potato 24 253 16 293<br />
Carrot 50 235 15 300<br />
Cabbage 110 235 10 355<br />
Shallot 50 255 10 315<br />
Maize 14 40 10 64<br />
Wheat 22 60 10 92<br />
Barley 22 60 10 92<br />
Teff 18 68 12 98<br />
Beans 18 34 8 60<br />
Source: COSART, 2001<br />
295
<strong>Table</strong> 7. Best bet interventions for small scale irrigation schemes; lessons identified from selected schemes<br />
and communities that work best.<br />
• Technology for<br />
SSI<br />
• Irrigation water<br />
•<br />
•<br />
•<br />
•<br />
•<br />
• Vegetable<br />
farming<br />
•<br />
•<br />
•<br />
•<br />
• High yielding<br />
varieties<br />
•<br />
•<br />
•<br />
•<br />
• Inorganic<br />
fertilizer<br />
•<br />
•<br />
•<br />
•<br />
• Organic fertilizer<br />
•<br />
•<br />
•<br />
• Pest management<br />
•<br />
•<br />
•<br />
• Where does it fit best?<br />
• <strong>Water</strong>-saving lines canals<br />
• Multiple cross-over alignments<br />
• <strong>Water</strong> reservoirs with closing lockers<br />
• Furrow irrigation practiced<br />
• More perennials than vegetables or cereals<br />
• Market access is reliable<br />
• Local institutions function<br />
• Close to town markets<br />
• Reasonably good road network<br />
• Rotational cropping practiced<br />
• <strong>Water</strong> supply is adequate<br />
• Managed by literate and young farmers<br />
• <strong>Water</strong> supply is adequate<br />
• Better access to inorganic fertilizers<br />
• Rotation with legumes possible<br />
• Land shortage is not apparent<br />
• Managed by resource-rich farmers<br />
• Best used for maize<br />
• <strong>Water</strong> supply adequate<br />
• Is accompanied by compost and manure<br />
• Higher Urea and less DAP<br />
• Biomass is abundant<br />
• Cow dung is not used for cooking<br />
• Composting is practiced<br />
• Preferably for fruit trees and vegetables<br />
• Avoid growing potato and tomato together<br />
• Uproot diseased plants<br />
• Crop rotation practiced<br />
• Field health sanitary practiced<br />
296
Fig. 1. Food insecure and secured Woredas in Ethiopia (DPPC, 2004)<br />
297
Institutions, <strong>Management</strong> Practices and Challenges <strong>of</strong> Small-Scale Irrigation<br />
Systems in Ethiopia: A Case Study <strong>of</strong> Two Modern Smallholders Irrigation<br />
Systems in Western Oromia, Ethiopia<br />
Shimelis dejene 1 , Woldeab Teshome 2 , Godswill Makombe 3 , Seleshi Bekele 3 ,<br />
Krishna Prasad 3<br />
1 Jima University, 2 AAU, 3 IWMI-NBEA<br />
dejene_shimelis@yahoo.com<br />
Abstract<br />
This paper examines the institutional<br />
arrangements that facilitate irrigation<br />
management and the present state <strong>of</strong> irrigation<br />
management and establishes where problems<br />
have occurred in the operation <strong>of</strong> Gibe-Lemu and<br />
Gambela-Terre Small-scale irrigation systems.<br />
The study employed the case study approach to<br />
tackle the research. Key informant and expert<br />
interview, desk review <strong>of</strong> different documents<br />
produced about the projects, group discussion,<br />
direct observation and structured interview<br />
schedule were used to collect data. The study<br />
proved the proposition that the government has<br />
uncritically supported the irrigation systems.<br />
Enabling legal system <strong>of</strong> land and water rights,<br />
strong woreda level state irrigation agency,<br />
support services (irrigation extension) and wellestablished<br />
water users associations through<br />
which purposes <strong>of</strong> irrigation are achieved were<br />
not adequately planned and put in place. These<br />
shortcomings undermined irrigation<br />
management, ultimately risked feasibility and<br />
sustainability <strong>of</strong> irrigated agriculture. Findings<br />
revealed poor record <strong>of</strong> accomplishment, in spite<br />
<strong>of</strong> the difference between the two systems, in<br />
managing water distribution in terms <strong>of</strong> the three<br />
most important performance indicators:<br />
adequacy, reliability and equity in water<br />
distribution. <strong>Water</strong> related conflicts are rampant<br />
but not settled yet. In addition, results indicated<br />
that irrigation had positively impacted irrigators’<br />
livelihoods in terms <strong>of</strong> diversification and<br />
intensification <strong>of</strong> crop production, household<br />
income, housing and employment generation and<br />
this social effect <strong>of</strong> irrigation was significantly<br />
different between irrigation systems (due to<br />
difference in the institutional and socioeconomic<br />
context <strong>of</strong> the two irrigation systems) and<br />
locations within irrigation systems. Nonetheless,<br />
many irrigators did not maintain these positive<br />
changes for long. The constraints were scarcity<br />
and unreliability <strong>of</strong> water and management and<br />
socioeconomic problems. These, in turn, were<br />
mediated by lack <strong>of</strong>: a) clearly defined and well<br />
enforced institutions <strong>of</strong> land and water rights; b)<br />
technical problems in design and construction; c)<br />
inadequate institutional capacity <strong>of</strong> the local state<br />
irrigation agency to coordinate and support<br />
decentralized management <strong>of</strong> irrigation; d)<br />
policy related problems; e) inadequate<br />
organization <strong>of</strong> users for self management; and f)<br />
problematic social relation <strong>of</strong> power among<br />
water users. Finally, the paper draws a number<br />
<strong>of</strong> conclusions, using the theoretical notions like<br />
context, social requirement for use, social effects<br />
and social construction, about policy options and<br />
requirements in the readjustment <strong>of</strong> the surveyed<br />
irrigation systems and in the design <strong>of</strong> irrigation<br />
projects <strong>of</strong> these types.<br />
Key words: Institutions, irrigation, management<br />
practice and challenges<br />
Institutions, <strong>Management</strong> Practices and<br />
Challenges <strong>of</strong> Small-Scale Irrigation Systems in<br />
Ethiopia: A Case Study <strong>of</strong> Two Modern<br />
Smallholders Irrigation Systems in Western<br />
Oromia, Ethiopia<br />
Introduction<br />
Gibe Lemu and Gambela Terre small-scale<br />
irrigation systems were constructed to promote<br />
household food security through effective and<br />
equitable use <strong>of</strong> the available land and water<br />
resources. However, these projects were poorly<br />
performing and the area under irrigation is below<br />
298
expectation. Nevertheless, more grounded and<br />
detailed scheme-specific information on the<br />
reason why it is so is and which help guide<br />
future policy for smallholders irrigation<br />
promotion not available. It is increasingly being<br />
recognized that poor performance is not only a<br />
consequence <strong>of</strong> technical performance in design<br />
and construction, but institutional and<br />
management problems tended to be more<br />
common constraints to the success and<br />
exploitation <strong>of</strong> small-scale irrigation schemes in<br />
sub-Sahara Africa. In addition, in-depth<br />
understanding <strong>of</strong> technical and agronomic<br />
problems <strong>of</strong> irrigated agriculture is impossible<br />
without understanding the social organizations<br />
(institutions, the policy environment and social<br />
relations) in which it is embedded. The general<br />
objective <strong>of</strong> this study is, therefore, to examine<br />
and describe the reasons for the disappointing<br />
performance <strong>of</strong> the target irrigation systems with<br />
a focus on the institutional arrangements that<br />
facilitate irrigation management, the present state<br />
<strong>of</strong> irrigation management at the local and<br />
grassroots levels and establish where problems<br />
(gaps) have occurred.<br />
Specific objectives:<br />
• To analyze the institutional<br />
arrangements and relationships that<br />
affect management and 'performance' <strong>of</strong><br />
the irrigation systems;<br />
• To understand how users are organized<br />
for self management <strong>of</strong> irrigation;<br />
• To understand how the irrigation<br />
systems are managed and;<br />
• To identify and clarify the major<br />
challenges <strong>of</strong> the irrigation systems; and<br />
• To suggest possible options/strategies<br />
for rehabilitation <strong>of</strong> the surveyed<br />
irrigation systems and in the design <strong>of</strong><br />
similar irrigation projects<br />
Methodology<br />
The research work included both appraisals <strong>of</strong><br />
theoretical assumptions on conditions <strong>of</strong><br />
possibility for successful irrigation as well as the<br />
analysis <strong>of</strong> empirical data obtained during field<br />
research. The socio-technical approach to<br />
irrigation (the social shaping perspective <strong>of</strong><br />
irrigation technologies) by Mollinga (2003) and<br />
elements <strong>of</strong> the social organization <strong>of</strong> innovation<br />
theory by Engel (1997) were used in developing<br />
the instruments for data collection; formulation<br />
<strong>of</strong> the hypothesis and in the interpretation and<br />
explanation <strong>of</strong> the data collected and the facts in<br />
the irrigation systems.<br />
The study employed the case study approach to<br />
tackle the research. There are ample reasons for<br />
using the case study approach. The first reason is<br />
the nature and objective <strong>of</strong> the research itself;<br />
irrigation management practices and analysis <strong>of</strong><br />
institutional contexts and causes <strong>of</strong> the problem<br />
are complex processes and therefore require<br />
detailed investigation and comprehensive<br />
understanding. Secondly, the conventional<br />
questionnaire survey (structured interview<br />
schedule) alone does not allow comprehensive<br />
understanding and adequate description <strong>of</strong> how<br />
the schemes are actually managed and what<br />
institutional and socio-economic variables and<br />
processes explain poor performance <strong>of</strong> the<br />
schemes.<br />
Methods <strong>of</strong> Data Collection<br />
Secondary Data Collection<br />
Secondary data was collected through desk<br />
review <strong>of</strong> the regional and national irrigation<br />
policy statements, legal frameworks regarding<br />
irrigation land and water rights institutions,<br />
proclamations and regulations, project write-ups,<br />
project appraisal documents, different reports<br />
produced about the projects and past case study<br />
papers on irrigation.<br />
Primary Data Collection<br />
Relevant primary data were collected using<br />
various instruments such as<br />
• Key informant interview; conducted to<br />
generate general understanding <strong>of</strong> the<br />
irrigation systems. In addition, the<br />
information obtained through this tool<br />
was also used for developing more<br />
focused questionnaire for the household<br />
interview<br />
• Interview (semi-structured) with<br />
299
executive committee <strong>of</strong> water users and<br />
<strong>of</strong>ficials and experts with relevant<br />
government agencies at regional, zone<br />
and wereda levels <strong>of</strong> accountability<br />
• Group discussion: 60 purposively<br />
selected irrigators, divided into six<br />
groups (three in each irrigation system),<br />
and each with group size <strong>of</strong> 10 members<br />
were involved. Irrigators from the headend<br />
to the tail-end areas were included in<br />
the groups so the data generated reflects<br />
the actual situations and facts at all water<br />
levels.<br />
• Direct observation <strong>of</strong> events during<br />
many visits paid to the schemes<br />
• Household interview using structured<br />
questionnaire<br />
For the questionnaire survey, 65 sample<br />
households were selected using the following<br />
procedure:<br />
a) First, the sample frame was obtained<br />
from the executive committee <strong>of</strong><br />
WUAs;<br />
b) Then, the beneficiary households were<br />
stratified into head-end, middle and<br />
tail-end irrigators based on their<br />
location in the farm layout <strong>of</strong> the<br />
irrigation systems and proportion was<br />
assigned to each group for inclusion in<br />
the sample; and<br />
c) The households were stratified on the<br />
basis <strong>of</strong> their location with the basic<br />
assumption that there could be inequity<br />
in the distribution <strong>of</strong> irrigation water<br />
and the benefits derived from irrigation<br />
as a result <strong>of</strong> weakness in water<br />
control, technical problems and lack <strong>of</strong><br />
management structures that suit layout<br />
<strong>of</strong> the irrigation infrastructures (see<br />
also Vermillion/IIMI, 1997:30-31);<br />
d) 30 % (from each scheme) <strong>of</strong> the<br />
sample frame were selected using<br />
stratified random sampling<br />
technique and participated as<br />
respondents in the household<br />
interview.<br />
2.2. Data Analysis<br />
Both qualitative assessment and descriptive<br />
analysis techniques were used for data analysis.<br />
The data generated through household interview<br />
was analyzed by employing SPSS. The study<br />
employed descriptive statistical methods such as<br />
frequency, percentage, mean, and 23 standard<br />
deviation, X 2 -statistic, T-test and ANOVA/F-test<br />
for analyzing the data generated through<br />
household interview.<br />
Rsult and Dscussion<br />
Description <strong>of</strong> the Irrigation Systems<br />
Gibe Lemu Lemu and Gambella-Terre irrigation<br />
systems are found Gobu Seyo District, East<br />
Wellega Zone <strong>of</strong> Oromia Region. Gibe-Lemu is<br />
located at 80km towards Addis Ababa from<br />
Nekemte, capital <strong>of</strong> East Wellega zone and<br />
3Kms from Bako town. Gambela –Terre SSIS is<br />
located at 12kms from Ano-town, the district<br />
capital and 30km from Bako, the biggest town<br />
providing access to markets for farmers. The<br />
rainfall in both irrigation systems is unimodal.<br />
The unimodal rainfall pattern dictates the single<br />
cropping season. However, in recent years, the<br />
pattern <strong>of</strong> the rainfall becomes uneven and<br />
unpredictable with negative implication on food<br />
production.<br />
The total irrigable command area <strong>of</strong> the Gibe-<br />
Lemu irrigation scheme is 113 ha. A main canal<br />
having a length <strong>of</strong> 7kms conveys water into the<br />
command area. The method <strong>of</strong> distribution to the<br />
main, secondary canals and TUs is continuous,<br />
while it is rotational in the farm units as per the<br />
initial design <strong>of</strong> the project. However, currently,<br />
the method <strong>of</strong> supply to the TUs is rotational due<br />
to the decline in the volume <strong>of</strong> water conveyed<br />
into the diversion weir. The method <strong>of</strong><br />
application to the farm units is rotational, while<br />
the method <strong>of</strong> application <strong>of</strong> water is furrow.<br />
Seven days are one irrigation interval for each<br />
farm unit at the time <strong>of</strong> design (Korea Design<br />
Team, 1990). However, there is severe water<br />
300
scarcity in the scheme to day to supply water in<br />
accordance with this interval.<br />
Gambella-Terre SSI project was initiated (during<br />
the Derg Regime) in line with the political<br />
interest <strong>of</strong> the Derg, i.e., to be used as instrument<br />
for promoting collectivism through cooperative<br />
farming. Initially, it was designed to develop an<br />
irrigable area <strong>of</strong> 80ha. In 1995, additional 34<br />
turnouts, division box and other structures were<br />
constructed along the main conveyance canal to<br />
bring additional 70 ha <strong>of</strong> land, which was not<br />
considered in the initial design, under its<br />
command area so as to benefit up stream farmers<br />
whose land holdings fall on the left and right<br />
sides <strong>of</strong> the main conveyance canal. This<br />
increased the command area from 80ha to 150<br />
ha. Nevertheless, there is a wide gap between the<br />
supply <strong>of</strong> water to day and during the time <strong>of</strong><br />
designing the project (1988).<br />
<strong>Table</strong>3.1 Average distance from the market<br />
Round trip distance<br />
(minute):<br />
Gibe Lemu<br />
Mean N St.De<br />
Gambela Terre<br />
Mean N SD<br />
From the main road: 55.20 25 40.56 116.75 40 64.22<br />
From the market: 93.24 25 51.32 144 40 77.49<br />
Source: - Field survey, *=household, **= Male headed households, ***=Female headed households<br />
The average round trip distance from the main<br />
asphalt road and the market place is different<br />
between the two irrigation systems. Irrigators in<br />
Gambela Terre have to walk longer hours than<br />
Gibe Lemu to access the nearest local market to<br />
sale their agricultural produces (<strong>Table</strong>s 3.2). In<br />
addition, there is no all-weather road connecting<br />
the irrigation system to the main asphalt road<br />
despite the fact that it is one <strong>of</strong> the material<br />
contexts for successful irrigation (Engel, 1997;<br />
Mollinga, 2003; Dillon, 1992: FAO, 2003).<br />
Further, farmers in Gibe Lemu have long<br />
standing (more than half a century) tradition in<br />
practicing traditional irrigation while farmers in<br />
Gambella-Terre had no irrigation experience<br />
before arrival <strong>of</strong> the new irrigation project.<br />
The Institutional Setting <strong>of</strong> Irrigation<br />
<strong>Management</strong> at Local and Grassroots Levels<br />
3.2.1. Local Level Institutional Arrangements<br />
Structure and <strong>Management</strong> Capacity <strong>of</strong> the<br />
District Irrigation Desk (DID)<br />
Oromia Irrigation Authority was responsible for<br />
SSI development in Oromia between 1999 and<br />
2004. Following the 2004 restructuring, the<br />
independent district irrigation extension <strong>of</strong>fice<br />
and the specialized development centers were<br />
merged with the District Agriculture and Rural<br />
Development Department (DARDD) with no<br />
clear line <strong>of</strong> communication with the Branch and<br />
Regional Offices <strong>of</strong> the Irrigation Agency<br />
responsible for irrigation development in<br />
Oromia. The District Irrigation Desk (DID) has<br />
been created in the DARDD as a team in 2004<br />
and the full time irrigation extension workers<br />
become multipurpose.<br />
Now the Gobu Seyo District Irrigation Desk<br />
(GSDID) and the extension centers are<br />
accountable for supporting userbased/decentralized<br />
management <strong>of</strong> irrigation<br />
and coordination <strong>of</strong> efforts <strong>of</strong> partners in the<br />
administration <strong>of</strong> irrigation in the district.<br />
Nonetheless, it has inadequate capacity to<br />
shoulder these responsibilities in terms <strong>of</strong> human<br />
resource development, technical units, structure<br />
and logistics in spite <strong>of</strong> the government policy<br />
for capacity building and institutional<br />
development. The GSDID has been consisted <strong>of</strong><br />
only one team leader who is in charge <strong>of</strong> the<br />
Desk. It operates only with 20% <strong>of</strong> the required<br />
technical staff (table 3.2). Regarding<br />
301
transportation means, the Desk is equipped with<br />
only one motor bicycle, one room (<strong>of</strong>fice), one<br />
table and one chair which are exclusively used<br />
by the Team Leader by the survey date (March,<br />
2005). In terms <strong>of</strong> structure, the GSDID lacks<br />
organizational unit (development centers) with<br />
DAs fully responsible for irrigation at the<br />
scheme levels. But, CTA (1999: 91-92) argue<br />
that a necessary condition for more efficient and<br />
lasting management <strong>of</strong> smallholders' irrigation is<br />
existence <strong>of</strong> management capabilities, which are<br />
built through organizational and institutional<br />
development at various levels; from the apex<br />
through the middle level to the grassroots levels.<br />
<strong>Table</strong>3.2 Manpower status <strong>of</strong> GSDID; as <strong>of</strong> March 2005<br />
Discipline (positions) Required and Available Gap<br />
Approved<br />
Team leader 1 1 -<br />
Irrigation Engineer 1 - 1<br />
Irrigation Agronomist 1 - 1<br />
Community participation Expert 1 - 1<br />
<strong>Water</strong> Harvesting Expert 1 - 1<br />
Total 5 1 (20%) 4 (80%)<br />
Institutional instability had adversely affected the<br />
human resource capacity and structure <strong>of</strong> the<br />
local irrigation agency. For example, the<br />
irrigation sector institution in Ethiopia<br />
experienced reorganization in 1983, 1994, 1995,<br />
1999 and 2004. This in turn has challenged<br />
human resource development and affected<br />
structure and existing human resource capacity<br />
<strong>of</strong> the irrigation sector institution. It could not<br />
maintain its trained manpower at both district<br />
and grassroots levels. The number <strong>of</strong> trained<br />
pr<strong>of</strong>essionals who were working on irrigation at<br />
the District Irrigation Office was reduced<br />
following the restructuring in 2004. This<br />
weakened irrigation expertise at the District<br />
level. Until the 2004 reorganization, there had<br />
been one trained DA (Diploma graduates, who<br />
received in-service training in irrigation) in each<br />
irrigation system. These trained DAs were taken<br />
to district to work in other <strong>of</strong>fices. However, no<br />
full-time and trained DAs assigned after that. In<br />
addition, the newly assigned DAs have multiple<br />
mandates and over stretched with many<br />
activities. Therefore, they are unable to<br />
undertake strict follow up <strong>of</strong> user-management<br />
<strong>of</strong> irrigation and could not deliver adequate<br />
irrigation extension services to farmers.<br />
Stakeholders and Partnership in Irrigation<br />
<strong>Management</strong><br />
The policy framework for small-scale irrigation<br />
development in Ethiopia states that management<br />
<strong>of</strong> SSIS is a joint responsibility. In view <strong>of</strong> this,<br />
the regional state irrigation agency identifies<br />
cooperative promotion and input supply desks,<br />
district and grassroots level administrative and<br />
legal entities and farmers and their organizations<br />
as main stakeholders in the administration <strong>of</strong><br />
irrigation in the study area. In addition, in 2004,<br />
the regional government merged five concerned<br />
district level government agencies in one<br />
institution; Agriculture and Rural Development<br />
Department (ARDD), with the assumption that<br />
organizational proximity can provide a fertile<br />
ground for collaboration. Although merging is a<br />
good opportunity, the five institutions did not<br />
work together in irrigation management as<br />
expected; the achievement has mainly been<br />
physical proximity <strong>of</strong> the agencies although the<br />
social shaping perspective <strong>of</strong> irrigation<br />
technologies assumes that irrigation systems are<br />
socially constructed.<br />
The responsibility for coordinating partners fell<br />
on the District Irrigation Desk (DID).<br />
Nevertheless, it could not manage to do it owing<br />
to lack <strong>of</strong> well-established institutional and<br />
302
functional framework for cooperation and<br />
harnessing their efforts. Lack <strong>of</strong> adequate<br />
involvement <strong>of</strong> the partners in turn adversely<br />
affected irrigation management in many ways,<br />
including:<br />
• Necessary inputs for irrigation could not<br />
be availed to farmers regularly; his<br />
responsibility fell on the input Supply<br />
Desk.<br />
• Irrigation has no research input; adaptive<br />
crop varieties that work under the<br />
situation <strong>of</strong> irrigation and watering<br />
frequency (irrigation agronomy)<br />
recommended for irrigation are nonexistent.<br />
Although there exists one big<br />
research center <strong>of</strong> the Oromia<br />
Agricultural Research <strong>Institute</strong> in the<br />
nearby area, it has not been supporting<br />
irrigation development through<br />
supplying relevant technologies. This is<br />
due to the fact that agricultural research<br />
policies and strategies are not adjusted to<br />
meet requirements <strong>of</strong> irrigation and<br />
none-existence <strong>of</strong> enabling institutional<br />
framework for harnessing efforts <strong>of</strong> the<br />
research system with irrigation;<br />
• The district and village level<br />
administrative and legal entities do not<br />
play any meaningful role in water<br />
control and conflict resolution though<br />
the task has become more complex to be<br />
addressed by ‘Kore Aba Laga’ and the<br />
simple informal rules alone (bylaws);<br />
and<br />
• <strong>Water</strong> users not organized into<br />
legally recognized entities in<br />
accordance with the principles <strong>of</strong><br />
organization <strong>of</strong> cooperative societies.<br />
This responsibility rests with the<br />
cooperative promotion desk.<br />
Nevertheless, it did not discharge this<br />
responsibility.<br />
Support Services<br />
The support services, in Molliga’s and Engel’s<br />
words ‘the material conditions <strong>of</strong> possibility’ for<br />
successful irrigation include, among others,<br />
improved seeds that work under irrigation and<br />
strong extension services (Engel 1997:147,<br />
Mollinga 2003: 24 and Dillon, 1992: FAO<br />
2003). However, survey results revealed only<br />
48% and 35% <strong>of</strong> the sample households ever<br />
used seeds <strong>of</strong> improved vegetable and cereal<br />
crop varieties in Gibe Lemu and Gambela Terre<br />
respectively. Out <strong>of</strong> the sample households, 36%<br />
in Gibe Lemu and 27.5% in GTSSIS procured<br />
improved seeds <strong>of</strong> maize and potato from the<br />
extension service. Nonetheless, the maize and<br />
potato seeds they obtained from the extension<br />
service are not recommended specifically for<br />
irrigation. In addition, seeds <strong>of</strong> carrot, onion,<br />
tomato, chile and other vegetable crops that<br />
irrigators regarded as 'improved' seeds have<br />
mostly been procured from the market or shops;<br />
they are not specifically recommended for<br />
production under irrigation. Therefore, they did<br />
not suit the irrigation systems, for they are<br />
affected by disease.<br />
Overall, irrigators have not regularly been<br />
supplied with these support services mainly<br />
because the government policy on agricultural<br />
input supply, agricultural research and rural<br />
extension, gives more priority to those farmers<br />
registered in package program for rain fed<br />
agriculture. It tended to favor, in terms <strong>of</strong> both<br />
supply and timing <strong>of</strong> supply, rain fed agriculture<br />
during the main rainy season.<br />
Institutional and Organizational Conditions<br />
within the Irrigation Systems<br />
Land Distribution and Its Problems<br />
Gibe Lemu and Gambela Terre Small-scale<br />
irrigation schemes were constructed to resolve<br />
the problem <strong>of</strong> farmland shortage, increase<br />
production and productivity and to improve<br />
farmers’ livelihoods through effective and<br />
equitable use <strong>of</strong> the developed land and water<br />
resources. In view <strong>of</strong> this, ORLUA Proclamation<br />
No. 56/2002) states a maximum <strong>of</strong> 0.5 ha is<br />
retained for each former landholder in the<br />
command area and each member is equally<br />
allocated 0.25 ha per household. Nonetheless,<br />
this has not been finished in practice in both<br />
irrigation systems. Results indicated the whole<br />
command area has been owned only by 22.4%<br />
303
1.<br />
(in Gibe Lemu) and 57% (in Gambela Terre) <strong>of</strong><br />
the intended beneficiary households. Former plot<br />
holders continued to control and manage land<br />
areas that fall in the range <strong>of</strong> 0.5ha to 12ha in<br />
Gibe Lemu and 2ha to 5ha in Gambela Terre<br />
irrespective <strong>of</strong> their resource capacity to fully use<br />
it for irrigation. This has been in spite <strong>of</strong> the fact<br />
that the rest farmers are landless; tenants and/or<br />
sharecroppers (specially in Gibe-Lemu SSIS).<br />
The problem <strong>of</strong> landlessness and skewed<br />
distribution <strong>of</strong> irrigable land was more severe 2. in<br />
Gibe Lemu. Out <strong>of</strong> the irrigators, 2o% did not<br />
possess own irrigable plots, while some rich<br />
farmers were managing 9-12ha <strong>of</strong> potentially<br />
irrigable land. T-test also showed there was<br />
significant difference among households in<br />
Gibe Lemu; which is significant at the 5% level.<br />
Landless farmers and those who own small plots<br />
access irrigation land mainly through<br />
sharecropping system, labor exchange and<br />
exchange <strong>of</strong> ox for land (see appendix table).<br />
Similar study by JICA and OIDA (2003: 3-6) in<br />
East Shoa and Woldeab (2003) in Tigray also<br />
documented that sharecropping system (leasingin<br />
and leasing-out) is one <strong>of</strong> the common option<br />
available to land owners with low resource<br />
capacity and landless farmers and farmers with<br />
smallholding.<br />
Fair distribution <strong>of</strong> irrigable land has not been<br />
achieved in both irrigation systems by the survey<br />
date. The government failed to achieve fair<br />
distribution <strong>of</strong> irrigable land because: a) land<br />
redistribution issue was not dealt with during<br />
design and construction, b) GTSSIS was initiated<br />
in line with the political interest (collectivism) <strong>of</strong><br />
the Derg regime in which case land redistribution<br />
was not an issue and; c) lack <strong>of</strong> policy and<br />
enabling legal system for redistribution for a<br />
long period and a time lag between the issuing <strong>of</strong><br />
the Oromia Rural Land Proclamation and<br />
operational regulation.<br />
Inadequate land tenure in turn has created<br />
management difficulties in the schemes. Both<br />
'Kore Aba Lega', DAs and the local state<br />
irrigation agency do not clearly know the actual<br />
size <strong>of</strong> irrigable plot managed by individual<br />
households. Hence, they could not adjust water<br />
allocation and resource mobilization to amount <strong>of</strong><br />
water used and irrigable area controlled by<br />
individual households. Equal contributions are<br />
requested from all members who cultivated 0.5ha-<br />
12ha <strong>of</strong> irrigable plots. Ali Seid (2002), Lema<br />
(2004) and JICA and OIDA (2003) found similar<br />
problem in their study in North Wello and East<br />
Shoa zone respectively. In addition, some farmers<br />
are over supplied with water, while some others<br />
obtained water, which is far short to meet their<br />
needs due to the guesswork in water allocation.<br />
Over supply has led to misuse in the context <strong>of</strong><br />
severe water scarcity.<br />
3. Organization <strong>of</strong> Users for Self-<strong>Management</strong> <strong>of</strong><br />
Irrigation<br />
Organizational Set-up<br />
In accordance with the federal and regional<br />
policy framework for small-scale irrigation<br />
development in Ethiopia, "Kore Aba Lagas'' are<br />
in charge <strong>of</strong> water allocation, distribution,<br />
observing the water rights <strong>of</strong> members, conflict<br />
management and coordination <strong>of</strong> maintenance<br />
activities.<br />
Although there are many deficiencies in their<br />
organization, the water users in both irrigation<br />
systems have created their own management<br />
structures and crafted internal bylaws as one <strong>of</strong><br />
the social requirements for better management.<br />
Executive committees, sub-committees and<br />
water user teams (WUTs) were formed at<br />
irrigation system and distribution levels [territory<br />
units (TUs)] to facilitate water control and<br />
coordination <strong>of</strong> maintenance activities<br />
All water users are organized into 6 WUTs<br />
(<strong>Water</strong> users teams) in Gibe-Lemu (group size<br />
ranging 10-20 members and in Gambela Terre<br />
into four WUTs "goxi" with the number <strong>of</strong><br />
members per WUT ranging from 17 to 44.<br />
Nonetheless, the group size <strong>of</strong> two WUTs in<br />
Gambela Terre is above the optimum range (20-<br />
30) for good management (See Woulter, 2002:<br />
Blank, 2002). In these WUTs it has been<br />
observed, because <strong>of</strong> large group size, greater<br />
socioeconomic differentiation and lack <strong>of</strong> mutual<br />
understanding among users, which led to severe<br />
problem <strong>of</strong> water distribution and conflict over<br />
water. Similar study in Kenya showed that, the<br />
whole schemes or part <strong>of</strong> it was not operational,<br />
in all schemes consisting <strong>of</strong> groups <strong>of</strong> over 30<br />
304
members (Woulter, 2002). With a membership<br />
below 30, he observed no water distribution<br />
problem in Kenya. To the contrary, the situation<br />
in Gibe Lemu contradicts with Woulter's<br />
findings. The number <strong>of</strong> members <strong>of</strong> WUTs is<br />
10-20, which is below 30 but still there is water<br />
distribution problem and users could not settle<br />
water dispute themselves. This shows group size<br />
is not the only factor for social cohesion and<br />
effective group performance in water<br />
distribution.<br />
Viability <strong>of</strong> the <strong>Water</strong> Committees for Self-<br />
<strong>Management</strong> <strong>of</strong> Irrigation<br />
The responsibility for running management <strong>of</strong><br />
the irrigation systems was delegated to "Kore<br />
Aba Laga" in the hope <strong>of</strong> enhancing<br />
effectiveness, equity and responsiveness in<br />
irrigation management and to ensure<br />
sustainability. Nonetheless, they were not<br />
organized in such a way they can ensure these<br />
objectives <strong>of</strong> decentralized management,<br />
although good organization is one <strong>of</strong> the social<br />
requirements for good irrigation governance.<br />
They have deficiencies in their management<br />
structures. They have no recognized legal power<br />
and the roles, responsibilities and authorities <strong>of</strong><br />
the different positions along the management<br />
structure are not clearly defined and even it is<br />
totally missing from the by-laws <strong>of</strong> the ‘Kore<br />
Aba Lagaa’ in Gambela Terre.<br />
The committee lacks transparent accountability<br />
to users although it is one <strong>of</strong> the essential factors<br />
for good irrigation governance. Constituencies<br />
(water users) accuse committee members for<br />
power abuse, selfishness, lack <strong>of</strong> commitment,<br />
and for not observing the internal bylaws.<br />
Nevertheless, informants reported that they were<br />
not held accountable through legal processes.<br />
One informant in Gibe Lemu, Name-<br />
Mohammad Shumiye, expressed the intensity <strong>of</strong><br />
the accountability problem using the following<br />
proverb:<br />
"Yegebere balesiltan yasyilign gebeya new’,<br />
meaning, the committee members abuse the<br />
power and authority we vested on them and<br />
prioritize their interest and irrigation fields in<br />
water allocation and distribution"<br />
Irrigation <strong>Management</strong> Practices within<br />
the Irrigation Systems<br />
<strong>Water</strong> <strong>Management</strong><br />
<strong>Water</strong> Allocation<br />
<strong>Water</strong> committees are in charge <strong>of</strong> water<br />
allocation with little support from irrigation<br />
agronomists and development agents. They<br />
allocate water and prepare rotational schedules<br />
every year in September. However, water users<br />
expressed that <strong>Water</strong> allocation made by the<br />
‘Kore Aba Lagas has limitations in terms <strong>of</strong> both<br />
design and implementation. In terms <strong>of</strong> design, it<br />
does not clearly define water rights <strong>of</strong> individual<br />
farmers and TUs due to the guess work in water<br />
allocation. Equal water supply period per turn is<br />
allocated for all TUs and individual water users<br />
in spite <strong>of</strong> the variation in water requirements <strong>of</strong><br />
the different crops grown, area <strong>of</strong> irrigable plots<br />
managed by individual irrigators and water<br />
demands in different TUs. The major<br />
impediments for proper allocation and<br />
scheduling <strong>of</strong> water distribution (as reported by<br />
committee members), include:<br />
• Guess work in water allocation; the<br />
water committee undertakes water<br />
allocation and defines water rights <strong>of</strong><br />
members not based on study on water<br />
requirements <strong>of</strong> different crops, irrigable<br />
plot area possessed by individual<br />
irrigators and measurement <strong>of</strong> the yearly<br />
water supply due to capacity problem.<br />
This is because the local state irrigation<br />
agency failed to provide satisfactory<br />
technical assistance in undertaking these<br />
water management tasks and in building<br />
their capacity; and.<br />
• <strong>Water</strong> users are not willing to register<br />
types <strong>of</strong> crops they grow (vegetables or<br />
perennials) and area <strong>of</strong> their irrigable<br />
plots with the committee for clear<br />
definition <strong>of</strong> water rights in spite <strong>of</strong> the<br />
law (bylaws).<br />
<strong>Water</strong> Distribution<br />
305
The most important performance indicators in<br />
the distribution <strong>of</strong> irrigation water include<br />
adequacy, timeliness and equity in the supply <strong>of</strong><br />
water (World Bank, 2000). <strong>Table</strong> 3.3 shows<br />
users’ evaluation <strong>of</strong> performance <strong>of</strong> ''Kore Aba<br />
Legas'' in water distribution. The water<br />
committees in both irrigation systems were<br />
found to be in efficient in managing water<br />
distribution in terms <strong>of</strong> the three indicators. In<br />
Gibe Lemu and Gambela Terre, 80% and 90% <strong>of</strong><br />
the sample households witnessed that they could<br />
not obtain the quantity <strong>of</strong> water that can support<br />
irrigation over the plot area they manage. The<br />
vast majority, 76% (in Gibe-Lemu) and 80% (in<br />
Gambela Terre) <strong>of</strong> irrigators were not able to<br />
obtain water in a reliable manner. Further, results<br />
<strong>of</strong> chi-square analysis indicated<br />
<strong>Table</strong> 3.4.<strong>Water</strong> users’ opinion about water distribution in Gibe Lemu and Gambela Terre<br />
irrigation systems<br />
Item<br />
Opinion by irrigation system and location<br />
Gibe Lemu (N=25) Gambela Terre (N=40)<br />
Count % Count %<br />
Enough water is not obtained 20 80 36 90<br />
<strong>Water</strong> is not reliable 19 76 32 80<br />
<strong>Water</strong> distribution is unfair 21 84 33 82.5<br />
Source: Field Survey<br />
Access to adequate irrigation water and the<br />
problem <strong>of</strong> unreliability <strong>of</strong> water has strong<br />
association with location <strong>of</strong> farmers' irrigable<br />
plots relative to the headwork. The difference<br />
between locations was highly significant in<br />
Gambela Terre (X2=10.6, X2-Prob. =0.005 (for<br />
adequacy) and P
conveyed into the scheme can meet water<br />
requirement in the command area with some<br />
adjustment and adaptation <strong>of</strong> water allocation to<br />
the change in water supply and if there had been<br />
strong system management. <strong>Water</strong> scarcity is the<br />
most important reason for not obtaining the<br />
needed amount <strong>of</strong> water for irrigated agriculture<br />
in command areas <strong>of</strong> Gambella Terre SSIS<br />
<strong>Table</strong> 3.5 Social groups that get more water by illegal means<br />
Groups<br />
Percentage <strong>of</strong> farmers giving the response<br />
All HHs (N=65) Gibe Lemu Gambela<br />
(N=25)<br />
4.<br />
(N=40)<br />
Farmers with large family size 89.5 60 42.5<br />
Head-end farmers 89.5 76 82.5<br />
Rich farmers who irrigate perennials 39.7 36 35<br />
Source: Field survey<br />
Terre<br />
Alongside the above, results revealed that <strong>Water</strong><br />
Committees were not able to ensure equity in<br />
water distribution (<strong>Table</strong>3.5). Informants<br />
reported that powerful and rich socioeconomic<br />
groups, in their words, 'gulbetegnas'/’bully<br />
farmers’ have been benefited more. Head-end<br />
farmers had better access to irrigation water<br />
owing to their proximity to the headwork<br />
(location advantage). They release water for the<br />
down stream farmers once their fields saturated<br />
with water. Households with large family size<br />
are more powerful (because <strong>of</strong> size) and <strong>of</strong>ten,<br />
they exercise power to obtain water by illegal<br />
means. They also take advantage <strong>of</strong> the relatively<br />
large family size and/or labor in defending their<br />
water rights. Rich farmers in the middle areas,<br />
especially in Gambela Terre, irrigate large areas<br />
<strong>of</strong> tree crops which are not in the priority list and<br />
do not releases water for the tail-end farmers.<br />
Nonetheless, the WUA committee could not<br />
regulate this distribution inequity owing among<br />
others to resistance by the powerful groups.<br />
<strong>Water</strong> Scarcity: Causes and Coping Measures<br />
Causes <strong>of</strong> <strong>Water</strong> Scarcity<br />
<strong>Water</strong> is scarce in the irrigation systems;<br />
especially in Gambella Terre. <strong>Table</strong>3.6 shows<br />
perceptions <strong>of</strong> irrigators about causes <strong>of</strong> water<br />
scarcity. Gibe and Dokonu rivers, which are<br />
water sources for Gibe Lemu and Gambela<br />
Terre, were diverted at 2 and12 locations<br />
respectively. This decreased the quantity <strong>of</strong><br />
water conveyed into the schemes. Nevertheless,<br />
the problem has not been addressed due mainly<br />
to first, there was no enabling legal system,<br />
which clearly defines the water rights <strong>of</strong> the<br />
upstream traditional irrigators and irrigators in<br />
the new irrigation projects. In spite <strong>of</strong> the general<br />
constitutional rule, there are no formal<br />
operational rules and regulations for managing<br />
the relation between the upstream and<br />
downstream irrigators in sharing the water from<br />
the same river. In the second place, the<br />
responsibility for addressing such problem (the<br />
role who should do what) <strong>of</strong> the different<br />
stakeholders has not been defined by the survey<br />
date.<br />
TABLE3.6 Perceptions <strong>of</strong> irrigators about causes <strong>of</strong> water scarcity by irrigation system<br />
Causes <strong>of</strong> water scarcity<br />
% <strong>of</strong> farmers giving the opinion<br />
All HHs Gibe Lemu Gambela<br />
(N=65) (N=25) Terre<br />
(N=40)<br />
Diversion <strong>of</strong> water by traditional irrigators 89.32 88 97.5<br />
307
Seepage loss 47.74 52 52.5<br />
Increasing number <strong>of</strong> users 63.14 80 62.5<br />
Lack <strong>of</strong> strict water control 70.84 80 80<br />
Source: Field Survey, March2005<br />
Alongside water diversion by traditional<br />
irrigators, the problem <strong>of</strong> water scarcity has been<br />
mediated by abuses (uncontrolled distribution),<br />
social incompatibility (in Gambela Terre) and<br />
increase in the number <strong>of</strong> water users in Gibe<br />
Lemu, against the declining quantity <strong>of</strong> water<br />
conveyed into the scheme(table3.6). Farmers in<br />
the middle areas, especially in Gambela Terre,<br />
irrigate large areas <strong>of</strong> perennial tree crops, which<br />
are not in the priority list <strong>of</strong> crops to be grown;<br />
leading to scarcity the in tail end area. Further,<br />
the designed irrigation season for the scheme<br />
(Gambella Terre) is October to March every<br />
year. However, the indigenous growing season<br />
for rain fed agriculture in the area is May to<br />
December. Farmers start irrigated agriculture by<br />
the end <strong>of</strong> December. Nevertheless, by this time,<br />
the volume <strong>of</strong> water flowing to the diversion<br />
weir has declined substantially to the extent that<br />
it cannot support irrigation over the command<br />
area <strong>of</strong> the scheme or dries totally (problem <strong>of</strong><br />
social incompatibility). Similar studies have also<br />
documented that increasing number <strong>of</strong> users on<br />
the limited irrigation water has led to scarcity,<br />
and even limiting the types <strong>of</strong> crops grown by<br />
farmers (Alula, 2001 and Freeman and S.Silim,<br />
2002).<br />
Coping Measures<br />
The following coping measures were taken<br />
to over come water scarcity<br />
• Changing the duration <strong>of</strong> water delivery<br />
for TUs in response to the change in<br />
quantity <strong>of</strong> water conveyed into the<br />
scheme;<br />
• Prioritizing crops to be grown; vegetable<br />
crops, which require frequent watering,<br />
were given priority. Nonetheless,<br />
irrigators did not observe this cropping<br />
pattern for not strictly implemented to<br />
supply water in a reliable manner to<br />
grow vegetables. Hence, irrigators<br />
shifted from vegetables to perennial tree<br />
crops as an adaptive measure to the<br />
problem <strong>of</strong> unreliability <strong>of</strong> water;<br />
• Night storage was constructed (in<br />
Gambela Terre SSIS) to over come<br />
water scarcity through rotational<br />
distribution day and night. Still the<br />
volume <strong>of</strong> water flow is far short <strong>of</strong><br />
water needs in the scheme; and<br />
• <strong>Water</strong> users in Gambela Terre employed<br />
a paid guard; to control water<br />
distribution and to address the<br />
coordination problems <strong>of</strong> ‘Kore Aba<br />
Laga’ . However, the guard could not<br />
adequately manage the distribution<br />
because <strong>of</strong> the size <strong>of</strong> the irrigation<br />
system that needs control, which is<br />
beyond the capacity <strong>of</strong> one person to<br />
control.<br />
Overall, the problem has not been fully<br />
addressed by all these means due to in built<br />
defects in the design and implementation <strong>of</strong> the<br />
adaptive measures.<br />
Conflict <strong>Management</strong><br />
<strong>Water</strong> disputes persistently occur between<br />
irrigators in the new schemes and upstream<br />
traditional irrigators and among irrigators within<br />
the irrigation systems. Further, results <strong>of</strong><br />
household interview that the majority (56% in<br />
Gibe Lemu and 57.5% in Gambela Terre) <strong>of</strong> the<br />
sample households have faced conflicts arising<br />
from water allocation and distribution (table3.8).<br />
Informants reported increasing number <strong>of</strong> water<br />
users in Gibe-Lemu (against the declinigng<br />
quantity <strong>of</strong> water conveyed), water scarcity<br />
(from the source) and poor water control as<br />
major causes.<br />
The number <strong>of</strong> claimants <strong>of</strong> irrigation has<br />
increased over time, without being accompanied<br />
by institutional adaptation, led to competition<br />
and conflict over water. Similar findings are<br />
308
demonstrated in studies conducted by Freeman<br />
and S.Silim (2002) and Alula (2001). With<br />
increasing number <strong>of</strong> users, conflicts arising<br />
from water allocation became more common;<br />
water management became more problematic<br />
and the interval between watering <strong>of</strong> plots<br />
increased almost to "breaking point" (Alula,<br />
2001).<br />
Powerful households and rich farmers who grow<br />
crops which are not in the priority list, such as<br />
c<strong>of</strong>fee, chat, and sugarcane, in the middle areas<br />
capture more water by illegal means (more<br />
serious problem in Gambela Terre); leading to<br />
scarcity in the tail-end area and tough conflict<br />
between the two groups. Nevertheless, it was<br />
beyond the capacity <strong>of</strong> ‘Kore Aba Laga’ to be<br />
contained. Diversion <strong>of</strong> the Source Rivers by<br />
traditional irrigators had also gave rise to<br />
external water disputes. The local irrigation<br />
agency mentioned lack <strong>of</strong> legal frameworks as<br />
the main reason for not addressing the problems.<br />
In summary, ‘Kore Aba Lagas’ are ineffective,<br />
reluctant and less committed in taking care <strong>of</strong> the<br />
water rights <strong>of</strong> members and in resolving<br />
conflicts. <strong>Table</strong>4.8 shows farmers’ ranking <strong>of</strong><br />
problems that discouraged commitment <strong>of</strong> the<br />
water committees. The prominent gaps include:<br />
and the multipurpose DAs. The<br />
committees transfer cases <strong>of</strong> irrigators<br />
who were found guilty <strong>of</strong> illegal water<br />
abstraction to these entities. But they do<br />
not give satisfactory response though the<br />
task <strong>of</strong> conflict management has been<br />
beyond the legal power and capacity <strong>of</strong><br />
‘Kore Aba Lagas’ the WUA committees;<br />
2. Lack <strong>of</strong> incentive for the managing<br />
entities; i. e.; board members <strong>of</strong> the<br />
WUA have no incentive for the time<br />
they spent in irrigation management.<br />
Coupled with resistance it frustrated and<br />
discouraged their commitment to<br />
undertake strict control <strong>of</strong> water<br />
distribution..<br />
3. Problematic social relation <strong>of</strong> power<br />
among water users. Some members,<br />
especially the powerful households do<br />
not observe the group-based rules and do<br />
not usually give consent to be governed<br />
by the WUA committee members.<br />
Mollinga (2003) has also proved in his<br />
study in India that socioeconomic<br />
differentiation (social inconsistency)<br />
among water users had impeded<br />
emergence <strong>of</strong> viable water users<br />
organizations who can undertake<br />
effective water control.<br />
1. Lack <strong>of</strong> satisfactory support from the<br />
local administrative and legal entities<br />
<strong>Table</strong>3.7 Farmers' ranking <strong>of</strong> causes <strong>of</strong> poor water control and poor conflict management by water<br />
committees by irrigation system<br />
Reasons<br />
% <strong>of</strong> farmers and rank<br />
Gibe Lemu<br />
Gambela Terre<br />
N<br />
%<br />
Rank<br />
N<br />
%<br />
Rank<br />
WUA-committees are reluctant 7 28 3 rd 12 30 3 rd<br />
Resistance by water users 8 32 2 nd 15 37.5 1 st<br />
Lack <strong>of</strong> adequate external support** 10 40 1 st 13 32.5 2 nd<br />
Source: Field survey, March 2005<br />
Maintenance <strong>of</strong> the Irrigation Systems<br />
Farmers undertake canal cleaning and system<br />
maintenance activities under the leadership <strong>of</strong><br />
the water committee with the assistance <strong>of</strong><br />
309
multipurpose DAs. Most <strong>of</strong> the time members<br />
contribute labor for maintenance. Maintenance is<br />
carried out twice a year and very irregularly in<br />
Gambella Terre albeit the O and M manual<br />
prepared for the schemes recommends that it<br />
should be undertaken thrice a year.<br />
In Gibe Lemu the majority (56%) <strong>of</strong> the<br />
interviewees stated that maintenance <strong>of</strong> the<br />
structures was very good; 36 percent said it was<br />
good and only 4 percent said very poor<br />
(table4.9). Evidences obtained from the DA<br />
<strong>of</strong>fice and the GSDID also showed that more<br />
than 75 percent <strong>of</strong> the water distribution canals<br />
were functional by the survey date although there<br />
was no clear evidence whether it had been<br />
functioning fully or partially. This is because<br />
irrigators in Gibe Lemu are more committed to<br />
maintain and sustain the irrigation system in<br />
spite <strong>of</strong> the severe coordination problem. The<br />
most important reason they suggested for farmer<br />
commitment was the role <strong>of</strong> irrigation in the life<br />
<strong>of</strong> farmers in the area and the high market value<br />
<strong>of</strong> horticultural crops produced using irrigation<br />
due to accessibility to the good commercial<br />
opportunity in Bako Town. A review <strong>of</strong> impacts<br />
<strong>of</strong> irrigation management transfer by Vermillion<br />
(1997:19) came up with similar results.<br />
<strong>Table</strong> 3.8. Users’ opinion about maintenance <strong>of</strong> the schemes<br />
Description<br />
Number and percent <strong>of</strong> irrigators<br />
All HHS GIBE-LEMU Gambela Terre<br />
Count %<br />
5. Count %<br />
Very good 16 24.6 14 56 2 5<br />
Good 22 33.8 9 36 13 32.5<br />
Acceptable 4 6.2 1 4 3 8<br />
Poor 12 18.5 - - 12 30<br />
Very poor 11 16.9 1 4 10 25<br />
Total 65 100 25 100 40 100<br />
Source: Field Survey, March 2005<br />
In Gambela Terre, conveyance and distribution<br />
canal networks deteriorated due to a number <strong>of</strong><br />
reasons. The distribution and conveyance canals<br />
became flat in many areas and pockets <strong>of</strong> water<br />
ponds created at many points along the<br />
conveyance and distribution canals (see the<br />
photo below). Results <strong>of</strong> survey on farmers’<br />
opinions indicated poor coordination <strong>of</strong><br />
maintenance (92%), breaching <strong>of</strong> canals<br />
(87.2%) to extract water by illegal means and<br />
damage from animals (98.5%) as the major<br />
causes <strong>of</strong> damage and threats to safety <strong>of</strong> the<br />
irrigation system. Culturally, livestock freely<br />
graze over the command area for not all farmers<br />
310
cultivate their irrigable plots uniformly. In<br />
addition, turnouts are far a part and not evenly<br />
distributed in some areas. Hence, irrigators break<br />
canals and extract water where there is no<br />
turnout; implying technical problems in design<br />
and construction have contributed to the<br />
deterioration <strong>of</strong> the scheme, in addition to the<br />
institutional and management weaknesses.<br />
Photo: <strong>Water</strong> pond created on the main water conveyance canal due to damage by livestock and lack <strong>of</strong><br />
maintenance, Gambela Terre SSIS<br />
Irrigated Agriculture: Livelihood Impacts<br />
and Threats to Feasibility and Sustainability<br />
Impact on Farmers’ Livelihoods<br />
Irrigation had contributed towards improvement<br />
<strong>of</strong> irrigators’ livelihoods through its effect on<br />
crop production. Irrigation brought about change<br />
in cropping pattern and increased production and<br />
farm income, improved housing and wage labor<br />
employment.<br />
One method to show the social effect <strong>of</strong> the<br />
intervention on diversification is through<br />
comparison <strong>of</strong> types <strong>of</strong> crops cultivated by<br />
farmers before and after irrigation. The types <strong>of</strong><br />
crops and the number <strong>of</strong> farmers who grew a<br />
wide range <strong>of</strong> horticultural crops has<br />
substantially increased after irrigation (table3.8).<br />
Chi-square analysis also revealed that the<br />
production <strong>of</strong> potato (P
The second most visible impact <strong>of</strong> irrigation was<br />
temporal diversification <strong>of</strong> production. In Gibe<br />
Lemu, the number <strong>of</strong> households who used to<br />
grow twice increased from 8% before irrigation<br />
to 88% after irrigation and in Gambela Terre,<br />
from 2.5% before to 70% after irrigation. Results<br />
also revealed that it is significantly different<br />
between locations in Gambela Terre (X2-Prob. =<br />
0.000) and farmers in the tail-end area benefited<br />
least. This is owing to inequity in the spatial and<br />
temporal distribution <strong>of</strong> irrigation water in the<br />
tail-end area. Furthermore, the proportion <strong>of</strong><br />
irrigators who grow twice a year was higher in<br />
Gibe Lemu (88%) compared to Gambela Terre<br />
(70%). The difference is attributed to more<br />
severe problem <strong>of</strong> scarcity and unreliability <strong>of</strong><br />
water and farmers biased ness towards rain-fed<br />
agriculture in Gambela Terre (see also fig3.3).<br />
25<br />
Figure3.1 Comparison <strong>of</strong> agricultural diversification before and after irrigation<br />
in GLSSIS<br />
20<br />
%age <strong>of</strong> growers<br />
15<br />
before<br />
After<br />
10<br />
1 2 3 4 5 6 7 8 9 10 11 12<br />
crops<br />
N.B:1=maize,2-potato,<br />
3=onion,4=cabbage,5pepper,6carrot,7=chat,8=c<strong>of</strong>fee,forage,10=sugacane,11=mango and 12-mango<br />
Alongside diversification and intensification <strong>of</strong><br />
crop production, SSI had a positive impact on<br />
the income <strong>of</strong> farm households in 2004/05.<br />
However, ANOVA showed that there was a<br />
significant difference (F=13.47, P
Figure3.2 comparison <strong>of</strong> production diversification before and after irrigation in GTSSIS<br />
30<br />
25<br />
20<br />
%age <strong>of</strong> growers 15<br />
before<br />
After<br />
10<br />
5<br />
0<br />
1 2 3 4 5 6 7 8 9 10 11 12<br />
crops<br />
NB:1=maize,2-potato,<br />
3=onion,4=cabbage,5pepper,6carrot,7=chat,8=c<strong>of</strong>fee,forage,10=sugacane,11=mango and 12-mango<br />
Figure3.3 Comparison <strong>of</strong> cropping intensity before and after irrigation in<br />
Gibe Lemu and Gambella-Terre<br />
50<br />
45<br />
40<br />
35<br />
30<br />
%age <strong>of</strong> irrigators<br />
25<br />
20<br />
GLSSIS<br />
GTSSIS<br />
Total<br />
15<br />
10<br />
5<br />
0<br />
before after before after<br />
once ayear<br />
Period<br />
twice ayear<br />
313
<strong>Table</strong>3.10 Household net income (Birr) from irrigated agriculture in 2004/05 by irrigation system,<br />
location and sex<br />
Name <strong>of</strong> the<br />
irrigation system<br />
Gibe Lemu<br />
Gambela Terre<br />
Statistic<br />
Mean<br />
N<br />
St. Dev.<br />
Mean<br />
N<br />
St. Dev.<br />
Location <strong>of</strong> farm plots<br />
Sex <strong>of</strong> HHH<br />
Head-end Middle Tail Total Male Female<br />
946.23 797 1180 949.1 1011 534<br />
8 9 8 25 22 3<br />
1145.9 1141 1727 1327 1396 586.02<br />
394.61<br />
13<br />
579.3<br />
624<br />
13<br />
509.6<br />
276<br />
14<br />
370<br />
F=13.47, P
Risks to Feasibility and Sustainability <strong>of</strong><br />
Irrigated Agriculture<br />
The average plot size farmers allocated for<br />
irrigation occupies only a small portion while the<br />
land allocated for rain-fed agriculture represents<br />
the lion's share in Gambela Terre (appendix<br />
table4); implying farmers in Gambela Terre are<br />
committed less to irrigated agriculture. In<br />
addition, the actual irrigated area was small<br />
compared to the potential (150ha) and it has<br />
continuously been declining during 2001-<br />
2004/2005 (table3.15). Irrigation has totally<br />
collapsed in tail-end area that constitutes more<br />
than 53% <strong>of</strong> the total command area.<br />
<strong>Table</strong>3.15 Estimates <strong>of</strong> actual irrigated area (ha) and its trend, 2001-2004/05)<br />
IRRIGATI<br />
ON<br />
SYSTEM<br />
GIBE<br />
LEMU<br />
GAMBEL<br />
A TERRE<br />
IRRIGAB<br />
LE LAND<br />
(HA)<br />
IRRIGATED AREA (HA)<br />
(1994) 2001/02 (1995) 2002/03 (1996)<br />
2003/04<br />
% OF<br />
TOTAL<br />
% OF<br />
TOTA<br />
L<br />
2004/05<br />
ARE<br />
A<br />
(HA)<br />
IRRIGATE<br />
D AREA<br />
% OF<br />
TOTAL<br />
IRRIG<br />
ATED<br />
AREA<br />
IRRIGATE<br />
D AREA<br />
% OF<br />
TOTAL<br />
113 76.05 67.30 80 70.80 78 60.02 80.0 70.80<br />
150 58.5 39 56.75 37.83 69.5 52.4 48.27 32.18<br />
TOTAL 263 134.5 51.16 136.75 52 130.4 49.58 1324 48.77<br />
5<br />
Source: Gobu Seyo District Irrigation Desk (GSDID)<br />
The impact <strong>of</strong> irrigation projects on diversified<br />
and intensive irrigated horticulture and increased<br />
production not maintained for long for<br />
investment in these crops has become a risky<br />
business due to frequent crop failures. In Gibe<br />
Lemu and Gambela Terre, 92% and 84% <strong>of</strong> the<br />
sample households have faced crop failure.<br />
Hence, the majority <strong>of</strong> irrigators do not plant<br />
their irrigable plots to these fast growing<br />
vegetable crops regularly. They shifted to<br />
perennial tree crops such as: a) Sugarcane, chat,<br />
c<strong>of</strong>fee and banana, in Gibe Lemu, b) C<strong>of</strong>fee,<br />
chat, 'Gesho', mango in Gambela Terre and to<br />
cereal production (mono-cropping) under rainfed.<br />
Results <strong>of</strong> trend estimate revealed the actual<br />
irrigated area <strong>of</strong> the major vegetable crops<br />
(potato, tomato and chile) and maize has<br />
increasingly become shrunk during 2001/02-<br />
2004/05, while the area planted to perennial<br />
crops such as sugarcane and c<strong>of</strong>fee had been<br />
increasing in Gibe Lemu (Figure3.4). In<br />
Gambela Terre, irrigated area <strong>of</strong> maize and chile<br />
had been declining; while irrigated area <strong>of</strong><br />
sugarcane and c<strong>of</strong>fee was increasing during<br />
2001/02-2004/05 (figure3.5).<br />
Farmers’ perception and ranking <strong>of</strong> cause shows<br />
that water shortage, unreliable access to water<br />
and prevalence <strong>of</strong> vegetable diseases (Due to<br />
lack <strong>of</strong> adaptive seeds <strong>of</strong> crop varieties and<br />
knowledge <strong>of</strong> irrigation agronomy) were the<br />
prime constraints that threatened irrigated<br />
agriculture and dictated the change in cropping<br />
pattern (<strong>Table</strong>s3.16). <strong>Water</strong> is unpredictable and<br />
scarce due to<br />
315
45<br />
Figure3.4 Estimates <strong>of</strong> the trend in irrigated area <strong>of</strong> major crops in GIBE LEMU, 2001/02-2004/05<br />
40<br />
35<br />
30<br />
Area(ha) 25<br />
20<br />
15<br />
10<br />
5<br />
0<br />
2001/02 2002/03 2003/04 2004/05<br />
Year<br />
maize Sugarcane" potato tomato onion hot pepper c<strong>of</strong>fee mango banana carrot<br />
30<br />
Figure3.5 Estimates the trend in irrigated area <strong>of</strong> major crops in GAMBELA<br />
TERRE<br />
25<br />
20<br />
Area(ha)<br />
15<br />
10<br />
maize<br />
sugarcane<br />
potato<br />
tomato<br />
onion<br />
hot pepper<br />
c<strong>of</strong>fee<br />
mango<br />
banana<br />
carrot<br />
5<br />
0<br />
2001/02 2002/03 2003/04 2004/05<br />
Year<br />
due to problems embedded in water<br />
management, definition <strong>of</strong> water rights,<br />
enforcing group-based rules and social relations<br />
among water users and decline in the amount <strong>of</strong><br />
water from the source (hydraulic problem).<br />
Results <strong>of</strong> similar work by Alula (2001) also<br />
showed that unreliability <strong>of</strong> water supply and<br />
increased interval between watering <strong>of</strong> plots due<br />
316
to scarcity and poor ware management, affected<br />
the type <strong>of</strong> crop that could be grown, even<br />
apparently limiting the practice <strong>of</strong> vegetable<br />
production.<br />
<strong>Table</strong>3.16 Farmers' ranking <strong>of</strong> the reasons for under use <strong>of</strong> their irrigable land<br />
Statistics<br />
GLSSIS N<br />
% <strong>of</strong> farmers<br />
Rank<br />
GTSSIS N<br />
% <strong>of</strong> farmers<br />
Rank<br />
<strong>Water</strong><br />
scarcity<br />
7<br />
28<br />
2nd<br />
18<br />
45<br />
Unreliable<br />
access<br />
water<br />
9<br />
36<br />
1st<br />
to<br />
12<br />
5<br />
30<br />
Source: Field survey<br />
Shortage <strong>of</strong><br />
labor<br />
4<br />
6<br />
12<br />
4 th 3rd<br />
10<br />
12.5<br />
4th<br />
3rd<br />
Vegetable<br />
diseases<br />
Double cropping has been less feasible and<br />
unsustainable more in Gambela Terre. In<br />
addition to the gap in institutional development<br />
and support system and management and water<br />
scarcity problems, the various groups <strong>of</strong><br />
informants reported that double cropping is less<br />
feasible owing to the following socio-cultural<br />
problems in the area:<br />
• Farmers have limited or no experience in<br />
irrigation before arrival <strong>of</strong> the new project.<br />
Almost all (97.5%) <strong>of</strong> them own large area<br />
<strong>of</strong> rain-fed land as an option. It was initiated<br />
primarily to promote the collectivist interest<br />
<strong>of</strong> the Derg;<br />
• The second problem was incompatibility<br />
between the new cropping pattern and the<br />
indigenous cropping pattern and the projects<br />
growing season and farmers’ growing season<br />
despite the fact that compatibility is one <strong>of</strong><br />
the social requirements for successful<br />
irrigation. Maize planted shortly after<br />
harvesting vegetable crops is affected by<br />
disease owing to the short time frame<br />
between harvesting <strong>of</strong> vegetable crops and<br />
planting maize, and lack <strong>of</strong> cropping<br />
sequence studied and specifically<br />
recommended for the irrigation system.<br />
Horst (1998: Woldeab, 2003) and FAO<br />
(1986) also write, ‘incompatibility between<br />
the project cropping pattern and farmers’<br />
cropping pattern could lead to<br />
underutilization <strong>of</strong> irrigation water’<br />
• A culture <strong>of</strong> open grazing during the dry<br />
season in Gambela Terre; Crop damage from<br />
livestock discouraged interested farmers to<br />
engage them selves in irrigated farming.<br />
Conclusion and Suggested Policy Options<br />
The study used the socio-technical approach to<br />
irrigation technologies as conceptual frame in<br />
examining institutions, management practices<br />
and challenges. The following conclusions are<br />
drown from findings <strong>of</strong> the study using the<br />
theoretical notions like context, social<br />
requirement for use and social effects:<br />
4.1. Although it is relatively better in Gibe<br />
Lemu, there was poor record <strong>of</strong> accomplishments<br />
in water management in terms <strong>of</strong> adequacy,<br />
timeliness and equity in the supply <strong>of</strong> water,<br />
conflict management and system maintenance.<br />
Access to adequate and reliable irrigation water<br />
is more unlikely if the farmer's irrigable plot is in<br />
the tail-end area (more serious problem in<br />
Gambela Terre). It was mainly because <strong>of</strong> the<br />
lack <strong>of</strong> the social conditions (Social<br />
requirements) <strong>of</strong> possibility for successful<br />
irrigation. The main irrigation agency has weak<br />
management capacity to support WUA<br />
management <strong>of</strong> irrigation although it is a<br />
necessary condition for efficient and lasting<br />
irrigation management. The WUAs are not<br />
properly organized to run irrigation management.<br />
Users have problematic social relation. Enabling<br />
legal systems <strong>of</strong> land water rights institutions are<br />
non-existent at the operational level. Efforts <strong>of</strong><br />
317
stakeholders were not harnessed in irrigation<br />
administration. These problems in turn have<br />
drastically affected management and utilization<br />
<strong>of</strong> the developed resources. Therefore, policies<br />
for future investment in smallholder irrigation<br />
development and for rehabilitation <strong>of</strong> the<br />
irrigation systems considered by this study<br />
should give due consideration to averting these<br />
problems.<br />
4.2 Sustainable water rights <strong>of</strong> users not ensured<br />
in the irrigation systems. <strong>Water</strong> dispute (internal<br />
and external) is a major and undressed problem<br />
in both irrigation systems. It could no be<br />
addressed only through the general constitutional<br />
choice rule and the informal bylaws <strong>of</strong> water<br />
users. The problem is found to be very complex<br />
and beyond the capacity <strong>of</strong> users’ organizations<br />
and local and village level administrative and<br />
legal entities. The major constraints are 1) there<br />
has been no enabling legal system (operational<br />
regulations) both at District and grassroots levels<br />
which clearly define the water rights <strong>of</strong><br />
downstream and upstream users and rules which<br />
govern construction <strong>of</strong> new diversions; and 2)<br />
lack <strong>of</strong> clear definition <strong>of</strong> responsibilities (who<br />
should do what) for dealing with the problem. To<br />
ensure sustainable water rights <strong>of</strong> irrigators,<br />
facilitate shared use <strong>of</strong> water by downstream and<br />
upstream users and improve water management<br />
there is an urgent need for creating formal<br />
operational regulation.<br />
4.3. Such technical resources as improved seed<br />
(technology) that is adaptive to the situation <strong>of</strong><br />
irrigation and knowledge <strong>of</strong> irrigation (extension<br />
service and capacity building for irrigators) have<br />
not been met. This problem has been a major<br />
impediment to feasibility <strong>of</strong> irrigation. Therefore,<br />
policies for input supply, technology<br />
development (agricultural research) and rural<br />
extension have to be adjusted to meet these<br />
requirements <strong>of</strong> irrigated agriculture in the<br />
irrigation systems.<br />
4.4. In spite <strong>of</strong> the lack <strong>of</strong> strong system<br />
management, water scarcity and unreliability and<br />
organizational and institutional problems,<br />
acceptable commitment <strong>of</strong> farmers was observed<br />
and the impact <strong>of</strong> the implemented SSI on<br />
farmers' livelihood was also relatively higher in<br />
Gibe Lemu. This could possibly be due to<br />
market stimulus (access and the good<br />
commercial opportunity at Bako Town), shortage<br />
<strong>of</strong> adequate rain-fed land and the problem <strong>of</strong><br />
landlessness, experience and interest <strong>of</strong> farmers<br />
in irrigation and the role <strong>of</strong> irrigation in the life<br />
<strong>of</strong> farmers. This shows that irrigation should find<br />
its appropriate socioeconomic and institutional<br />
location to work effectively. The policy<br />
implication is that:<br />
• Small-scale irrigation should be promoted<br />
where it is most demanded; and;<br />
• Farmers’ priorities and interest,<br />
compatibility <strong>of</strong> irrigation to the sociocultural<br />
environment and farming system <strong>of</strong><br />
the area and the opportunities (cultural,<br />
institutional, economic) for irrigation should<br />
be understood before intervention.<br />
4.5. Irrigation has been a success in the first few<br />
years <strong>of</strong> project implementation. It has<br />
positively contributed towards increased<br />
diversification and intensification <strong>of</strong> production<br />
and livelihood improvement. Nonetheless, many<br />
farmers, what Engel (1997) and Mollinga (2003)<br />
call `the human agents` did not maintain these<br />
practices for long. They, do not practice irrigated<br />
vegetable production regularly, discontinued it,<br />
shifted to perennial tree crops or returned to the<br />
former cereal/mono-crop production under-rainfed.<br />
The constraints that discouraged farmers<br />
participation were among others institutional and<br />
organizational weaknesses that led to poor<br />
irrigation management or the lack <strong>of</strong> what Engel<br />
(997) calls `the social organization` to coordinate<br />
and manage the irrigation systems. Therefore,<br />
adequate institutional and organizational<br />
development is crucial to enhance effectiveness<br />
<strong>of</strong> irrigation promotion and to ensure<br />
sustainability <strong>of</strong> the benefits <strong>of</strong> irrigation and the<br />
irrigation systems.<br />
4.6. Expansion <strong>of</strong> traditional irrigation in the<br />
upstream areas <strong>of</strong> the rivers that are water<br />
sources for the schemes is a major threat to<br />
sustainability <strong>of</strong> the irrigation systems. There has<br />
been continuous decline in the quantity <strong>of</strong> water<br />
conveyed into the schemes. This led to<br />
progressive degeneration and collapse <strong>of</strong><br />
irrigation in the tail-end area <strong>of</strong> Gambela Terre,<br />
covering more than 53% <strong>of</strong> the command area.<br />
Therefore, there is an urgent need for addressing<br />
318
the problem through establishing and enforcing<br />
the necessary institutional/legal framework.<br />
4.7. One <strong>of</strong> the major factors for<br />
underperformance <strong>of</strong> the Gambela Terre SSIS is<br />
water scarcity. Therefore, future fate<br />
(sustainability) <strong>of</strong> the scheme should be<br />
determined through detailed hydrological study<br />
on the water source before embarking upon any<br />
investment aiming at rehabilitation <strong>of</strong> the<br />
irrigation system.<br />
4.8. In nut shell, change to sustainable<br />
diversified irrigated agriculture and to double<br />
cropping not met in both irrigation systems. The<br />
challenges and sustainability constraints that<br />
need urgent intervention through developing and<br />
enforcing appropriate institutional support<br />
systems at all level, from the apex and grassroots<br />
levels, include:<br />
1. Institutional and management limitations<br />
that led to scarcity and unreliability <strong>of</strong><br />
water<br />
2. Prevalence <strong>of</strong> vegetable diseases because<br />
farmers have not regularly been supplied<br />
with improved and adaptive seeds <strong>of</strong><br />
vegetable crops that work under<br />
irrigation; because extension service and<br />
in put supply policy is biased both in<br />
terms <strong>of</strong> supply and timing <strong>of</strong> supply to<br />
rain-fed agriculture. It is not adjusted to<br />
meet the requirements <strong>of</strong> SSI at the<br />
grassroots level (the role <strong>of</strong> policy)<br />
3. Expansion <strong>of</strong> traditional irrigation in the<br />
upstream areas <strong>of</strong> the rivers that are<br />
water sources for the schemes leading to<br />
water scarcity in the schemes.<br />
Nevertheless, there has been no enabling<br />
legal framework that facilitate the shared<br />
use <strong>of</strong> water by the two groups<br />
4. Weak institutional capacity <strong>of</strong> the local<br />
state irrigation agency to support<br />
decentralized management <strong>of</strong> SSI<br />
5. Weak linkage among stakeholders <strong>of</strong> SSI<br />
management both at the District and<br />
scheme levels;<br />
6. Problem <strong>of</strong> social incompatibility<br />
between the new cropping pattern and<br />
the indigenous cropping pattern and<br />
between the projects growing season and<br />
the indigenous growing season (in<br />
Gambella Terre)<br />
7. A culture <strong>of</strong> open grazing during the dry<br />
season in Gambela Terre<br />
Reference<br />
AESE (1995) Food Security, Nutrition and<br />
Poverty Alleviation in Ethiopia: Problem and<br />
Prospects. Proceeding <strong>of</strong> the Inaugural and<br />
First Annual Conference <strong>of</strong> the Agricultural<br />
Economics Society <strong>of</strong> Ethiopia, 8-10June<br />
1995, Addis Ababa, Ethiopia.<br />
Alula, P. 2001. Institutionalization <strong>of</strong> Irrigation<br />
in South Wello, In: Alula, Pankhurst (2001)<br />
(Ed.). Institutions for Natural Resource<br />
<strong>Management</strong>: Thematic Briefings, FSS<br />
(Ethiopia) and University <strong>of</strong> Sussex (UK).<br />
Bagadion, Benjamin and Frances F. Korten<br />
(2004) Developing Irrigators Organizations:<br />
Learning Process Approach. In: World Bank<br />
(2004). Putting People First: Sociological<br />
Variables in Rural Development<br />
Blank, H.G. Clifford M. Mutero and Hammord<br />
Murray – Rust. 2002 (Eds). The Chaning<br />
Face <strong>of</strong> Irrigation in Kenya: Opportunities<br />
for Anticipating Change in Eastern and<br />
Southern Africa. Colombo, Sri Manka:<br />
<strong>International</strong> <strong>Water</strong> <strong>Management</strong> <strong>Institute</strong>.<br />
Cernea, M. (2004) (Edit). Putting People First:<br />
Sociological Variables in Rural<br />
Development. Washington, D.C: The World<br />
Bank Group.<br />
CTA(2001) <strong>Water</strong> <strong>Management</strong>: Proceedings <strong>of</strong><br />
a CTA Seminar. Cordoba, Spain, 20-25<br />
September 1999. Aniane, France: Louma<br />
Productions.<br />
EWZFEDD (2004) Socio-Economic<br />
Pr<strong>of</strong>ile <strong>of</strong> Gobu Seyo District, Nekemte<br />
East Wellega Zone <strong>Water</strong>, Mineral and Energy<br />
Resources Development Department<br />
(1998) Design Report <strong>of</strong> Gibe Lemu<br />
Irrigation Project.<br />
319
Engel, P.G.H (1997) The Social Organization <strong>of</strong><br />
Innovation: A focus on Stakeholder<br />
Interaction. Amsterdam: Royal Tropical<br />
<strong>Institute</strong> (KIT).<br />
FAO (1995) Irrigation in Africa in Figures.<br />
FAO: Rome.<br />
FAO (1986) Irrigation in Africa South <strong>of</strong> the<br />
Sahara. FAO Investment Center Technical<br />
Paper No.5, FAO: Rome.<br />
FAO (2000) Socioeconomic Impacts <strong>of</strong><br />
Smallholders Irrigation Development in<br />
Zimbabwe. SAFR, Harare.<br />
FDRE (2002) Food Security Strategy (FSS).<br />
Addis Ababa, Ethiopia<br />
Fiona, H., John Thompson and Jules N. Prety<br />
(1996) Sustainable Agriculture and Food<br />
Security in East and Southern Africa: An<br />
Empirical Analysis <strong>of</strong> Current Initiatives and<br />
Review <strong>of</strong> the Literature. Stockholm:<br />
Swedish <strong>International</strong> Development<br />
Cooperation Agency (SIDA).<br />
Gibe Irrigation Project Design Note by Korean<br />
Design Team (1990)<br />
Lemma, Dinku (2004) Smallholders Irrigation<br />
Practices and Issues <strong>of</strong> Community<br />
<strong>Management</strong>: The Case <strong>of</strong> Two Irrigation<br />
Systems in Eastern Oromia, Addis Ababa,<br />
Ethiopia (MA Thesis)<br />
MoWR (2000) Ethiopian <strong>Water</strong> Resources<br />
<strong>Management</strong> Policy Document.<br />
Nigussie, Taffesse (2002) The Role <strong>of</strong><br />
Irrigation Development in Enhancing<br />
Household Food Security: A Case Study <strong>of</strong><br />
Three Small-Scale Irrigation Schemes in<br />
Southern Nations, Nationalities and Peoples'<br />
Region. MA Thesis, Addis Ababa<br />
University.<br />
North, C.D. (1990) Institutions, Institutional<br />
Change and Economic Performance. New<br />
York<br />
Odi (1995) Recent Trends in Irrigation<br />
<strong>Management</strong>: Changing Directions for the<br />
Public Sector, Natural Resource<br />
Perspectives; Numbers, London: UK.<br />
OIDA(2000) Smallholders Modern Irrigation<br />
Schemes Evaluation Report. Finfinne.<br />
Oromia Rural Land Use and<br />
Administration Proclamation Number<br />
56/2002. Finfinne, August 16, 2002.<br />
Peter, H. Stern (1998) Operations and<br />
Maintenance <strong>of</strong> Small-Scale Irrigation<br />
Schemes. UK: <strong>International</strong> Technology<br />
Publications Ltd.<br />
Peter, P. Mollinga (2003) On the <strong>Water</strong> Front:<br />
<strong>Water</strong> Distribution, Technology and<br />
Agriculture Change in a South Indian Canal<br />
Irrigation System. Orient Longman Private<br />
Limited: New Delhhi.<br />
Vermillion, D.L. (1997) Impacts <strong>of</strong><br />
Irrigation <strong>Management</strong> Transfer: A Review<br />
<strong>of</strong> the Evidence, Research Report 11.<br />
Colombo, Sri Lanka: <strong>International</strong> Irrigation<br />
<strong>Management</strong> <strong>Institute</strong> (IIMI).<br />
Webb, P. (1991) When Projects Collapse:<br />
Irrigation Failure in the Gambia from a<br />
Household Perspective in: Journal <strong>of</strong><br />
<strong>International</strong> Development Vol.3 No. 4, July<br />
1991.<br />
Woldeab, Teshome (2003) Irrigation Practices,<br />
State Intervention and Farmers Life-worlds<br />
in Drought Prone Tigray, Ethiopia (PhD<br />
Dissertation)<br />
World Bank (2000) Case Studies in<br />
Participatory Irrigation <strong>Management</strong>. WBI<br />
Learning Resources Series. Washington,<br />
D.C: The World Bank.<br />
320
APPENDIX<br />
<strong>Table</strong>s<br />
Appendix table1 <strong>Water</strong> users’ opinion about water distribution by irrigation system and location<br />
<strong>of</strong> farm plots<br />
Item<br />
Response<br />
(yes/No)<br />
%age <strong>of</strong> water users giving the opinion by irrigation system and<br />
location<br />
Gibe Lemu (N=25) Gambela Terre (N=40)<br />
Head Middle Tail X2-<br />
Stati.<br />
Head Middle Tail X2-<br />
Stat.<br />
Enough water is<br />
obtained<br />
Yes<br />
No<br />
12<br />
20<br />
8<br />
28<br />
-<br />
32<br />
1.32NS 7.5<br />
25<br />
2.5<br />
30<br />
-<br />
35<br />
10.6**<br />
<strong>Water</strong> is received when<br />
needed<br />
Yes<br />
No<br />
16<br />
16<br />
8<br />
28<br />
-<br />
32<br />
4.5NS 15<br />
17.5<br />
5<br />
27.5<br />
-<br />
35<br />
<strong>Water</strong> distribution is Yes 16 - - 5.5* 12.5 5 -<br />
equitable<br />
No 16 36 32<br />
20 27.5 35<br />
Source: Field Survey, NS= Non-significant, *= significant at P
Appendix <strong>Table</strong>3 ANOVA <strong>of</strong> household net income from irrigation in 204/05<br />
Amount<br />
(Br.)*irrigation<br />
sys*location<br />
Amount<br />
(Br.)*irrigation<br />
sys*Sex<br />
Sum <strong>of</strong> df Mean square F Sig.<br />
squares<br />
Between groups 13570199 1 13570198.64 13.47 0.000<br />
(combined)<br />
Within groups 1.51E+08 150 1007749.71<br />
Total 1.65E+08 151<br />
Between groups 13570199 1 13570198.64 13.47 0.000<br />
(combined)<br />
Within groups 1.51E+08 150 1007749.71<br />
Total 1.65E+08 151<br />
Appendix table 4 Average land holding by type <strong>of</strong> use<br />
Type <strong>of</strong> use<br />
Average plot size per household<br />
Gibe Lemu<br />
Gambela Terre<br />
Mean N SD Mean N SD<br />
Total land size (ha) 2.54 25 3.05 3.16 40 1.77<br />
Irrigable area 1.08 20** 0.72 0.72 39** 0.99<br />
Area under rain-fed 1.57 25 1.73 2.5 40 1.27<br />
Source: Field survey, the sign `**` implies the rest sample irrigators (five in Gibe Lemu and one in<br />
Gambela Terre) do not have own irrigable land<br />
Appendix <strong>Table</strong>5 Vegetable growers who faced crop failure, by irrigation system and location <strong>of</strong><br />
plots<br />
Irrigation system<br />
Do you grow<br />
vegetables every<br />
year using<br />
irrigation? (%)<br />
Ever faced problem <strong>of</strong> crop failure (Yes/No)<br />
By location <strong>of</strong> farm plots (%)<br />
Head-end Middle Tail-end<br />
All HHs<br />
Gibe Lemu (N=25)<br />
Yes<br />
No<br />
8<br />
92<br />
92<br />
8<br />
24<br />
-<br />
36<br />
4<br />
32<br />
4<br />
Gambela Terre(N=40)<br />
Yes<br />
No<br />
77.5 84.2<br />
20 15.6<br />
Source: Field survey<br />
26.3<br />
10.5<br />
26.3<br />
5.3<br />
31.6<br />
-<br />
322
<strong>Water</strong> Rights and the Processes <strong>of</strong> Negotiations among Irrigators in<br />
West Shewa Zone: The Case <strong>of</strong> Indris Scheme in Toke Kutaye District<br />
Tesfaye Zeleke<br />
Axum University<br />
tesfayezeleke@yahoo.com<br />
Abstract<br />
Though water rights are at the core <strong>of</strong><br />
exploiting water resources for irrigation<br />
purposes, trivial concerns were <strong>of</strong>fered to the<br />
case <strong>of</strong> Indris irrigation scheme in Toke<br />
Kutaye district in West Shewa. The historical<br />
background and development <strong>of</strong> the scheme<br />
has been presented in a contentious manner.<br />
The augmenting number <strong>of</strong> competitors too<br />
paved the way for conflicts that recurrently<br />
erupt out and inevitably lead to a succession<br />
<strong>of</strong> negotiation processes. With the inception<br />
<strong>of</strong> such missing gaps, this research aimed to<br />
scrutinize water rights and the processes <strong>of</strong><br />
negotiations among irrigators along Indris<br />
modern scheme, in Toke Kutaye district. To<br />
maintain this objective, qualitative research<br />
methods were predominantly utilized as the<br />
main data generating tools in the field.<br />
The findings <strong>of</strong> the research depicted that<br />
Indris scheme marked three significant<br />
phases in its historical development. In these<br />
phases, explorations pertaining to water<br />
rights and processes <strong>of</strong> negotiations were<br />
found to be at their immature ground. While<br />
the elements <strong>of</strong> the riparian doctrine <strong>of</strong> water<br />
rights preponderated during its initial phase,<br />
the components <strong>of</strong> appropriative doctrine<br />
pronounced more at its middle age. A mix <strong>of</strong><br />
ingredients from both doctrines interwoven<br />
with certain extra requirements determined<br />
the water right access <strong>of</strong> users since the<br />
conversion <strong>of</strong> the scheme into a modern<br />
style. Multiple water right rules emanating<br />
both from the customary and formal water<br />
acts have co-existed to direct the actions <strong>of</strong><br />
users. In this regard, the theoretical<br />
orientations <strong>of</strong> legal pluralism in water right<br />
paradigms proved to coincide with the<br />
pragmatic contexts <strong>of</strong> water users from the<br />
scheme.<br />
Conflicts in connection to irrigation water<br />
use and rights that have escalated over<br />
Years have been attributed to the decline in<br />
the volume <strong>of</strong> water resources, institutional<br />
failures to address the causes adequately,<br />
week observance on governing water right<br />
rules and increasing demand <strong>of</strong> users. As a<br />
result, negotiation processes aiming to settle<br />
disputes were repeatedly initiated either by<br />
users, committee members (elders) or courts.<br />
The procedures pursed to narrow competing<br />
interests around the scheme confirmed the<br />
pragmatic applicability <strong>of</strong> the central<br />
arguments <strong>of</strong> both cyclical and<br />
developmental models <strong>of</strong> negotiation<br />
processes discussed comprehensively by<br />
Gulliver.<br />
Thus, in the face <strong>of</strong> increasing demands on a<br />
declining water resource, the findings <strong>of</strong> this<br />
research revealed out that concerned<br />
individuals or relevant institutions need to<br />
exert further endeavor on the formulation <strong>of</strong><br />
water policies that clearly stipulate specific<br />
irrigation water entitlements <strong>of</strong> users.<br />
Enforcements on the frame <strong>of</strong> references set<br />
on the water manual need to be rigorously<br />
checked on practical implementations.<br />
Awareness buildings on irrigation water right<br />
claims, promotion <strong>of</strong> negotiated approaches<br />
in disputes and accentuation on customary<br />
rules <strong>of</strong> resource use constituted the<br />
dimensions seeking meticulous<br />
considerations in prospect.<br />
Introduction.<br />
Ethiopia being predominantly an agricultural<br />
country, half <strong>of</strong> the GDP, close to 90% <strong>of</strong><br />
export earnings and about 85% <strong>of</strong> people's<br />
livelihood sources has come from agriculture<br />
(CRDA, 1994:20). Irrigated agriculture,<br />
complementary to the conventional rain-fed<br />
agriculture, has a history <strong>of</strong> more than one<br />
century in some parts <strong>of</strong> the country<br />
323
(Dessalegn, 1999: 10; Woldeab, 2003:25).<br />
Some indigenous schemes are said to have<br />
existed since the reign <strong>of</strong> Menelik II<br />
(National Irrigation Policy Discussion Paper,<br />
1990:2).<br />
The impulse to promote irrigation schemes<br />
has been triggered by the recurrently<br />
occurring droughts and worsened food<br />
insecurity situations (FAO, 2005). Tsegaye<br />
(1991:2) elicited though irrigation<br />
developments were taken to be among<br />
optional mechanisms to cope up with the<br />
prevailing poverty conditions, productivity<br />
through such systems has failed to meet the<br />
anticipated targets being constrained by<br />
multiple factors. Studies by Mokonnen<br />
(1992; FAO,1978; Lemma,1994) for<br />
instance indicated, mismanagement <strong>of</strong><br />
irrigation practices could result in the<br />
problem <strong>of</strong> disputes, soil salinity, water<br />
logging, canal seepage and expose people to<br />
various diseases.<br />
In West Shewa Zone <strong>of</strong> Oromiya regional<br />
state where this research endeavored to<br />
scrutinize water rights and the processes <strong>of</strong><br />
negotiations, several irrigation schemes<br />
operate both in indigenous manner and<br />
application <strong>of</strong> modern irrigation<br />
technologies. Indris modern irrigation<br />
scheme is among the scaled up ones and<br />
located at a distance <strong>of</strong> 2 Km south <strong>of</strong> Guder<br />
town. Initially, the scheme had been<br />
operating in an indigenous manner. It was<br />
promoted into modern system completely in<br />
1986 E.C by the financial assistance <strong>of</strong><br />
European Economic Commission.<br />
Despite access to water rights and processes<br />
<strong>of</strong> negotiations over irrigation water<br />
constrain the development <strong>of</strong> the practice in<br />
several regards; these concepts have been<br />
overlooked greatly by scholars or any other<br />
relevant institutions. In the case <strong>of</strong> this<br />
particular paper, problems stemming from<br />
three dimensions are apparent and do<br />
override in connection to Indris modern<br />
irrigation scheme. On the first place,<br />
insignificant searches have been made on the<br />
historical development <strong>of</strong> the scheme. Even<br />
the prevailing data regarding its historical<br />
background were not only scanty but also<br />
presented in a contentious way among the<br />
water users themselves. Secondly, what rests<br />
at the core <strong>of</strong> each resource exploitation<br />
constitutes issues <strong>of</strong> the right to hold it<br />
permanently use or transfer to the other<br />
party. The third dimension hold a concern<br />
with the competing nature <strong>of</strong> users over<br />
irrigation water, associated conflicts and the<br />
successive chains <strong>of</strong> negotiation processes<br />
held to evade disputes. All the<br />
aforementioned dimensions have not been<br />
investigated around Indris modern irrigation<br />
scheme located in Toke Kutaye district <strong>of</strong><br />
West Shewa Zone.<br />
Therefore, the main objective <strong>of</strong> the paper is<br />
to examine water rights and the processes <strong>of</strong><br />
negotiations among irrigators diverting water<br />
from Indris scheme located in Toke Kutaye<br />
district <strong>of</strong> West Shewa Zone. It also<br />
specifically looks at:<br />
‣ The stages in the historical<br />
background and development <strong>of</strong><br />
Indris modern scheme.<br />
‣ The nature <strong>of</strong> water rights and<br />
processes <strong>of</strong> negotiations prior to<br />
and post <strong>of</strong> 1986 E.C.<br />
‣ The rules and by-laws that govern<br />
water use rights, distribution and<br />
management aspects.<br />
‣ How decisions and negotiations<br />
have been made for water access and<br />
rights in light with interactive factors<br />
like gender, economic status and<br />
power.<br />
‣ The significances <strong>of</strong> water right<br />
negotiations for users (in relation to<br />
livelihood improvement).<br />
‣ Highlight conflict settlement<br />
mechanisms adopted by water users.<br />
To address the above stated objectives and<br />
keep narrow the missing gaps in the three<br />
thematic dimensions noticed around the<br />
scheme, a qualitative research method was<br />
employed to gather first hand data. Hence,<br />
interviews, observations, and focus group<br />
discussions constituted principal methods in<br />
the field work. The application <strong>of</strong> all these<br />
methods makes it easier to triangulate and<br />
cross verify the generated data. To visualize<br />
certain themes with deeper insights at their<br />
naturalistic settings in the field, photography<br />
has also been used. As a whole, 53 (fifty<br />
three) persons were contacted fro interviews<br />
and 21(twenty-one) individuals took part in<br />
the focus group discussions.<br />
Secondary sources including books, journals,<br />
research papers and <strong>of</strong>ficial records were<br />
reviewed to substantiate the data obtained<br />
324
through primary means.<br />
Thus, the primary data interpreted in this<br />
research was generated through a field work<br />
that covered a period <strong>of</strong> time ranging<br />
between March 06-07-1999 E.C and April<br />
03-08-1999 E.C over 30 days. Preceding the<br />
main field work, preliminary field visits were<br />
made twice during the months <strong>of</strong> December<br />
and January 1999 E.C. At that state, legality<br />
to field entry and creation <strong>of</strong> rapports with<br />
district agricultural workers and few<br />
committee members were assured. On the<br />
first preliminary field visit, the surroundings<br />
<strong>of</strong> Indris modern scheme was observed. In<br />
the second round, the potential research<br />
settings were marked out and visited.<br />
Description <strong>of</strong> the Study Settings.<br />
Toke Kutaye district constituted one <strong>of</strong> the<br />
21 Weredas in west Shewa Zone. It is a<br />
newly established district for administrative<br />
purposes being as a sub division <strong>of</strong> Ambo<br />
district. Guder, some 12 kilometers west <strong>of</strong><br />
Ambo town, serves as the chief socioeconomic,<br />
administrative, political and<br />
cultural capital <strong>of</strong> the district. It is situated at<br />
a distance <strong>of</strong> about 137 kilometers away<br />
from Addis Ababa on the Addis Ababa-<br />
Nekemte main road.<br />
The district has a total area <strong>of</strong> 78,886.77<br />
hectares (which is nearly about 788.88 in Sq<br />
Kilometers). Out <strong>of</strong> the total land only<br />
1,384.8 hectare has been under irrigated<br />
agriculture (Strategic Planning and<br />
<strong>Management</strong> document <strong>of</strong> Toke Kutaye<br />
district, 1999:10).<br />
The climatic situation <strong>of</strong> the district is<br />
categorized into three major divisions: the<br />
cool, the warm-temperate and the hot. These<br />
climatic divisions cover 20.99 %, 51.31 %<br />
and 27.7o %, respectively. The selected<br />
peasant associations and specific research<br />
sites chosen for this research fit in to the<br />
warm climatic division (Ibid, 1999: 14).<br />
The rainfall distribution is bimodal. While<br />
the dry season normally lasts from the<br />
months <strong>of</strong> October to February; the main<br />
rains are received from May to September.<br />
The highest concentration <strong>of</strong> the rain falls<br />
during the months <strong>of</strong> June to August. At this<br />
season, irrigation activities have declined and<br />
the rain fed agricultural productions<br />
preponderate instead <strong>of</strong> it. As a result, the<br />
water flowing through the ditches blocked<br />
back to the main river.<br />
As computed against its years <strong>of</strong> foundations<br />
(legendary sources trace back as far as to the<br />
last decade <strong>of</strong> 19 th century), the over all<br />
social and physical infrastructures <strong>of</strong> the<br />
district in general and Guder in particular<br />
require an enthusiastic need <strong>of</strong> integrated<br />
efforts. It was reported that sectors like<br />
education, health, water supply and<br />
sanitation, and communication are<br />
components that demonstrated encouraging<br />
progresses.<br />
Figures pertaining to the population number<br />
<strong>of</strong> the district should be looked suspiciously.<br />
This is because no consistent census has<br />
been conducted since the separation <strong>of</strong> this<br />
district from Ambo. Any how, following the<br />
separation, the Economic Planning and<br />
Development bureau <strong>of</strong> Toke Kutaye district<br />
has initiated a sort <strong>of</strong> pilot assessment to<br />
estimate the total population. Based on the<br />
estimated result, the total population residing<br />
in both rural and urban Kebeles <strong>of</strong> the district<br />
is about 122,857 out <strong>of</strong> which males account<br />
for 58,828 (47.88 %) and females constitute<br />
64,029(52.11 %) (Economic Planning and<br />
Development document <strong>of</strong> Toke Kutaye<br />
district, 1999: 11).<br />
Several ethnic minorities with the dominant<br />
Oromo ethnic group co-exist in the district.<br />
Official guesses state that the Oromos cover<br />
more than 95 % <strong>of</strong> the ethnic composition.<br />
The Amhara, Gurages and few Tigrians do<br />
dwell in the district (Economic Planning and<br />
Development document <strong>of</strong> Toke Kutaye<br />
district, 1999: 13).<br />
Three chief religions have been apparent in<br />
the district: namely Christianity, Islamic and<br />
Indigenous (i.e. people’s adherence to<br />
Waqefaana-believe in one supreme God)<br />
Christianity, especially the Orthodox sect has<br />
showed a substantial dominance in the area<br />
(Ibid: 17).<br />
The economic source <strong>of</strong> the district depends<br />
on agriculture and its produces. Agriculture<br />
accounted for more than 90% <strong>of</strong> the<br />
economy <strong>of</strong> the district. Also, irrigated<br />
agriculture covers almost 18 peasant<br />
associations out <strong>of</strong> the 33 PAs in the district.<br />
The chief crops produced in the district<br />
325
include Teff, Wheat, Barely, Maize,<br />
Sorghum, Beans, and Oil seeds like Nug.<br />
Irrigated agriculture generates a significant<br />
amount <strong>of</strong> income from the vegetables and<br />
fruits produced at least twice per year<br />
(Economic Planning and Development<br />
document <strong>of</strong> Toke Kutaye district, 1999: 23).<br />
To have the bird’s eye-view <strong>of</strong> irrigation<br />
practices in the district, indigenous irrigation<br />
systems have said to operate since time<br />
immemorial in various sites in the district.<br />
Information extracted from the district<br />
agricultural desk revealed out that a sum <strong>of</strong><br />
over 25 major and minor rivers have been<br />
diverted for irrigation purposes. While there<br />
are 6 indigenously operating irrigation sites<br />
in the district, comparably the modern ones<br />
make up 8 in figures. All the schemes<br />
irrigated via indigenous or modern<br />
techniques fall below or equals to 200<br />
hectares, except the case <strong>of</strong> Indris which<br />
covers more than 200 hectares. According to<br />
Dessalegn’s (1999:10) classification <strong>of</strong><br />
irrigation schemes depending on their size,<br />
operation and management; the irrigation<br />
schemes pragmatically functioning in the<br />
district can be categorized as small scale<br />
category while exceptionally Indris modern<br />
irrigation scheme falls into the medium<br />
scale.<br />
To depict the specific irrigation settings,<br />
peasants from 5 PAs (namely Imela Dawo,<br />
Dale Dawe, Ajo Bedo, Dhaga File and<br />
Kilinto) do divert water for irrigation usages<br />
from Indris scheme. Additionally, institutes<br />
like Agricultural Training Center, Schools<br />
and Hormat Engineering Factory claimed<br />
water for irrigation and other usages. Having<br />
extensively discussed with committee<br />
members, Development workers and<br />
experienced elders, the researcher have<br />
selected three irrigation practicing villages<br />
out <strong>of</strong> three (3) PAs identified as Selam<br />
Sefer, Dhaga File and Kilinto. The<br />
Agricultural Training Center was also<br />
included in the study as there have been<br />
frequent reactions and interactions between<br />
the peasants and the training institute. These<br />
sites were selected mainly because;<br />
The sites constituted upper, middle<br />
and lower categories <strong>of</strong> beneficiaries<br />
<strong>of</strong> Indris scheme. Selam Sefer and<br />
the Agricultural Training Centers<br />
represent upper users. While Dhaga<br />
<br />
File forms middle users, Kilinto<br />
constitutes the lower beneficiaries <strong>of</strong><br />
the scheme.<br />
These sites have also been potential<br />
areas where both Holeta and Bako<br />
Agricultural Research Centers<br />
conducted pilot demonstrations<br />
repetitively.<br />
The accessibility <strong>of</strong> larger<br />
concentrations <strong>of</strong> experienced<br />
irrigators in the villages was another<br />
justification.<br />
Moreover, the selected villages are<br />
comparably accessible for<br />
transportations. Besides, the villages<br />
are well suited for fieldwork to<br />
explore deep information as each <strong>of</strong><br />
them followed a nucleated settlement<br />
pattern in their respective localities.<br />
Lastly, as a social anthropologist, the<br />
social dramas reflected over water<br />
use rights and process <strong>of</strong><br />
negotiations observed among upper<br />
and lower sites or between the<br />
villages and the Agricultural<br />
Training Center created a passionate<br />
feeling in the researcher’s<br />
understanding to <strong>of</strong>fer priorities for<br />
these villages.<br />
Review <strong>of</strong> Literatures and Theoretical<br />
Frameworks.<br />
A brief review <strong>of</strong> the literature on water<br />
rights and the processes <strong>of</strong> negotiations<br />
portraying the experiences <strong>of</strong> certain<br />
developing nations would be made in the<br />
first part pursued by certain cases in Ethiopia<br />
at the last part.<br />
To begin with, socio-anthropological issues<br />
are embedded in the operation <strong>of</strong> all<br />
irrigation systems, small or large: people<br />
organize socially in order to secure water,<br />
transport it, divide into usable shares, enforce<br />
rules for its distribution, pay for it and<br />
dispose <strong>of</strong> unused portions (Cernea, 1991:<br />
43).<br />
Vermillion (2000:57) quoting (Arriens et. al<br />
1996; Secker, 1996) asserted that with rising<br />
populations and diversified economies,<br />
competition for water is rapidly intensified in<br />
many developing countries, especially in<br />
Asia. Such conflicts over water resources are<br />
further aggravated by the social inequality,<br />
economic marginalization and poverty<br />
(Blank et. al, 2002:113; FAO, 2005:5).<br />
326
Blank et al (2002:123) explained the multiple<br />
sources <strong>of</strong> conflict over water use in the<br />
Upper Ewaso Ng’iro North Basin <strong>of</strong> Kenya,<br />
attributing to causal factors linked with water<br />
scarcity, inequitable water allocation and<br />
distribution, election <strong>of</strong> representative water<br />
users, failure to observe water by-laws.<br />
<strong>Water</strong> conflicts associated with scarcity are<br />
attributed to over abstraction <strong>of</strong> water in the<br />
upper reaches and latent conflicts are<br />
attributed to inequalities inherent in social,<br />
cultural, economic and political disparities<br />
among the stakeholders.<br />
There is a repetitive claim that underlines<br />
laws and traditions controlling water use in<br />
developing countries are <strong>of</strong>ten inadequate,<br />
unsuitable introductions, ignored or<br />
unenforceable. Fair, rigorous and swift<br />
enforcement is important in maintaining or<br />
improving adherence to water use laws and<br />
rules (Barrrow, 1987: 70).<br />
Many developing countries have nonwestern<br />
legal systems. Reflecting this<br />
argument, Blank et al (2002:278) indicated<br />
the Kenyan experience presenting that in precolonial<br />
times, management <strong>of</strong> water was an<br />
integral part <strong>of</strong> the overall customary laws<br />
and behavioral norms <strong>of</strong> each tribal society.<br />
Access to water was guaranteed for each<br />
individual by virtue <strong>of</strong> affiliation with a<br />
specific community (e.g. a tribe or clan) and<br />
water use was regulated by the political<br />
leaders <strong>of</strong> each community (chiefs, elders,<br />
clan leaders).<br />
Bruns and Meinzen- Dick (2000) denoted<br />
water rights are not just an analytical<br />
abstraction. The term water right is broad<br />
including diverse kinds <strong>of</strong> and levels <strong>of</strong><br />
rights. Clearing it, Boelens and Davila<br />
(1998:87) have discussed water rights as<br />
social relationships among humans and not<br />
only between the user and the water; thus,<br />
they are rooted in the other components <strong>of</strong><br />
the peasant community’s normative system.<br />
<strong>Water</strong> rights comprise formal rights<br />
embedded in <strong>of</strong>ficial tittles, permits and<br />
seasonal irrigation schedules, less formal<br />
rights based on customary patterns and rights<br />
implicit in social norms and local practices<br />
(Bruns and Meinzen- Dick, 2000:28; Cotula<br />
2006: 10). Thus, water rights are considered<br />
as legal entitlements for the abstraction and/<br />
or use <strong>of</strong> water resources. <strong>Water</strong> rights may<br />
also be constructed as contractual rights or<br />
may be based on bodies <strong>of</strong> norms other than<br />
domestic legislations-namely customary law<br />
(Ibid).<br />
Bruns and Meinzen-Dick (2000: 203) have<br />
<strong>of</strong>fered clues on diverse levels <strong>of</strong> rights in a<br />
specific source, such as ownership rights,<br />
rights to participate in decision making<br />
process (including decisions concerning<br />
allocation <strong>of</strong> water), rights to use without<br />
rights to participate in decision making<br />
process, rights which may or may not be<br />
transferred, rights to use only for a specific<br />
season or purpose, individual rights and<br />
community rights.<br />
Boelens and Davila (1998:88) presented that<br />
in a given region, it is not unusual for several<br />
mechanisms to operate simultaneously and it<br />
is also common to find mixtures <strong>of</strong> peasant<br />
and governmental mechanisms:<br />
‣ Concession <strong>of</strong> water use rights,<br />
granted by the state administration to<br />
individuals or groups <strong>of</strong> applicants;<br />
‣ Granting <strong>of</strong> formal or informal titles<br />
over socio-territorial waters by their<br />
inhabitants;<br />
‣ Agreements for permanent transfer<br />
<strong>of</strong> water rights from one right-holder<br />
to another such as in the case <strong>of</strong><br />
purchase and sale, rental inheritance,<br />
barter or gifting;<br />
‣ Acquisition <strong>of</strong> rights and access to<br />
water by force; in many regions <strong>of</strong><br />
the world, power groups have<br />
expropriated water by coercive force<br />
from peasants and indigenous<br />
peoples.<br />
According to Boelens and Davila (1998: 29)<br />
there may be multiple bases for water claims.<br />
The two most widely recognized doctrines<br />
for water rights are based on ownership or<br />
possession <strong>of</strong> land along rivers, streams or<br />
over aquifers (riparian rights) and claims<br />
based on historic water usage (prior<br />
appropriation). The chief features <strong>of</strong> riparian<br />
rights embrace:<br />
Gives equal rights <strong>of</strong> use to owners<br />
<strong>of</strong> land which borders on or touches<br />
a stream or across which a stream<br />
flows.<br />
A riparian right is attached to land<br />
ownership - a user can take up the<br />
right to use water at any time even if<br />
327
he/ she had not done so before and to<br />
do so affects existing users.<br />
The right is usufructuary i.e. the<br />
owner does not own the water (the<br />
resource it self can belong to the<br />
state or some other authority) only<br />
the right to use it.<br />
One who enjoys riparian rights, therefore,<br />
should receive flows from upstream land<br />
owners with out material change in amount<br />
or quality and should ensure that down<br />
stream owners enjoy the same. On the<br />
contrary, according to the appropriative<br />
doctrine the first settler or user <strong>of</strong> water from<br />
a stream acquires a right to continue the use<br />
<strong>of</strong> that portion <strong>of</strong> water needed for the<br />
irrigation <strong>of</strong> his/her land. Prior appropriation<br />
rights may be summed up as “first in time<br />
first in right”; the earlier appropriator has a<br />
right superior to later appropriator.<br />
Meinzen-Dick and Nkonya (2005:5) added<br />
that water rights can be broadly classified as<br />
public, common, or private property. Public<br />
water rights are rights held by the state and<br />
in which the government allocates rights to<br />
users (the case <strong>of</strong> Zimbabwe in 1990s and<br />
Mozambique 1991 serve as best examples).<br />
Common water rights refer to communal<br />
water rights where water can be used by<br />
people in ways that are specified by some<br />
community. In most African customary<br />
water law, water is considered as a<br />
community property and private ownership<br />
<strong>of</strong> water is not recognized. Private rights are<br />
rights held by an individual or corporations.<br />
It is generally only use rights that are<br />
recognized for individuals to use water in<br />
certain ways.<br />
Rights to water may be negotiated in many<br />
contexts, not just within communities but<br />
also between communities and others sharing<br />
water resources. Various strategies may be<br />
open to communities including direct action<br />
to acquire more water and restrict others’<br />
access; litigating in court; participating in<br />
planning and other formal administrative<br />
procedures; lobbying to advocate their case<br />
to the public and politicians; and trying to<br />
reach agreements with other water users and<br />
with water management agencies are all part<br />
<strong>of</strong> negotiating rules about who gets water<br />
(Bruns: 2005: 1).<br />
Negotiated approaches are a subset <strong>of</strong> the<br />
larger set <strong>of</strong> processes through which<br />
disputes are waged. Disputants choose where<br />
to pursue their claims, shopping among<br />
available forums to deal with water conflicts.<br />
Negotiation among disputants can <strong>of</strong>ten<br />
generate more creative and appropriate<br />
solutions than those imposed by a court or<br />
agency decisions. Mediations, facilitations<br />
and convening forums are among ways in<br />
which third parties can contribute more<br />
productive negotiation (Ibid).<br />
Generally speaking, Gulliver (1979) wrote<br />
negotiations are vital to reconcile conflicts<br />
among diverse interest groups over resource<br />
use. As he puts it,<br />
‘Negotiation involves interaction<br />
between different claimants, not<br />
unilateral decisions made in<br />
isolation. It includes sitting around<br />
a table to craft an agreement,<br />
formal trading arrangements as<br />
well as less visible struggle over<br />
access to water, as local people<br />
comply with or contest the ways in<br />
which state agencies or other<br />
users acquire and distribute water.<br />
Thus, negotiations are processes<br />
<strong>of</strong> interactions between disputing<br />
parties whereby, without<br />
compulsion by a third-party<br />
adjudicator, they endeavor to<br />
come to an independent, joint<br />
decision concerning the terms <strong>of</strong><br />
agreement on the issues between<br />
them. It proceeds through the<br />
exchange <strong>of</strong> information between<br />
the parties. Information is verbal<br />
and non-verbal including<br />
evidence, argument, appeals to<br />
rules and ideology, expressions <strong>of</strong><br />
strength and proposals <strong>of</strong> terms<br />
for agreement. Negotiation is a<br />
continuing process, influenced-but<br />
not fully determined-by changes in<br />
rules and laws. Thus, agreements<br />
may mark major milestones, but<br />
usually lead to further negotiation<br />
about how the agreement is to be<br />
worked out in detail, how to<br />
monitor compliances and respond<br />
to violations, and whether to revise<br />
agreements (Gulliver 1979: 79).’<br />
<strong>Water</strong> rights are dynamic, flexible and<br />
328
subject to frequent negotiations because <strong>of</strong><br />
uncertain water supply, damages to intake<br />
structures, and social, political and economic<br />
changes (Meinzen-Dick and Pradhan, 2006).<br />
Reflecting this argument, Bruns and<br />
Meinzen-Dick (2000: 202), put that farmers<br />
in Nepal for example, shop for and use what<br />
they believe is the best strategy available to<br />
them in a specific situation. The strategies<br />
they use depend on the social relations<br />
between the stakeholders (such as power,<br />
kinship, economic, political) as well as the<br />
legal resources they have at their disposal.<br />
In the Ethiopian context, studies conducted<br />
on water rights or processes <strong>of</strong> negotiations<br />
over irrigation water have appeared scanty.<br />
Furthermore, policies, legislations and rules<br />
issued in connection to water rights have also<br />
been far from satisfaction.<br />
Yacob (2002) contended that in Ethiopia<br />
there does not yet exist a single body <strong>of</strong> rules<br />
pertaining to the use rights <strong>of</strong> and<br />
management <strong>of</strong> water resources; which holds<br />
grains <strong>of</strong> truth for water competitors in the<br />
Waiyto valley <strong>of</strong> Southern Ethiopia where<br />
his study <strong>of</strong>fered a greater focus.<br />
Zewde (1994:88) has also elucidated that<br />
there is no extensive legislation covering the<br />
use <strong>of</strong> water in Ethiopia. But, there are<br />
decrees that water is a national asset and that<br />
it can be controlled only by the central<br />
government. Additionally, Studies conducted<br />
by (FAO, 2005) reaffirmed that written<br />
information on water use is not available.<br />
Ewnetu (1987:1) put that in Ethiopia enacted<br />
water rules appeared recently, but prior to<br />
this the people were using customarily and<br />
even today it is observed in many parts <strong>of</strong> the<br />
country.<br />
Lemma (2004:50) in his part found out that<br />
there is no policy in the region as whole that<br />
entails about water right and entitlement.<br />
Currently, the Ministry <strong>of</strong> <strong>Water</strong> Resources<br />
has formulated a water policy embodying the<br />
irrigation component both at Federal and<br />
Regional level, basing on the Agricultural<br />
Development Led Industrialization Policy (<br />
ADLI) <strong>of</strong> the country (MoWR: 1999). While<br />
the overall objective <strong>of</strong> the policy is to<br />
develop irrigated agriculture for the<br />
production <strong>of</strong> food and raw materials to agro<br />
industries, amongst specific issues the policy<br />
emphasized:<br />
1. Ensure the full integration <strong>of</strong><br />
irrigation with the overall framework<br />
<strong>of</strong> the country’s socio-economic<br />
development plans, and more<br />
particularly with the Agricultural<br />
Development (ADLI) Strategy.<br />
2. Promote users based management <strong>of</strong><br />
irrigation systems taking account <strong>of</strong><br />
the special needs <strong>of</strong> rural women in<br />
particular.<br />
3. Enhance indigenous irrigation<br />
schemes by improving water<br />
abstraction, transport systems and<br />
water use efficiency.<br />
4. Establish water allocation and<br />
priority setting criteria based on<br />
harmonization <strong>of</strong> social equity,<br />
economic efficiency and<br />
environmental sustainability<br />
requirements.<br />
5. Recognize that irrigation is an<br />
integral part <strong>of</strong> the water sector and<br />
consequently develop irrigation<br />
within the domain and framework <strong>of</strong><br />
overall water resources management<br />
(Ibid).<br />
At Oromiya regional state level, a<br />
proclamation (No.30/1999) is enacted in<br />
order to reinforce the tasks <strong>of</strong> the Oromiya<br />
Irrigation Development Authority. In the<br />
proclamation, the duties and responsibilities<br />
to be assumed by the authority with regard to<br />
how best to confiscate water by users are<br />
some how indicated. Accordingly, under<br />
article 6 (powers and duties <strong>of</strong> the authority)<br />
number 1 <strong>of</strong> the proclamation reads as:<br />
initiate and submit policies, strategies, laws<br />
and regulations <strong>of</strong> the authority.<br />
Offering a comprehensive analysis,<br />
McCornick and Seleshi (2004) have<br />
remarked on ‘<strong>Water</strong> use rights in Ethiopia’<br />
correlating with the policy environment as<br />
follows:<br />
“The relevant policy and<br />
legislative framework must<br />
continue to be strengthened and<br />
allowed to evolve to<br />
accommodate the indigenous<br />
arrangements and established<br />
water-rights, and meet the new<br />
demands. The recent<br />
improvements in the national<br />
329
water policy framework has<br />
established the necessary<br />
foundation, and there is some<br />
evidence that communities are<br />
playing a more active role in the<br />
decision making with regards to<br />
allocation and management <strong>of</strong><br />
water at the local levels,<br />
allowing for better integration <strong>of</strong><br />
indigenous water rights and<br />
management<br />
systems<br />
(McCornick and Seleshi,<br />
2004:8).<br />
To wind up Ethiopia’s experience regarding<br />
irrigation water rights, studies that elicited<br />
irrigation water entitlements and negotiations<br />
over it like Indris modern irrigation scheme<br />
were missing.<br />
Theoretical Frameworks.<br />
The central arguments <strong>of</strong> legal pluralism and<br />
processual models <strong>of</strong> negotiations were<br />
utilized as the theoretical tools to analyze<br />
water rights and the processes <strong>of</strong> negotiations<br />
at Indris modern scheme, respectively.<br />
Legal Pluralism.<br />
Legal pluralism begins from the recognition<br />
that multiple legal and normative<br />
frameworks coexist. The paradigm <strong>of</strong> legal<br />
pluralism has important consequences for the<br />
conceptualization <strong>of</strong> the relationship between<br />
norms and behavior. It depicted the<br />
perspective <strong>of</strong> people’s experience with<br />
water access and control in which individuals<br />
draw up on a range <strong>of</strong> strategies for obtaining<br />
irrigation water. Thus, government, religious,<br />
and customary laws, development project<br />
rules, and unwritten local norms may all<br />
address who should receive water, from<br />
which sources, for what purposes (Burns and<br />
Meinzen-Dick, 2000; Meinzen-Dick and<br />
Bakker, 2001).<br />
Therefore, the conceptual frame work <strong>of</strong><br />
legal pluralism became indispensable in view<br />
<strong>of</strong> contemporary water rights paradigms. It<br />
aimed to explore the different<br />
conceptualization <strong>of</strong> water and water rights<br />
and the variety <strong>of</strong> legal statuses attached to<br />
water (Ibid).<br />
Processual Models <strong>of</strong> Negotiation.<br />
Negotiations involved two distinct though<br />
interconnected processes going on<br />
simultaneously: a repetitive, cyclical one and<br />
a developmental one. The cyclical process<br />
comprises the repetitive exchange <strong>of</strong><br />
information between the competing parties,<br />
its assessment, and the resulting adjustments<br />
<strong>of</strong> expectations and preferences while the<br />
developmental process involved the<br />
movement from the initiation <strong>of</strong> dispute/<br />
conflict to its conclusion leading to some<br />
outcome with its final implementation<br />
(Gulliver, 1979: 82)<br />
Hence, the elements <strong>of</strong> the processual<br />
models were chosen to be instrumental to<br />
analyze the processes <strong>of</strong> negotiations that<br />
water users apply to settle conflicting<br />
interests while diverting irrigation water in<br />
the study localities.<br />
Ethnographic Accounts: Findings and<br />
Results <strong>of</strong> the Research.<br />
Historical Background <strong>of</strong> Indris Scheme:<br />
Phases <strong>of</strong> Irrigation Development.<br />
The investigation on the historical<br />
background <strong>of</strong> Indris scheme demonstrated<br />
its development in three distinctive stages;<br />
pre-conditions in the initial phases (prior to<br />
1972 E.C), operations in an indigenous<br />
manner (extending from 1972-1986 E.C),<br />
and complete conversion into modern style<br />
(post 1986 E.C).<br />
In the first phase <strong>of</strong> irrigation development<br />
around Indris river, as confirmed by the<br />
participants <strong>of</strong> the focus group discussion<br />
held at Selam Sefer, the practice was<br />
introduced alongside with the introduction<br />
<strong>of</strong> the Grinding Mill technology and<br />
essentially characterized as;<br />
‣ Production was only to<br />
complement household<br />
consumptions. That connoted<br />
market orientation was quite<br />
negligible.<br />
‣ The practice was carried out on<br />
small pieces <strong>of</strong> land (confined<br />
only in their gardens) by few<br />
households alone.<br />
‣ The vegetables and fruits planted<br />
were limited in variety.<br />
‣ The involvement and advisory<br />
support <strong>of</strong> external institutions<br />
like the agricultural desk had<br />
330
een missing.<br />
In the second phase, the completion <strong>of</strong><br />
digging the web <strong>of</strong> canals and building up<br />
the indigenous dam that in fact lasts only<br />
during the dry season marked a momentous<br />
shift in the historical development <strong>of</strong> the<br />
scheme in numerous respects. To portray the<br />
highlight <strong>of</strong> some;<br />
• Remarkable increase in the number<br />
<strong>of</strong> water users (250 HHs).<br />
• Incorporation <strong>of</strong> larger hectares <strong>of</strong><br />
land under irrigation practice (about<br />
180 hectares at its upper limit).<br />
• Use <strong>of</strong> irrigated produces both for<br />
domestic consumption and market<br />
supply.<br />
• Formulation <strong>of</strong> agreed up on by-laws<br />
with the technical assistance <strong>of</strong><br />
agricultural workers and other<br />
<strong>of</strong>ficials from the desk. In the first<br />
phase <strong>of</strong> irrigation development,<br />
certain tacitly perceived normative<br />
rules emanating from the broader<br />
customs <strong>of</strong> the society had guided<br />
the actions <strong>of</strong> water users. Thus,<br />
such sorts <strong>of</strong> implicit normative rules<br />
were transformed into more or less<br />
written rules being interwoven with<br />
certain fragmented elements <strong>of</strong> the<br />
prevailing irrigation guidelines.<br />
• Developed the custom <strong>of</strong> irrigating<br />
twice per a year which was not<br />
formerly patterned in the first phase.<br />
• Institutions like the Agricultural<br />
Training Centre began to divert<br />
water as its second best alternatives.<br />
Previously, the institute used to<br />
divert a substantial amount <strong>of</strong> water<br />
from Chole River.<br />
Along with the significant progress that<br />
accompanied the scheme’s development,<br />
water users have also internalized the wideranging<br />
worth <strong>of</strong> irrigated farming. The<br />
compounded effects <strong>of</strong> these great changes<br />
and the increasing recognition by<br />
practitioners, created the motive for the<br />
transformation <strong>of</strong> the scheme into its third<br />
phase i.e. from indigenous scheme to modern<br />
system.<br />
Principally, the increasing demand from the<br />
framers side and the discharging capacity <strong>of</strong><br />
the indigenous scheme on the other hand<br />
happened to be inconsistent to meet the<br />
interests <strong>of</strong> the drastically growing<br />
population. The gap grows wider pertaining<br />
to the gradual decline in the volume <strong>of</strong> water.<br />
As a result the water users, the district and<br />
zonal irrigation bureaus as well as the<br />
Agricultural Training Center initiated a<br />
proposal to scale up the working capacity <strong>of</strong><br />
the scheme. Amongst organizations<br />
requested, it was the European Economic<br />
Commission (EEC) that showed practical<br />
interest to donate( 3.5 Million Birr) for the<br />
construction <strong>of</strong> the modern dam that took<br />
over 2(two) years. Prior to the involvement<br />
<strong>of</strong> EEC, countless efforts were in place to<br />
build up the dam in relatively strong way to<br />
function for longer durations than the<br />
indigenous manner.<br />
The transformation <strong>of</strong> the scheme into<br />
modern operation has induced further<br />
developments besides those noteworthy<br />
moves formerly attained. Through the<br />
discussions held with the agricultural<br />
development agents, the following points<br />
were obtained:<br />
The command area has grown to cover<br />
7-8Kms. In its indigenous operation, it<br />
was managed to reach users within<br />
limited radius from the source, perhaps<br />
not more than 4-5kms away from the<br />
main source. Only sites closer to the<br />
main canal got irrigation water<br />
sufficiently. Thus, the conversion <strong>of</strong> the<br />
scheme augmented the command area by<br />
at least 2-3kms.<br />
The scale <strong>of</strong> the scheme grew from small<br />
to medium range. It was about 180<br />
hectares (categorized as small scheme)<br />
<strong>of</strong> land covered through indigenous<br />
irrigation techniques that stretched to<br />
incorporate about 381 hectares<br />
(categorized as medium scale) <strong>of</strong> land in<br />
its current state. The numbers <strong>of</strong> water<br />
users have also increased from 250HHs<br />
to 1020HHs as a result <strong>of</strong> opportunities<br />
secured in connection to the promotion<br />
<strong>of</strong> Indris scheme.<br />
The need to apply environmentally<br />
sound and scientifically proved varieties<br />
escalate based on the calculations to gain<br />
satisfactory benefits.<br />
The institutional capacities and<br />
management systems <strong>of</strong> irrigation water<br />
became to be handled by Indris <strong>Water</strong><br />
Users Association (WUA). The<br />
association was formed with the mandate<br />
to operate since the aftermath <strong>of</strong> the<br />
transformation <strong>of</strong> the scheme. Problems<br />
331
interlinked with water scheduling, water<br />
misappropriations (in the form <strong>of</strong> theft,<br />
seepages or salinity) received more<br />
concern in an integrated approaches<br />
since the promotion <strong>of</strong> the scheme.<br />
Irrigation production (fruits and<br />
vegetables) inclined to focus on market<br />
orientations. In this third phase,<br />
production for market supply<br />
outweighed household consumption.<br />
<strong>Water</strong> users’ dependence on irrigation<br />
practice augments across the three<br />
villages. The majority <strong>of</strong> them were<br />
reluctant to engage in the practice in<br />
former phases <strong>of</strong> irrigation development.<br />
‣ A slight modification to the naming<br />
<strong>of</strong> the scheme was also another<br />
development with the promotion <strong>of</strong><br />
the scheme. The indigenous<br />
diversion was named after the name<br />
<strong>of</strong> the river itself i.e. Indris. The<br />
intent behind the new naming has<br />
stemmed from irrigators’ exclusive<br />
dependence on the water diverted<br />
from the river. On a meeting <strong>of</strong> the<br />
general assembly, which is <strong>of</strong> course<br />
the highest decisive body; it was<br />
reached a consensus to name the<br />
scheme as ‘Indris Fayiissa’ literally<br />
mean Indris our savior.<br />
Indris Modern Scheme: constructed with 3.5<br />
million Birr donated by EEC.<br />
Basing on discussions held with the<br />
agricultural development workers and<br />
irrigation experts pertaining to factors that<br />
impeded the development <strong>of</strong> Indris scheme,<br />
state <strong>of</strong> affairs described below were<br />
extracted;<br />
o The policy environment regarding<br />
irrigation schemes lacked strong<br />
basis. Dearth <strong>of</strong> specific directives<br />
and guidelines on pragmatic<br />
implementations represents one<br />
instance.<br />
o<br />
o<br />
o<br />
Lack <strong>of</strong> support on financial and<br />
technical skills had also their<br />
contributions.<br />
Institutional weaknesses prevailing<br />
at the three stages <strong>of</strong> the scheme’s<br />
development was another<br />
constraining factor. Nearly in all<br />
circumstances institutional matters<br />
were either taken for granted or<br />
deliberately overlooked as if it could<br />
pose only miniature effects.<br />
Conflicts <strong>of</strong> diverse nature (among<br />
water users themselves in their<br />
vicinity, water users <strong>of</strong> upper groups<br />
against lower reaches, or between<br />
water users and other claimant<br />
institutes) somehow lingered the<br />
developments relating with Indris<br />
scheme.<br />
Therefore, interplay <strong>of</strong> factors both from<br />
within and outside the irrigation system has<br />
interacted to induce these encouraging<br />
changes. Above all, the internal motives <strong>of</strong><br />
water users striving for betterment on water<br />
resource extractions interwoven with the<br />
financial donation <strong>of</strong> European Economic<br />
Commission played pivotal role to attain its<br />
current state.<br />
Intricacy in the chains <strong>of</strong> structures and<br />
institutions involved in the management,<br />
allocation and distribution <strong>of</strong> water have<br />
moved from a state <strong>of</strong> simple operations to<br />
the level <strong>of</strong> sophisticated webs <strong>of</strong> networks<br />
directed by the frameworks <strong>of</strong> Indris <strong>Water</strong><br />
Users Association. The general assembly <strong>of</strong><br />
users took its ultimate power to provide<br />
decisions for the pragmatic allocations and<br />
distributions <strong>of</strong> water via the committee<br />
functioning at three levels: Executive, Gooxii<br />
(territorial level) and Garee (team level).<br />
<strong>Water</strong> Rights among Irrigators in the<br />
Study Area: Basics for Decision and<br />
Access.<br />
The basics for water right access and<br />
decision have enjoyed a broader spectrum <strong>of</strong><br />
considering land rights, historical<br />
precedence/settlement in the area, financial<br />
as well as labor requirements to be<br />
maintained by users. At a time the irrigation<br />
practice commenced in the area, land rights<br />
or possessions had been considered as a<br />
factor to enable users’ access to irrigation<br />
332
water. This signified and coincides with the<br />
elements <strong>of</strong> the riparian water right doctrine.<br />
In the second phase <strong>of</strong> the scheme’s<br />
operation in an indigenous manner, historical<br />
precedence and settlement in the villages had<br />
predominantly served as a parameter to<br />
decide and secure users access to irrigation<br />
diversion on top-<strong>of</strong> land rights. With the<br />
conversion <strong>of</strong> the scheme into modern style,<br />
the decisions to admit or deny users for<br />
irrigation water rights rest on and determined<br />
through their labor contributions and<br />
fulfillment <strong>of</strong> obligations imposed by the<br />
general assembly. <strong>Water</strong> users were also<br />
noted to employ a mix <strong>of</strong> techniques for<br />
creating access to water rights in the form <strong>of</strong><br />
sharecropping, purchase or contractual<br />
arrangements through negotiated approaches.<br />
Informants in the three research villages have<br />
denoted the most essential factors that should<br />
be considered basics for access and decision<br />
since the conversion <strong>of</strong> the scheme into<br />
modern style:<br />
i. The applicant should be above 18<br />
years old and establish his/her own<br />
family.<br />
ii. The applicant should have a well<br />
defined residence in the PA and be<br />
registered as a member <strong>of</strong> the WUA <strong>of</strong><br />
Indris scheme.<br />
iii. The water users need to own not only a<br />
land but also make sure that a portion<br />
<strong>of</strong> the land has to be suitable for<br />
irrigation.<br />
iv. To reinforce their water rights access,<br />
users have to meet their obligations<br />
which are clearly incorporated on the<br />
water use manual. The obligations to<br />
be maintained by water users at the<br />
fore front encompass.<br />
a. Respect and materialize the by-laws<br />
<strong>of</strong> the WUA:<br />
b. Entire utilization <strong>of</strong> potentially<br />
available irrigation plots.<br />
c. The members <strong>of</strong> WUA are obliged to<br />
conduct canal cleaning and<br />
maintenance once or twice a year.<br />
d. Timely completion <strong>of</strong> financial fees:<br />
the obligation to timely pay their<br />
financial fees constitute among<br />
compulsions imposed on water<br />
users. The financial payments<br />
expected from water users basically<br />
comprises <strong>of</strong>;<br />
Taxes collected by<br />
administrative structures<br />
depending on the total hectares<br />
<strong>of</strong> land holdings.<br />
Payments aiming to compensate<br />
services rendered by distinct<br />
institutions like credit and saving<br />
services.<br />
Payments imposed on water<br />
users as a punishment in<br />
recognition to their disobedient<br />
acts against the WUA by-laws.<br />
Annual fees collected from<br />
water users for maintenance and<br />
operations.<br />
e. Safeguarding the scheme and any<br />
other assets <strong>of</strong> Indris WUA.<br />
f. Attendance and participation on<br />
meetings.<br />
Certain interlocking factors do shadow the<br />
water rights <strong>of</strong> users. To outline few:<br />
• When the scheme functioned in an<br />
indigenous manner, water right issues<br />
were not as such perceptive. As a<br />
result, the inclinations <strong>of</strong> the<br />
agricultural desk as well as water users<br />
were far from addressing themes on<br />
water rights. It has been with growing<br />
conflicts, dialogue and violation <strong>of</strong><br />
rules that water rights got an<br />
increasing concern.<br />
• Diminished endeavor on the<br />
enforcement <strong>of</strong> by-laws <strong>of</strong> the WUA.<br />
The poor application <strong>of</strong> directives<br />
stated on the manual made their<br />
implications to carry insignificant<br />
effects.<br />
• The dynamic nature <strong>of</strong> water rights;<br />
the basic dimensions considered to<br />
access irrigators’ water right have not<br />
been fixed. Access to land rights<br />
fundamentally determined users’ water<br />
right during the initial phase <strong>of</strong> the<br />
scheme’s development. This was<br />
accompanied sooner with the questions<br />
<strong>of</strong> settlement closer to the water canals<br />
i.e. historical precedence in the area.<br />
Recently, the reconstruction <strong>of</strong> the<br />
scheme also necessitates the<br />
reformation <strong>of</strong> irrigators’ water right in<br />
several regards. The dynamic natures<br />
<strong>of</strong> water rights become more intricate<br />
as its rules originate from multiple<br />
origins. For instance, since the<br />
promotion <strong>of</strong> Indris modern scheme,<br />
irrigators could get accesses <strong>of</strong> water<br />
rights plausibly via:<br />
i. Inheritance from parents or<br />
333
ii.<br />
iii.<br />
relatives who had formally<br />
established their irrigation water<br />
rights.<br />
Purchase <strong>of</strong> the water rights <strong>of</strong> a<br />
given user through contractual<br />
agreements.<br />
<strong>Water</strong> rights maintained through<br />
share-cropping.<br />
iv. <strong>Water</strong> rights acquired in<br />
association with land redistributions<br />
by the government.<br />
The water right rules are multiple in origin<br />
and integrative in function. The<br />
predominately governing water use rules are<br />
the combination <strong>of</strong> customary normative<br />
dictations and formal-legal irrigation water<br />
management guidelines. These water right<br />
rules are inheritable, dynamic in the sense<br />
that they would be subject to revisions either<br />
for omissions or additions pertaining to the<br />
turmoil environment.<br />
Webs <strong>of</strong> multiple factors have been<br />
investigated to hold linkages with water<br />
rights either to promote or curtail users’<br />
accesses and participations for decisions.<br />
Economic status, power, gender, ethnicity<br />
and religion comprised amongst the pertinent<br />
factors that have in one way or another<br />
contributed either to facilitate or deter users’<br />
access to irrigation water. Economic status,<br />
for instance, affected the water right <strong>of</strong> users<br />
at least as the economically better <strong>of</strong>,<br />
• Completes a range <strong>of</strong> tuitions imposed<br />
on them earlier in relation to the<br />
economically weak.<br />
• Can purchase access to water rights<br />
through contractual agreements or<br />
entering share-cropping. In contrast,<br />
water users in an economically weak<br />
position lack to utilize such<br />
opportunities.<br />
• Develop a relatively strong channel <strong>of</strong><br />
communication with the committee<br />
members, extension workers and other<br />
institutes.<br />
In a similar talk, whatever the fashions <strong>of</strong> its<br />
manifestations, power relations have<br />
prevailed among diverse entities where in an<br />
institution or individual user either<br />
legitimately or illegitimately tries to impose<br />
their power weakening the water right <strong>of</strong><br />
those in comparably underprivileged<br />
positions. In consistence with this view,<br />
Boelens and Davila (1998:445- 447)<br />
confirmed the conception that ‘water flows<br />
in the direction <strong>of</strong> power’. Within unequal<br />
power structures, different societal bodies<br />
define their strategies in order to defend and<br />
materialize their own interests in controlling<br />
the water. Thus, ill-treated distribution <strong>of</strong><br />
irrigation water is not only through<br />
consideration <strong>of</strong> economic status but also<br />
mystification <strong>of</strong> the power via which the user<br />
households or institute define its access. The<br />
same holds true for investigations on gender<br />
matters where in women are losers and men<br />
defined their dominance.<br />
Alike to economic status, power interactions<br />
and gender dimensions, religious out looks<br />
and ethnicity have also carried similar effects<br />
though not as affective as dimensions<br />
discussed above. In terms <strong>of</strong> religious out<br />
looks, for instance, there were occasions<br />
when water users in the same church<br />
deliberately cover water right <strong>of</strong>fenses<br />
committed against users who do not belong<br />
to the category. The tendency to sympathize<br />
or disregard one another based on ethnic<br />
considerations only rarely noticed compared<br />
to other dimensions. Rather, strong<br />
interrelationships maintained through social<br />
ties and webs <strong>of</strong> networks (like associations<br />
<strong>of</strong> Iquib/Idir, marriage, extended families,<br />
work labor parties in the form <strong>of</strong> Debaree or<br />
Debo) worked either to enhance or deter the<br />
access <strong>of</strong> users in or out <strong>of</strong> the network<br />
differently.<br />
The pragmatic application <strong>of</strong> irrigation water<br />
right occupied a prominent place in the<br />
struggle to enhance irrigators’ livelihood or<br />
income expropriated from the practice.<br />
Failures to observe the water use rules in<br />
general and ones own water right in<br />
particular deteriorated users’ livelihoods. As<br />
an instance, users with longer experiences <strong>of</strong><br />
implementing the water user rules have been<br />
reported to progressively improve their<br />
livelihoods year after year while conversely<br />
those failing to apply the rules suffer from<br />
crisis imposed on them in the form <strong>of</strong><br />
punishments.<br />
There existed few non-irrigators who failed<br />
to acquire the opportunity to divert water<br />
from Indris scheme due to varied reasons.<br />
None <strong>of</strong> the contacted non- irrigators claimed<br />
that constraints interlinked with water rights<br />
have never deterred them both from the<br />
access or decisions. Rather distance from the<br />
334
scheme/ source, decline in the amount <strong>of</strong><br />
water for the lower stream users (Kilinto)<br />
and geographical barriers for the upper<br />
stream users (Selam Sefer) became major<br />
hampering factors on top <strong>of</strong> other personal<br />
matters.<br />
Negotiations and Dispute Settlement over<br />
Irrigation <strong>Water</strong> in the Study Area.<br />
Conflicts <strong>of</strong> competing interests among<br />
diverse categories <strong>of</strong> users are another<br />
dimension to be looked at with co-relation to<br />
the water right <strong>of</strong> users. The results and<br />
discussions <strong>of</strong> primary data generated during<br />
the field work proved increase both in the<br />
intensity and severity <strong>of</strong> conflicts over<br />
irrigation water matching the three phases <strong>of</strong><br />
the scheme’s development. Conflicts occur<br />
among users in a village, along the streams<br />
<strong>of</strong> the scheme or between farmers and the<br />
Agricultural Training Center <strong>of</strong> Ambo<br />
College.<br />
The principal causes for conflicts to erupt out<br />
has been embedded in the transgression <strong>of</strong><br />
negotiated water use rules like theft, turn<br />
abuses, failing to timely pay financial fees or<br />
deliberate ignorance <strong>of</strong> labor contributions<br />
for canal operations and maintenance and<br />
gradual decline in the volume <strong>of</strong> water<br />
resource itself. Power abuse became to be<br />
considered as the second chief factor for<br />
conflicts.<br />
These conflicts have been handled at distinct<br />
levels within the village through elders and<br />
committee decisions, at Kebele courts or at<br />
district court. In case these conflicts emerge<br />
into disputes that stayed over a prolonged<br />
duration <strong>of</strong> time, a succession <strong>of</strong> negotiation<br />
processes and procedures would be<br />
employed to manage the case. The processes<br />
involved could range from identification <strong>of</strong><br />
the central predicaments to the final remarks<br />
<strong>of</strong> disputants that assured their consents not<br />
to replicate a similar disagreement once<br />
again. The protracted conflict between the<br />
Agricultural Training Center and the farmers,<br />
or users in the upper and lower streams<br />
basically exhibited typical instances <strong>of</strong> the<br />
case in point.<br />
Of course, negotiations have been carried out<br />
in dual senses: negotiations under normal<br />
circumstances and negotiations conducted to<br />
smooth disputes. In its former meaning,<br />
water users do frequently negotiate over a<br />
range <strong>of</strong> issues to be implemented with the<br />
supposition to promote the effectiveness <strong>of</strong><br />
the entire system. These include negotiations<br />
executed in relation to a range <strong>of</strong> fees,<br />
categories <strong>of</strong> items to be irrigated,<br />
maintenance schedules and labor<br />
contributions, total hectares <strong>of</strong> land to be<br />
irrigated or possibly water scheduling days<br />
and hours. On the other hand, a series <strong>of</strong><br />
processes <strong>of</strong> negotiations would be<br />
undertaken successively at times <strong>of</strong> serious<br />
conflicts. Generally, the steps pursued to<br />
initiate and finalize the processes <strong>of</strong><br />
negotiations moves through state <strong>of</strong><br />
procedures described below;<br />
i. Recognition <strong>of</strong> the grounds <strong>of</strong> the<br />
dispute/ Causes: at this point the<br />
negotiators themselves or the<br />
mediators (elders, committee,<br />
Kebele or district court) examine the<br />
basis <strong>of</strong> the conflict.<br />
ii. Conduct assessments on the<br />
prospective points to be<br />
negotiated: having deeply examined<br />
what have instigated the conflict;<br />
either the negotiators or mediators<br />
move to sort out the promising<br />
arenas where in negotiation would<br />
be set in motion to bring out<br />
remarkable agreements.<br />
iii. Persistent presentation <strong>of</strong><br />
negotiators’ respective cases and<br />
points <strong>of</strong> departure: the segregation<br />
<strong>of</strong> points over which negotiation<br />
produce relatively stable<br />
interactions, ultimately invite<br />
negotiators to present their cases to<br />
each other and the mediators in the<br />
attempts to persuade the audiences<br />
elaborating that their argument<br />
contained more reality than their<br />
opponents. There also appeared the<br />
presumption that negotiators who<br />
aspired to gain much from the debate<br />
need to condemn the arguments <strong>of</strong><br />
their opponents. The presentation <strong>of</strong><br />
their respective cases usually takes<br />
much <strong>of</strong> the time in the entire<br />
processes <strong>of</strong> negotiation.<br />
iv. Narrowing the gap perceptible<br />
between the interests <strong>of</strong><br />
negotiators: the succession <strong>of</strong><br />
appointments to heed the respective<br />
cases <strong>of</strong> water users in dialogue<br />
enable to easily distinguish the gap<br />
335
in the interests perceptible between<br />
either the teams or individuals in<br />
debate. At this instance, the<br />
negotiators themselves or mediators<br />
would engaged in the facilitation <strong>of</strong><br />
negotiation processes or suggest the<br />
strategies pertinent to successfully<br />
narrow the competing interests <strong>of</strong><br />
claimants.<br />
v. Provide the final decisions to<br />
confirm and attain consensus: with<br />
the minimization <strong>of</strong> the gap, comes<br />
the concrete decisions to be accepted<br />
commonly by the former opponent<br />
sides.<br />
These steps largely represent the standards at<br />
least to be pursued, details <strong>of</strong> procedures<br />
incorporated in each steps vary from village<br />
to village or depending on the general setting<br />
where the negotiation have been conducted.<br />
The implications and essential arguments <strong>of</strong><br />
the processual models <strong>of</strong> negotiation<br />
(cyclical and developmental) hold<br />
coincidences with the issues at hand. In each<br />
step <strong>of</strong> negotiation, as participants <strong>of</strong> the<br />
focus group discussions revealed out, there<br />
exist recurrent exchange <strong>of</strong> views and<br />
information that enabled the opposing<br />
categories to learn more about the<br />
expectations and responses to the particular<br />
quests embraced in the process. This notion<br />
specifically parallels with the elements <strong>of</strong><br />
cyclical model <strong>of</strong> negotiation. The<br />
cumulative effects <strong>of</strong> each negotiation steps<br />
finally culminate in generation <strong>of</strong> the<br />
consensus sought by water users as their<br />
primary target. So, the ultimate achievement<br />
(i.e. bargaining over their irrigation water<br />
rights) elicited the central attributes <strong>of</strong> the<br />
developmental model <strong>of</strong> negotiation. The end<br />
results <strong>of</strong> negotiations over water rights<br />
assured through repetitive and cyclical<br />
processes <strong>of</strong> both information sharing and<br />
learning depicted in each stage enabled users<br />
to transform from a state <strong>of</strong> competing<br />
interests to collaborating entities.<br />
Though the ultimate aim to conduct<br />
negotiation processes have been triggered<br />
with the motives to induce a real truce,<br />
sometimes the outcomes may not end in the<br />
way expected to attain encouraging targets.<br />
Instead, it leads to additional rearrangements<br />
for having chains <strong>of</strong> negotiations. Anyhow,<br />
at the end <strong>of</strong> negotiation processes, the<br />
competing parties or users may gain certain<br />
parts <strong>of</strong> their quests submitted for<br />
negotiations though commonly unfeasible to<br />
acquire the entire range <strong>of</strong> their initial<br />
pursuits.<br />
Conclusion and Recommendations.<br />
Conclusion.<br />
Debates over access to water rights for<br />
irrigation usage and negotiations have been<br />
central among water users and institutions<br />
claiming water from Indris scheme. These<br />
debates over water right claims have been<br />
mainly attributed to rising competitions over<br />
irrigation water, drastic population growth<br />
and shrink in the volume <strong>of</strong> water due to<br />
augmented diversions points on Indris River<br />
as well as failures to strictly observe rules <strong>of</strong><br />
conduct for resource use. Disputes associated<br />
with use rights, like farmers against Ambo<br />
Agricultural Training Center, or among the<br />
farmers themselves have predominantly<br />
prevailed in the research sites.<br />
Though the elements <strong>of</strong> both the riparian and<br />
appropriative doctrines <strong>of</strong> water rights<br />
mirrors among the irrigators in the study<br />
sites, their know-how regarding water right<br />
entitlements appeared to be found at its<br />
infancy. Themes that center on irrigation<br />
water rights tended to be overlooked under<br />
normal circumstances. Such topics become<br />
sensitive and an area <strong>of</strong> controversy only<br />
when the rules are frequently violated<br />
affecting the use rights <strong>of</strong> members. As a<br />
whole, water right themes for irrigation<br />
diversion gradually began to receive<br />
substantial concerns corresponding to the<br />
phases <strong>of</strong> the development <strong>of</strong> Indris scheme.<br />
The theoretical frameworks employed as a<br />
conceptual tool to examine the water rights<br />
and processes <strong>of</strong> negotiations over irrigation<br />
water among irrigators diverting water from<br />
Indris scheme proved to be in consistence<br />
with the experiences <strong>of</strong> other developing<br />
nations reviewed in the literature. Hence,<br />
both the arguments <strong>of</strong> legal pluralism<br />
advocated principally by Burns and<br />
Meinzen-Dick (2000) in water rights<br />
paradigms and the processual models <strong>of</strong><br />
negotiations discussed by Gulliever (1979)<br />
were pragmatically apparent in the daily<br />
actions and practices <strong>of</strong> water users in Toke<br />
Kutaye district <strong>of</strong> West Shewa Zone.<br />
336
In essence, the applicability <strong>of</strong> legal<br />
pluralism was verified via the multifarious<br />
sources <strong>of</strong> water rights and their integral<br />
functionality. This fitted with the<br />
conclusions <strong>of</strong> former studies carried out in<br />
various developing countries. In that regard,<br />
a study by Cleaver, et al ( 2005)<br />
demonstrated the conception that claims to<br />
resources in general and water in particular<br />
are made and enforced through both ‘formal’<br />
(local government, <strong>Water</strong> Users<br />
Associations, tenure arrangements) and<br />
‘informal’ ( customary practices, social<br />
relationships, norms <strong>of</strong> use and access) frame<br />
<strong>of</strong> references.<br />
Correspondingly, at Indris scheme, a<br />
combination <strong>of</strong> rules for water rights<br />
stemming out <strong>of</strong> the broader normative rules<br />
as well as guidelines formally enacted for<br />
irrigation water management were essentially<br />
available. In the efforts to reinforce water<br />
rights besides rules framed out indigenously,<br />
significant reforms embodying the legal<br />
environment have been accomplished with<br />
the help <strong>of</strong> Toke Kutaye district agricultural<br />
desk. While the indigenous rules exhibit the<br />
pragmatic contexts <strong>of</strong> irrigators in their<br />
respective vicinities, the formal-legal<br />
approach tends to emphasize the components<br />
<strong>of</strong> irrigation directives adopted by the<br />
government to be implemented for inducing<br />
change. The arguments extracted from these<br />
dual approaches have evidenced to effectuate<br />
the water use right claims and the processes<br />
<strong>of</strong> negotiations among irrigators in the study<br />
areas.<br />
In this research, it was realized that<br />
customary rules were particularly effective in<br />
curbing conflicts while the formal guidelines<br />
become strong to reinforce punishments at<br />
moments either the rules are poorly<br />
interpreted or deliberately transgressed. As a<br />
result, combinations <strong>of</strong> these rules enable to<br />
have wider frameworks for the actions and<br />
behaviors admitting users to divert water.<br />
Therefore, the paradigm <strong>of</strong> legal pluralism<br />
contains much relevance with the existing<br />
realities <strong>of</strong> water users in the three selected<br />
research settings for this study (Selam Sefer,<br />
Dhaga Fillee and Kilinto).<br />
In a similar manner, the arguments <strong>of</strong><br />
processual models (both cyclical and<br />
developmental) <strong>of</strong> negotiations expounded<br />
by Gulliever (1979) tested to bear reliability<br />
with the way conflicts over irrigation water<br />
have been settled or the processes gone<br />
through to negotiate and renegotiate for<br />
securing access to water. Though these<br />
models are thought to work at the same<br />
instance, the cyclical model applies more to<br />
grip minor conflicts erupting out among<br />
users or teams in a village. Conversely, the<br />
developmental model <strong>of</strong> negotiation has been<br />
utilized to justify the protracted disputes<br />
continued over a number <strong>of</strong> days or a couple<br />
<strong>of</strong> months. The arguments <strong>of</strong> this same<br />
model appeared instrumental to reconcile the<br />
antagonistic interests <strong>of</strong> the Agricultural<br />
Training Center and farmers as well as<br />
frequently occurring disputes among water<br />
users at Selam Sefer (as upper stream<br />
beneficiaries) and Kilinto (as lower stream<br />
beneficiaries).<br />
Recommendations<br />
The views contended herein below demand<br />
the concerted efforts <strong>of</strong> interested<br />
stakeholders, users themselves, researchers<br />
or institutes to contribute their resources (in<br />
the form <strong>of</strong> time, know-how/ technical skills,<br />
donations or material supplies) to narrow<br />
missing gaps and thereby endeavor for better<br />
transformation. Hence, the clues embrace:<br />
i. The policy pertaining to irrigation<br />
water management in general and<br />
water right entitlements in particular<br />
have been in progress time over<br />
time. This investigation indicated the<br />
need to further coin out specific<br />
water right guidelines by the relevant<br />
organs in an instructive way and<br />
equally applicable for all users.<br />
ii.<br />
iii.<br />
The chief stakeholders like the<br />
district agricultural desk need to<br />
provide special focus on enhancing<br />
the awareness level <strong>of</strong> users about<br />
the overall nature <strong>of</strong> water rights.<br />
Formerly, it was confirmed that<br />
inadequate attention was paid to<br />
programs that create awareness<br />
among users about water rights. As it<br />
promotes the empowerment <strong>of</strong> users<br />
in that regard, there is an acute need<br />
to incorporate water right themes in<br />
the plans for actions to be<br />
implemented.<br />
There prevailed the tendency to<br />
337
increasingly undermine the role <strong>of</strong><br />
customary rules and instead<br />
forcefully impose legally recognized<br />
rules by various government<br />
organizations. Yet, the customary<br />
rules were by no means less in<br />
effective than the formally laid<br />
directives in numerous respects (for<br />
instance, saving resources). Hence,<br />
emphasis has to be given on<br />
advocating the merits <strong>of</strong> customary<br />
rules that shines the wisdom and<br />
cumulative experiences/skills <strong>of</strong><br />
practitioners.<br />
iv. The causes <strong>of</strong> conflict were<br />
essentially embedded in failures<br />
either to adhere or loose<br />
implementation <strong>of</strong> the negotiated<br />
rules <strong>of</strong> water use. In this regard, the<br />
findings <strong>of</strong> the study have indicated<br />
the existence <strong>of</strong> a serious affair that<br />
must be addressed thoroughly.<br />
Therefore, water users, technical<br />
experts, the institutes claiming water<br />
from the scheme or other<br />
stakeholders need to work hand-inglove<br />
manner to reinforce the<br />
practical interpretation <strong>of</strong> rules on<br />
the ground.<br />
v. In the face <strong>of</strong> growing population<br />
and declining water volume,<br />
competitions over irrigation<br />
diversion would inevitably augment.<br />
Initiatives to supplement water from<br />
other perennial and potential rivers<br />
(like Heddee) have been proposed by<br />
users, the district agricultural desk<br />
and the Agricultural Training Center.<br />
As the materialization <strong>of</strong> this<br />
proposition would only be realistic<br />
with the financial assistances <strong>of</strong><br />
interested organizations (like EEC),<br />
the study suggests conducting further<br />
assessments or searches on the<br />
likelihood to assure irrigation water<br />
sources in addition to Indris Scheme.<br />
vi.<br />
Negotiated approaches over water<br />
rights and other themes in the<br />
irrigation system, as a best option,<br />
have facilitated desirable<br />
achievements in inducing common<br />
understandings between disputants.<br />
Despite its remarkable role to settle<br />
Reference<br />
conflicts <strong>of</strong> interests, negotiated<br />
approaches have been declining over<br />
time tending to carry little credits<br />
among users. The study recommends<br />
<strong>of</strong>fering particular considerations on<br />
collective actions that uphold the<br />
enhancement <strong>of</strong> negotiated<br />
approaches over resource use<br />
(water). The institutions like WUA<br />
mediating the access <strong>of</strong> users need<br />
also undergo periodic restructurings<br />
in a way to accommodate ever<br />
growing demands <strong>of</strong> the users.<br />
Adams, W.M (1992). Wasting the Rain:<br />
Rivers, People and Planning in Africa.<br />
University <strong>of</strong> Minnesota Press,<br />
Minneapolis, London.<br />
Aureli, Alice and Brelet, Claudine (2004).<br />
Women and <strong>Water</strong>: An Ethical Issue.<br />
Retrievedfromhttp://unesdoc.unesco.or<br />
g/images/0013/001363/136357e.pdf.<br />
27/06/2007. UNESCO, Printed in<br />
France.<br />
Barlett, F. Peggy (1980). Agricultural<br />
Decision Making: Anthropological<br />
Contribution to Rural Development.<br />
Academic Press, Inc.<br />
Barrow, Chris (1987). <strong>Water</strong> Resources and<br />
Agricultural Development in the Tropics.<br />
Co-Published in the United States with<br />
John Wiley and Sons, Inc., New York.<br />
Bedru Beshir (2004). “Small Scale Irrigation<br />
Users Peasant Horticulture in Dugda<br />
Bora and Adami Tulu Jido Kombolcha<br />
Woredas, East Shewa Zone: Challenges<br />
and Opportunities.” MA Thesis. Addis<br />
Ababa University. Addis Ababa.<br />
Blank, G. Herbert; Mutero, M. Clifford and<br />
Murray-Rust, Hammond (2002). The<br />
Changing Face <strong>of</strong> Irrigation in Kenya:<br />
Opportunities for Anticipating Change in<br />
Eastern and Southern Africa.<br />
<strong>International</strong> <strong>Water</strong> <strong>Management</strong><br />
<strong>Institute</strong> (IWMI).<br />
Boelens, Rutgerd and Davila, Gloria (1998).<br />
Searching for Equity: Conceptions <strong>of</strong><br />
Justice and Equity in Peasant Irrigation.<br />
Van Gorcum and Comp,B,V., The<br />
Netherlands.<br />
Bruns, Randolhp Bryan and Meinzen- Dick<br />
S. Ruth. (2000). Negotiating <strong>Water</strong><br />
Rights. <strong>International</strong> Food Policy<br />
Research <strong>Institute</strong>. LTDG Publishing.<br />
338
Carney,Diana and Farrington,John (1998).<br />
Natural Resource <strong>Management</strong> and<br />
Institutional Change. Routledge<br />
Research /ODI Development Policy.<br />
Routldge, Taylor and Francis group.<br />
London and New York.<br />
Cernea, M. Michael (1991). Putting People<br />
First: Sociological Variables in Rural<br />
Development. Second Edition. A World<br />
Bank Publication.<br />
Cleaver, Frances; Franks, Tom; Boesten,<br />
Jelke and Kiire, Angela (2005).<strong>Water</strong><br />
Governance and Poverty: What Works<br />
for the Poor? Bradford Center for<br />
<strong>International</strong> Development. University <strong>of</strong><br />
Bradford.<br />
http://www.bradford.ac.uk/acad/bcid/re<br />
search/poverty/projects/water/<strong>Water</strong>_Go<br />
vernance_and_Poverty_Final_Report.pdf<br />
.<br />
Cornish, Gez (1998). Modern Irrigation<br />
Technologies: For Smallholders in<br />
Developing Countries. Intermediate<br />
Technology Publications In Association<br />
with HR WALLING FORD.<br />
Cotula, Lorenzo (2006).Land and <strong>Water</strong><br />
Right in the Sahel: Tenure Challenges <strong>of</strong><br />
Improving Access to <strong>Water</strong> for<br />
Agriculture. Sida and FAO.<br />
CRDA (1994). Follow-Up Workshop on<br />
Small Scale Irrigation Schemes. Addis<br />
Ababa.<br />
Darout Gum’a (2004). “The Socio-Cultural<br />
Aspects <strong>of</strong> Irrigation <strong>Management</strong>: The<br />
Case <strong>of</strong> Two Communities- Based Small<br />
Scale Irrigation Schemes in the Upper<br />
Tekeze. Basin, Tigray Region.” MA<br />
Thesis. Addis Ababa. AAU.<br />
Dejene Aredo (1994). Female- Headed<br />
Households in Two Contrasting Regions<br />
in Ethiopia: Access to and <strong>Management</strong><br />
<strong>of</strong> Resources. Ethiopian Journal <strong>of</strong><br />
Development Research 16 (1): 1-16.<br />
Retrieved from http://www.<br />
Ilri.org/data/livelihood/proceedings/pape<br />
rs/4Dejene.htm.<br />
Dejene Negassa (2001). “Access to Resource<br />
Strategies and Changing Household<br />
Organization: A Case from Kamme<br />
Village, Bate, Oromia Zone <strong>of</strong> Amhara<br />
Region.” MA Thesis. Addis Ababa.<br />
Addis Ababa University.<br />
Dessalegn Rahmato (1999). <strong>Water</strong> Resource<br />
Development in Ethiopia: Issues <strong>of</strong><br />
Sustainability and Participation. Forum<br />
for Social Studies. Addis Ababa.<br />
Ervin M. Alexander (2005). Applied<br />
Anthropology: Tools and Perspectives<br />
for Contemporary Practice. Second<br />
Edition. Pearson Education, Inc. Sydney.<br />
Ewnetu Akama (1987). “<strong>Water</strong> Law <strong>of</strong><br />
Ethiopia.” Submitted in Partial<br />
Fulfillment <strong>of</strong> the Requirement for the<br />
Degree <strong>of</strong> Bachelor <strong>of</strong> Law. Addis<br />
Ababa University. Addis Ababa.<br />
FAO (1978). Irrigation Practice and <strong>Water</strong><br />
<strong>Management</strong>. Rome. Italy.<br />
FAO (1990). National Irrigation Policy and<br />
Strategy Workshop: Discussion Paper.<br />
Office <strong>of</strong> the National Committee for<br />
Central Planning.<br />
FAO (2005). FAD’s Information System on<br />
<strong>Water</strong> and Agriculture: Land and <strong>Water</strong><br />
Development Division.<br />
Fuller, Chris (1994). Legal Anthropology,<br />
Legal Pluralism and Legal Thought.<br />
London: LSE Research Online.<br />
Available<br />
at:http://eprints.lse.ac.uk/archive/000005<br />
38<br />
Gulliver, P.H. (1979). Disputes and<br />
Negotiations: A Cross-Cultural<br />
Perspective. Academic.<br />
Havet, Jacques (1978). Main Trends <strong>of</strong><br />
Research in the Social and Human<br />
Sciences. Part Two/Volume Two: Legal<br />
Science/Philosophy. UNESCO, Place de<br />
Fontenoy, Paris. New York.<br />
ILRI (2006). People, Live Stock and the<br />
Environment: Sustaining <strong>Water</strong> and<br />
Nutrient Productivity. Community Based<br />
Irrigation <strong>Management</strong> in Ethiopia:<br />
Strategies to Enhance Health, Livestock,<br />
and Crop Production and Natural<br />
Resource <strong>Management</strong>.<br />
Indris <strong>Water</strong> Users Association. “Irrigation<br />
<strong>Water</strong> Use and <strong>Management</strong> Manual <strong>of</strong><br />
Indris <strong>Water</strong> Users Association”.<br />
Undated.<br />
Katharina, Wallner (2006). “Field Parameter<br />
Evaluation to Support Environmental<br />
Impact Analysis in Ethiopia”. A Thesis<br />
Submitted to the University <strong>of</strong> Natural<br />
Resources and Applied Live Sciences<br />
(Vienna), <strong>Institute</strong> <strong>of</strong> Hydraulics and<br />
Rural <strong>Water</strong> <strong>Management</strong>, in Partial<br />
Fulfillment <strong>of</strong> the Requirements for the<br />
Degree “Diplomingeniever”. ILRI.<br />
Kerealem Salilih (2007). “Irrigation<br />
<strong>Management</strong> and its Contribution in<br />
Reducing Households’ Socio-Economic<br />
Poverty: The Case <strong>of</strong> Two Small-Scale<br />
339
Irrigation Schemes in Blue Nile Basin <strong>of</strong><br />
Amhara National Regional State”. MA<br />
Thesis. Addis Ababa University.<br />
Keyes, G. Conard and Ward, Jim J. (1985).<br />
Development and <strong>Management</strong> Aspects<br />
<strong>of</strong> Irrigation and Drainage Systems. By<br />
the American Society <strong>of</strong> Civil Engineers.<br />
Lakew Birke (1970). The Impact <strong>of</strong> Dogali<br />
Irrigation Project on the National Income<br />
<strong>of</strong> Ethiopia. PH.D Dissertation. The<br />
Ohio State University.<br />
Lemma Dinku (2004). “Smallholders’<br />
Irrigation Practices and Issues <strong>of</strong><br />
Community <strong>Management</strong>: The Case <strong>of</strong><br />
Two Irrigation Systems in Eastern<br />
Oromia, Ethiopia.” MA Thesis. Addis<br />
Ababa University.<br />
Marshall,Catherine and Rossman, B.<br />
Gretchen (1995). Designing Qualitative<br />
Research. Second Edition. Sage<br />
Publications, Inc.Thousand Oaks,<br />
London, New Delhi.<br />
McCornick, G. Peter and Seleshi Bekele<br />
(2004). <strong>Water</strong> Use Rights in Ethiopia –<br />
An Overview. <strong>Water</strong> for Socio-economic<br />
Transformation Forum, October 25-27,<br />
MoWR, Addis Ababa, Ethiopia.<br />
Meinzen-Dick, Ruth and Bakker, Margaretha<br />
(2001). <strong>Water</strong> Rights and Multiple <strong>Water</strong><br />
Uses. Framework and Application to<br />
Kirindi Oya Irrigation System in Sri<br />
Lanaka. Kluwer Academic Publishers.<br />
Printed in the Netherlands.<br />
Meinzen-Dick, Ruth and Letica, Nkonya<br />
(2005). Understanding Legal Pluralism<br />
in <strong>Water</strong> Rights: Lessons from Africa<br />
and Asia. <strong>International</strong> Workshop on<br />
‘African <strong>Water</strong> Laws: Plural Legislative<br />
Frameworks for Rural <strong>Water</strong><br />
<strong>Management</strong> in Africa’, 26-28 January.<br />
Johannesburg, South Africa.<br />
Meinzen-Dick, S. Ruth and Rajendra,<br />
Pradhan (2006). Legal Pluralism and<br />
Dynamic Property Rights. CGIAR<br />
System Wide Program on Collective<br />
Action and Property Rights. <strong>International</strong><br />
Food Policy Research <strong>Institute</strong>.<br />
Washington, D.C.<br />
Melesse Getu (1994). ‘Tsemako Women’s<br />
Roles and Status in Agro-Pastoral<br />
Production’. MA Thesis. Addis Ababa<br />
University. Addis Ababa.<br />
Michael, A.M (1978). Irrigation: Theories<br />
and Practices. New Delhi: Vikas<br />
Publishing House.<br />
Ministry <strong>of</strong> <strong>Water</strong> Resources (1999).<br />
Ethiopian <strong>Water</strong> Resources <strong>Management</strong><br />
Policy. The Federal Democratic<br />
Republic <strong>of</strong> Ethiopia. BERHANENA<br />
SELAM PRINTING ENTERPRISE.<br />
Ministry <strong>of</strong> Education (2002). “Agricultural<br />
Production Practices, Opportunities,<br />
Constraints and Intervention Options in<br />
Ambo Wereda (West Shewa Zone-<br />
Oromiya Region)”. Ambo College <strong>of</strong><br />
Agriculture.<br />
Mokonnen Cherinet (1992). "Socio-<br />
Economic and Environmental Impacts <strong>of</strong><br />
Irrigation: The Case <strong>of</strong> Ziway State<br />
Farm. MA Thesis. Addis Ababa. AAU.<br />
National Research Council (1991).Toward<br />
Sustainability: Soil and <strong>Water</strong> Research<br />
Priorities for Developing Countries.<br />
National Academy Press. Washington,<br />
D.C.<br />
Nigussie Taffesse (2002). “The Role <strong>of</strong><br />
Irrigation Development in Enhancing<br />
Household Food Security: A Case <strong>of</strong><br />
Three Small Scale Irrigation Schemes in<br />
Southern Nations, Nationalities and<br />
Peoples’ Region.” MA Thesis. Addis<br />
Ababa University. Addis Ababa.<br />
Oromia Irrigation Development Authority<br />
(1991). Megeleta Oromia. Proclamation<br />
No. 30/1999. Oromia Regional State<br />
Irrigation Development Authority<br />
Establishment Proclamation. 7th Year,<br />
No. 4. Finfine.<br />
Pant,Niranjan (1984). Productivity and<br />
Equity in Irrigation Systems. Grini<br />
<strong>Institute</strong> <strong>of</strong> Development Studies. Ashish<br />
Publishing House, Punjabi, Bagh, New<br />
Delhi.<br />
Pereira, L.Santos and Gowing, John<br />
(1998).<strong>Water</strong> and The Environment:<br />
Innovation Issues in Irrigation and<br />
Drainage. Great Britain. Cornwall.<br />
Punima, B.C. and Lal, B.B. Pande (1992).<br />
Irrigation and <strong>Water</strong> Power Engineering.<br />
Twelfth Edition. Laxmi Publications<br />
PVT.LTD. New Delhi.<br />
Rathgeber, Eva (2003). Dry Taps… Gender<br />
and Poverty in <strong>Water</strong> Resources<br />
<strong>Management</strong>.FAO.RetrievedFromhttp://<br />
www.fao.org/docrep/005/AC855E/ac<br />
855e02.htm.<br />
Rowland, J. R. J. (1993). Dry Land Farming<br />
In Africa. Macmillan Education LTD.<br />
Sandra, Postel (1992). Last Oasis: Facing<br />
<strong>Water</strong> Scarcity. W.W. Norton and<br />
Company. New York, London.<br />
Scoones, Ian and Wolmer, William (2003).<br />
“Introduction: Livelihoods in Crisis,<br />
340
Challenges for Rural Development in<br />
Southern Africa”. Edited in “Livelihoods<br />
in Crisis? New Perspectives on<br />
Governance and Rural Development in<br />
Southern Africa”. <strong>Institute</strong> <strong>of</strong><br />
Development Studies, Vol. 34. No 3.<br />
IDS III Bulletin.<br />
Seid Yassin (2002). “Small- Scale Irrigation<br />
and Household Food Security: A Case<br />
Study <strong>of</strong> Three Irrigation Schemes in<br />
Guba Lafto Woreda <strong>of</strong> North Wollo<br />
Zone, Amhara Region.” MA Thesis.<br />
Addis Ababa University. Addis Ababa.<br />
Shimelis Dejene (2006). “Institutions,<br />
<strong>Management</strong>, and Challenges <strong>of</strong> Small-<br />
Scale Irrigation Systems in Ethiopia: A<br />
Case Study <strong>of</strong> Gibe Lemu and Gambela<br />
Terre in Western Oromiya”. MA Thesis.<br />
Addis Ababa University.<br />
Throne and Peterson (1977) Irrigated Soils;<br />
Their Fertility and <strong>Management</strong>. Second<br />
Edition. Tata McGraw-Hill Publishing<br />
Company LTD. New Delhi.<br />
Toke Kutaye Econmoic Planning and<br />
Development Department (1999).<br />
“Economic Planning and Development<br />
Document <strong>of</strong> Toke Kutaye District.”<br />
Toke Kutaye Agricultural Desk (1999).<br />
“Strategic Planning and <strong>Management</strong><br />
Document <strong>of</strong> Toke Kutaye Agricultural<br />
Desk, 2002-2005”.<br />
Tsegaye Kassa (1991). “Small Scale<br />
Irrigation Schemes in Mendoyu and<br />
Goro Awrajas, Bale region, Ethiopia.”<br />
MA Thesis. Addis Ababa. AAU.<br />
Turral, Hugh (1998). Hydro Logic? Reforms<br />
in <strong>Water</strong> Resource <strong>Management</strong> in<br />
Developed Countries With Major<br />
Agricultural water Use: Lessons for<br />
Developing Nations. Over Seas<br />
Development <strong>Institute</strong>.<br />
Vermillion, L. Douglas (2000). <strong>Water</strong> Rights<br />
in the State <strong>of</strong> Nature: Emergent<br />
Expectations in an Indonesian<br />
Settlement. Edited in “Negotiating <strong>Water</strong><br />
Rights”. Edited by Bruns and Meinzen-<br />
Dick. <strong>International</strong> Food Policy Research<br />
<strong>Institute</strong>.<br />
Vinent, Linden (1995): Hill Irrigation: <strong>Water</strong><br />
and Development in Mountain<br />
Agriculture. Intermediate Technology<br />
Publication.<br />
Woldeab Teshome (2003). Irrigation<br />
Practices, State Intervention and<br />
Farmers’ Life - Worlds in Drought –<br />
Prone Tigray, Ethiopia. Wageningen,<br />
The Netherlands.<br />
World Bank (1998). Planning the<br />
<strong>Management</strong>, Operation and<br />
Maintenance <strong>of</strong> Irrigation and Drainage<br />
Systems: A Guide for the Preparation <strong>of</strong><br />
Strategies and Manuals. <strong>International</strong><br />
Commission on Irrigation and Drainage.<br />
Washington, D.C.<br />
Yacob Arseno (2002). Conflict <strong>Management</strong><br />
over <strong>Water</strong> Rights in Ethiopia: The Case<br />
<strong>of</strong> Waiyto Valley in Southern Ethiopia.<br />
Edited in “Transformation <strong>of</strong> Resource<br />
Conflicts: Approach and Instruments”.<br />
By Baechler, Spillmann and Suliman.<br />
Peter Lang Ag Bern, European<br />
Academic Publishers. Printed in<br />
Germany.<br />
Zewedie Abate (1994). <strong>Water</strong> Resources<br />
Development in Ethiopia: An Evaluation<br />
<strong>of</strong> Present Experience and Future<br />
Planning Concepts. A <strong>Management</strong><br />
Method for Analyzing a Key Resource in<br />
Nation’s Development. Ithaca Press,<br />
Readings.<br />
341
Technical and Institutional Evaluation <strong>of</strong> Geray Irrigation Scheme in<br />
West Gojjam Zone, Amhara Region<br />
Gashaye Checkol and Tena Alamirew<br />
Haramaya University<br />
gashayechek@yahoo.com<br />
Abstract<br />
The technical and institutional performance<br />
evaluation <strong>of</strong> Geray Irrigation Scheme was<br />
made in order to identify management<br />
practices for implementation to improve the<br />
system operation and the general health <strong>of</strong><br />
the irrigation system. The evaluation was<br />
made by looking into the selected<br />
performance indicators such as conveyance<br />
efficiency, application efficiency, water<br />
delivery performance, and maintenance<br />
indicators. The availability <strong>of</strong> institutional<br />
and support services were also investigated<br />
through a questionnaire administered to<br />
beneficiary farmers and other stakeholders.<br />
The results obtained showed that the main<br />
and tertiary canal conveyance efficiencies<br />
were 92 and 82 percents respectively. Many<br />
<strong>of</strong> the secondary and tertiary canals are<br />
poorly maintained and many <strong>of</strong> the<br />
structures are dysfunctional. Application<br />
efficiency monitored on three farmers’ plot<br />
located at different ends <strong>of</strong> a given<br />
secondary canal ranges from 44 to 57<br />
percent. <strong>Water</strong> delivery performance was<br />
only 71 percent showing a very substantial<br />
reduction from the design <strong>of</strong> the canal<br />
capacity. Maintenance indicator evaluated in<br />
terms <strong>of</strong> water level change (31.9%) and<br />
effectiveness <strong>of</strong> the infrastructures showed<br />
that the scheme management was in a very<br />
poor shape. Dependability <strong>of</strong> the scheme<br />
evaluated in terms <strong>of</strong> duration and irrigation<br />
interval showed that the scheme is<br />
performing below the intended level. The 47<br />
percent <strong>of</strong> the land initially planned for<br />
development is currently under irrigation<br />
while there is no change in the water supply<br />
indicating that the sustainability <strong>of</strong> the<br />
scheme is in doubt. The cooperative support<br />
services that had been rendered to the<br />
beneficiaries in the past four years were<br />
found to be minimal. Moreover, there were<br />
few indicators that show the production was<br />
market oriented. The evaluation clearly<br />
revealed the fact that conflict resolution<br />
remains to be the duty <strong>of</strong> the Kebele<br />
authorities and WUA has no legal right to<br />
enforce its bylaws. In conclusion, the overall<br />
technical adequacy <strong>of</strong> the scheme is rated<br />
very poor requiring tremendous mobilization<br />
<strong>of</strong> the community to sustainably manage it.<br />
Proper institutional setup needs to be in<br />
place, and WUA needs to be empowered<br />
more in order to enforce its by-laws.<br />
1. Introduction<br />
Ethiopia is labeled as the ‘water tower <strong>of</strong><br />
Africa’. Its geographical location and<br />
endowment with favorable climate provide a<br />
relatively higher amount <strong>of</strong> rainfall in the<br />
continent. Preliminary studies and<br />
pr<strong>of</strong>essional estimates put the nation’s<br />
annual surface run<strong>of</strong>f to 122 billion m 3 ,<br />
groundwater potential to 2.6 billion m 3 and<br />
the average rainfall <strong>of</strong> 1090 mm (Daniel,<br />
2007). However, the annual amount <strong>of</strong><br />
water resources in Ethiopia gives the wrong<br />
impression that ‘rainfall is adequate for crop<br />
production’. Rainfall distribution is<br />
extremely uneven both spatially and<br />
temporally.<br />
As the capacity <strong>of</strong> the country to store the<br />
excess water is in excess is very poor, most<br />
342
<strong>of</strong> the water flows out carried by<br />
transboundary rivers to neighboring<br />
countries. Consequently, the country suffers<br />
from water scarcity triggered hazards, such<br />
as repeated crop failure, food insecurity,<br />
drought and famine with increased<br />
frequency. About 52 percent <strong>of</strong> the<br />
population or 214 districts <strong>of</strong> the country are<br />
known to be food insecure. The population<br />
requiring food assistance is increasing in<br />
absolute terms. In 2006, for instance, about<br />
15 million people were food insecure mainly<br />
because <strong>of</strong> rainfall variation (Daniel, 2007).<br />
To address the challenges <strong>of</strong> food insecurity<br />
and associated poverty, improving<br />
agricultural productivity occupies a central<br />
place in the ‘Agricultural Development Lead<br />
Industrialization (ADLI) strategy <strong>of</strong> the<br />
present Ethiopian government. Fighting<br />
poverty and reducing food deficiency are at<br />
the heart <strong>of</strong> ADLI. The government has<br />
committed itself to the reduction <strong>of</strong> poverty<br />
by half, through the endorsement <strong>of</strong> the<br />
Millennium Development Goals (MDG).<br />
Irrigation development is one <strong>of</strong> the pursued<br />
strategic interventions in this regard. The<br />
government now recognizes that it is<br />
implausible to expect any great degree <strong>of</strong><br />
agricultural production intensification under<br />
rainfed dryland farming system. Hence,<br />
tremendous efforts are underway to promote<br />
large, medium and small scale irrigations<br />
through huge financial and labor<br />
investments.<br />
Despite the endowment <strong>of</strong> Ethiopia with<br />
huge (3.5 million ha) irrigable land, the area<br />
under irrigation development is only five<br />
percent (195 thousand ha). This shows that<br />
water resources have made little<br />
contribution towards the development <strong>of</strong><br />
agricultural sector in particular and the<br />
community in general to date.<br />
In the last few years, heavy investments<br />
have been made to harness the water<br />
resources <strong>of</strong> the country towards irrigation<br />
development. The ongoing Tendaho,<br />
Kessem, Gode, Koga irrigation projects over<br />
and above huge work on rainwater<br />
harvesting pond construction that has been<br />
aggressively pursued all over the country are<br />
evidences for the government’s part and<br />
commitment to irrigation development.<br />
However, given the dismal and undesirable<br />
experience on the performance <strong>of</strong> the<br />
irrigation schemes developed earlier, there is<br />
no guarantee that the new schemes will<br />
deliver the anticipated benefits.<br />
Given the anticipated importance <strong>of</strong><br />
irrigation in food security and poverty<br />
reduction and the huge investments<br />
committed on irrigation infrastructure, it is<br />
imperative that the irrigation sector is<br />
efficient and effective in yielding desired<br />
socioeconomic returns. However, the<br />
performances <strong>of</strong> many <strong>of</strong> the existing<br />
irrigation schemes have been far from<br />
satisfactory. Several <strong>of</strong> the previously<br />
constructed irrigation projects are totally or<br />
partially abandoned. Most have not reached<br />
their planned levels <strong>of</strong> productivities and<br />
many are not financially or technically<br />
sustainable in their present forms.<br />
For irrigation schemes to be sustainable,<br />
mutual supportiveness <strong>of</strong> irrigation hardware<br />
(irrigation infrastructure) and s<strong>of</strong>tware<br />
(institutions) are vital. Mutual<br />
supportiveness is ensured when the<br />
hardware is cost and labor efficient, easy to<br />
operate and robust, and yielding predictable<br />
results. The s<strong>of</strong>tware is characterized by<br />
individual/collective interest and<br />
management skill embodied in a lean<br />
organization <strong>of</strong> water users besides adequate<br />
support services.<br />
The paradox <strong>of</strong> big expectation from<br />
irrigation development to alleviate food<br />
insecurity and rural poverty versus inability<br />
to sustainably utilize developed schemes<br />
calls for detail scrutiny <strong>of</strong> the relative<br />
contribution <strong>of</strong> prevailing technical and<br />
institutional problems <strong>of</strong> failed schemes.<br />
One such failed scheme selected for this<br />
study is Geray Irrigation Scheme. This<br />
scheme, with its source <strong>of</strong> irrigation is <strong>of</strong><br />
excellent quality spring water with virtually<br />
zero silt, was expected to operate with<br />
343
minimum technical problem. However the<br />
scheme has not been able to live up to the<br />
expectations. Hence, this study was made to<br />
evaluate the contribution <strong>of</strong> the institution<br />
related problems for its technical<br />
underperformance.<br />
2. Data and Methodology<br />
2.1. Location <strong>of</strong> the Study Site<br />
Geray irrigation scheme is located 10’ 60’’<br />
latitude and 37’26’’ longitude in<br />
Arbaetuensisa Keble located 5 km from<br />
Finoteselam in West Gojam zone.<br />
Finoteselam is located 380 km from Addis<br />
Ababa on the main road to Bahir Dar.<br />
Construction <strong>of</strong> the solid masonry diversion<br />
started in 1971 and was completed in 1972.<br />
Construction <strong>of</strong> canals and other structures<br />
continued slowly and reports indicate that<br />
the scheme was commissioned in 1984.<br />
2.2. Technical Performance Evaluation<br />
Technical performance indicators monitored<br />
in this study included the measurement <strong>of</strong><br />
conveyance efficiency <strong>of</strong> the main canal and<br />
tertiary canals, application efficiency and<br />
water delivery performance.<br />
Conveyance efficiency – This was<br />
estimated by measuring inflowing and out<br />
flowing water along the selected canal<br />
lengths (Boss, 1997)<br />
Conveyanceefficiency<br />
water flowing in the canal<br />
=<br />
water flowing out <strong>of</strong> the canal<br />
2.1<br />
Application efficiency: The ratio <strong>of</strong> the<br />
depth <strong>of</strong> water added to the root zone to the<br />
depth <strong>of</strong> water applied to the field was<br />
measured from three farmer fields that were<br />
growing potato. The criteria for selecting<br />
farms were their location associated with the<br />
reach <strong>of</strong> the canal, i.e. top, middle and lower<br />
end <strong>of</strong> the canal. The three plots <strong>of</strong> farms<br />
were chosen among those that served on the<br />
same secondary canal at the head, middle<br />
and tail reaches with the presumption that<br />
there will be differences in the availability<br />
<strong>of</strong> water among these categories <strong>of</strong><br />
irrigators.<br />
Application efficiency (Ea)<br />
Depth <strong>of</strong> water added to the root zone<br />
=<br />
Depth <strong>of</strong> water applied to the field<br />
2.2<br />
The water delivery performance<br />
indicator: This was calculated by<br />
measuring the actually delivered volume <strong>of</strong><br />
water to the intended (design) volume water<br />
to be delivered.<br />
<strong>Water</strong> Delivery Performance<br />
Actually delivered volume <strong>of</strong> water<br />
=<br />
Intended volume <strong>of</strong> water to be delivered<br />
2.3<br />
2.3. Maintenance Indicators<br />
Proper maintenance enables the keeping <strong>of</strong><br />
water control infrastructure in good working<br />
condition so that the design water level is<br />
maintained. The change in head (level)<br />
over structures in irrigation canals is the<br />
single most important factor disrupting the<br />
intended delivery <strong>of</strong> irrigation water. The<br />
maintenance indicators are evaluated by the<br />
following hydraulic performance indicators<br />
(Boss, 1997).<br />
a. The relative change <strong>of</strong> water level<br />
(RCWL) - this was computed by<br />
taking the actual water level depth<br />
from the canal and comparing it with<br />
design value at the same position in<br />
the main canal, i.e. changes <strong>of</strong> level to<br />
the intended level.<br />
Re lative<br />
=<br />
Change<br />
Intended<br />
Change<br />
<strong>of</strong><br />
Level<br />
Level<br />
<strong>of</strong><br />
<strong>Water</strong><br />
level<br />
344
2.4<br />
b. Effectiveness <strong>of</strong> infrastructure –<br />
this measures the ratio <strong>of</strong> the<br />
number <strong>of</strong> functioning structures to<br />
the total number <strong>of</strong> structures<br />
initially installed.<br />
Effectivity <strong>of</strong> Infrastructure<br />
Number <strong>of</strong> functioning structures<br />
=<br />
Total number <strong>of</strong> structures<br />
2.5<br />
c. Dependability <strong>of</strong> duration – this is<br />
estimated as the ratio <strong>of</strong> the duration<br />
and the irrigation interval <strong>of</strong> water<br />
delivery compared to the plan.<br />
Dependability <strong>of</strong> duration<br />
Actual duration <strong>of</strong> water delivery<br />
=<br />
Intended duration <strong>of</strong> water delivery<br />
2.6<br />
d. Sustainability – is measured as the<br />
ratio <strong>of</strong> current area under irrigation<br />
to the initial total irrigable area.<br />
Sustainability <strong>of</strong> Irrigable Area<br />
Current irrigable area<br />
=<br />
Initial total irrigable Area<br />
2.7<br />
2.4. The Irrigation Institution<br />
Performance Assessment<br />
By institution here refers to social<br />
arrangements that shape and regulate human<br />
behavior and have some degree <strong>of</strong><br />
permanency and transcending individual<br />
human lives and intentions. In this survey,<br />
the status <strong>of</strong> irrigation institution and<br />
availability <strong>of</strong> support services were<br />
assessed through questionnaires<br />
administered to the different stakeholders <strong>of</strong><br />
the scheme. Focus group discussions were<br />
made with beneficiary farmers, elders, water<br />
user cooperative (WUC) management, the<br />
Kebele Council, and Cooperative Promotion<br />
Staff <strong>of</strong> Agriculture and Rural Development<br />
Office. Samples chosen include 13 WUC<br />
members, seven WUC executives, five<br />
Kebele Council representative, 10 irrigable<br />
land owners who are not members <strong>of</strong> the<br />
WUC, three farmers owning irrigable land<br />
but not rainfed, three farmers that don’t<br />
possess but are renting irrigable land, four<br />
elderly farmers who participated during the<br />
weir.<br />
3. Major Findings and Discussion<br />
3.1 Characterization <strong>of</strong> the scheme<br />
Reports indicate that Geray Irrigation<br />
scheme was <strong>of</strong>ficially commissioned in<br />
1984 upon finalizing the construction <strong>of</strong><br />
tertiary canals for the four <strong>of</strong> the seven<br />
secondary canals by the then Irrigation<br />
Development Department, while the head<br />
work was finished in 1974 by the Ministry<br />
<strong>of</strong> Agriculture. The project was government<br />
initiated in an effort to build the capacity <strong>of</strong><br />
the then Arbaetuenissia Producers<br />
Cooperative.<br />
The net irrigable area <strong>of</strong> the scheme was 618<br />
ha. However, the actual area developed for<br />
irrigation was 454 ha. The main canal was<br />
9.8 km long. The number <strong>of</strong> secondary<br />
canals was nine with a total length <strong>of</strong> 12.5<br />
km while that <strong>of</strong> the tertiary canals was over<br />
52 km long in total. The weir had 105 m<br />
crest length and 4 m height.<br />
The numbers <strong>of</strong> beneficiary households that<br />
own irrigable land were 790 out <strong>of</strong> which<br />
400 were members <strong>of</strong> the WUA and the<br />
remaining 390 were non-members.<br />
However, during the study period (2006),<br />
the area under irrigation was 215 ha only.<br />
The number <strong>of</strong> potential beneficiaries <strong>of</strong> the<br />
scheme is estimated to be 3950 people. The<br />
lowest average river discharge was reported<br />
to be 1.9 m 3 /s. The maximum main canal<br />
design discharge with the gate fully opened<br />
was 1.54 m 3 /s. During this study, the actual<br />
flow measured when the gate was fully<br />
opened was 1.1 m 3 /s.<br />
345
During this survey, the majority <strong>of</strong> the drop<br />
and other structures were dysfunctional.<br />
There are a number <strong>of</strong> illegal water<br />
abstraction and canal breaching. Majority <strong>of</strong><br />
installed tertiary canals were not operational.<br />
Farmers practice furrow irrigation. The<br />
furrow lengths range from as long as 54 m<br />
to as short as 8 m. There is no restriction for<br />
the type <strong>of</strong> crop one grows, but 75% <strong>of</strong> the<br />
farmers grow potato.<br />
3.2 Technical Efficiencies<br />
Conveyance and application efficiencies<br />
The average main and tertiary canal<br />
conveyance efficiencies were measured as<br />
92 and 81%. It was observed during the field<br />
work that water was leaking on places where<br />
the canal was breached, flow in canal<br />
network was not uniform, canals were<br />
heavily vegetated, water flows over the<br />
banks <strong>of</strong> the canal.<br />
The application efficiencies measured on the<br />
three farms selected for this study is<br />
presented in <strong>Table</strong> 1. The values obtained<br />
were close to each other and low, but not<br />
very far from that expected in surface<br />
irrigation system.<br />
<strong>Table</strong> 1. Application Efficiency<br />
Farm<br />
Applied Depth Stored Depth Application<br />
(mm) (mm) Efficiency (Ea %)<br />
Head end <strong>of</strong> the canal 215.5 123.7 57.39<br />
Middle <strong>of</strong> the canal 188.4 83.7 44.41<br />
Lower end <strong>of</strong> canal 123.5 60.9 49.33<br />
<strong>Water</strong> Delivery Performance<br />
The water delivery performance calculated<br />
as the ratio <strong>of</strong> actually delivered (1.1 m 3 /s)<br />
water to the intended volume <strong>of</strong> water (1.54<br />
m 3 /s) was 71 %. A 29% reduction in the<br />
capacity <strong>of</strong> the system was large. The effect<br />
<strong>of</strong> this reduction in the carrying capacity <strong>of</strong><br />
the main canal was reflected in reduced area<br />
actually irrigated.<br />
The Relative Change <strong>of</strong> <strong>Water</strong> Level<br />
As per the design document, the main canal<br />
carries 1.54 m 3 /s discharge when the height<br />
<strong>of</strong> water table is 0.47 m; whereas the height<br />
<strong>of</strong> water table measured was 0.32 m when<br />
the actual discharge was 1.1 m 3 /s, resulting<br />
in a 32% water level change. This showed<br />
that the intended water level in the main<br />
canal was achieved; consequently less<br />
discharge was delivered to the farms forcing<br />
farmers either to increase the irrigation time<br />
or decrease the irrigated area.<br />
Effectiveness <strong>of</strong> Infrastructure<br />
As per the design document, the total<br />
number <strong>of</strong> different structures constructed<br />
was 111, but only 74 <strong>of</strong> them were<br />
functional. As a result the value <strong>of</strong><br />
effectiveness <strong>of</strong> infrastructure was reckoned<br />
to be 67%. Nearly one-third <strong>of</strong> the<br />
structures had been destroyed. Severe<br />
mutilation <strong>of</strong> water control structures for<br />
their iron bars was in evidence.<br />
Dependability <strong>of</strong> Duration<br />
The intended duration <strong>of</strong> water delivery as<br />
per the design document was 10 hours<br />
irrigation time per day. However, farmers<br />
were irrigating up to 18 hours a day. The<br />
calculated dependability duration was 180%<br />
showing that it required more time than<br />
anticipated to irrigate the fields.<br />
From all the indicators monitored in this<br />
survey, the scheme’s technical performance<br />
346
was sub-optimal in all standards, and<br />
requires urgent maintenance.<br />
3.2 Institutional and Support Services<br />
3.2.1 Scheme <strong>Management</strong><br />
The scheme management since it was<br />
commissioned 27 years ago has been<br />
changing. Earlier in the previous<br />
government, it was managed by producer<br />
cooperatives. But when the cooperatives<br />
disbanded, the local government through the<br />
Agriculture and Rural Development Office<br />
with all its inefficiencies tried to manage the<br />
scheme. Later on, however, knowing that it<br />
can no longer effectively manage it, it<br />
crafted farmers’ cooperative and passed the<br />
management without proper consultation<br />
with all stakeholders.<br />
For the past four years, Geray Irrigation<br />
Scheme has been administered by this water<br />
user cooperatives (WUC) registered under<br />
Amhara Regional Cooperatives Promotion<br />
Agency. The cooperative adopted a generic<br />
bylaw drafted by the Agency. The bylaw<br />
indicated that the association is responsible<br />
for water distribution, system maintenance,<br />
collection <strong>of</strong> water fees, soliciting for input<br />
supplies, credit facilitation, planning and<br />
monitoring, etc. But none <strong>of</strong> these<br />
responsibilities have been executed as<br />
desired for various reasons.<br />
3.2.2. Performance <strong>of</strong> the <strong>Water</strong> User<br />
Cooperative<br />
Institutional arrangement on irrigation is<br />
required to overcome problems relating to<br />
irrigation water as a common property<br />
resource, to provide incentive to members<br />
disincentive for free riding and shirking. As<br />
mentioned earlier, the WUA was provided<br />
with a generic bylaws binding on all<br />
cooperative members. The first challenge in<br />
the functioning <strong>of</strong> the cooperative was the<br />
principle clash in which cooperatives were<br />
organized – i.e., membership ought to be<br />
fully on voluntary basis. When farmers<br />
share the same irrigation water resource,<br />
organizing some <strong>of</strong> them under the<br />
cooperative umbrella while leaving others as<br />
non-members seriously challenge to the<br />
effectiveness <strong>of</strong> the cooperative in water<br />
management. This is against one <strong>of</strong> the<br />
principles <strong>of</strong> enduring self governing<br />
institutions (Ostrom, 1992 as cited in Sarker<br />
and Itoh, 2001). Moreover, the cooperative<br />
manual lacks detailed operational rules<br />
(such as entry, allocation, penalty, input<br />
rules) and organizational structure specific<br />
to the irrigation scheme.<br />
3.2.3. Operation and Maintenance<br />
Problems<br />
As per the response <strong>of</strong> the farmers<br />
interviewed in the study area, some <strong>of</strong> the<br />
major problems that the farmers face include<br />
weir and canal leakage, and siltation <strong>of</strong><br />
canals. These were also in clear evidence<br />
during the survey. Although the<br />
maintenance <strong>of</strong> leaking weir may be beyond<br />
the capacity <strong>of</strong> framers in which case they<br />
may solicit the support <strong>of</strong> the local<br />
government, the canal maintenance should<br />
be the duty <strong>of</strong> the cooperative. However, the<br />
status <strong>of</strong> the secondary canals and their<br />
water control structures showed that no<br />
proper maintenance has been carried out for<br />
a long time and the cooperative was not<br />
effectively shouldering the scheme<br />
management. The beneficiary farmers also<br />
acknowledged that the scheme was poorly<br />
maintained, and they attributed the problem<br />
to lack <strong>of</strong> fund for maintenance. It was,<br />
however, noted that farmers are neither<br />
contributing money for operation and<br />
maintenance nor do they pay for the<br />
irrigation water they use.<br />
3.2.4. Conflict and Conflict Resolution<br />
Mechanisms<br />
Conflict in the scheme both between and<br />
among the beneficiaries and the downstream<br />
farmers who are not served by the canal<br />
water was said to be rampant. Among the 45<br />
interviewed beneficiary farmers, 44<br />
acknowledged the presence <strong>of</strong> conflict. They<br />
347
attributed water shortage to be <strong>of</strong>ten times<br />
the cause <strong>of</strong> conflict. The survey also<br />
showed that there was no water sharing<br />
agreement between upstream and<br />
downstream users, and there was no equity<br />
in water distribution (<strong>Table</strong> 2)<br />
<strong>Table</strong> 2. Beneficiary farmers’ responses to conflict related questions<br />
Frequency Percent<br />
1. Have you ever come across a conflict between those living<br />
around the canal tertiary units and the downstream users?<br />
i. Yes 44 97.8<br />
ii. No 1 2.2<br />
2. What are the probable causes <strong>of</strong> the conflict?<br />
i. Unequal water distribution 4 8.9<br />
ii. Irrigation schedule disturbed 25 55.6<br />
iii. Scarcity <strong>of</strong> water 11 24.4<br />
iv. Both i and ii 5 11.1<br />
3. Is there a water sharing agreement among each <strong>of</strong> the branches?<br />
i. Yes 3 6.7<br />
ii. No 38 84.4<br />
iii. Have no information 4 8.9<br />
4. Is water equally available to all users in the scheme?<br />
i. Yes 2 4.4<br />
ii. No 42 93.3<br />
iii. No response 1 2.2<br />
5. Who are the actors in conflict resolution?<br />
i. WUA 4 8.9<br />
ii. Kebele council/social courts 11 24.4<br />
iii. Both i and ii 30 66.7<br />
The survey also showed that the majority <strong>of</strong><br />
the interviewed farmers (73%) had no<br />
confidence in the capacity <strong>of</strong> WUC<br />
management to resolve conflicts. In fact, it<br />
was learned that the major actor in conflict<br />
resolution was the Kebele Council and<br />
social courts. The problem with Kebele<br />
leadership and social courts in handling<br />
disputes was that the majority <strong>of</strong> them were<br />
not among irrigation beneficiaries. Hence,<br />
when WUC lodge complaints to the social<br />
courts, verdicts took a long time and the<br />
penalty was never proportionate to the<br />
<strong>of</strong>fence.<br />
In conclusion, the WUA is not empowered<br />
to take punitive action and enforce its bylaws.<br />
The majority <strong>of</strong> the water management<br />
problems revolve around the inability <strong>of</strong> the<br />
association to sanction <strong>of</strong>fenders. The<br />
tortuous legal processes in the judicial<br />
system and the lack <strong>of</strong> recognition <strong>of</strong> the<br />
cooperatives by-laws were the most serious<br />
challenges that the cooperatives were facing<br />
currently.<br />
3.3. Support Service<br />
3.3.1. Extension and Training<br />
Given the potential benefit that the scheme<br />
could provide to the beneficiary farmers and<br />
the local community, a qualified extension<br />
agent would have been imperative. It was,<br />
348
however, learned that farmers were not<br />
getting advice from an irrigation agronomist<br />
or from a qualified development agent.<br />
There were no organizations committed<br />
towards providing farmers with the needful<br />
training and extension services.<br />
<strong>Table</strong> 3. Response <strong>of</strong> farmers to the kind <strong>of</strong> support they get from the government<br />
What kind <strong>of</strong> support the scheme gets from the<br />
government now?<br />
Frequency<br />
Percent<br />
i Input supply 3 6.7<br />
ii Advice 13 28.9<br />
iii I to ii 6 13.3<br />
iv No support 10 22.2<br />
v Have no information 12 26.7<br />
Total 45<br />
3.3.2. Access to Market and Input<br />
Supplies<br />
The main Addis Ababa – Bahir Dar highway<br />
is only some 5 kms from the scheme. The<br />
status <strong>of</strong> dry weather road to the farms<br />
during the study period was fair. The zonal<br />
town, Finoteselam, is only some 7 km from<br />
the scheme. Market factor does not play a<br />
role in what and when to produce. When<br />
farmers were asked whether they have<br />
problem to sell their produce, their<br />
responses were that they don’t have market<br />
problem. However, when farmer was asked<br />
to explain why many beneficiary farmers<br />
grow only potatoes, the response he gave<br />
was:<br />
‘We grow potatoes because if we can’t sell<br />
them in Finoteselam market, we can dry<br />
them, store and use them for home<br />
consumption’.<br />
Drying potato to extend its shelf life was a<br />
useful technology farmers practice to keep<br />
produce when it is in excess. Therefore, it is<br />
evident that farmers are not producing for a<br />
serious market. No effort <strong>of</strong> farmers were<br />
observed in the study area to take advantage<br />
<strong>of</strong> soaring demand for vegetables either in<br />
nearby Bahir Dar nor Addis Ababa markets.<br />
The problem was identified to be the fact<br />
that a truck is required to transport to the<br />
markets at Bahir Dar and Addis Ababa.<br />
However, such facility is not available to the<br />
farmers. Trucks do not come to collect one<br />
farmers pick as it would be too small to fill a<br />
truck. In principle, the solution for this<br />
problem would be to organize farmers to<br />
jointly plan and produce for the market on a<br />
pre-negotiated price. If this happens, the<br />
produce would be large enough to hire a<br />
truck, and transport the produce where<br />
market is available.<br />
From the survey results (<strong>Table</strong> 4) shortage<br />
and/or unavailability <strong>of</strong> seeds was also cited<br />
as another problem for diversification <strong>of</strong><br />
crops under irrigation. This again showed<br />
that the cooperative was not discharging the<br />
fundamental cause for its formation, that is<br />
providing inputs and facilitating markets.<br />
349
<strong>Table</strong> 4. Causes for inability to diversify crop production<br />
What are the problems relating to diversifying<br />
Frequency Percent<br />
irrigated Agriculture?<br />
i. Scarcity <strong>of</strong> seeds 37 82.2<br />
ii. Plant diseases 0 0<br />
iii. Market availability 0 0<br />
iv. Lack <strong>of</strong> sufficient irrigable land 0 0<br />
v. Low market price for output 1 2.2<br />
vi. Items i, ii and iii above 2 4.4<br />
vii. Items i and ii above 2 4.4<br />
viii. No response 3 6.7<br />
Total 45<br />
3.4. Other Key Findings <strong>of</strong> the Survey<br />
From the focus group discussion held with<br />
beneficiary farmers and the community, the<br />
following important issues were captured:<br />
a. The WUC was not empowered to<br />
take administrative actions and<br />
enforce its by-laws. The social<br />
courts do not use the cooperative<br />
by-laws as valid instrument to<br />
sanction penalties. Farmers use local<br />
adage saying that the WUC<br />
management is a ‘Lion without<br />
teeth’.<br />
b. The penalties that the <strong>of</strong>fenders pay<br />
fail to be commensurate with the<br />
infraction to deter him or her from<br />
committing similar <strong>of</strong>fence in the<br />
future. Moreover, the penalties that<br />
the <strong>of</strong>fenders pay were deposited<br />
into Kebele’s account. Therefore,<br />
the WUC would benefit by taking<br />
an <strong>of</strong>fender into a lengthy legal<br />
battle.<br />
c. At the time <strong>of</strong> this survey, there was<br />
no development agent (DA)<br />
assigned to the scheme. Farmers<br />
reported that there was a DA with<br />
natural resource management<br />
background but he stayed only for<br />
less than one season. Hence, all the<br />
indications were that farmers were<br />
not benefiting from any technical<br />
backstopping.<br />
d. The scheme had been under<br />
management <strong>of</strong> the government<br />
authorities until some four years<br />
ago. Hence farmers did not feel that<br />
they own the water and the<br />
irrigation infrastructure. Farmers<br />
were uncertain <strong>of</strong> the land tenure<br />
arrangements. They reflected that<br />
the land they own today may be<br />
taken away by the government at<br />
any time for lease to investors. They<br />
tried to justify this worry by citing<br />
the 20 ha land leased to an investor<br />
in the middle <strong>of</strong> the scheme.<br />
e. There was no mutual understanding<br />
to forge equitable distribution <strong>of</strong><br />
irrigation water among all<br />
beneficiaries. Those located in the<br />
upstream end <strong>of</strong> the secondary canal<br />
could take as much water as they<br />
wish; consequently, not enough<br />
water reaches the downstream users.<br />
Hence, to avoid crop failure due to<br />
water supply interruption at critical<br />
growth stages, the farmers located in<br />
lower end <strong>of</strong> secondary canal prefer<br />
to rely on rainfed farming.<br />
f. Most tertiary and field canals<br />
constructed as raised canals have<br />
become dysfunctional to convey<br />
water as intended in the design. As<br />
per the design document, siphon<br />
was used to divert water from the<br />
canals to the furrows. But none <strong>of</strong><br />
the irrigators was practicing the<br />
350
same. Farmers were creating their<br />
own conveyance system bypassing<br />
developed canal and water control<br />
structures. Consequently, there was<br />
tremendous water loss when water<br />
was made to flow on temporary<br />
conveyance system.<br />
g. The responses to the question <strong>of</strong><br />
‘who owns the scheme?’ – the<br />
government or the community –<br />
were illusive and it was difficult to<br />
obtain a mutually agreed response.<br />
Although farmers felt that the head<br />
work, primary and secondary canals<br />
were the responsibilities <strong>of</strong><br />
government, they could not pin<br />
point any them. From the local<br />
governments end, those implicated<br />
in one way or the other are the<br />
Agriculture and Rural Development<br />
Office, Cooperatives Promotion<br />
Agency and <strong>Water</strong> Resource Office.<br />
h. There was no enough consultation<br />
with all the stakeholders before<br />
transferring the scheme<br />
management to the farmers. Hence<br />
farmers were uncertain <strong>of</strong> the<br />
government’s motive.<br />
3.5. Key Reflections Captured during the<br />
Discussions with the Staff Members <strong>of</strong><br />
Woreda Agriculture and Rural<br />
Development Division.<br />
1. The absence <strong>of</strong> specific roles that<br />
the <strong>of</strong>fices <strong>of</strong> agriculture, water,<br />
cooperative promotion agency<br />
should play has made none <strong>of</strong> them<br />
accountable for the poor<br />
performance <strong>of</strong> the scheme.<br />
2. Many beneficiary farmers own<br />
excess irrigable land than they can<br />
manage. Some farmers have even<br />
rainfed land outside the command<br />
area. Consequently, they do not<br />
have the capacity and the<br />
commitment to manage both<br />
irrigated and rainfed farms.<br />
Simultaneously, one alternative idea<br />
suggestion to solve this problem<br />
was to limit maximum irrigable land<br />
holding <strong>of</strong> a family. Thus providing<br />
access to as many farmers as<br />
possible.<br />
3. Level <strong>of</strong> awareness <strong>of</strong> farmers<br />
towards marketable and high value<br />
crop production was low. Farmers<br />
tend to be complacent with what<br />
they have and produce. They do not<br />
seem to be motivated towards<br />
market oriented production.<br />
4. The irrigation skill <strong>of</strong> farmers was<br />
below satisfactory. Farmers do not<br />
appreciate, protect and attempt to<br />
use water conveyance and control<br />
structures established during the<br />
irrigation development.<br />
5. Farmers were not paying for the<br />
provision <strong>of</strong> irrigation water.<br />
Moreover, no cost recovery attempt<br />
has been initiated.<br />
4. Conclusion<br />
The irrigation potential for Geray<br />
irrigation scheme to change the life <strong>of</strong><br />
the community is tremendous. It is<br />
endowed with excellent quality and<br />
quantity <strong>of</strong> irrigation water. The soil is<br />
highly suitable for irrigated agriculture.<br />
However, all the technical performance<br />
indicators showed that the scheme’s<br />
performance was far from satisfactory.<br />
Many <strong>of</strong> the water control structures<br />
have become dysfunctional. The<br />
underperformance <strong>of</strong> the scheme was<br />
attributed to extreme neglect and lack <strong>of</strong><br />
supervision. These it is concluded that<br />
the overall performance <strong>of</strong> the scheme<br />
was unsatisfactory.<br />
The neglect was mainly attributed to<br />
lack <strong>of</strong> ownership. Further, many years<br />
<strong>of</strong> inefficient state management in the<br />
absence <strong>of</strong> committed development<br />
agent took the major blame for the<br />
infrastructure damage. Moreover, the<br />
recent transfer <strong>of</strong> management to service<br />
cooperatives did not confirm to the<br />
principle <strong>of</strong> long-enduring irrigation<br />
institutions. The fact that not all<br />
irrigation beneficiary farmers are<br />
351
members <strong>of</strong> the cooperative which again<br />
shows that institute does have clearly<br />
defined boundary condition – another<br />
requirement for good irrigation<br />
institution.<br />
Successful traditional schemes not very<br />
far from Geray Irrigation Scheme have<br />
been perfectly functioning over 70 years<br />
using rudimentary irrigation structures<br />
and extensive annual maintenance<br />
requirements. Hence, there should not<br />
be any reason why this scheme should<br />
not have been successful provided that<br />
proper institution had been crafted right<br />
from the very beginning. The major<br />
problem identified during this study was<br />
the absence <strong>of</strong> functional institution to<br />
properly manage the scheme. The<br />
cooperatives association recently crafted<br />
has no power either to sanction penalties<br />
or enforce them. Under this scenario,<br />
efforts made by the government to<br />
rehabilitate the structure may not bring<br />
the desired changes in the life <strong>of</strong> the<br />
beneficiaries. Rather, the WUC needs to<br />
be reorganized and made effective.<br />
Uncertainties relating to land tenure<br />
need to be addressed at the earliest.<br />
Most importantly qualified development<br />
agent with irrigation agronomy<br />
background should be assigned to the<br />
scheme. Moreover, the DA should be<br />
given the responsibility to mobilize the<br />
community, following the major<br />
network rehabilitation skills.<br />
References<br />
Bitew Genet, 2005. Status <strong>of</strong> Small –Scale<br />
Irrigation Projects in Amahra Region:<br />
The Case <strong>of</strong> Adrako Micro-earth Dam,<br />
MSc Thesis, School <strong>of</strong> Graduate<br />
Studies, Haramaya University<br />
Bos M. G., Performance indicators for<br />
irrigation and drainage. Irrigation and<br />
Drainage Systems, 11:119-137.<br />
Bos, M. G., Murray-Rust, D. H., Merrey, D<br />
.J., Johnson, H. G. and Snellen, W. B.,<br />
1993. Methodologies for assessing<br />
performance <strong>of</strong> irrigation and drainage<br />
management. Irrigation and drainage<br />
systems. Vol. 7 No.4.<br />
Daniel Kassahun, 2007. Rainwater<br />
Harvesting in Ethiopia: Capturing the<br />
Realities Exploring Opportunities. FSS<br />
Research Report No. 1. Forum for<br />
Social Studies, Addis Ababa.<br />
Dessalegn Rahmato, 1999. <strong>Water</strong> Resources<br />
Development in Ethiopia: Issue <strong>of</strong><br />
Sustainability and Participation. FSS<br />
Discussion Paper. Irrigation Practices,<br />
State Intervention and Farmers’ Life-<br />
Worlds in Drought-Prone, Tigray,<br />
Ethiopia.<br />
Gashaye Chekol, 2007. Technical and<br />
Institutional Evaluation <strong>of</strong> Geray<br />
Irrigiation Scheme, West Gojam,<br />
Amhara Region. MSc Thesis, School <strong>of</strong><br />
Graduate Studies, Haramaya University<br />
Kloezen W. H. and Garces-Restrepo C.,<br />
1998. Assessing Irrigation Performance<br />
with Comparative Indicators: The Case<br />
<strong>of</strong> the Alto Rio Lerma Irrigation<br />
District, Mexico. Research Report 22.<br />
<strong>International</strong> <strong>Water</strong> <strong>Management</strong><br />
<strong>Institute</strong>. Colombo, Sri Lanka.<br />
MoWR (Ministry <strong>of</strong> <strong>Water</strong> Resources).<br />
2001. Irrigation Development Strategy.<br />
Ministry <strong>of</strong> <strong>Water</strong> Resources, Addis<br />
Ababa.<br />
Mekonen Leulseged, 2003. Irrigation Subsector<br />
situation analysis. Ministry <strong>of</strong><br />
<strong>Water</strong> Resources, Addis Ababa<br />
(unpublished)<br />
Sarker, A and Itoh, T., 2000. Design<br />
principles in long-enduring institutions<br />
<strong>of</strong> Japanese irrigation common pool<br />
resources. Agricultural Mater<br />
<strong>Management</strong>. 48(2001) 89-102.<br />
Woldeab Teschome, 2003. Irrigation<br />
Practices, State Intervention and<br />
Farmers Life-Worlds in Drought–Prone<br />
Tigray. PhD Disertation, Wageningen,<br />
the Netherlands<br />
352
Plate 4.2 <strong>Water</strong> flowing through the gate (Intake)<br />
Plate 4.3 Main Canal partly lined<br />
353
Discussion on Theme 3: Irrigation Institutions and Support Services<br />
Chair: Dr Kim Geheb<br />
Rapporture: Dr. G. Makombe<br />
The chairman for this session introduced the theme and the floor was opened for questions,<br />
comments and suggestions.<br />
Questions and Discussions<br />
3.1 Institutions are linked with<br />
performance and farmer<br />
participation is a big issue to<br />
improve performance <strong>of</strong> all<br />
schemes. WUA farmers need to<br />
organize themselves. Need to take<br />
into account traditional practice vs<br />
culture. Need to build on the<br />
existing traditional and cultural<br />
practices<br />
3.2 Cost recovery is an important issue.<br />
There is indication <strong>of</strong> interest by<br />
farmers for cost recovery. From<br />
experience few schemes not<br />
functioning because <strong>of</strong> wrong design<br />
usually fail because <strong>of</strong> management<br />
issues.<br />
Ans: Agree that WUAs are the only<br />
way out. For larger schemes can be<br />
cooperate or the government but for<br />
small scale schemes WUAs need to<br />
be empowered. Traditional schemes<br />
are successfully managed by social<br />
exclusion. For modern schemes<br />
need to go to court but courts are<br />
inefficient. There is need to<br />
empower the WUAs.<br />
Sometimes there is a water master or<br />
a WUA but the challenge is when<br />
one asks what the role <strong>of</strong> each is<br />
when they are all there on a scheme.<br />
There is mention that responsibilities<br />
should be transferred but only one <strong>of</strong><br />
them should be empowered. WUAs<br />
are not supported by government.<br />
Institutional conflict and confusion<br />
exists.<br />
3.3 There is no legal status for WUAs.<br />
This is why irrigation coops were<br />
established for marketing and inputs<br />
supply. Did you notice conflict<br />
between formally established coops<br />
and community based/informal<br />
organizations? Koga is planned to<br />
have a coop. There is a hot debate<br />
in Amhara about institutional set up.<br />
Ans: In some schemes some<br />
members <strong>of</strong> WUA are not members<br />
<strong>of</strong> coop and vice versa. There is<br />
conflict but it is managed because<br />
coops have upper hand over WUA.<br />
E.g. members <strong>of</strong> WUA are not<br />
allowed to sell produce through<br />
coop.<br />
There is conflict and there is bad<br />
attitude regarding/towards coops.<br />
Many people were not interested to<br />
be coop members.<br />
Koga: If coops could be managed<br />
like cooperates this is the best option.<br />
<strong>Water</strong> should have an owner. Koga<br />
will be large and there will be<br />
segments. <strong>Water</strong> needs an owner and<br />
there should be cost recovery<br />
mechanisms<br />
3.4 Should there be a market first then<br />
farmers produce for it?<br />
3.5 Who owns the traditional systems and<br />
who empowers the farmers to mange<br />
them. Some are function well and<br />
some not so well. What do we now<br />
about the management and are there<br />
lessons to be learned. Farmer to<br />
farmer learning was used well in Asia<br />
from schemes working well to those<br />
not working se well. To improve the<br />
performance <strong>of</strong> traditional schemes is<br />
it physical infrastructure or ids it<br />
institutional issues that need to be<br />
addressed? Traditional systems came<br />
354
about because farmers did something<br />
and when we build a scheme for<br />
farmers we take away this option that<br />
farmers do something for themselves.<br />
Ans: There is incentive is getting<br />
access to water. Some farmers in<br />
remote areas were not interested in<br />
canal clearance because they do not<br />
see the benefit <strong>of</strong> irrigation. Those<br />
who have access to information and<br />
markets have incentive to produce. In<br />
Tigray there are people called<br />
production cadres who went to<br />
primary school and become farmers .<br />
They are trained by extension to help<br />
information flow. Demonstration<br />
fields are usually showing optimum<br />
conditions that are not accessible to<br />
farmers. Farmers always need to<br />
adjust to their situation.<br />
We should not generalize that the<br />
traditional irrigation is the best, but<br />
upgrading traditional schemes is a<br />
good idea. Institutional set up should<br />
always consider local knowledge and<br />
institutions.<br />
One irrigation scheme was fascinating.<br />
Why did it lasted for 50 years. There<br />
was a penalty practiced for <strong>of</strong>fenders.<br />
An <strong>of</strong>fender irrigating at night was<br />
fined 50 birr and an <strong>of</strong>fender<br />
irrigating during the day was fined 30<br />
birr. This is whey they are working<br />
well because if immediate penalty.<br />
<strong>Water</strong> father said you teach us to<br />
conserve the soil, but annually we<br />
exporting soil to neighboring<br />
countries. Why are we not<br />
constructing permanent structures if<br />
farmers are doing so year after year?<br />
Why do we tend to construct new<br />
schemes but give them low support?<br />
3.6 How do local courts handle water<br />
rights conflicts? What percentage <strong>of</strong><br />
conflict goes to local courts?<br />
Ans: A substantial amount is<br />
reported to courts. The committee<br />
operates at three levels…..When it<br />
moves beyond capacity <strong>of</strong> local<br />
courts then it is reported to kebele<br />
court, then to district. When there is<br />
a serious case <strong>of</strong> theft and when there<br />
is serous case <strong>of</strong> water and or abuse<br />
<strong>of</strong> power reported to court. Two cases<br />
per day were handled by the curt.<br />
3.7 At Indris water scarcity is the issue.<br />
At Giray, there is excess water and<br />
excess command area which is not<br />
managed by the farmers. What<br />
determines the interest <strong>of</strong> the farmer<br />
to mange certain land. We have to<br />
recognize that the government does<br />
not accept the WUA but accepts the<br />
coop. Coop should deal with water<br />
and water management issues<br />
3.8 Geray: In this area there was a land<br />
redistribution in west Gojam zone.<br />
There is a land certification program.<br />
Is the process impacting the<br />
development <strong>of</strong> the irrigation scheme.<br />
Ans: One <strong>of</strong> the reasons farmers are<br />
not developing irrigation scheme is<br />
because <strong>of</strong> uncertainty abut land<br />
ownership. 28 ha were given to an<br />
investor. Land certification had not<br />
reached there. Farmers are willing to<br />
invest in land if they are clear about<br />
ownership..<br />
3.9 These are good research works<br />
exploring the local situations. Would<br />
like to see in-depth why despite<br />
positive effects and nice looking<br />
crops, what is wrong? Why do<br />
people despite the incentives, not<br />
make proper arrangements to manage<br />
schemes.<br />
Ans: Farmers could not maintain the<br />
water intensive horticultural<br />
production for long because water<br />
became unreliable and farmers were<br />
obliged to shift from water intensive<br />
horticultural crops to perennial crops.<br />
The income has declining because <strong>of</strong><br />
the effect <strong>of</strong> management problems.<br />
355
Theme four:<br />
Environmental and Health Impact <strong>of</strong> Irrigation<br />
Papers<br />
1. Case study review <strong>of</strong> investigated irrigation projects in Ethiopia<br />
2. Environmental impact analysis <strong>of</strong> large-scale irrigation in Ethiopia<br />
3. Brief manual “Keys for successful irrigation in Ethiopia”<br />
4. Minimizing the negative environmental and health impacts <strong>of</strong> agricultural water resources<br />
development in Sub-Saharan Africa<br />
5. Health and Environmental Analysis Results (10 minutes each)<br />
6. GIS and remote sensing integrated environmental impact assessment <strong>of</strong> irrigation project in<br />
Finchaa Valley area<br />
7. Entomological studies on the impact <strong>of</strong> a small-scale irrigation scheme on malaria<br />
transmission around Ziway<br />
8. Irrigation and socio-economic factors related to malaria transmission in ziway, Ethiopia
Case study review <strong>of</strong> investigated irrigation projects in Ethiopia<br />
W. Loiskandl 1 , D. Ruffeis 1 , M. Schönerklee 2 , R. Spendlingwimmer 2 ,<br />
S. B. Awulachew 3 and E. Boelee 3<br />
1<br />
University <strong>of</strong> Natural Resources and Applied Life Sciences, Department <strong>of</strong> <strong>Water</strong> - Atmosphere -<br />
Environment, <strong>Institute</strong> <strong>of</strong> Hydraulics and Rural <strong>Water</strong> <strong>Management</strong>, Vienna, Austria<br />
2<br />
Austrian Research Centers GmbH –ARC, Business Area <strong>Water</strong><br />
Seibersdorf, Austria<br />
3<br />
<strong>International</strong> <strong>Water</strong> <strong>Management</strong> <strong>Institute</strong> IWMI, Addis Ababa, Ethiopia<br />
willibald.loiskandl@boku.ac.at<br />
Abstract<br />
Within the project “Impact <strong>of</strong> Irrigation<br />
Development on Rural Poverty and the<br />
Environment” emphasis was given to the rural<br />
development <strong>of</strong> communities performing<br />
irrigation. Main goal was to analyze the<br />
potential <strong>of</strong> irrigation development, which<br />
should be performed in an environmentally<br />
sound way to ensure good living conditions for<br />
future generations. Environmentally sound<br />
means to maintain soil fertility, water quality,<br />
to be concerned about health impacts and<br />
maintaining biodiversity.<br />
The starting point for this review is an<br />
irrigation database, a classification <strong>of</strong> irrigation<br />
schemes in Ethiopia and the resulting selection<br />
<strong>of</strong> case studies <strong>of</strong> irrigation schemes. The<br />
study aims to support the clarification <strong>of</strong><br />
environmental factors and processes related to<br />
irrigation development. The socioeconomic<br />
implications <strong>of</strong> environmental impacts <strong>of</strong><br />
irrigation investments such as links to poverty,<br />
health and policies and institutions will also be<br />
treated. The methods used include field<br />
measurements and observations, laboratory<br />
analyses, structured questionnaire surveys and<br />
PRA.<br />
The investigated field studies performed under<br />
the project’s specific task “Assessment <strong>of</strong><br />
generic environmental and health issues as<br />
related to irrigated agricultural development”<br />
are presented. The collected material is<br />
compiled and made accessible through a data<br />
base. The case studies results are critically<br />
reviewed and conclusions for future field<br />
investigation are drawn.<br />
Key words: Irrigation development, impact<br />
assessment, environmental factors, Ethiopia<br />
Introduction<br />
It is commonly agreed that irrigation<br />
intensification contributes to poverty<br />
alleviation. Access to water, poverty and<br />
people's livelihoods are interlinked (Figure 1).<br />
These linkages are both direct and indirect.<br />
Direct linkages operate via localized and<br />
household-level effects, and indirect linkages<br />
operate via aggregate or national level impacts<br />
(Hussain and Hanjra, 2004). At the same time,<br />
water is becoming a scarce resource in many<br />
countries, particularly in Sub-Saharan Africa.<br />
This is also reflected in the Millennium goals<br />
<strong>of</strong> the UNITED NATIONS (2005) especially<br />
in Goal 7: ensure environmental sustainability.<br />
In the project “Impact <strong>of</strong> Irrigation<br />
Development on Rural Poverty and the<br />
Environment” this was one <strong>of</strong> the working<br />
hypotheses, but set in a wider environmental<br />
and socio-economic context.<br />
357
Hydrology<br />
health & poverty<br />
Environmental frame Socio/economic frame<br />
Soil quality<br />
<strong>Water</strong> quality<br />
Society<br />
Figure 1: Interdisciplinary frames for case study investigations.<br />
The overall goal is the understanding <strong>of</strong><br />
impacts <strong>of</strong> past interventions and investments<br />
in irrigation. This will significantly contribute<br />
to the planning <strong>of</strong> new investments and the<br />
design <strong>of</strong> interventions for enhancing<br />
agricultural production. Emphasis is given to<br />
biophysical aspects such as ground and surface<br />
water use, soil quality parameters, land use<br />
patterns, nutrient recycling, agrochemical use<br />
and its associated risks, and wildlife and agrobiodiversity.<br />
The findings <strong>of</strong> the investigated<br />
case studies are <strong>of</strong> relevance for an improved<br />
planning and managing <strong>of</strong> irrigation and water<br />
resources in Ethiopia and other countries with<br />
similar climatic conditions, especially in Sub-<br />
Saharan Africa.<br />
To quantify the significant positive and<br />
negative impacts <strong>of</strong> irrigation development in<br />
Ethiopia the following five specific objectives<br />
were defined (Awulachew, 2004):<br />
1) to generate information that can be<br />
used to improve the performance <strong>of</strong><br />
irrigated agriculture and enhance its<br />
positive benefits while minimizing its<br />
negative externalities,<br />
2) to guide future irrigation investments<br />
and fill the gap in knowledge about the<br />
total impact <strong>of</strong> irrigation development on<br />
economy, society and environment,<br />
3) to address specific health and poverty<br />
alleviation issues,<br />
4) to develop methodological guidelines<br />
for assessing the impact <strong>of</strong> irrigation<br />
investment,<br />
5) to strengthen Ethiopian capacity for<br />
interdisciplinary research and political<br />
implementation.<br />
The assessment <strong>of</strong> irrigation practices (AIP)<br />
has to trigger actions. A prerequisite is the<br />
collaborative work with partners, based on<br />
their individual roles and mandates. This is<br />
supported by an EU sponsored co-project<br />
“Dissemination <strong>of</strong> research results in semi-arid<br />
and arid ecosystems with a focus on<br />
sustainable water resource management in<br />
Ethiopia" (short name WATERMAN). This<br />
Specific Support Action (SSA) focuses on<br />
analysis and dissemination <strong>of</strong> research results<br />
in sustainable, integrated water resource<br />
management at river-basin scale in Ethiopia.<br />
The SSA takes advantage from the existing<br />
collaborations linking together partners from<br />
different regions in Ethiopia and the creation<br />
<strong>of</strong> an inter-Ethiopian-network is supported.<br />
Case study review <strong>of</strong> irrigation<br />
development in Ethiopia<br />
Irrigated agriculture is a priority <strong>of</strong> the<br />
agricultural transformation and food security<br />
strategy <strong>of</strong> the Ethiopian Government.<br />
Increased availability <strong>of</strong> irrigation and less<br />
dependency on rainfed agriculture is taken as a<br />
means to increase food production and selfsufficiency<br />
<strong>of</strong> the rapidly increasing population<br />
<strong>of</strong> the country. In line with the development<br />
policy regional states and NGOs are promoting<br />
irrigation development so as to increase and<br />
stabilize food production in the country.<br />
Under the 15- year <strong>Water</strong> Sector Development<br />
Program (WSDP), irrigation development<br />
subprogram, a total <strong>of</strong> 1606 small-scale<br />
irrigation schemes planned to be implemented<br />
mainly for the provision <strong>of</strong> food requirements<br />
(Ministry <strong>of</strong> <strong>Water</strong> Resources, 2001). Foreign<br />
governments and multi-lateral agencies are<br />
expected to co-operate with the government <strong>of</strong><br />
Ethiopia and Non-government organizations<br />
(NGOs) to foster this program. Other nongovernmental<br />
organizations and communities<br />
358
are also undertaking water resource<br />
development activities with the same<br />
objective. For example a large number <strong>of</strong><br />
earthen micro-dams and river diversions have<br />
been built in the Awash Basin. Besides the<br />
development <strong>of</strong> new schemes, some traditional<br />
systems are also being rehabilitated.<br />
The irrigation scheme classification used in<br />
this paper follows the work <strong>of</strong> Philippe<br />
Lempérière who divided irrigation projects in<br />
Ethiopia in four groups, (cited by Werfring,<br />
2004):<br />
• Traditional irrigation schemes that<br />
have been practiced for centuries by<br />
using perennial or seasonal streams.<br />
These schemes usually were<br />
developed by the farmers themselves<br />
without any government involvement.<br />
• Modern communal irrigation<br />
implemented by regional governments.<br />
Rivers and run-<strong>of</strong>f water, lakes,<br />
springs and groundwater are used.<br />
Generally modern communal irrigation<br />
schemes are more sophisticated than<br />
traditional ones.<br />
• Modern private irrigation schemes<br />
started in the 1950s initiated by Dutch<br />
companies that implemented sugar<br />
estates. With the adoption <strong>of</strong> a market<br />
based economy the private schemes reemerged<br />
in the 1990s. <strong>Water</strong> is mainly<br />
from rivers or lakes by pumps or<br />
diversions, although some small farms<br />
use water harvesting techniques.<br />
• State farms operated by state owned<br />
enterprises, such as the Upper Awash<br />
Agro Industry Enterprise. <strong>Water</strong> is<br />
abstracted from rivers or lakes by<br />
pumps or diversions. Most <strong>of</strong> the<br />
public irrigation schemes can be found<br />
in the Awash River Valley.<br />
For detailed studies irrigation schemes were<br />
selected and investigations were performed<br />
according to the various assignments <strong>of</strong> the<br />
project. The following aims to synthesize the<br />
case studies, highlights the main findings and<br />
reflects them in terms <strong>of</strong> the assigned<br />
deliverables <strong>of</strong> the project. Out <strong>of</strong> 26 project<br />
case study sites eight were selected for the<br />
environmental impact assessment (<strong>Table</strong> 1,<br />
Figure 2). Included in <strong>Table</strong> 1 is also a case<br />
study outside the project from Dominik<br />
Ruffeis (2006c): the Lomi Wuha irrigation<br />
scheme, for which the same approach was<br />
used. The investigation <strong>of</strong> Wagnew Ayalneh<br />
(2004) was performed at a selected case study<br />
site, but not as part <strong>of</strong> the project. In total 12<br />
case studies, performed by ten investigators<br />
from Ethiopia and Austria, are analyzed in this<br />
report. Additional information is provided<br />
when accessible and relevant. The fieldwork<br />
took place at 13 irrigation schemes in three<br />
mayor river basins <strong>of</strong> Ethiopia, with Awash<br />
River basin, where most irrigation activities<br />
happen, being most prominently represented.<br />
The presented case studies are a good sample<br />
in terms <strong>of</strong> different irrigation scheme sizes<br />
and management practices.<br />
359
<strong>Table</strong> 1. General case study site specification, numbers are given for each individual report,<br />
e.g. thesis works or unpublished documents.<br />
Nr Investigator Scheme Basin Type <strong>of</strong> irrigation<br />
1 Wallner/Ruffeis Wonji/Shoa Sugar Upper Awash State Farm/Gravity<br />
Plantation<br />
2 Wagnew Doni, Batu Degaga, Upper Awash Modern/Traditional<br />
Ayalneh Markos, Godino<br />
Communal/Gravity<br />
3 Ruffeis Godino Upper Awash Modern<br />
Communal/Gravity<br />
4 Damtew Goha Woriko Upper Awash Modern<br />
Communal/Gravity<br />
5 Zewdie Amibara II Middle Awash State Farm<br />
6 Ebissa Ziway<br />
Holota<br />
Middle Awash<br />
Upper Awash<br />
Modern<br />
Communal/Gravity<br />
7 Wallner/Ruffeis Indris/Guder Blue Nile Modern<br />
Communal/Gravity<br />
8 Ruffeis Lomi Wuha (MfM) Blue Nile Traditional/Gravity<br />
9 Ruffeis Finchaa Valley Sugar Blue Nile State Farm/Sprinkler<br />
Estate<br />
10 Ahmed A. Finchaa Valley Sugar Blue Nile State Farm/Sprinkler<br />
Estate<br />
11 Judt Hare Rift Valley Modern Communal<br />
Lakes<br />
Traditional/Gravity<br />
12 Ruffeis Hare Rift Valley Modern Communal<br />
Lakes<br />
Traditional/Gravity<br />
360
Indr<br />
Mark<br />
Doni<br />
Figure 2: Investigation field site locations<br />
Presentation <strong>of</strong> field sites and discussion <strong>of</strong><br />
results<br />
The investigated field sites should be<br />
considered in the broader context <strong>of</strong> irrigation<br />
in Ethiopia. The river basin development<br />
master plan studies <strong>of</strong> the Ministry <strong>of</strong> <strong>Water</strong><br />
Resources (2001) provide an excellent<br />
overview <strong>of</strong> intervention potential in Ethiopia.<br />
Experiences and opportunities for promoting<br />
small-scale/micro irrigation and rainwater<br />
harvesting for food security in Ethiopia are<br />
presented by Seleshi B. Awulachew et al.<br />
(2005). Another broad overview <strong>of</strong> irrigation<br />
development in Ethiopia covering all river<br />
basins is provided by Seleshi B. Awulachew et<br />
al. (2007).<br />
For better comparison <strong>of</strong> the results obtained at<br />
different locations the most important analyzed<br />
parameters and the main focus <strong>of</strong> the<br />
respective studies are presented in an<br />
investigation matrix (<strong>Table</strong> 2). The summary<br />
<strong>of</strong> performed work shows a concentration on<br />
water and soil analyses in a strong relation to<br />
environmental issues. For most <strong>of</strong> the<br />
investigated sites the other aspects <strong>of</strong> poverty<br />
alleviation, health and socio/economic<br />
considerations were treated as well or were<br />
available from other sources. Further detailed<br />
information may be obtained through the cited<br />
reports, thesis works and other literature<br />
sources.<br />
361
<strong>Table</strong> 2. Investigation matrix<br />
Nr<br />
Environment/<br />
natural<br />
resources<br />
<strong>Water</strong><br />
quality<br />
Soil<br />
quality<br />
Poverty<br />
alleviation/<br />
health<br />
Socioeconomic<br />
1 XX XXX XXX X<br />
2 XX X X XX XXX<br />
3 X XXX XXX X<br />
4 X XXX XXX X<br />
5 XXX X XX X XXX<br />
6 X XXX XXX XXX 1) X<br />
7 X XXX XXX X<br />
8 X XXX XXX X<br />
9 X XXX XXX XXX 2) X<br />
10 XXX XX XX XX X<br />
Awash<br />
Blue Nile<br />
11 X XXX XXX Rift Valley<br />
12 XX XXX XXX XXX 3) Lakes<br />
Investigation XXX high, XX medium, X low<br />
1) Alemu (2007) & Kibret (2008), both for Ziway only; 2) Chala (2007); 3) Mabedo (2003)<br />
As a general characterization <strong>of</strong> the<br />
investigated field sites various climatic data<br />
and the elevation, which are also important in<br />
relation to health aspects, are presented in<br />
Figures 3 and 4. For each irrigation scheme a<br />
short description and main results are provided<br />
in the subsections below.<br />
45<br />
Annual N<br />
Elevation<br />
40<br />
1400<br />
2500<br />
Temperature (°C)<br />
35<br />
30<br />
25<br />
20<br />
15<br />
10<br />
5<br />
0<br />
Wonji/Shoa<br />
Doni<br />
Batu Degaga<br />
Markos<br />
Godino<br />
Akaki<br />
Goha Woriko<br />
Amibara II<br />
Ziway<br />
Holota<br />
Indris/Guder<br />
Lomi Wuha<br />
Finchaa Valley<br />
Hare<br />
Tmin<br />
Tmax<br />
Figure 3: Temperature values <strong>of</strong> case study sites<br />
(NMA, 2006)<br />
annual N (mm)<br />
1200<br />
1000<br />
800<br />
600<br />
400<br />
200<br />
0<br />
Wonji/Shoa<br />
Doni<br />
Batu Degaga<br />
Markos<br />
Godino<br />
Akaki<br />
Goha Woriko<br />
Amibara II<br />
Ziway<br />
Holota<br />
Indris/Guder<br />
Lomi Wuha<br />
Finchaa Valley<br />
Hare<br />
Figure 4: Elevation and annual precipitation <strong>of</strong><br />
case study sites (NMA, 2006)<br />
2000<br />
1500<br />
1000<br />
500<br />
0<br />
Elevation (m)<br />
Wonji/Shoa Sugar Plantation<br />
The first large public irrigation scheme<br />
Wonji/Shoa Sugar Plantation was constructed<br />
in 1956 as a private farm by HVA (Handels<br />
Vereniging Amsterdam). The sugar production<br />
is now subordinated under the authority <strong>of</strong> a<br />
government agency (Ethiopian Sugar<br />
Company). The scheme is located about 80 km<br />
south east <strong>of</strong> Addis Ababa, 15km south <strong>of</strong> the<br />
town <strong>of</strong> Nazareth in the Upper Awash Valley.<br />
The irrigation schema has good structures and<br />
is visibly well managed. Awash River is the<br />
irrigation source <strong>of</strong> the scheme which is<br />
located down stream <strong>of</strong> Koka dam. Koka dam<br />
was originally constructed for hydropower<br />
production in 1960. Irrigation water is diverted<br />
from the Awash River with electrical pumps<br />
and the plantation is managed as a gravity<br />
system. Excess water is stored in night storage<br />
reservoirs which cover a total surface area <strong>of</strong><br />
60 ha. Wastewater from the sugar factory and<br />
domestic supply is blended with freshwater<br />
and used for irrigation on some <strong>of</strong> the fields.<br />
362
The whole irrigated area (6000 ha for the state<br />
farm, additionally 1000ha for the out-growers)<br />
is drained by a constructed, open surface<br />
drainage system.<br />
Girma A. (2005) states that in most sugarcane<br />
fields <strong>of</strong> Wonji/Shoa slight to moderate soil<br />
infiltration problems are expected if<br />
groundwater occurs at shallow depths. Field<br />
observations confirmed that the groundwater<br />
depth was at all the times too shallow (in the<br />
root zone) for nearly all sugarcane fields<br />
considered in this study. Hence in Wonji/Shoa,<br />
sugarcane fields are prone to water logging and<br />
physical degradation <strong>of</strong> topsoil (Wallner, 2006;<br />
Ruffeis et al., 2007).<br />
Doni, Batu Degaga, Godino, Marko,<br />
Goha Woriko - Oromyia Region<br />
The Godino and Goha Woriko irrigation<br />
schemes are on both sides <strong>of</strong> the Wedecha<br />
River, located in East Shewa zone, in Oromia<br />
region near the town <strong>of</strong> Debre Zeit about 70<br />
km from Addis Ababa. The schemes are part<br />
<strong>of</strong> a cascade system which includes two<br />
earthen dams and reservoirs. The upper dam<br />
which is located north <strong>of</strong> the two schemes<br />
Godino and Goha Worko is called Wedecha<br />
dam and is the main water source <strong>of</strong> both<br />
schemes. The dam was constructed in 1980 by<br />
Kuba Construction Brigade having the<br />
Agricultural Development Minster <strong>of</strong> Ethiopia<br />
as a client. Wedecha dam lies at an altitude <strong>of</strong><br />
2437 m.a.s.l. and the two schemes on an<br />
average altitude <strong>of</strong> 2010 m.a.s.l (Damtew,<br />
2006).<br />
Wagnew Ayalneh (2004) gathered information<br />
at household level on crop production, market<br />
and irrigation management. Investigated are<br />
four small-scale irrigation schemes, namely<br />
Doni scheme from Boset woreda, Batu Degaga<br />
scheme from Adama woreda, Godino scheme<br />
from Ada Liben woreda and Markos scheme<br />
from Wolemera woreda. The selection was<br />
based on accessibility, experience and type <strong>of</strong><br />
scheme. 240 farmers were selected from the<br />
respective peasant association (30 irrigators<br />
and 30 non-irrigators for each woreda). The<br />
total population <strong>of</strong> irrigators and non-irrigator<br />
farmers <strong>of</strong> the four peasant associations are<br />
627 and 3207 respectively.<br />
The study <strong>of</strong> these small-scale irrigation<br />
schemes in the Awash Basin revealed some<br />
factors that are important for the successful<br />
implementation <strong>of</strong> small-scale irrigation<br />
schemes. The system <strong>of</strong> furrow irrigation,<br />
which is practiced in most <strong>of</strong> the schemes, has<br />
high labor demands and hence some farmers<br />
practice a flooding system. This will aggravate<br />
erosion especially in sloping plots. High<br />
electricity, repair and maintenance cost <strong>of</strong><br />
pumps in Batu Degaga showed that electric<br />
powered pumps might be too costly for<br />
smallholder farmers (Ruffeis, 2006a). Systems<br />
that require less cost like gravity diversion<br />
systems should be looked at seriously. In the<br />
analysis <strong>of</strong> the schemes it has come out clearly<br />
that small-scale irrigation projects built or<br />
upgraded by NGO’s and government are <strong>of</strong>ten<br />
handed over to the farmers without proper<br />
completion <strong>of</strong> construction or technical<br />
training and without proper management<br />
establishment. This creates problems at such<br />
schemes as farmers are left with the<br />
understanding that the government or the NGO<br />
are still responsible.<br />
Amibara II<br />
Amibara Irrigation Project II is located in the<br />
south-eastern flood plain <strong>of</strong> the Awash River<br />
250 km away from Addis Ababa, in a typical<br />
semi-arid agro ecological zone with an<br />
extensive pastoral production system based on<br />
with camels, cattle, goats and sheep. In 1980<br />
the Amibara Irrigation Project II (AIP II) was<br />
established and production is mainly focused<br />
on cotton for foreign markets. Socioeconomic<br />
and environmental data were collected through<br />
informal discussions with the local community<br />
elders who were relocated from their original<br />
living area due to the irrigation development<br />
(Zewdie, 2005). Changes in the living<br />
conditions (social and cultural settings) <strong>of</strong> the<br />
rural Afar people were recorded. In addition to<br />
the survey data, secondary data on surface and<br />
ground water hydrology, production and land<br />
productivity, and primary data on soil physical<br />
and chemical properties were collected.<br />
In this system the irrigation development<br />
considerably contributes to the local economy<br />
through establishing pr<strong>of</strong>itable enterprises and<br />
improving the livelihoods <strong>of</strong> thousands <strong>of</strong><br />
people (mainly migrants who newly settled in<br />
this area) through providing job opportunities<br />
363
and good income. On the other hand<br />
diminishing livestock holding forced the rural<br />
pastoral community to lead under subsistence<br />
lives and some <strong>of</strong> them to migrate to towns in<br />
search <strong>of</strong> work. So the total contribution <strong>of</strong> the<br />
irrigation development in improving the<br />
livelihoods (income) <strong>of</strong> the native community<br />
<strong>of</strong> the area is none, even negative.<br />
Ziway and Holota<br />
Ziway is located 170 km from Addis Ababa on<br />
the way to Awassa. At Ziway, the study was<br />
carried out in the peasant association (PA)<br />
called Edo-Gojola, which was established in<br />
1992 by SEDA (Selam Environmental<br />
Development Association). The total command<br />
area <strong>of</strong> the scheme is 2440 ha whereby only 32<br />
ha <strong>of</strong> the farm are currently operational. <strong>Water</strong><br />
for irrigation is diverted from Lake Ziway<br />
using motor pumps and distributed to the fields<br />
by gravity (Ebissa, 2005). Rainfall is not<br />
satisfactory and as a result low yields have<br />
been recorded that need to be supplemented<br />
with irrigation.<br />
Holota is situated approximately 45 km west <strong>of</strong><br />
Addis Ababa. At Holota the study was carried<br />
out in the Misrak-Shola-Ber peasant<br />
association (PA), which was established before<br />
1971. The total irrigated area is 90 ha (Ebissa,<br />
2005). The water source <strong>of</strong> the scheme is<br />
Holota River. The irrigation water is diverted<br />
from the river and distributed to the fields<br />
using gravity. The total area <strong>of</strong> the site is 680<br />
hectare <strong>of</strong> which irrigation occupied 90<br />
hectare. Clinical data from the health center<br />
data and a questionnaire were used to generate<br />
additional information.<br />
Technical skills and innovative irrigation<br />
technology are absent in these two schemes.<br />
Both irrigators and non-irrigators use similar<br />
types <strong>of</strong> land management techniques<br />
(traditional technology). Some irrigators were<br />
found to increase their production by<br />
expanding land size and changing to other land<br />
uses while they might have better improved<br />
their poor land’s condition through intensified<br />
management. Provision <strong>of</strong> training to empower<br />
farmers with new land management techniques<br />
is crucial. There is a need to have alternative<br />
water sources to alleviate the water shortage<br />
problem at Ziway and Holota. Land ownership<br />
and land use policies are very important as<br />
these determine the productive lifespan <strong>of</strong> the<br />
land through the type <strong>of</strong> investment farmer<br />
make in land management.<br />
The overall study indicates that communitybased<br />
irrigation schemes are more feasible at<br />
highlands (Holota) than at lowlands due to<br />
health impacts and water and soil deterioration,<br />
probably linked to the original water quality <strong>of</strong><br />
the source. Improving the local supporting<br />
infrastructure such as health centers, transport,<br />
input supply institutes and credit organizations<br />
would greatly help to contribute to the<br />
sustainability <strong>of</strong> the systems. An EIA with the<br />
active participation <strong>of</strong> the whole community<br />
on the onset <strong>of</strong> the project could have removed<br />
or at least minimized the negative impacts <strong>of</strong><br />
the irrigation scheme observed on health,<br />
environment and social conditions.<br />
Indris<br />
The Indris irrigation scheme is located in the<br />
western Shewa administrative region <strong>of</strong> Ambo<br />
Awraja, about 110 km west <strong>of</strong> Addis Ababa<br />
and about 10 km west <strong>of</strong> Ambo near the town<br />
<strong>of</strong> Guder. The scheme was established in<br />
1985/86 to produce vegetables on<br />
approximately 400ha <strong>of</strong> land using irrigation<br />
(Halcrow & partners, 1989). In 1991 further<br />
plans had been made to modernize the<br />
irrigation scheme as the old structures like the<br />
weir, flumes and the channels were in poor<br />
condition and partly damaged (OIDA, 1991).<br />
Since about 1995 the command area <strong>of</strong> the<br />
system is approximately 1000ha. The whole<br />
irrigation system is divided into several<br />
smaller irrigation schemes situated along Indris<br />
River, which is its water source. The water <strong>of</strong><br />
the investigated schemes is diverted by two<br />
different dams situated about 10km and 2km<br />
south (upstream) from Guder, respectively.<br />
Severe downstream impacts <strong>of</strong> irrigation have<br />
been noted under low flow regimes (Ruffeis,<br />
2006b; Wallner, 2006). In the dry periods<br />
practically the whole discharge is diverted<br />
from the river into the irrigation system.<br />
Directly after the diversions only water<br />
seeping through the diversion dam supplies the<br />
riverbed. Tributary rivers <strong>of</strong> Indris are<br />
providing the discharge for the second river<br />
diversion.<br />
364
Lomi Wuha<br />
This case study site is located in Merhabete<br />
district in Northern Shoa zone <strong>of</strong> the Amhara<br />
Regional State about 180 km north <strong>of</strong> the<br />
Addis Ababa. The topography <strong>of</strong> Merhabete is<br />
predominated by two valleys formed by the<br />
Jema and Wenchit Rivers. The infrastructure<br />
<strong>of</strong> Lomi’s irrigation scheme is very basic.<br />
Three springs or spring areas are used as water<br />
source for irrigating the farmland. The water is<br />
collected in natural basins and is diverted with<br />
two earth canals supplying different parts <strong>of</strong><br />
the scheme. The size <strong>of</strong> the command area <strong>of</strong><br />
the system is approximately 24 ha and on-field<br />
water distribution is done with furrows.<br />
Main hydrological impacts result from reduced<br />
run-<strong>of</strong>f water, but there are no downstream<br />
users (Ruffeis, 2006c). A conflict appears<br />
between the destruction <strong>of</strong> natural vegetation<br />
in the adjacent spring area versus food security<br />
in the region. Soil conservation and protection<br />
against erosion and land degradation is<br />
provided through irrigation because <strong>of</strong> a<br />
permanent vegetation cover. Soil physical<br />
analysis results compared with parent material<br />
may explain the different soil types within the<br />
area.<br />
Finchaa Valley Sugar Estate<br />
Finchaa Valley is located about 330 km west<br />
<strong>of</strong> Addis Ababa in the western part <strong>of</strong> Ethiopia,<br />
eastern Wollega zone in Oromiya region. In<br />
1975 the state farm was established that mainly<br />
produced food and commercial crops until<br />
1991. Starting from 1991 up to now more than<br />
8064 ha <strong>of</strong> land has been cleared and irrigated<br />
for sugar production (Ahmed Amdihun, 2006).<br />
The water source is the reservoir <strong>of</strong> Finchaa<br />
Dam (Lake Chomen) initially built for<br />
hydropower production. 25 pumps at 5 pump<br />
stations divert the water serving 34 % <strong>of</strong> the<br />
command area. 66 % <strong>of</strong> the area is irrigated<br />
using gravity <strong>of</strong>f-takes at 3 locations. The<br />
Finchaa Valley Irrigation System is equipped<br />
with sprinkler irrigation devices.<br />
Observations made during the field visit<br />
indicate that the obvious malfunction <strong>of</strong> the<br />
waste water treatment plant <strong>of</strong> the sugar<br />
factory poses a threat to downstream water<br />
bodies, especially to Finchaa River and its<br />
ecosystem. The project opened up large scale<br />
job opportunities for many thousands <strong>of</strong><br />
people. It has also many socio-economic<br />
benefits for the valley and surrounding people.<br />
In addition Finchaa Sugar factory plays a key<br />
role in addressing the current sugar demand on<br />
the local market. There are many efforts to<br />
exploit the by-products <strong>of</strong> the factory for<br />
additional purposes like using ethanol for fuel.<br />
The estate has also an important role in the<br />
growth <strong>of</strong> national GDP and GNP (Ahmed<br />
Amdihun, 2006).<br />
The analysis <strong>of</strong> measured water parameters at<br />
different dates shows no significant differences<br />
(Ruffeis et al., 2007). The soil degradation is in<br />
its early to moderate stage and not difficult to<br />
be addressed by alleviation measures. No<br />
further adverse impacts are to be expected<br />
caused by the water source, though malaria<br />
transmission seems to have increased because<br />
<strong>of</strong> the irrigation (Chala, 2007).<br />
Hare<br />
Hare River irrigation schemes are located in<br />
the Gamo G<strong>of</strong>a Zone, in the Southern Nations<br />
and Nationalities Peoples Regional State <strong>of</strong><br />
Ethiopia (SNNPR), about 495 km south <strong>of</strong><br />
Addis Ababa. The irrigation systems are<br />
located between the shore <strong>of</strong> Lake Abaya and<br />
the escarpments <strong>of</strong> the highlands. Hare<br />
Irrigation System comprises three different<br />
irrigation schemes with a total irrigable area <strong>of</strong><br />
2224 ha belonging to four kebele<br />
administrations, Kola Shara, Chano Mille,<br />
Chano Chalba and Chano Dorga. The three<br />
irrigation schemes use Hare River as water<br />
source but have to be classified differently due<br />
to differences in abstraction and delivery<br />
structures (Ruffeis, 2006d). Chano Dorga can<br />
be classified as traditional. In the case <strong>of</strong> Kola<br />
Shara a traditional delivery system is used to<br />
allocate the irrigation water that is diverted<br />
from Hare River by a modern diversion<br />
structure. Chano Chalba and Chano Mille can<br />
be classified as modern.<br />
Farmers complain about insufficient amounts<br />
<strong>of</strong> water for irrigation. The cause is decreasing<br />
rainfall over the last decade in the highlands,<br />
which minimized the discharge <strong>of</strong> Hare River<br />
and therefore the availability <strong>of</strong> irrigation<br />
water. The mentioned problems related to the<br />
high variability and low availability <strong>of</strong> water<br />
disproportionally affects farmers having their<br />
farmland located at the tail end <strong>of</strong> the scheme.<br />
In order to solve these allocation and<br />
365
availability problems one possible solution<br />
could be the construction <strong>of</strong> a reservoir to store<br />
the run-<strong>of</strong>f water <strong>of</strong> Hare River (Judt, 2007).<br />
On the other hand this might have severe<br />
impacts on the hydrology <strong>of</strong> Lake Abaya, due<br />
to a reduction <strong>of</strong> annual inflow rates. The<br />
options for design and water management to<br />
control malaria in this region were investigated<br />
by Ashenafi Madebo (2003).<br />
Summary <strong>of</strong> irrigation development<br />
impacts on the environment<br />
From the results a standardized sampling<br />
procedure such as checklists and guidelines for<br />
field work could be developed for future<br />
investigations. Standardized does not mean<br />
that the investigations are exactly the same in<br />
each site, but that the results are presented in<br />
an easily comparative way. An example <strong>of</strong> a<br />
checklist applied at the fields sites <strong>of</strong> Wonji<br />
and Indris was provided by Wallner (2006) in<br />
her work.<br />
Most important general findings for locations<br />
with similar conditions are summarized in<br />
<strong>Table</strong> 3. In this table a picture <strong>of</strong> the project<br />
investigations is provided and hence we do not<br />
claim it is complete. Still it may serve as a<br />
starting point for sharing knowledge and<br />
experiences. The impacts shown are the<br />
challenges for the future and need to be<br />
considered in irrigation planning and<br />
management activities. The more we know the<br />
more we can optimize our interventions for the<br />
benefit <strong>of</strong> poor people.<br />
<strong>Table</strong> 3: Impact matrix <strong>of</strong> irrigation development on the environment and health<br />
Nr Scheme Basin Hydrology/<br />
natural<br />
resources<br />
<strong>Water</strong><br />
quality<br />
Soil quality<br />
1 Wonji Rising water<br />
table, Seepage <strong>of</strong><br />
reservoirs<br />
2,3<br />
4<br />
Oromyia<br />
5 Amibara<br />
II<br />
A<br />
W<br />
A<br />
S<br />
H<br />
Inefficient water<br />
use (except<br />
Marcos)<br />
Flood hazard,<br />
degradation<br />
Slight<br />
increase<br />
Stagnant<br />
water<br />
EC<br />
Linkage with<br />
Lake Beseka<br />
(very high<br />
sodium cont.)<br />
Toxicity<br />
<strong>Water</strong><br />
logging<br />
Infiltration<br />
Salinity<br />
6 Ziway<br />
Salinity<br />
Permeability<br />
Holota<br />
increase<br />
7 Indris <strong>Water</strong> diversion Risk <strong>of</strong> water<br />
logging<br />
Low fertility<br />
Erosion risk<br />
8 Lomi<br />
Wuha<br />
9,<br />
10<br />
11,<br />
12<br />
Fincha<br />
Hare<br />
B<br />
L<br />
U<br />
E<br />
N<br />
I<br />
L<br />
E<br />
Rift<br />
Valley<br />
Lakes<br />
Destruction<br />
Ecosystem<br />
Degradation,<br />
erosion,<br />
deforestation<br />
<strong>of</strong><br />
Low EC<br />
Poverty<br />
alleviation<br />
Marketing,<br />
poor access<br />
to health<br />
facilities<br />
Others<br />
Heavy<br />
machines<br />
Need for<br />
education,<br />
management<br />
<strong>Water</strong><br />
conflicts<br />
Salinity questioned livestock,<br />
Negative<br />
Social<br />
effects<br />
Nutrients<br />
deficit,<br />
alkaline<br />
Low organic<br />
matter,<br />
Infiltration<br />
<strong>Water</strong> logging Low organic<br />
matter<br />
Malaria,<br />
Market<br />
access<br />
Employment<br />
possibility vs.<br />
destruction <strong>of</strong><br />
ecosystem,<br />
Malaria<br />
Malaria,<br />
questioned<br />
New plant<br />
diseases,<br />
training<br />
detailed soil<br />
sampling<br />
needed<br />
Impact<br />
sugar<br />
factory<br />
downstream<br />
water body<br />
<strong>of</strong><br />
on<br />
366
Conclusion<br />
The assessment <strong>of</strong> irrigation practices (AIP)<br />
claims not to be a new method, but tries to take<br />
advantage and adapt existing practices for<br />
irrigation projects. A step forward to quantify<br />
the significant positive and negative impacts <strong>of</strong><br />
irrigation development in Ethiopia was<br />
achieved and the risk assessment <strong>of</strong> future<br />
irrigation investments is supported. The<br />
development <strong>of</strong> methodological guidelines for<br />
assessing the impact <strong>of</strong> irrigation investment<br />
has started. The knowledge <strong>of</strong> the total impact<br />
<strong>of</strong> irrigation development on economy, society<br />
and environment could be substantially<br />
improved. Health and poverty alleviation<br />
issues have been addressed to some extent.<br />
Data sheets and concepts for field<br />
investigations are developed and applied at<br />
field sites. Standardization <strong>of</strong> the assessment <strong>of</strong><br />
irrigation practices and field investigations is<br />
especially useful for designing fieldworks and<br />
the comparison <strong>of</strong> results. The development <strong>of</strong><br />
guidelines for decision makers, planners and<br />
farmers depends on standardized<br />
methodologies and procedures.<br />
Integrated multi-purpose water utilization for<br />
irrigation has to be considered. This increases<br />
the demand for good management and the<br />
awareness <strong>of</strong> possible conflicts that may arise<br />
due to competing interests. Efficient use <strong>of</strong><br />
irrigation water is required to avoid water loss<br />
and to control vector breeding and waterrelated<br />
diseases. Well planned and maintained<br />
small-scale irrigation schemes are a<br />
contribution to economic development through<br />
increased incomes, employment creation and<br />
food security. Negative environmental effects<br />
could be minimized. Salinity and its mitigation<br />
measures are a mayor concern. Large scale<br />
irrigation schemes show mostly a better<br />
management and maintenance, but are at risk<br />
<strong>of</strong> more negative environmental impacts.<br />
A major challenge concerns the application <strong>of</strong><br />
hydrological research for surface and<br />
groundwater resources development and<br />
management, surface water harvesting and its<br />
effect on groundwater recharge with<br />
implication to the conjunctive use <strong>of</strong> water<br />
resources. Infrastructure and market access <strong>of</strong><br />
is a key feature <strong>of</strong> the success <strong>of</strong> an<br />
intervention. Other issues like improves health<br />
care, improved communication or a rural credit<br />
system could also support the development <strong>of</strong><br />
rural areas.<br />
The role <strong>of</strong> universities is to connect research<br />
and education, to share and support partners in<br />
the southern hemisphere, which is clearly<br />
visible by the “work force” named in this<br />
report. The importance <strong>of</strong> education to<br />
improve livelihood and food security is not<br />
questioned. Education in this context must<br />
reach out to all stakeholders involved in<br />
irrigation practice. Especially education and<br />
training in water management, marketing and<br />
general crop production is <strong>of</strong> high important.<br />
Finally it is believed that this project provides<br />
a contribution to strengthen Ethiopia’s capacity<br />
for interdisciplinary research and political<br />
implementation.<br />
References<br />
Ahmed, Amdihun, (2006). Geographic<br />
Information Systems and Remote Sensing<br />
Integrated Environmental Impact<br />
Assessment <strong>of</strong> Irrigation in Finchaa<br />
Valley, MSc. Thesis, Addis Ababa<br />
University, Ethiopia (10)<br />
Alemu, Yihenew, (2007). Irrigation and socioeconomic<br />
factors related to malaria<br />
transmission in Ziway, eastern Oromiya<br />
zone. MSc thesis Biomedical Sciences,<br />
Addis Ababa University Ethiopia (6)<br />
Awulachew, Seleshi B., (2004). Work Plan for<br />
the Research Project on Impact <strong>of</strong><br />
Irrigation Development on Rural Poverty<br />
and the Environment, <strong>International</strong> <strong>Water</strong><br />
<strong>Management</strong> <strong>Institute</strong> (IWMI) and<br />
Universitaet fuer Bodenkultur Wien.<br />
Awulachew, Seleshi B., Merrey, D.J., Kamara,<br />
A.B., Van Koppen, B., Penning de Vries<br />
F., Boelee, E., Makombe, G., (2005).<br />
Experiences and opportunities for<br />
promoting small-scale/micro irrigation and<br />
rainwater harvesting for food security in<br />
Ethiopia. IWMI Working Paper 98,<br />
<strong>International</strong> <strong>Water</strong> <strong>Management</strong> <strong>Institute</strong>.<br />
Awulachew, Seleshi B., Aster Denekew Y.,<br />
Makonnen Loulseged, Loiskandl, W.,<br />
Mekonnen Ayana and Tena Alamirew,<br />
367
(2007). <strong>Water</strong> Resources and Irrigation<br />
Development in Ethiopia, <strong>International</strong><br />
<strong>Water</strong> <strong>Management</strong> <strong>Institute</strong> (IWMI),<br />
Addis Ababa.<br />
Chala, B., (2007). Assessment <strong>of</strong> malaria as a<br />
public health problem in Finchaa Sugar<br />
Factory. MSc. thesis, Biology Department,<br />
Addis Ababa University. (9)<br />
Damtew, A., (2006). Evaluation <strong>of</strong> Gowa<br />
Worko small-scale irrigation scheme at<br />
Ada district, Oromia. A Thesis Submitted<br />
to the School <strong>of</strong> Graduate Studies through<br />
Department <strong>of</strong> Agricultural Engineering<br />
Graduate Council <strong>of</strong> Haramaya University,<br />
Ethiopia (14)<br />
Ebissa, Gizaw, (2005). Health, Environment<br />
and Socioeconomic Impact Assessment <strong>of</strong><br />
Community-Based Irrigation at Ziway and<br />
Holota. Master Thesis at the school <strong>of</strong><br />
graduate studies-environmental science,<br />
Addis Ababa University. (6)<br />
Girma A., (2005). Evaluation <strong>of</strong> Irrigation<br />
<strong>Water</strong> Quality in Ethiopian Sugar Estates<br />
(Research Report). Research and Training<br />
Services Division, Ethiopian Sugar<br />
Industry Support Centre Sh. Co., Wonji.<br />
(1)<br />
Halcrow W. & Partners (1989). Master plan<br />
for the development <strong>of</strong> Surface <strong>Water</strong><br />
Resources in the Awash Basin, Final<br />
Report (Vol. 8, Annex J), Ministry <strong>of</strong><br />
<strong>Water</strong> Resources <strong>of</strong> Ethiopia, Ethiopian<br />
Valleys Development Authority, Irrigation<br />
and Drainage, Addis Ababa.<br />
Hussain, I., Hanjra, M. A., (2004). Irrigation<br />
and Poverty Alleviation: Review Of The<br />
empirical Evidence. Irrig. and Drain. 53:<br />
1–15. DOI: 10.1002/ird.114.<br />
Judt, Ch., (2007). Impact <strong>of</strong> irrigation on<br />
livelihood and food security in the modern<br />
Hare river irrigation scheme in Southern<br />
Ethiopia, Diplomarbeit Universität Wien,<br />
Department für Ernährungswissenschaften,<br />
Fakultät für Lebenswissenschaften. (11)<br />
Kibret, Solomon, (2008) Entomological<br />
studies on the impact <strong>of</strong> a small-scale<br />
irrigation scheme on malaria transmission<br />
around Zeway, Central Ethiopia. MSc<br />
thesis Biomedical Sciences, Addis Ababa<br />
University Ethiopia (6)<br />
Madebo, Ashenafi, (2003). Design and water<br />
management to control malaria in Arba<br />
Minch, Ethiopia. MSc Thesis Soil and<br />
<strong>Water</strong>, Wageningen University, The<br />
Netherlands. (12)<br />
Ministry <strong>of</strong> <strong>Water</strong> Resources (2001). Data<br />
collected from different river basin<br />
development master plan studies. Planning<br />
and Projects Department, Ministry <strong>of</strong><br />
<strong>Water</strong> Resources, Addis Ababa, Ethiopia.<br />
National Meteorological Agency (2006).<br />
Meteorological Database, NMA, Addis<br />
Ababa, Ethiopia.<br />
OIDA (1991). Project Proposal Report for<br />
Indris Irrigation Project; RID-Office for<br />
C.Z., Oromia Irrigation Development<br />
Agency.<br />
Ruffeis, D., (2006a). EIA report <strong>of</strong> Godina and<br />
Goha Woriko irrigation schemes,<br />
unpublished project report, Austrian<br />
Research Centers, Seibersdorf, Austria. (3)<br />
Ruffeis, D., (2006b). EIA report <strong>of</strong> Indris<br />
irrigation system, unpublished project<br />
report, Austrian Research Centers,<br />
Seibersdorf, Austria. (7)<br />
Ruffeis, D., (2006c). EIA report <strong>of</strong> MfM<br />
schemes, unpublished project report,<br />
Austrian Research Centers, Seibersdorf,<br />
Austria. (8)<br />
Ruffeis, D., (2006d). EIA report <strong>of</strong> Hare<br />
irrigation system, unpublished project<br />
report, Austrian Research Centers,<br />
Seibersdorf, Austria. (12)<br />
Ruffeis, D., Loiskandl, W., Spendlingwimmer,<br />
R., Schönerklee, M., Awulachew, Seleshi<br />
B., Boelee, E., Wallner, K., (2007).<br />
Environmental impact analysis <strong>of</strong> two<br />
large scale irrigation schemes in Ethiopia.<br />
Paper presented at Symposium on Impacts<br />
<strong>of</strong> Irrigation on Poverty and Environment,<br />
Addis Ababa, Ethiopia, 26-29 November<br />
2007. (1), (9)<br />
United Nations (2005). UN Millennium<br />
Development Goals, Un Web Service<br />
Section, department <strong>of</strong> Public Information,<br />
http://www.un.org/millenniumgoals/.<br />
Wallner, K., (2006). Field Parameter<br />
Evaluation to Support Environmental<br />
Impact Analysis <strong>of</strong> Irrigation in Ethiopia,<br />
MSc. Thesis, <strong>Institute</strong> <strong>of</strong> Hydraulics and<br />
Rural <strong>Water</strong> <strong>Management</strong>, Department <strong>of</strong><br />
<strong>Water</strong>, Atmosphere and Environment,<br />
University <strong>of</strong> Natural Resources Applied<br />
Life Sciences, BOKU Vienna. (1), (7)<br />
Wagnew Ayalneh, M., (2004) Socio economic<br />
and environmental impact assessment <strong>of</strong><br />
community based small-scale irrigation in<br />
the Upper Awash Basin. A case study <strong>of</strong><br />
four community based irrigation schemes.<br />
Master Thesis at the school <strong>of</strong> graduate<br />
368
studies-environmental science, Addis<br />
Ababa University. (2)<br />
Werfring, A., (2004). Typology <strong>of</strong> Irrigation in<br />
Ethiopia, Master Thesis at the <strong>Institute</strong> <strong>of</strong><br />
Hydraulics and Rural <strong>Water</strong> <strong>Management</strong>,<br />
Universität für Bodenkultur Wien.<br />
Zewdie, Moltot, (2005). Environmental and<br />
Socio-economic Impact Assessment <strong>of</strong><br />
Irrigation Development at Amibara<br />
Irrigation Project II, Master Thesis Post<br />
Graduate Program Department Of<br />
Irrigation Engineering, Arbaminch<br />
University. (5)<br />
369
Environmental Impact Analysis <strong>of</strong> Two Large Scale Irrigation<br />
Schemes in Ethiopia<br />
D. Ruffeis 1 , W. Loiskandl 1 , R. Spendlingwimmer 2 , M. Schönerklee 2 , S.B. Awulachew 3 ,<br />
E. Boelee 3 , K. Wallner 1<br />
1<br />
University <strong>of</strong> Natural Resources and Applied Life Sciences, Department <strong>of</strong> <strong>Water</strong> - Atmosphere -<br />
Environment, <strong>Institute</strong> <strong>of</strong> Hydraulics and Rural <strong>Water</strong> <strong>Management</strong>, Vienna, Austria<br />
2<br />
Austrian Research Centers GmbH –ARC, Business Area <strong>Water</strong> Seibersdorf, Austria<br />
3<br />
<strong>International</strong> <strong>Water</strong> <strong>Management</strong> <strong>Institute</strong> IWMI-NBEA, Addis Ababa, Ethiopia<br />
Dominik.Ruffeis@boku.ac.at<br />
Abstract<br />
This article presents the finding <strong>of</strong> a study<br />
undertaken to assess the status-quo and<br />
significant environmental impacts <strong>of</strong> two<br />
selected large-scale irrigation on natural<br />
resources in Ethiopia. Main focus is on the<br />
environmental impacts <strong>of</strong> irrigation on natural<br />
resources with special emphasis on soil<br />
quality, water quality and downstream impacts,<br />
hydrology and potential interference with<br />
ecosystems. For this purpose two schemes<br />
were selected. Wonji/Shoa Sugar Plantation is<br />
located in the Upper Awash Basin and Finchaa<br />
Valley Sugar Estate located in the Blue Nile<br />
Basin.<br />
It is well known that irrigation projects can<br />
have several adverse environmental impacts<br />
that may threaten the sustainable production <strong>of</strong><br />
agricultural goods, which is <strong>of</strong> major<br />
importance and interest in Ethiopia since it<br />
contributes 44 percent to Ethiopia’s GDP,<br />
employs 80 percent <strong>of</strong> the labor force, and<br />
provides a livelihood to 85 percent <strong>of</strong> the<br />
nearly 80 million population (Awulachew,<br />
2006, Government <strong>of</strong> Ethiopia, 2006, UNDP,<br />
2006).<br />
Irrigation projects inter alia can have potential<br />
impacts on the hydrological characteristics <strong>of</strong><br />
aquifers, quality <strong>of</strong> downstream water bodies,<br />
quality <strong>of</strong> soils and ecosystems.<br />
The most prominent results and environmental<br />
impacts <strong>of</strong> the selected case study sites could<br />
be summarized as follows. In general the<br />
irrigation water is <strong>of</strong> good quality, but the<br />
electric conductivity is unfavorable to the<br />
adjusted sodium ratio, which leads in some<br />
instances to soil crusting and has a negative<br />
impact on infiltration rate. In Wonji/Shoa the<br />
groundwater table has risen due to improper<br />
irrigation management and seepage <strong>of</strong><br />
reservoirs. In Fincha a valuable ecosystem has<br />
been destroyed due to the establishment <strong>of</strong> the<br />
scheme and increased migration.<br />
Key words:<br />
Large-scale Irrigation / Environmental Impact /<br />
<strong>Water</strong> / Soil / Ecosystem / Ethiopia / Finchaa /<br />
Wonji/Shoa<br />
Introduction<br />
Under the title “Irrigation Infrastructures<br />
Development for Food Security and National<br />
Economic growth“ the Ethiopian government<br />
started an irrigation development program in<br />
order to meet the ambitious efforts <strong>of</strong> the 15<br />
years <strong>Water</strong> Sector Development Program,<br />
which is scheduled from 2002 until 2016. The<br />
investment in large-scale irrigation projects<br />
should guarantee to meet the demands for<br />
industrial raw materials for Agro-industries,<br />
cash crops and food crops. 26 medium and<br />
large-scale irrigation projects are planned to be<br />
implemented. Irrigation infrastructures in the<br />
country will more than double at the end <strong>of</strong> the<br />
program period, which is the year 2016<br />
(currently only 200,000ha, this will grow by<br />
275,000 ha). More recently, the irrigation<br />
sector development program is revised and the<br />
country has stepped up its efforts to bring<br />
additional irrigated area <strong>of</strong> 430,000 in five<br />
years, see MOFED PASDEP (2006)<br />
370
In Ethiopia, irrigation projects with command<br />
areas larger than 3000 ha are classified as large<br />
scale schemes according to MoWR (2002).<br />
Werfring et al (2005) distinguish between four<br />
different types <strong>of</strong> irrigation schemes in<br />
Ethiopia: traditional, modern communal,<br />
modern private and public. Most <strong>of</strong> the<br />
medium and large scale irrigation schemes are<br />
located in Oromia and Afar region<br />
respectively. According to Tilahun and Paulos<br />
(2004) 31.981 ha and 21.000 ha <strong>of</strong> irrigated<br />
land are classified as large or medium scale<br />
schemes in these regions. In total 61.057 ha are<br />
identified as large or medium scale irrigation<br />
schemes in Ethiopia.<br />
Since the Ethiopian Government has started to<br />
focus its development strategies on the<br />
extension <strong>of</strong> irrigated agriculture especially <strong>of</strong><br />
large scale projects during the last decade it<br />
has become more important to explore the<br />
nexus between irrigation investments,<br />
sustainable agricultural development and<br />
potential environmental impacts in the<br />
Ethiopian context. In Ethiopia very little<br />
information and baseline date are available<br />
regarding irrigation and its environmental<br />
implications. Hence research has to be<br />
undertaken to fill this knowledge gap.<br />
This article presents the finding <strong>of</strong> a study<br />
undertaken to assess the status-quo and<br />
significant environmental impacts <strong>of</strong> largescale<br />
irrigation in Ethiopia. The main focus <strong>of</strong><br />
this report is put on the environmental impacts<br />
<strong>of</strong> irrigation on natural resources with special<br />
emphasis on soil quality, water quality and<br />
downstream impacts, hydrology and potential<br />
interference with ecosystems.<br />
In several studies a number <strong>of</strong> different<br />
environmental impacts have been identified<br />
which are directly caused by irrigation<br />
projects. Sectoral guidelines to conduct<br />
environmental impact assessments <strong>of</strong> irrigation<br />
projects (e.g. FAO, MoWR) use checklists<br />
which include the pertinent environmental<br />
impacts. These potential impacts are grouped<br />
into impact categories such as economic,<br />
socio-economic, natural resource and<br />
ecological impacts. This article puts its focus<br />
on impacts on natural resources and<br />
ecosystems which are closely related to in-field<br />
impacts on soil, water quality, hydrological<br />
issues and destruction <strong>of</strong> ecosystems due to<br />
irrigation development. In Tab.1 some <strong>of</strong> the<br />
potentially significant adverse impacts are<br />
listed.<br />
<strong>Table</strong> 1: Typical environmental impacts <strong>of</strong> irrigation on natural resources<br />
Impact category Potential adverse impact Cause<br />
Hydrology<br />
Rise <strong>of</strong> local water table,<br />
<strong>Water</strong> logging, Changes to the low flow<br />
regime<br />
Improper irrigation management,<br />
Poor water distribution system<br />
Low irrigation efficiency, Seepage losses<br />
Quality <strong>of</strong> Pollution <strong>of</strong> soil, Toxicity <strong>of</strong> products Inadequate assessment <strong>of</strong> the quality <strong>of</strong><br />
irrigation source<br />
Downstream water<br />
quality<br />
Soil degradation &<br />
damage <strong>of</strong> soil<br />
structure & change<br />
<strong>of</strong> soil properties<br />
Ecosystem,<br />
<strong>Water</strong><br />
bodies,<br />
Pollution <strong>of</strong> downstream water bodies<br />
Alkalization<br />
Soil acidification<br />
Salinisation<br />
Reduction <strong>of</strong> fertility<br />
<strong>Water</strong> logging<br />
Erosion<br />
Creation <strong>of</strong> aquatic habitats<br />
Destruction <strong>of</strong> ecosystem within the<br />
supplied water<br />
Improper use <strong>of</strong> fertilizer and pesticides<br />
Quality <strong>of</strong> irrigation source<br />
Long term leaching,<br />
Improper use <strong>of</strong> fertilizer<br />
Saline groundwater,Saline irrigation water,<br />
Saline soils, Improper irrigation management,<br />
Insufficient drainage<br />
Intensive cultivation without additional<br />
amendments<br />
Improper irrigation management, Soil<br />
degradation, Raise <strong>of</strong> water table, Improper<br />
drainage<br />
Operation, Construction <strong>of</strong> the scheme<br />
Construction <strong>of</strong> reservoirs and canals<br />
Scheme construction<br />
371
Wetlands<br />
project area<br />
Eutrophication and pollution <strong>of</strong> water<br />
bodies, Change <strong>of</strong> return flows<br />
Destruction <strong>of</strong> ecosystem in the adjacent<br />
area <strong>of</strong> the project<br />
Reduced quality and amount <strong>of</strong> return flows<br />
Migration tendencies, Improper land use<br />
strategy<br />
Methodology<br />
Study area<br />
The study areas have been chosen for their<br />
diversity in terms <strong>of</strong> climatic conditions as<br />
well as soil types. Two large scale irrigation<br />
projects in Ethiopia were selected as case<br />
studies where primary and secondary were<br />
collected, Wonji/Shoa sugarcane plantation<br />
and Finchaa Valley Sugar Estate.<br />
The major predominant soil types in the area <strong>of</strong><br />
Wonji/Shoa sugarcane plantation are described<br />
as Fluvisols, Andosols and Laptosols<br />
according to FAO soil classification. Soils <strong>of</strong><br />
Wonji/Shoa are <strong>of</strong> alluvial-colluvial origin<br />
developed under hot, tropical conditions (Fig.<br />
1). In the region diverse soil types are observed<br />
which also vary in their production potential.<br />
(Ambachew et al, 2000). In general, soils <strong>of</strong><br />
Wonji/Shoa can be described as a complex <strong>of</strong><br />
grey cracking clays in the topographic<br />
depressions and semiarid brown soils. On the<br />
basis <strong>of</strong> texture they are categorized into light<br />
(coarse textured) soils and heavy soils (clayey<br />
black types) which are more common in<br />
Wonji/Shoa Sugarcane Plantation (Ambachew<br />
et al, 2000).<br />
The soils in Finchaa valley are made <strong>of</strong> alluvial<br />
and colluvial materials from the surrounding<br />
escarpments. Five major soil types can be<br />
found in the area <strong>of</strong> Finchaa Sugar Estate <strong>of</strong><br />
which Luvisols and Vertisols are predominant.<br />
These soils account for more than 95 percent<br />
<strong>of</strong> the cultivated and irrigated land. The<br />
irrigation scheme is divided by Finchaa River<br />
into East and West Bank (fig. 2). Currently<br />
only the West Bank is under cultivation, but<br />
the extension <strong>of</strong> the irrigated area to the East<br />
bank is planned.<br />
<strong>Table</strong> 2: General description <strong>of</strong> the selected case study sites<br />
Finchaa Valley<br />
Wonji/Shoa<br />
Size 8064 ha 7000 ha<br />
Location 9°30’-9°60’N; 37°10’- 8.40°N; 39.25°E<br />
37°30’E<br />
Altitude 1550 m 1540 m<br />
Date <strong>of</strong> 1995 1956<br />
Establishment<br />
Type Public, large scale irrigation Public, large scale irrigation<br />
<strong>Management</strong> Government Agency Government Agency<br />
Basin Blue Nile Basin Awash Basin<br />
<strong>Water</strong> source<br />
Lake Chomen, Finchaa River Awash River, Reservoir (reused water from<br />
factory)<br />
Diversion Pump Pump<br />
Irrigation Pump, Gravity, Sprinkler Gravity, Furrow,<br />
N/ETo (mm/y) 1300/1500 747/2519<br />
Agro-ecology Weyna Dega (1500-2300m) Weyna Dega (1500-2300m)<br />
Main crop Sugarcane (monoculture) Sugarcane (monoculture)<br />
Major<br />
Type<br />
Soil<br />
Luvisol<br />
Fluvisol<br />
372
Figure 1: Scheme layout <strong>of</strong> Wonji/Shoa Sugar Plantation<br />
Figure 2: Scheme layout <strong>of</strong> Finchaa Valley Sugar Estate<br />
Data Collection and Analysis<br />
Both secondary and primary field level data<br />
were collected. Secondary data included<br />
general description <strong>of</strong> the scheme, hydrological<br />
and meteorological relevant data, information<br />
about the topology and geological<br />
characteristics <strong>of</strong> the area and about irrigation<br />
infrastructure. Research and data collection<br />
have been conducted using the “with or<br />
without” and when ever possible the “before<br />
and after” approach comparing secondary and<br />
primary data sets. The availability <strong>of</strong><br />
373
secondary soil and water quality data in the<br />
two case studies allows, to some extent, impact<br />
analysis using the “before – after” approach.<br />
Whenever possible, baseline and secondary<br />
data <strong>of</strong> research documents have been<br />
collected.<br />
For data collection activities, specific data<br />
sheets have been designed for field level<br />
research as well as for secondary data<br />
collection.<br />
Because only few data or baseline data were<br />
available to compare time series data and carry<br />
out before and after type <strong>of</strong> analysis, soil<br />
samples were taken from non irrigated and<br />
irrigated fields but also from cultivated and<br />
uncultivated plots to assess potential impacts<br />
<strong>of</strong> irrigation on chemical and physical soil<br />
parameters. Disturbed soil samples were taken<br />
from the predominant soil types at different<br />
spots, depending on the accessibility and<br />
influence <strong>of</strong> irrigation on the spots, using the<br />
comparative soil sampling method. From each<br />
plot samples <strong>of</strong> different depth were taken,<br />
depending on the structure <strong>of</strong> the soil and the<br />
depth <strong>of</strong> soil horizons. Every soil horizon over<br />
10cm was sampled, at least from 0-30, 30-60<br />
and 60-90 cm depths (FAO 1986).<br />
<strong>Water</strong> samples were collected from the<br />
irrigation source and potentially influenced<br />
water bodies using 1 litre plastic bottles and<br />
immediately stored in a cooling box. As some<br />
parameters may change rapidly after sampling<br />
(e.g. Nitrate) the pH was brought down to 2 by<br />
adding acid (HNO 3 ) to the samples to stop<br />
chemical reactions. The samples were analyzed<br />
either using in-field measurements and tests or<br />
laboratory analysis. <strong>Water</strong> sampling locations<br />
were chosen based on the spatial variations in<br />
the water stream and irrigation system<br />
(irrigation sources, the distribution canals,<br />
reservoirs, the main drain and from<br />
downstream water bodies) in order to obtain a<br />
representative sample. In table 3 chemical and<br />
physical parameters are listed which had been<br />
analysed either in the field or using laboratory<br />
facilities.<br />
The standards and threshold values for water<br />
quality analysis were chose with respect to<br />
irrigation (FAO 1989). The widely accepted<br />
threshold values for classifying the suitability<br />
<strong>of</strong> water for irrigation are presented in table 4<br />
(FAO, 1998). The standards and threshold<br />
values for soil chemical and physical were<br />
taken from the Ethiopian Ministry <strong>of</strong> <strong>Water</strong><br />
Resources (2002).<br />
<strong>Table</strong> 3: Measured chemical and physical soil and water parameters<br />
Samples In-field measurement Laboratory Analysis - chemical & physical<br />
parameters<br />
Electric Conductivity pH, Electric Conductivity<br />
Temperature<br />
Cations: Na, Ca, Mg, K<br />
Nitrate Anions: SO 4 , PO 4<br />
<strong>Water</strong><br />
pH<br />
Toxic substances B, Cl<br />
Nitrogen: NH 4 -N, NO 3<br />
Alkalinity (CO 3 +HCO 3 )<br />
Trace elements Fe, Mn<br />
SAR, adj. RNa<br />
Pr<strong>of</strong>ile<br />
Pit Particle size distribution <strong>of</strong> silt, clay, sand, soil<br />
investigation<br />
texture<br />
Soil<br />
pH, Electric Conductivity<br />
Nutrients: Na, K, Ca, Mg, P, tot N, Fe, Mn<br />
CEC, ESP, BSP<br />
Organic Matter, Nitrate<br />
Results and Discussion<br />
Wonji/Shoa Sugar Plantation - <strong>Water</strong><br />
Quality Anylsis<br />
In general the irrigation water used in<br />
Wonji/Shoa Sugar Plantation is <strong>of</strong> high quality.<br />
374
Hardly any adverse impacts on the soil quality<br />
resulting from irrigation activities are to be<br />
expected on this scheme. However SAR/adj<br />
R Na to EC ratio (fig. 3) indicates that a slight<br />
to moderate reduction in the infiltration rate<br />
might occur. Low salinity water (< 500 µS/cm)<br />
is corrosive and tends to leach surface soils<br />
free <strong>of</strong> soluble minerals and salts (FAO 29,<br />
1989). The EC value <strong>of</strong> Awash River, the<br />
irrigation water source <strong>of</strong> Wonji/Shoa, is 293<br />
µS/cm. The tested soils show an EC from 151<br />
to 475 µS/cm and can be rated as salt free<br />
according to the Eth. Ministry <strong>of</strong> <strong>Water</strong><br />
Resources (2002). The absence <strong>of</strong> salt in the<br />
soil indicates an ongoing dispersion process<br />
which leads to sealing <strong>of</strong> the soil and thus<br />
reduces the soils infiltration rate (FAO, 1989).<br />
During the field study and the analysis in a soil<br />
pit destruction <strong>of</strong> the natural structure <strong>of</strong> the<br />
soil in some places could be observed. To a<br />
certain extent this destruction <strong>of</strong> the soil<br />
structure might be due to unfavourable SAR<br />
values and SAR/adj R Na to EC ratio in the<br />
irrigation water <strong>of</strong> some <strong>of</strong> the water samples.<br />
Moreover soil tillage with heavy machines<br />
might also have destructive effects on the soil<br />
structure, particularly where waterlogging and<br />
high water tables occur.<br />
Girma A. (2005) states that in most sugarcane<br />
fields <strong>of</strong> Wonji/Shoa slight to moderate soil<br />
infiltration problems are expected if<br />
groundwater occurs at shallow depths. In this<br />
regard, the groundwater depth was at all the<br />
times too shallow (in the root zone) for nearly<br />
all sugarcane fields considered in this study.<br />
This indicates that in Wonji/Shoa, sugarcane<br />
fields are prone to waterlogging and physical<br />
degradation <strong>of</strong> topsoil. Drainage water and<br />
factory used water are stored in reservoirs and<br />
reused for irrigation, therefore it is <strong>of</strong> major<br />
importance to monitor the quality <strong>of</strong> this<br />
irrigation source. The drainage water and the<br />
reservoir water shows EC values increased<br />
values compared to the irrigation water, 357<br />
and 388 µS/cm respectively. With regard to<br />
salinity the water is still <strong>of</strong> very good quality<br />
and should not pose any problems on soils in<br />
case it is reused for irrigation. These findings<br />
are confirmed by the study conducted on<br />
irrigation water quality by Girma A. (2005).<br />
Irrigation water (i.e. Awash River water) and<br />
factory used water were free <strong>of</strong> potential<br />
hazards <strong>of</strong> salinity, sodicity and specific ion<br />
toxicities. Moreover, drainage water was<br />
nearly <strong>of</strong> similar quality. As pointed out in the<br />
previous section this could cause from slight to<br />
moderate problems regarding infiltration. The<br />
total salt content <strong>of</strong> groundwater for some<br />
sugarcane fields was relatively high (i.e., EC<br />
values exceeded 700 µS/cm); a critical limit<br />
above which osmotic effects are known to<br />
occur. SAR values (fig. 3) were low in all<br />
groundwater samples. The potentially toxic<br />
ions Na + , Cl - and Boron were also found at low<br />
concentrations.<br />
The values for the pH <strong>of</strong> Wonji/Shoa irrigation<br />
system are in the normal/neutral range<br />
(pH = 6.5 to 8.5) for all water samples. Only<br />
the drainage water shows a lower pH <strong>of</strong> 6.3<br />
which indicates slightly acidic water.<br />
Generally the pH in all the water samples taken<br />
does not seem to be influenced by irrigation.<br />
Similar results are given by Girma A. (2005).<br />
The measured pH values <strong>of</strong> both irrigation<br />
water and Factory used water samples varied<br />
from 7.4 to 8.1 (from near neutrality to<br />
medium basic in reaction). pH values <strong>of</strong><br />
drainage water samples varied from 7.0 to 7.8<br />
(normal range). All groundwater samples<br />
varied in pH values from 7.1 to 8.3.<br />
The highest values for chloride and boron are<br />
3.6 meq/l and 0.45 meq/l respectively.<br />
Therefore the threshold values from no<br />
restriction on use to slight to moderate<br />
restriction on use (4 meq/l for chloride, 7 mg/l<br />
for boron) were not obtained by any <strong>of</strong> the<br />
water samples.<br />
375
Figure 3: Effect on Infiltration rate due to Sodicity <strong>of</strong> sampled water sources (Wonji/Shoa Sugar<br />
Plantation)<br />
Wonji/Shoa Sugar Plantation - Soil Quality<br />
Analysis<br />
As mentioned the tested soils show an EC from<br />
151 to 475 µS/cm and can be rated as salt free<br />
according to the Eth. Ministry <strong>of</strong> <strong>Water</strong><br />
Resources (2002).<br />
The pH <strong>of</strong> all soil samples ranges from 7.4 to<br />
8.4 indicating moderately alkaline soils which<br />
is typical for soils <strong>of</strong> these climates (dry, arid<br />
climate most <strong>of</strong> the year). This indicates low<br />
availability <strong>of</strong> phosphorus and other micronutrients<br />
(MoWR, 2002).<br />
With a CEC from 46.2 to 58.4 meq/100g the<br />
soil samples are all in the range <strong>of</strong> very high<br />
CEC, according to the ratings <strong>of</strong> the Ethiopian<br />
Ministry <strong>of</strong> <strong>Water</strong> Resources (2002). This<br />
indicates good agricultural soil. The BSP,<br />
ranging from 62.6 to 96.65% can be rated as<br />
high for almost all soil samples which<br />
indicates a high fertility <strong>of</strong> the soil. The ESP <strong>of</strong><br />
the soils lies below 6% (0.99 to 5.88%) which<br />
is definitely below the threshold <strong>of</strong> 15% and<br />
therefore the soils can be rated as non sodic.<br />
Decreases in yield would only be expected for<br />
extremely sensitive crops (ESP = 2–10) but not<br />
for sugar cane.<br />
The content <strong>of</strong> total Nitrogen can be rated as<br />
high for all soils (ranging from 0.071 to<br />
0.114%). The rating for Potassium is high and<br />
very high for all soil samples ranging from<br />
1.08 to 2.63 for irrigated land and from 3.68 to<br />
4.05 for the virgin soil. The comparison <strong>of</strong><br />
irrigated soils and non-irrigated virgin soil<br />
shows that the content <strong>of</strong> Potassium is much<br />
higher in the virgin soil (4.05 meq/100g). The<br />
distribution <strong>of</strong> some parameters over the soil<br />
depth does not seem to be natural anymore for<br />
the cultivated soil. In general there are hardly<br />
any obvious differences between irrigated soils<br />
and the virgin reference soil as far as the<br />
chemical properties are concerned. The reason<br />
might be that the irrigation water has a very<br />
good quality and therefore no severe impacts<br />
on the soil are to be expected. A possible<br />
decline or even lack in nutrients is<br />
compensated through fertilizer application or<br />
other soil fertility management practices. The<br />
virgin soil might also be influenced by<br />
irrigation through capillary rise <strong>of</strong> the<br />
groundwater or surface run<strong>of</strong>f <strong>of</strong> the irrigated<br />
376
fields and therefore not be perfectly virgin<br />
anymore.<br />
The content <strong>of</strong> Calcium is high and very high<br />
in all soil samples, ranging from 18.32 to 40.72<br />
meq/100g soil. The same applies for<br />
Magnesium ranging from 4.94 to 12.36<br />
meq/100g soil.<br />
The content <strong>of</strong> organic carbon <strong>of</strong> all soil<br />
ranges from 0.76 to 1.88 % and can be rated as<br />
very low in all the soil samples. This indicates<br />
that without application <strong>of</strong> fertilizers no<br />
adequate yields would be achieved.<br />
Wonji/Shoa Sugar Plantation -<br />
Groundwater Hydrology<br />
In Wonji problems due to irrigation are<br />
reported with regard to waterlogging. The<br />
ground water level within the sugar estate<br />
shows a rising tendency (observation 1999-<br />
2001, fig. 4). However, not only within the<br />
sugar cane plantation but in the whole region a<br />
rise <strong>of</strong> the water table has been reported<br />
(Teshome, 1999). This might be due to<br />
irrigation (seepage losses out <strong>of</strong> reservoirs and<br />
channels, over watering, etc) but also due to<br />
seepage losses in a great extent from the Lake<br />
Koka reservoir. The water <strong>of</strong> the Awash River<br />
is retained by Koka dam. The dam was built to<br />
assure a constant discharge in the Awash River<br />
for two hydropower stations, but it also<br />
guarantees sufficient irrigation water supply.<br />
What has been reported before and confirmed<br />
in the field work are problems with a high<br />
water table and waterlogged fields. Especially<br />
on fields with heavy clayey soils problems<br />
with waterlogging have been discovered<br />
during the field study and the analysis in a soil<br />
pit (Wallner, 2006). However, the lighter soils<br />
– light in relation to the heavy soils <strong>of</strong> the<br />
sugar estate - seem to be <strong>of</strong> very good quality<br />
and not prone to negative impacts <strong>of</strong> irrigation<br />
under the given conditions.<br />
In 2002 a study on groundwater level<br />
fluctuation at Wonji/Shoa sugarcane plantation<br />
was conducted by Habib D. Investigations<br />
showed that on some fields the groundwater<br />
table is less than one meter deep (ARS Annual<br />
Report, 1994). The same report indicated that<br />
in some fields downward percolation <strong>of</strong><br />
irrigation water below the root zone, especially<br />
in soils classified as heavy black soils is so<br />
slow that it caused temporary storage within<br />
the root zone (in some places up to 10 days<br />
after irrigation). These drainage problems have<br />
even become one <strong>of</strong> the major factors in<br />
determining the composition <strong>of</strong> cane variety<br />
(Tariku, 2001). In fields located near<br />
reservoirs, irrigation canals and drains<br />
suppressed cane growth due to seepage and<br />
ground water table rise could be observed.<br />
Kediru (1997) stated that cane loss due to this<br />
problem is economically significant.<br />
In 1998/99 a study was started in Wonji/Shoa<br />
Sugar Plantation to measure the groundwater<br />
level (GWL) fluctuation with piezometers<br />
installed in different plantation fields.<br />
Piezometers were installed at different<br />
locations near reservoirs, distribution canals<br />
and drains. One piezometer was installed in a<br />
non-irrigated area as reference (WRS).<br />
In figure 4 groundwater tables <strong>of</strong> 4 different<br />
fields (G 1 , G 2 , G 3 and G 4 ) and the reference<br />
field (WRS) are displayed for 3 years (1999-<br />
2001). Measurements are given in depth in cm<br />
from soil surface. The measurement <strong>of</strong><br />
groundwater table <strong>of</strong> the reference area (WRS)<br />
shows the maximum water table depth values<br />
in all years and months.<br />
The results indicate that fields which are<br />
located near reservoirs are affected by rising<br />
ground water level more than fields nearby<br />
distribution canals and fields nearby drains.<br />
Even this short measurement time series <strong>of</strong><br />
1999 to 2001 shows significant increasing<br />
trends <strong>of</strong> rising groundwater table. Fields near<br />
reservoirs (G1) are most affected. Habib<br />
(2002) concludes that seepage from reservoirs<br />
and unlined irrigation canals is the reason for<br />
rising groundwater level. Near drains (G3)<br />
groundwater levels are significantly lower<br />
compared to the measurements near the<br />
reservoirs. This result shows that drains if<br />
effectively utilized can lower the ground water<br />
table. In the reference area GWL was rising the<br />
first year but decreasing the second year.<br />
Furthermore the GWL is generally at least<br />
50cm deeper compared to the GWL <strong>of</strong> the<br />
irrigated fields.<br />
Three years <strong>of</strong> GWL measurement reveal that<br />
fields near reservoirs are highly affected by<br />
waterlogging followed by fields near unlined<br />
distribution canals, fields away from water<br />
bodies and fields near by drains. The water<br />
level is increasing from year to year.<br />
Moreover, with the exception <strong>of</strong> fields near<br />
drains the GWL <strong>of</strong> other fields is less than 60<br />
377
cm for more than 6 months per year which has<br />
a negative effect on sugar production.<br />
Figure 4: Trends in the ground water level at Wonji/Shoa sugar plantation over three years (Habib,<br />
2002)<br />
Depth (cm)<br />
0<br />
50<br />
100<br />
150<br />
200<br />
250<br />
Trends GW-Fluctuation<br />
Jan 99<br />
Mar 99<br />
May 99<br />
July 99<br />
Sept 99<br />
Nov 99<br />
Jan 00<br />
Mar 00<br />
May 00<br />
July 00<br />
Sept 00<br />
Nov 00<br />
Jan 01<br />
Mar 01<br />
May 01<br />
July 01<br />
Sept 01<br />
Nov 01<br />
WRS<br />
Mean G1<br />
Mean G2<br />
Mean G3<br />
Mean G4<br />
Linear (WRS)<br />
Linear (Mean G3)<br />
Linear (Mean G4)<br />
Linear (Mean G2)<br />
Linear (Mean G1)<br />
300<br />
improvement or at least maintenance <strong>of</strong> the<br />
waste water treatment plant is required.<br />
Finchaa Valley Sugar Estate - <strong>Water</strong><br />
Quality Analysis<br />
<strong>Water</strong> quality, regarding the physical as well as<br />
chemical parameters, <strong>of</strong> Finchaa Valley Sugar<br />
Estate can be rated as very good for irrigation<br />
purposes. However, the increase <strong>of</strong> the EC<br />
value <strong>of</strong> Finchaa River from 96 µS/cm<br />
measured in the upstream area <strong>of</strong> the scheme to<br />
121 µS/cm in the downstream area shows the<br />
impact <strong>of</strong> irrigation on the downstream water<br />
bodies. This value does not include the indirect<br />
impact <strong>of</strong> irrigation by releasing pollutants by<br />
the sugar factory because the outlet <strong>of</strong> the<br />
factory was closed while EC measurements<br />
were taken. The observation made during the<br />
field visit indicates that the obvious<br />
malfunction <strong>of</strong> the waste water treatment plant<br />
<strong>of</strong> the factory poses a threat to downstream<br />
water bodies especially to Finchaa River and<br />
its ecosystem. Further investigations are<br />
necessary to investigate into the potential<br />
impact <strong>of</strong> the factory and the scheme on<br />
downstream users. Additionally an<br />
The values <strong>of</strong> the EC measurement in the field<br />
are all below the threshold value <strong>of</strong> non saline<br />
to slightly and moderate saline <strong>of</strong> 700µS/cm<br />
given by FAO (1989). This indicates no<br />
problems with salinity caused by the available<br />
water source. A detailed analysis <strong>of</strong> the EC<br />
Values <strong>of</strong> different water bodies in the adjacent<br />
area <strong>of</strong> the estate provides a deeper insight in<br />
the hydrological system <strong>of</strong> the irrigation<br />
scheme (fig. 5). The EC value <strong>of</strong> Lake Chomen<br />
(Finchaa Dam) is 96 µS/cm. The groundwater<br />
samples show slightly increased EC values <strong>of</strong><br />
352 and 477 µS/cm due to accumulation <strong>of</strong><br />
salts in the aquifer. Fig. 5 shows the EC values<br />
<strong>of</strong> different water bodies within the irrigation<br />
scheme from upstream to downstream area <strong>of</strong><br />
Finchaa Sugar Estate. As mentioned before the<br />
EC value <strong>of</strong> the reservoir is 96µS/cm and<br />
88µS/cm for Korke River one <strong>of</strong> the tributaries<br />
<strong>of</strong> Finchaa River in the far upstream area <strong>of</strong> the<br />
scheme. Finchaa River drains Lake Chomen to<br />
the Blue Nile Basin and therefore has the same<br />
EC values. The assumption can be made that<br />
the natural EC value <strong>of</strong> surface water bodies in<br />
Finchaa Valley Area is below 100 µS/cm. The<br />
EC values <strong>of</strong> the drainage water (164µS/cm)<br />
and <strong>of</strong> tributaries <strong>of</strong> Finchaa River, e.g.<br />
378
Agemsa River (286µS/cm) which are located<br />
further downstream <strong>of</strong> the estate are much<br />
higher compared to the values in the upstream<br />
area. This fact together with the increased EC<br />
value <strong>of</strong> Finchaa River (121µS/cm) measured<br />
at a location downstream <strong>of</strong> the irrigated fields<br />
indicates that the tributaries <strong>of</strong> Finchaa River<br />
crossing the irrigated area serve as the natural<br />
drainage system <strong>of</strong> the sugar farm. The<br />
increasing EC value <strong>of</strong> Finchaa River makes<br />
the impact <strong>of</strong> irrigation on downstream water<br />
bodies clearly visible. Drainage waters as well<br />
as surface run-<strong>of</strong>f water possibly mixed with<br />
agrochemicals affect the water quality <strong>of</strong> the<br />
natural water resources in the adjacent area <strong>of</strong><br />
the scheme.<br />
Figure 5: EC values <strong>of</strong> different water bodies from upstream to downstream areas at Finchaa Valley<br />
Sugar Estate<br />
The ratio <strong>of</strong> adj R Na to EC (fig. 6) <strong>of</strong> the<br />
irrigation water source indicates a risk <strong>of</strong><br />
severe reduction <strong>of</strong> the infiltration rate over<br />
time. This imposed sodicity has the potential to<br />
destroy the soil structure and lead to soil<br />
crusting <strong>of</strong> the affected soil especially when<br />
EC value is low (96 µS/cm). The dispersive<br />
effects adversely influence the physical<br />
properties, e.g. infiltration rate, aggregate<br />
stability <strong>of</strong> the soil (FAO, 1989). The extent <strong>of</strong><br />
the impact highly depends on the texture and<br />
clay-sized particles <strong>of</strong> the soil.<br />
Since the filling <strong>of</strong> smaller pore space, sealing<br />
the soil surface and therefore reduces<br />
infiltration rates, by dispersion <strong>of</strong> finer soil<br />
particles is more likely to happen in soils with<br />
high clay content impact on Luvisols which<br />
can be classified as sandy loam to sandy clay<br />
loam with sand content over 60 % might prove<br />
to be less severe compared to the impact on<br />
Vertisols with clay content up to 60 %.<br />
379
Figure 6: Effect on Infiltration rate due to Sodicity <strong>of</strong> sampled water sources (Finchaa Valley Sugar<br />
Estate)<br />
As salinity <strong>of</strong> both applied water and the soil<br />
solution is relatively low no further swelling<br />
and dispersion <strong>of</strong> clay minerals are to be<br />
expected caused by the water source.<br />
The threshold values for chloride from no<br />
restriction on use to slight to moderate<br />
restriction on use <strong>of</strong> 4meq/l are not obtained by<br />
any <strong>of</strong> the water samples. The SAR rating for<br />
slight to moderate restriction on use ranging<br />
from 3 to 9 neither is obtained using the SAR<br />
values nor the values for adj R Na . Therefore no<br />
toxic effects on plants due to irrigation are to<br />
be expected.<br />
Finchaa Valley Sugar Estate - Soil Quality<br />
Analysis<br />
The comparison <strong>of</strong> the collected primary and<br />
secondary soil texture data for Luvisols show<br />
differences related to the proportion <strong>of</strong> sand,<br />
silt and clay content. The primary data show a<br />
lower sand content for the upper soil and a<br />
higher sand content for the lower soil part and<br />
vice versa for the clay content which indicates<br />
a shifting and relocation <strong>of</strong> soil particles<br />
especially <strong>of</strong> the sand fraction. A possible<br />
reason could be found in mechanized soil<br />
tillage. The silt content <strong>of</strong> the primary data<br />
sample is twice as low as it is for the secondary<br />
data sample. This ongoing process might lead<br />
to accumulation <strong>of</strong> clay particles in the topsoil<br />
layers and therefore aggravate the gradual<br />
degradation <strong>of</strong> the soil structure by induced<br />
sodicity.<br />
The EC values <strong>of</strong> all analysed soils range from<br />
10 to 60 µS/cm which is far below the<br />
threshold value <strong>of</strong> 4 dS/m (= 4000 µS/cm).<br />
Therefore they are not affected by salinisation.<br />
According to the Eth. Ministry <strong>of</strong> <strong>Water</strong><br />
Resources (2002) the samples can be rated as<br />
non saline. The EC value <strong>of</strong> the reference soil<br />
<strong>of</strong> the upper 30 cm is double <strong>of</strong> the value <strong>of</strong> the<br />
irrigated plots. This could be an indication for<br />
an ongoing leaching process caused by the<br />
application <strong>of</strong> water.<br />
Secondary EC values <strong>of</strong> all analysed soil<br />
types are far below the threshold value <strong>of</strong> 4<br />
dS/m (= 4000 µS/cm). The EC value <strong>of</strong> during<br />
the state farm cultivated Vertisols in the East<br />
Bank area is significantly higher than the<br />
uncultivated Vertisols <strong>of</strong> the West Bank. This<br />
might indicate an accumulation <strong>of</strong> salts in the<br />
rain fed cultivated soil with insufficient<br />
leaching by precipitation.<br />
380
In general pH values <strong>of</strong> sampled irrigated<br />
Luvisols are very acidic to moderately acidic<br />
with values ranging from 4.89 to 5.62 from<br />
deeper to shallower soil depths respectively.<br />
The pH value <strong>of</strong> non-irrigated reference soils<br />
ranges from 4.56 to 4.86. Significant changes<br />
in soil pH values comparing secondary and<br />
primary data for Luvisols could not be<br />
observed. All measured values show slightly<br />
acidic tendencies, which is common for soils<br />
developed under these climatic conditions.<br />
Secondary data show that the pH <strong>of</strong> Vertisols<br />
in Finchaa Valley is higher compared to<br />
Luvisols. The measurements however show<br />
lower values for the uncultivated Vertisols (pH<br />
6.13 - 6.5) than for the during the state farm<br />
period cultivated Vertisols (pH 6.9 - 7.37) with<br />
increasing trend for increasing soil depths.<br />
This difference between secondary and<br />
primary data might be an indicator for ongoing<br />
decline <strong>of</strong> soil pH due to irrigation and<br />
agrochemical use within the sugar estate.<br />
Washed-out-soils tend to acidification. <strong>Water</strong><br />
dominated soils (soils <strong>of</strong> humid regions) have<br />
low values <strong>of</strong> pH, because their content <strong>of</strong><br />
organic and carbonic acids is <strong>of</strong>ten subject to<br />
replenishing and recharge by rainfall. Under<br />
these conditions, the acids attack minerals,<br />
producing more acidity (Mirsal, 2004).<br />
Therefore washed-out-soils tend to<br />
acidification. According to the rating <strong>of</strong> pH<br />
values given by the Ethiopian Ministry <strong>of</strong><br />
<strong>Water</strong> Resources Al and Mn will be toxic if<br />
present in very acidic soils. Ca, Mg and Mb<br />
may be deficient and the availability <strong>of</strong><br />
phosphorus is low in the presence <strong>of</strong> free Al<br />
and Fe. Nitrification <strong>of</strong> organic matter is taking<br />
place. In moderately acidic soils P, Ca, Mg and<br />
Mb may be deficient. Fertilizers (ammonium<br />
sulphate and triple super phosphate) which<br />
may increase the acidity should be avoided<br />
(MoWR, 2002).<br />
The CEC values <strong>of</strong> the tested Luvisols (14.02<br />
to 14.56 meq/100g) indicate low to medium<br />
response to fertilizer application which is<br />
typical for soils with low clay content. Low<br />
CEC values can be caused by losses resulting<br />
from leaching-out, especially sodium (Na) is<br />
highly exposed to this process (MoWR, 2002).<br />
The CEC <strong>of</strong> Vertisols (23.95 and 26.54<br />
meq/100g) however shows a different picture.<br />
The CEC shows an increasing trend with<br />
increasing soil depths. As the clay content <strong>of</strong><br />
this soil type is significantly higher, the<br />
response to fertilizer application is more<br />
effective. This makes it even more important to<br />
plan agrochemical management for each soil<br />
type differently. The reference soil however<br />
shows a contrariwise tendency with a CEC<br />
value <strong>of</strong> 24.87 meq/100g in the upper 30 cm <strong>of</strong><br />
soil depth and 15.52 meq/100g below 60 cm.<br />
The primary data <strong>of</strong> the year 2006 confirm the<br />
findings <strong>of</strong> the feasibility study conducted in<br />
the pre-design phase <strong>of</strong> the irrigation scheme.<br />
Proper management <strong>of</strong> agrochemicals is<br />
indispensable to avoid contamination <strong>of</strong><br />
Finchaa valley aquifers.<br />
The BSP <strong>of</strong> the two sampling spots ranging<br />
from 55.0 to 74.0 % and from 51.0 to 67.0 %<br />
respectively can be rated as medium to high.<br />
This fact indicates a medium to high fertility <strong>of</strong><br />
the soil. The reference soils BSP values are<br />
between 37.0 to 56.0 %. Therefore the soil can<br />
be rated as medium fertile with lower values<br />
compared to the other tested soils and<br />
increasing values with depth.<br />
None <strong>of</strong> the measured ESP values <strong>of</strong> the tested<br />
soils exceeds the threshold value <strong>of</strong> 15 % and<br />
can therefore be rated as none sodic soil (FAO,<br />
1988).<br />
With regard to CEC and ESP only secondary<br />
data <strong>of</strong> Finchaa West Bank area were<br />
available. From the CEC values the difference<br />
in soil fertility <strong>of</strong> Luvisols and Vertisols can be<br />
clearly seen (fig. 7). With a CEC value higher<br />
than 52 meq/100g the Vertisols are in the range<br />
<strong>of</strong> very high CEC according to the ratings <strong>of</strong><br />
the Ethiopian Ministry <strong>of</strong> <strong>Water</strong> Resources<br />
(2002). The data for Luvisols however show<br />
medium to high CEC values ranging between<br />
21.55 and 28.99 meq/100g. The areas where<br />
the field work in 2006 was conducted show<br />
CEC values ranging from approximately 25.0<br />
meq/100g for the Luvisols cultivated and<br />
irrigated since the establishment <strong>of</strong> the Finchaa<br />
Sugar Estate, which is comparable to values <strong>of</strong><br />
the uncultivated Luvisols, and below 15.0<br />
meq/100g for the Luvisols which have been<br />
cultivated since 1975 and irrigated since 1998.<br />
This makes the long-term process <strong>of</strong> soil<br />
degradation visible induced by agriculture and<br />
especially by irrigation. Minor to major<br />
amendments might be required for the<br />
Luvisols, however the soil might show only<br />
moderate to poor response to fertilizer<br />
application (MoWR, 2002).<br />
None <strong>of</strong> the measured ESP values <strong>of</strong> the tested<br />
soils neither for Luvisols nor for Vertisols<br />
exceeds the threshold value <strong>of</strong> 15 % and can<br />
381
therefore be rated as none-sodic soil (FAO<br />
1988).<br />
The BSP ranging from 36.36 to 50.16 % (Lc<br />
West Bank), 40.67 to 57.38 % (Lc East Bank)<br />
and from 42.98 to 52.55 % (Ve West Bank)<br />
can be rated as medium. Only the BSP from<br />
the Vertisols which can be found on the East<br />
Bank can be classified as high with values<br />
ranging from 59.47 to 67.02 %. This fact<br />
indicates a medium fertility <strong>of</strong> the Luvisols in<br />
general and the Vertisols <strong>of</strong> the West Bank.<br />
The Vertisols <strong>of</strong> the East Bank are however<br />
characterised by high soil fertility related to the<br />
measured BSP values.<br />
The content <strong>of</strong> total Nitrogen <strong>of</strong> the tested<br />
soils can be rated as high for all tested soils<br />
(ranging from 0.05 to 0.14%). The total<br />
nitrogen content <strong>of</strong> the uncultivated reference<br />
soil is significantly lower compared to the<br />
irrigated plots.<br />
The rating for Potassium is low for all samples<br />
ranging from 0.2 to 0.27 meq/100g soil except<br />
the value <strong>of</strong> the topsoil <strong>of</strong> the non-irrigated plot<br />
which shows a medium content <strong>of</strong> Potassium<br />
(0.48 meq/100g soil).<br />
The content <strong>of</strong> Calcium is medium (5.18 to 9.5<br />
meq/100g soil) for the irrigated soil and low<br />
(3.36 to 4.99 meq/100g soil) for the non<br />
irrigated plot.<br />
The tested soils show a high content <strong>of</strong><br />
Magnesium.<br />
The results show very clearly the naturally low<br />
content <strong>of</strong> available phosphorus in the<br />
reference soil (fig. 8) which makes the<br />
application <strong>of</strong> agrochemicals necessary in<br />
order to achieve high crop yields. It is stated<br />
that in moderately acidic soils P may be<br />
deficient which is true in this case,<br />
nevertheless fertilizers (ammonium sulphate<br />
and triple super phosphate) which may<br />
increase the acidity should be avoided<br />
(MoWR, 2002). The content <strong>of</strong> available P<br />
(29.2 mg/kg) is only high within the first 30<br />
cm <strong>of</strong> soil depth for sampling point F 1.<br />
According to the statement <strong>of</strong> a staff member<br />
<strong>of</strong> the Sugar Estate DAP had been applied to<br />
plot F 1 shortly before the field work was<br />
conducted. Obviously phosphorus is not<br />
leached to lower soil depth as its content in 30-<br />
90 cm is significantly lower.<br />
Figure 7: Cation Exchange Capacity <strong>of</strong> soil samples <strong>of</strong> Finchaa Valley Sugar Estate – Secondary Data<br />
The secondary data show that the content <strong>of</strong><br />
total Nitrogen <strong>of</strong> the Luvisols and Vertisols <strong>of</strong><br />
West and East Bank can be rated as high for all<br />
soils (ranging from 0.05 to 0.27%). The<br />
content <strong>of</strong> total nitrogen in the cultivated<br />
Vertisols is significantly higher (0.27%)<br />
compared to the other tested soils. The content<br />
<strong>of</strong> total nitrogen in the uncultivated Luvisols<br />
(West and East Bank) is similar compared to<br />
the content <strong>of</strong> the irrigated soils.<br />
The rating for Potassium <strong>of</strong> the Luvisols is<br />
medium (West Bank and East Bank; lower soil<br />
parts) to high (East Bank; upper soil parts)<br />
whereas the rating for K <strong>of</strong> irrigated Luvisols<br />
is low. The tested Vertisols in both areas show<br />
higher contents <strong>of</strong> K and can be rated as high.<br />
The formerly cultivated Vertisols <strong>of</strong> the East<br />
Bank have a significantly higher K content<br />
382
compared to the uncultivated Vertisols <strong>of</strong> the<br />
West Bank.<br />
The content <strong>of</strong> Calcium is medium for the<br />
tested Luvisols and high to very high for the<br />
Vertisols in both areas. The Ca values <strong>of</strong> the<br />
formerly cultivated Luvisols <strong>of</strong> the East bank<br />
are higher compared to the Luvisols <strong>of</strong> the<br />
West Bank which were uncultivated at that<br />
point <strong>of</strong> time. The Ca content <strong>of</strong> the tested<br />
Vertisols <strong>of</strong> the West and the East Bank are<br />
more or less similar ranging from 18.3 to 21.8<br />
meq/100g but are higher compared to the<br />
highest Ca content <strong>of</strong> tested Luvisols (10.15<br />
meq/100g; Luvisols, East Bank; topsoil).<br />
The Magnesium content ranges from 2.32 to<br />
4.36 meq/100g for Luvisols <strong>of</strong> East and West<br />
Bank and East Bank Vertisols. The Mg value<br />
for Vertisols <strong>of</strong> the East Bank is slightly higher<br />
with a content <strong>of</strong> 6.12 meq/100g in the topsoil.<br />
The content <strong>of</strong> Mg in all soils can be rated as<br />
high, except the content in the topsoil <strong>of</strong> the<br />
West Bank Vertisols which can be rated as<br />
medium. The analysis results <strong>of</strong> the primary<br />
and secondary data show similar Mg contents<br />
for irrigated and non-irrigated Luvisols.<br />
The analysis <strong>of</strong> organic content and<br />
comparison <strong>of</strong> primary and secondary data<br />
reveals an ongoing soil degradation process<br />
caused by intensive sugar cane monoculture.<br />
The comparison <strong>of</strong> the organic carbon content<br />
<strong>of</strong> uncultivated, cultivated and irrigated areas<br />
shows a decreasing trend <strong>of</strong> naturally low<br />
organic carbon content <strong>of</strong> the tested soil types.<br />
Two reasons can be spotted as potential causes<br />
for this trend. Soil degradation which is caused<br />
by intensive agricultural production <strong>of</strong> sugar<br />
cane monoculture might be one reason. The<br />
low content <strong>of</strong> organic carbon can also be<br />
explained by the low natural pH value <strong>of</strong> the<br />
soil. The nitrification process <strong>of</strong> organic<br />
carbon which is typical for these soils and<br />
climatic conditions could be the direct cause<br />
for the very low organic carbon content <strong>of</strong> the<br />
tested soils. However, this makes fertilizers<br />
application necessary to achieve adequate<br />
yields which additionally spells the risk <strong>of</strong><br />
groundwater pollution by agrochemicals.<br />
Figure 8: Content <strong>of</strong> available Phosphorus <strong>of</strong> soil samples <strong>of</strong> Finchaa Valley Sugar Estate<br />
Available P<br />
30<br />
mg/kg Soil<br />
25<br />
20<br />
15<br />
10<br />
5<br />
0<br />
0-30cm<br />
30-60cm<br />
60-90cm<br />
0-30cm<br />
30-60cm<br />
60-90cm<br />
0-30cm<br />
30-60cm<br />
60-90cm<br />
low medium high<br />
F 1<br />
F 2<br />
sampling spot/Depth (cm)<br />
F 3, virgin<br />
Reference soil (non irrigated nor cultivated)<br />
cultivated and irrigated soil<br />
Finchaa Valley Sugar Estate – Erosion<br />
Two major types <strong>of</strong> soil erosion could be<br />
identified for the Finchaa Valley cases study.<br />
The effect <strong>of</strong> hinterland erosion and infield<br />
erosion jeopardizes the fertility status <strong>of</strong> the<br />
whole region and the Sugar Estate in<br />
particular. Deforestation <strong>of</strong> the highland<br />
regions caused by cutting trees for fire wood<br />
exposes the highland soils to erosive processes<br />
and contributes to high surface run<strong>of</strong>f.<br />
Population pressure aggravates this problem<br />
even more. The eroded material from the steep<br />
escarpments which is deposited on the irrigated<br />
areas <strong>of</strong> the valley bottom can lead to soil<br />
383
degradation. Run <strong>of</strong>f estimation <strong>of</strong> the valley<br />
bottom indicates loss <strong>of</strong> eroded fertile soils due<br />
to sheet erosion estimated in the range <strong>of</strong> 5 to<br />
10 mm/y or equivalent to approximately<br />
100ton/ha -y (Girma T., 1995). The eroded soil<br />
is deposited to the tributaries <strong>of</strong> Finchaa River<br />
which finally drain to Abay (Blue Nile) River.<br />
Considering the high content <strong>of</strong> available<br />
phosphorous which tends to be fixed to soil<br />
particles in the topsoil layer, erosion <strong>of</strong> these<br />
soil particles causes an additional threat to<br />
downstream water courses. Assuming that<br />
these present trends continue the problem <strong>of</strong><br />
soil and land degradation induced by soil<br />
erosion may threaten the sustainability <strong>of</strong> the<br />
irrigation project.<br />
Finchaa Valley Sugar Estate - Impact on<br />
Ecosystem<br />
In 1975 the state farm was established which<br />
mainly produced food and commercial crops<br />
until 1991. About 3500 ha <strong>of</strong> valuable<br />
ecosystems have been cleared and destroyed<br />
for agricultural activities. Before that the<br />
valley was under natural vegetation cover and<br />
very few agricultural plots could be observed.<br />
The valley area was a sanctuary for wild<br />
animals. Tall savanna grass mixed with trees<br />
which occupied most <strong>of</strong> the valley floor<br />
created favorable conditions for a large<br />
numbers <strong>of</strong> wild animals like carnivores,<br />
browsers, grazers and other small animals. The<br />
natural vegetation in the area was dense and<br />
with full canopy during the wet season.<br />
Starting from 1991 up to now more than 8064<br />
ha <strong>of</strong> land has been cleared and irrigated for<br />
sugar production (Ahmed Amdihun, 2006).<br />
From 1975 to 1991 these parts <strong>of</strong> Finchaa<br />
Valley area have changed from primary to<br />
tertiary economic production; from traditional<br />
agricultural to industrial and commercial<br />
production respectively. The dominant land<br />
use classes are irrigation agriculture and agropastoral<br />
within the valley area and rain fed<br />
agriculture mainly in the high land area. In<br />
addition to the land clearing tree and grass<br />
species are exposed to extensive and severe<br />
bush fires (Ahmed, 2006). Two major reasons<br />
could be identified. In addition to natural<br />
factors inhabitants <strong>of</strong> the region earn their<br />
subsistence by collecting wild honey and crop<br />
cultivation. To clear their land farmers burn the<br />
forest. Since the establishment <strong>of</strong> the irrigation<br />
scheme and the beginning <strong>of</strong> sugar cane<br />
production also sugar cane burning for<br />
harvesting can be identified as a major cause<br />
for forest fires. Furthermore migration<br />
tendencies triggered by the attraction and<br />
employment options <strong>of</strong> the sugar estate<br />
increase the pressure on the ecosystem.<br />
In developing countries like Ethiopia the GDP<br />
<strong>of</strong> a country highly depends on agricultural<br />
production. Priorities have to be outweighed<br />
between conservation <strong>of</strong> valuable ecosystems<br />
and important contribution to a country’s<br />
economy. In order to justify clearance <strong>of</strong> large<br />
natural forest areas agricultural production<br />
needs to be sustainable to avoid large scale<br />
land degradation and further adverse<br />
environmental impacts.<br />
Conclusions<br />
The main goal <strong>of</strong> this report was to assess the<br />
pertinent environmental implications <strong>of</strong> two<br />
selected large scale irrigation schemes in<br />
Ethiopia. For this purpose two large scale<br />
schemes in different regions were selected<br />
Wonji/Shoa and Finchaa Valley. The main<br />
focus was put on impact on natural resources<br />
like water, soil and ecosystems. Based on the<br />
pertinent environmental checklists <strong>of</strong> FAOs,<br />
World Banks and MoWRs EIA procedures,<br />
data sheets and guidelines for primary and<br />
secondary data collection were designed<br />
(Wallner, 2006) and used during the<br />
assessment. The water sources <strong>of</strong> the schemes<br />
were sampled and analyzed against FAOs<br />
standards and threshold for water used in<br />
agriculture. Additionally water samples <strong>of</strong><br />
downstream water bodies were tested to assess<br />
potential adverse impacts. Physical and<br />
chemical soil parameters <strong>of</strong> primary and<br />
secondary data were analyzed for possible<br />
changes.<br />
In general, the study conducted shows that the<br />
irrigation water used in the investigated case<br />
studies is <strong>of</strong> good quality with regard to FAOs<br />
standards for water used in agriculture and<br />
does not spell any risk for irrigation purposes.<br />
The irrigation water sources used in the three<br />
case study sites have low EC values ranging<br />
from 96 µS/cm (Finchaa Valley) to 293 µS/cm<br />
(Wonji/Shoa) and therefore no primary<br />
salinisation is to be expected.<br />
With regard to impact <strong>of</strong> the used water source<br />
on the soil quality EC to SAR ratio however<br />
indicates potential negative long-term effects<br />
384
on infiltration rates due to damage <strong>of</strong> the soil<br />
structure and soil crusting through induced<br />
sodicity especially in case <strong>of</strong> Wonji/Shoa and<br />
Finchaa Sugar Plantation.<br />
The most crucial environmental impacts <strong>of</strong><br />
large scale irrigation in Ethiopia which could<br />
be identified are related to improper irrigation<br />
management and development <strong>of</strong> irrigation<br />
project on saline and saline-sodic soils.<br />
Inefficient application <strong>of</strong> water and seepage <strong>of</strong><br />
water from reservoirs and unlined distribution<br />
canals lead to rising <strong>of</strong> groundwater table at<br />
Wonji/Shoa. Investigations showed that on<br />
some fields <strong>of</strong> the Wonji/Shoa Plantation the<br />
groundwater table is less than one meter below<br />
soil surface (Habib D., 2002). This tendency<br />
has mainly two adverse effects. The rise <strong>of</strong> the<br />
groundwater table up to the root zone<br />
interferes with the proper development <strong>of</strong> the<br />
planted crop, leads to damage <strong>of</strong> the soil<br />
structure and insufficient soil ventilation.<br />
Secondly it induces secondary salinisation due<br />
to capillary rising. Improper irrigation<br />
management and attempts to leach the<br />
accumulated salt by additional application <strong>of</strong><br />
water, which leads to rising groundwater table,<br />
has even aggravated this effect (Tena, 2002).<br />
Besides installation <strong>of</strong> drainage systems to<br />
intercept deep percolation <strong>of</strong> the excess water,<br />
other in the long run more cost-effective<br />
measures need to be considered. Installation <strong>of</strong><br />
drip systems could avoid excessively use <strong>of</strong><br />
irrigation water and make the application <strong>of</strong><br />
water more efficient and therefore increase the<br />
overall water productivity <strong>of</strong> the schemes.<br />
According to the Ethiopian Irrigation<br />
Development Program 26 medium and largescale<br />
irrigation projects are planned to be<br />
implemented. Due to topographic reasons most<br />
<strong>of</strong> these already established or proposed largescale<br />
irrigation schemes can be found in the<br />
lowlands <strong>of</strong> Ethiopians major river basins such<br />
as Awash, Blue Nile and Wabe Shebelle river<br />
basin. Over 11 million ha <strong>of</strong> land in the arid,<br />
semi-arid and desert parts <strong>of</strong> Ethiopia are<br />
known to be salt affected. Large areas <strong>of</strong> the<br />
Awash River Basin especially the middle and<br />
lower parts <strong>of</strong> the basin are saline or sodic or in<br />
saline or sodic phase and thus potentially<br />
exposed to salinisation and sodicity (EIAR<br />
2006).<br />
Development <strong>of</strong> large scale irrigation, political<br />
decision making and investment strategies are<br />
<strong>of</strong>ten oriented on short-term pr<strong>of</strong>it<br />
maximisation whereby environmental<br />
sustainability is neglected. Due to the fact that<br />
environmental sustainability <strong>of</strong> irrigation<br />
projects is rather on the low end <strong>of</strong> the policy<br />
priority list, adverse and irreversible<br />
environmental impacts are bound to happen in<br />
the contrary nexus <strong>of</strong> pr<strong>of</strong>it maximisation,<br />
short-term benefits and environmental<br />
sustainability.<br />
In order to avoid possible negative impacts <strong>of</strong><br />
the expansion <strong>of</strong> irrigated agriculture in<br />
causing deterioration <strong>of</strong> land and soil quality,<br />
proper understanding <strong>of</strong> the quality <strong>of</strong> soil and<br />
irrigation water and implementation <strong>of</strong><br />
appropriate measures have paramount<br />
importance for sustainable development. There<br />
is no doubt that irrigation can increase<br />
intensification and productivity, can help to<br />
limit the size <strong>of</strong> cultivated areas, can provide<br />
ample labour and agro-industrialization<br />
opportunities and other potentially positive<br />
benefits. On the other hand it can also cause<br />
negative impacts such as deterioration <strong>of</strong> soil<br />
and water quality, impact on eco-system,<br />
health and other negative externalities. It is<br />
important to support such endeavours through<br />
proper study and continuous research, so that<br />
the positive roles could be enhanced with<br />
timely mitigation measures for the negative<br />
impacts.<br />
385
References<br />
Abrol I.P., Yadav J.S.P., Massoud P.I.<br />
(1988): Salt Affected Soils and their<br />
<strong>Management</strong>, FAO Soils Bulletin No 39.<br />
FAO, Rome.<br />
Abdel-Deyem S. (1998): <strong>Water</strong>logging and<br />
salinity. In: Biswas A.K. (ed), <strong>Water</strong><br />
Resources: Environmental Planning,<br />
<strong>Management</strong> and Development, Tata<br />
McGraw-Hill Publishing Company<br />
Limited. New Delhi, India.<br />
Ahmed Amdihun (2006): Geographic<br />
Information Systems and Remote<br />
Sensing Integrated Environmental<br />
Impact Assessment <strong>of</strong> Irrigation in<br />
Fincha Valley, MSc. Thesis, Addis<br />
Ababa University, Ethiopia.<br />
Agricultural Services (1971): Annual Report<br />
<strong>of</strong> 1970/71, Wonji, Ethiopian Sugar<br />
Industry Support Center Sh. Co., Wonji.<br />
Agricultural Services (1974): Annual Report<br />
<strong>of</strong> 1973/74, Wonji, Ethiopian Sugar<br />
Industry Support Center Sh. Co., Wonji.<br />
Ambachew D., Girma A. (2000): Review <strong>of</strong><br />
sugarcane research in Ethiopia: I. Soils,<br />
irrigation and mechanization (1964-<br />
1998), Research and Training Services<br />
Department, Ethiopian Sugar Industry<br />
Support Center Sh. Co., Wonji.<br />
Anonymous (1987): Annual Problem Fields<br />
Report <strong>of</strong> 1986/87 Campaign,<br />
Wonji/Shoa Sugar Estate.<br />
ARS Annual Report (1994): Wonji/Shoa<br />
Sugar Estate, Agricultural Research and<br />
Service Center, Wonji.<br />
Awulachew, S.B. (2006): Improved<br />
Agricultural <strong>Water</strong> <strong>Management</strong>:<br />
Assessment <strong>of</strong><br />
constraints and opportunities for agricultural<br />
development in Ethiopia, in Awulachew,<br />
S.B., Menker, M., Abesha, D., Atnafe,<br />
T., and Wondimkun, Y. (Eds.) (2006):<br />
Best practices and technologies for small<br />
scale agricultural water management in<br />
Ethiopia, Proceedings <strong>of</strong> a<br />
MoARD/MoWR/USAID/IWMI<br />
symposium and exhibition held at Ghion<br />
Hotel, Addis Ababa, Ethiopia 7-9 March,<br />
2006, Colombo, Sri Lanka: <strong>International</strong><br />
<strong>Water</strong> <strong>Management</strong> <strong>Institute</strong>. 190pp.<br />
Encyclopaedia<br />
Britannica:<br />
http://www.britannica.com/eb/article-<br />
37681/Ethiopia (accessed 23/05/2007).<br />
EIAR (2006): Assessment <strong>of</strong> Salt Affected<br />
Soils in Ethiopia and Recommendations<br />
an <strong>Management</strong> Options for their<br />
Sustainable Utilization, Taskforce<br />
Report, Addis Ababa, Ethiopia.<br />
Ethiopian National Meteorological Service<br />
Agency (2006): Meteorological Data.<br />
Ethiopian Ministry <strong>of</strong> <strong>Water</strong> Resources<br />
(2002): Study Guideline on Soil Survey<br />
and Land Evaluation, Part B. Addis<br />
Ababa, Ethiopia.<br />
FAO (1965): Report on the Awash River<br />
Basin, Imperial Government <strong>of</strong> Ethiopia,<br />
United Nation Special Fund FAO/SF:<br />
10/ETH, 1995 Vol. IV, Addis Ababa,<br />
Ethiopia.<br />
FAO (N.d.): Key to the FAO Soil Units in<br />
the FAO/Unesco Soil Map <strong>of</strong> the World<br />
http://www.fao.org/AG/agl/agll/key2soil.<br />
stm (accessed on 10/01/2007).<br />
FAO Soils Bulletin No 42 (1986): Soil<br />
Survey Investigations for Irrigation,<br />
Rome.<br />
FAO Soils Bulletin No 39 (1988): Salt<br />
affected soils and their management,<br />
Rome.<br />
FAO Irrigation and Drainage Paper No 29<br />
(1989): <strong>Water</strong> Quality for Agriculture,<br />
Rome.<br />
FAO Irrigation and Drainage Paper No 48<br />
(1992): The use <strong>of</strong> saline waters for crop<br />
production, Rome.<br />
FAO Irrigation and Drainage Papers No 53<br />
(1995): Environmental impact<br />
assessment <strong>of</strong> irrigation and drainage<br />
projects, Rome.<br />
Government <strong>of</strong> the Republic <strong>of</strong> Ethiopia<br />
(2001a): <strong>Water</strong> Sector Strategy, Ministry<br />
<strong>of</strong><br />
<strong>Water</strong> Resources, <strong>Water</strong> Sector Development<br />
Program, 2002-2016, Irrigation<br />
Development Program.<br />
Government <strong>of</strong> the Republic <strong>of</strong> Ethiopia<br />
(2006): National Accounts Statistics <strong>of</strong><br />
Ethiopia, National Economic Accounts<br />
Department, Ministry <strong>of</strong> Finance and<br />
Economic Development, November,<br />
2006.<br />
Girma A. (2005): Evaluation <strong>of</strong> Irrigation<br />
<strong>Water</strong> Quality in Ethiopian Sugar Estates<br />
(Research Report), Research and<br />
Training Services Division, Ethiopian<br />
Sugar Industry Support Centre Sh. Co.,<br />
Wonji.<br />
386
Girma T. (1995): Finchaa Sugar Project Soil<br />
Survey/West Bank, Land <strong>Management</strong><br />
Unit Final Report Vol. I, Addis Ababa,<br />
Ethiopia.<br />
Girma T. (2001): Land Degradation: A<br />
Challenge to Ethiopia, Environmental<br />
<strong>Management</strong> Vol. 27, No. 6, pp. 815-<br />
824, Springer Verlag New York Inc.<br />
Girma Teferi (N.d.): Infield Irrigation<br />
Assessment in the Finchaa Valley, Study<br />
report, Finchaa Sugar Factory Project,<br />
Finchaa Valley Sugar Estate Library.<br />
Habib D. (2002): Groundwater level<br />
fluctuation study at Wonji/Shoa<br />
sugarcane plantation (Preliminary<br />
Research Report), Research and Training<br />
Services Division, Ethiopian Sugar<br />
Industry Support Centre Sh. Co., Wonji.<br />
Haider G. (1988): Irrigation <strong>Water</strong><br />
<strong>Management</strong> Manual, <strong>Institute</strong> <strong>of</strong><br />
Agricultural Research, Addis Ababa<br />
Ethiopia<br />
Heluf Gebrekidan (1985): Investigation on<br />
Salt Affected Soils and Irrigation <strong>Water</strong><br />
Quality in Melka Sedi-Amibara Plain,<br />
Rift Valley Zone <strong>of</strong> Ethiopia, MSc<br />
Thesis, School <strong>of</strong> Graduate Studies,<br />
Addis Ababa University. Addis Ababa,<br />
Ethiopia. 131p.<br />
Kediru K. (1997): Annual Problem Fields<br />
Report <strong>of</strong> 1996/97, Agriculture Division,<br />
Wonji/Shoa Sugar Estate, Wonji.<br />
Mirsal I.A. (2004): Soil Pollution, Origin,<br />
Monitoring & Remediation, Springer-<br />
Verlag, Berlin Heidelberg.<br />
McCartney, M. (2007): Decision support<br />
systems for dam planning and operation,<br />
Draft IWMI Working Paper.<br />
MOFED: PASDEP (2006). Ethiopia:<br />
Building on Progress. A Plan for<br />
Accelerated and Sustained Development<br />
to End Poverty (PASDEP), Volume I:<br />
Main Text.<br />
Rahmeto A. (1998): Problems Related to<br />
Irrigation and Drainage in Wonji/Shoa<br />
Sugar Cane Plantation, A Preliminary<br />
Survey, Wonji.<br />
Richards L.A. et al. (1954): Diagnosis and<br />
Improvement <strong>of</strong> saline and alkali soils,<br />
Agriculture Handbook 60, US Salinity<br />
Laboratory, US Department <strong>of</strong><br />
Agriculture, Riverside, California.<br />
Szabolcs, I. (1979): Review <strong>of</strong> research on<br />
salt affected soils, Natural Resources<br />
Research XV, UNESCO, Paris.<br />
Szabolcs, I. (1989): Salt affected soils, CRS<br />
Press. Inc., Boca Ratan, Florida. 274p.<br />
Sahlemedhin Sertsu, Taye Bekele (2000):<br />
Procedures for Soil and Plant Analysis,<br />
National Soil Research Center, Ethiopian<br />
Agricultural Research Organization,<br />
Addis Abeba.e<br />
Tadele G.S. (1993): Degradation Problems<br />
<strong>of</strong> Irrigated Agriculture, In Tekalign M.<br />
and Mitiku H. (ed.) ESSS Proceeding<br />
Soil the Resource Base for Survival,<br />
Addis Ababa, Ethiopia, pp. 200-203.<br />
Tena A. (2002): Spatial and Temporal<br />
Variability <strong>of</strong> Awash River <strong>Water</strong><br />
Salinity and the Contribution <strong>of</strong><br />
Irrigation <strong>Water</strong> <strong>Management</strong> in the<br />
Development <strong>of</strong> Soil Salinization<br />
Problem in the Awash Valley <strong>of</strong><br />
Ethiopia, PhD. Thesis, <strong>Institute</strong> <strong>of</strong><br />
Hydraulics and Rural <strong>Water</strong><br />
<strong>Management</strong>, Department <strong>of</strong> <strong>Water</strong>,<br />
Atmosphere and Environment,<br />
University <strong>of</strong> Natural Resources Applied<br />
Life Sciences, BOKU Vienna.<br />
Teshome D. (1999): <strong>Water</strong> Balance and<br />
Effect <strong>of</strong> Irrigated Agriculture on<br />
Groundwater Quality in the Wonji Area /<br />
Ethiopian Rift Valley, MSc. Thesis,<br />
Addis Ababa University.<br />
Tilahun H. and Paulos D. (2004): Results to<br />
date and future plan <strong>of</strong> research on<br />
irrigation and its impact, Workshop on<br />
impact <strong>of</strong> irrigation on poverty and<br />
environment, Workshop proceedings, (In<br />
press).<br />
UNDP (2006): Human Development Report<br />
2006. Beyond scarcity: Power, poverty<br />
and the global water crisis, New York.<br />
USDA (2006): Keys to Soil Taxonomy,<br />
Tenth Edition, United States Department<br />
<strong>of</strong> Agriculture, Natural Resources<br />
Conservation Service, California.<br />
Wallner K. (2006): Field Parameter<br />
Evaluation to Support Environmental<br />
Impact Analysis <strong>of</strong> Irrigation in Ethiopia,<br />
MSc. Thesis, <strong>Institute</strong> <strong>of</strong> Hydraulics and<br />
Rural <strong>Water</strong> <strong>Management</strong>, Department<br />
<strong>of</strong> <strong>Water</strong>, Atmosphere and Environment,<br />
University <strong>of</strong> Natural Resources Applied<br />
Life Sciences, BOKU Vienna.<br />
Werfring A., Lempérière P. and Boelee E.<br />
(2004): Typology <strong>of</strong> irrigation in<br />
Ethiopia, In: Proceedings <strong>of</strong> inception<br />
workshop on IWMI–BOKU–<br />
Seibersdorf–EARO–Arbaminch<br />
University collaborative study on the<br />
387
impact <strong>of</strong> irrigation development on<br />
poverty and the environment, 26–30<br />
April 2004, Addis Ababa, Ethiopia, (In<br />
press).<br />
Werfring A. (2005): Typology <strong>of</strong> Irrigation<br />
in Ethiopia, MSc. Thesis, <strong>Institute</strong> <strong>of</strong><br />
Hydraulics and Rural <strong>Water</strong><br />
<strong>Management</strong>, Department <strong>of</strong> <strong>Water</strong>,<br />
Atmosphere and Environment,<br />
University <strong>of</strong> Natural Resources Applied<br />
Life Sciences, BOKU Vienna.<br />
World Bank (2004): Ethiopia’s Path to<br />
Survival and Development: Investing in<br />
<strong>Water</strong> Infrastructure, Concept Paper<br />
(Background Note for FY04 CEM),<br />
Yeshimebet T. (2005): Summary <strong>of</strong> Weather<br />
Data for the Year 2004 and Average <strong>of</strong><br />
the Last Ten Years 1995-2004, Ethiopian<br />
Sugar Industry Support Center Sh.Co.,<br />
Wonji Research Station.<br />
Zeleke K. (2003): GIS and Remote Sensing<br />
in Land Use / Land Cover Change<br />
Detection in Finchaa Valley Area, MSc.<br />
Thesis, Addis Ababa University,<br />
Ethiopia.<br />
388
Planning and management <strong>of</strong> irrigation in sub-Saharan Africa:<br />
reducing the environmental and health costs<br />
Matthew McCartney 1 , Eline Boelee 1 , Olufunke C<strong>of</strong>ie 2 and Clifford Mutero 3<br />
1 IWMI-Addis Ababa, 2 IWMI-Acra, 3 Independant consultant<br />
m.cartney@cgiar.org<br />
Abstract<br />
Development <strong>of</strong> irrigation can result in<br />
negative environmental and human health<br />
impacts. Irrigation undertaken without full<br />
consideration <strong>of</strong> these impacts can have<br />
serious adverse repercussions, not only<br />
undermining the investment but also<br />
worsening poverty and contributing<br />
considerably to peoples’ suffering. The<br />
impacts are strongly inter-linked because it<br />
is changes in the environment that cause<br />
changes in health. Furthermore, mitigation<br />
measures that reduce environmental damage<br />
<strong>of</strong>ten improve health outcomes. In the past,<br />
research into impacts, and the development<br />
<strong>of</strong> impact assessment methodologies, has<br />
focused primarily on large scale, capital<br />
intensive, schemes. However, small scale<br />
and less formal water management<br />
interventions, which are increasingly<br />
prevalent in sub-Saharan Africa, can also<br />
have significant environmental and health<br />
impacts. This paper summarizes the findings<br />
<strong>of</strong> a study <strong>of</strong> environmental and health<br />
issues associated with all scales <strong>of</strong> irrigation<br />
in sub-Saharan Africa. It is not a<br />
compendium <strong>of</strong> data, but rather provides an<br />
overview and framework for understanding<br />
policy and programming issues. It is<br />
recommended that a pragmatic approach to<br />
address current environmental and health<br />
planning includes three levels <strong>of</strong><br />
implementation: i) strategic planning at the<br />
national and regional level; ii) full<br />
environmental and health assessment for<br />
government and donor funded projects; and<br />
iii) development <strong>of</strong> simplified tools for<br />
impact assessment relevant to community<br />
led, NGO and small private projects.<br />
1. Introduction<br />
It is widely acknowledged that irrigation can<br />
play a major role in improving food<br />
productivity, reducing poverty and<br />
sustaining rural livelihoods (Hussain and<br />
Hanjra, 2004; Smith, 2004). However, over<br />
the past two decades, investments in<br />
irrigation in sub-Saharan Africa have<br />
declined significantly (Kikuchi et al. 2005).<br />
There are a number <strong>of</strong> reasons for the<br />
decline, but the poor performance <strong>of</strong><br />
irrigation, especially with respect to capitalintensive<br />
schemes, has undoubtedly<br />
contributed. Although not the sole reason,<br />
environmental factors and adverse health<br />
impacts have been a prominent cause for the<br />
disappointing performance <strong>of</strong> many schemes<br />
(Oomen et al., 1990). Inadequate<br />
consideration <strong>of</strong> environmental and health<br />
issues in the planning and implementation <strong>of</strong><br />
projects is widely perceived as a key cause<br />
<strong>of</strong> project failure (Moradet et al., 2005).<br />
The environmental and human health<br />
aspects <strong>of</strong> irrigation schemes need to be<br />
considered in tandem, because they are<br />
strongly inter-linked. It is changes in the<br />
environment, in conjunction with associated<br />
socio-economic change, which results in<br />
changes in the health <strong>of</strong> local populations<br />
(Figure 1). Environmental and health impacts<br />
<strong>of</strong> irrigation are generally site specific and are<br />
multiple, varied and complex. They depend<br />
on a range <strong>of</strong> factors, including the scale <strong>of</strong><br />
development, bio-physical conditions,<br />
management and operation, as well as the<br />
extent to which safeguards are implemented.<br />
389
The potential negative environmental<br />
impacts <strong>of</strong> large capital-intensive irrigation<br />
schemes are extensively documented (e.g.,<br />
Adams 1992; Dougherty and Hall 1995;<br />
Kay, 1999). Modification <strong>of</strong> river flow<br />
regimes, depletion <strong>of</strong> groundwater,<br />
sedimentation effects, soil salinization,<br />
waterlogging, water contamination and<br />
biological effects 24 , have all been<br />
responsible for undermining the<br />
sustainability <strong>of</strong> schemes. Often farmers on<br />
irrigation schemes are fully aware <strong>of</strong> many<br />
environmental problems. However, because<br />
small incremental changes can take a long<br />
time to have a significant impact on<br />
productivity, <strong>of</strong>ten nothing is done until it is<br />
too late. It is estimated that in the southern<br />
region <strong>of</strong> Ethiopia, approximately 50% <strong>of</strong><br />
irrigation scheme failures and below<br />
capacity performance are due in part to<br />
technical (as opposed to institutional and<br />
social) reasons, many <strong>of</strong> which are<br />
environmental in nature (e.g., soil<br />
salinization, sedimentation in headworks<br />
and channels, and drying up <strong>of</strong> rivers)<br />
(Robel, 2005).<br />
Agricultural <strong>Water</strong> Development<br />
Environmental Change<br />
• abiotic + biotic<br />
• local + distant<br />
• immediate + long-term<br />
Health Impacts<br />
positive & negative<br />
Social Change<br />
• food security<br />
• poverty<br />
• institutions<br />
• global trade<br />
Figure 1: Influence <strong>of</strong> agricultural water<br />
24 Examples include agricultural pests and weeds<br />
and the establishment <strong>of</strong> aquatic vegetation in the<br />
water storage, distribution and drainage systems.<br />
Although investment in irrigation is supposed<br />
to bring health benefits, through improved<br />
nutrition and income, it can have adverse<br />
impacts through the extension <strong>of</strong> waterrelated<br />
vector-borne diseases (e.g., malaria,<br />
schistosomiasis, liver flukes, filariasis,<br />
onchocerciasis, dengue fever, yellow fever,<br />
Rift Valley fever and encephalitis (Oomen et<br />
al. 1990). For example, malaria has been<br />
closely associated with the Gezira Irrigation<br />
System, in Sudan since it began in 1924.<br />
Severe outbreaks in the mid-1970s were<br />
linked to changes in irrigation management<br />
practices and the onset <strong>of</strong> pesticide resistance<br />
in malaria mosquitoes (Hunter et al. 1993).<br />
Contrary to widespread belief, communitybased<br />
and small-scale agricultural<br />
interventions also have environmental and<br />
health impacts (Konradsen et al. 2000;<br />
Mutero et al. 2004). These impacts are <strong>of</strong>ten<br />
disregarded and in many instances, there is<br />
almost no knowledge <strong>of</strong> the cumulative<br />
environmental and health impacts arising as<br />
a consequence <strong>of</strong> up-scaling. For example,<br />
small earth dams are being widely promoted<br />
throughout much <strong>of</strong> sub-Saharan Africa for<br />
multiple uses <strong>of</strong> water including irrigation<br />
and livestock watering. In many places,<br />
these dams have resulted in increased<br />
household income through improved<br />
agriculture. However, the potential<br />
environmental impacts and health<br />
consequences are rarely considered and the<br />
impacts <strong>of</strong> many thousands <strong>of</strong> dams are<br />
unclear. In Cameroon, the development <strong>of</strong><br />
hundreds <strong>of</strong> small agro-pastoral dams led to<br />
a rapid spread <strong>of</strong> schistosomiasis (Ripert and<br />
Raccurt 1987) Similarly in Ethiopia, the<br />
construction <strong>of</strong> small dams in Tigray has led<br />
to outbreaks malaria, where previously there<br />
were none (Ghebreyesus et al. 1999).<br />
2.Environmental and Health Planning<br />
in Irrigation Projects<br />
The need to take environmental and health<br />
considerations into account as part <strong>of</strong><br />
ensuring sustainable development is now<br />
widely recognized. Many countries in sub-<br />
390
Saharan Africa have national policies,<br />
strategies (e.g., National Environment<br />
Action Plans) and legislation that stipulate<br />
the need for appropriate environmental<br />
planning and management <strong>of</strong> projects. Most<br />
international financing institutions (e.g., The<br />
World Bank, ADB and IFAD) as well as<br />
many bilateral donors (e.g., CIDA, Danida,<br />
DFID, GTZ and USAID) and international<br />
development agencies (e.g., FAO), have<br />
environmental policies that mainstream<br />
environmental issues at operational levels<br />
(Bos, 1999). Commercial organizations (e.g.<br />
banks) are also increasingly environmentally<br />
aware and many have signed up to the<br />
Equator Principles, which provide a<br />
common framework to manage<br />
environmental and social issues<br />
(http://www.equator-principles.com/<br />
principles.shtml).<br />
To support these policies a large number <strong>of</strong><br />
Environmental Assessment (EA) tools have<br />
been developed. These include project-level<br />
Environmental Impact Assessment (EIA),<br />
Strategic and Sectoral Environmental<br />
Assessments (SEA), Social Impact<br />
Assessments (SIA), Health Impact<br />
Assessments (HIA) and Environmental<br />
Audits and Appraisals (EAA) (<strong>Table</strong> 1).<br />
However, currently there remains<br />
considerable diversity among donors and<br />
other institutions in their mandates and<br />
approaches to dealing with social issues<br />
(including health). Most institutions routinely<br />
consider social impacts that are mediated by<br />
the environment, such as the health impacts <strong>of</strong><br />
water pollution and many also consider a<br />
range <strong>of</strong> physical/biological impacts on<br />
directly affected groups (e.g., displacement or<br />
adverse impacts on local communities).<br />
Nevertheless, current coverage <strong>of</strong> human<br />
health aspects within environmental and<br />
social assessments is widely regarded as<br />
inadequate (Birley et al. 1997). Public health<br />
agencies are <strong>of</strong>ten excluded or only<br />
marginally involved and Environmental<br />
Health Impact Assessments (EHIA) are<br />
generally underutilized as tools for health<br />
protection (Fehr, 1999).<br />
Practical approaches to EHIA have been<br />
advocated by the World Health Organization<br />
and the Asian Development Bank. The<br />
WHO/FAO/UNEP/UNCHS Panel <strong>of</strong> Experts<br />
on Environmental <strong>Management</strong> for Vector<br />
Control (PEEM), jointly with the Danish<br />
Bilharziasis Laboratory, developed a training<br />
course on rapid health impact assessments,<br />
later further refined and disseminated by the<br />
Liverpool School <strong>of</strong> Tropical Medicine<br />
(Birley 1995; Furu et al. 1999; Bos et al.<br />
2003). In addition, some good text books are<br />
now available (e.g., Kemm et al. 2004).<br />
However, for the most part EHIA<br />
development has occurred in parallel, but is<br />
not integrated, with EIA methodologies.<br />
There is need for much better integration. A<br />
policy shift is required so that institutions<br />
promote EHIA rather than EIA (Amerasinghe<br />
and Boelee 2004).<br />
391
<strong>Table</strong> 1:<br />
Environmental, Health and Social Assessment Tools<br />
Environmental Impact Assessment (EIA)<br />
A process for examining the environmental and human consequences, both beneficial and<br />
adverse, <strong>of</strong> a proposed development activity, and for incorporating appropriate measures to<br />
address them into project design and implementation. In many instances EIA is defined broadly<br />
to include social dimensions such as health.<br />
Health Impact Assessment (HIA)<br />
Similar to EIAs, these are intended to focus specifically on the health implications <strong>of</strong> a project, in<br />
situations where greater emphasis is required.<br />
Social Assessment (SA)<br />
Similar to EIAs, these are intended to analyze, manage and monitor both the intended and<br />
unintended social consequences <strong>of</strong> a development. They may be used to promote social goals<br />
such as social inclusion or poverty reduction.<br />
Strategic Environmental Assessment (SEA)<br />
A process to assess the environmental and social implications <strong>of</strong> strategic decision-making. SEA<br />
differs from EIA in that it is applied to policies, plans and programs rather than to projects. It<br />
addresses a number <strong>of</strong> shortcomings <strong>of</strong> EIA in that it is capable <strong>of</strong> addressing the cumulative<br />
impacts <strong>of</strong> projects (i.e., where one project stimulates other development), it can address<br />
synergistic impacts (i.e., where the impact <strong>of</strong> several projects exceeds the sum <strong>of</strong> the individual<br />
project impacts) and it can address global impacts such as biodiversity loss.<br />
Environmental <strong>Management</strong> Plans (EMP)<br />
Strategies developed for ongoing activities to avoid, mitigate or compensate for adverse impacts.<br />
They should include specific quantifiable aims and objectives and assign responsibilities and<br />
budgets for the environmental and social (including health) impact management measures.<br />
Environmental Audits and Appraisals (EAAs)<br />
Determine the effectiveness <strong>of</strong> mitigation measures conducted and, where appropriate, propose<br />
remedial measures.<br />
392
3. Constraints to successful planning<br />
and management<br />
In common with other regions in the World,<br />
in sub-Saharan Africa, approaches to reduce<br />
the negative impacts <strong>of</strong> irrigation schemes<br />
are successful in some circumstances but are<br />
not effective in others. Constraints to<br />
environmental and health management, and<br />
the successful implementation <strong>of</strong> measures to<br />
ameliorate negative impacts, arise for a range<br />
<strong>of</strong> technical reasons as well as limitations in<br />
human, financial and institutional capacity.<br />
Many countries lack the resources to<br />
properly enforce policies and to ensure that<br />
recommended practices are followed.<br />
Consequently, despite current national<br />
policies, EIAs are most <strong>of</strong>ten restricted to<br />
large construction projects and are largely<br />
donor-driven. For example, the effectiveness<br />
<strong>of</strong> the Environmental Council <strong>of</strong> Zambia<br />
(ECZ), the lead institution for overseeing<br />
EIAs in Zambia, is severely curtailed by the<br />
inadequate budget and limited human<br />
resources (McCartney et al., 2004).<br />
Failure <strong>of</strong> measures to mitigate negative<br />
impacts <strong>of</strong>ten stem from a lack <strong>of</strong> sufficient<br />
information at the design stage in planning<br />
(Morardet et al. 2005). More <strong>of</strong>ten than not,<br />
baseline information is unavailable for<br />
irrigation projects. Furthermore, adverse<br />
environmental and health consequences <strong>of</strong>ten<br />
occur because schemes are planned and<br />
managed in isolation from other things<br />
occurring within the catchment. In many<br />
instances too little thought is given to the<br />
dynamics <strong>of</strong> catchment change and there is<br />
inadequate evaluation <strong>of</strong> the specific<br />
biophysical and socio-economic context in<br />
which the scheme is located. Available<br />
descriptions <strong>of</strong> effective mitigation measures<br />
generally do not include the underlying<br />
assumptions or specifications that were used<br />
to design them. Without appropriate criteria<br />
and specifications for the design <strong>of</strong><br />
measures, it is unusual for the measures to<br />
achieve the desired goals. To develop the<br />
necessary criteria and specifications,<br />
sufficient information must be obtained.<br />
Very <strong>of</strong>ten the environmental, ecological and<br />
socio-economic monitoring required, both<br />
for design prior to the implementation <strong>of</strong> a<br />
scheme and afterwards to assess the<br />
effectiveness <strong>of</strong> protection measures, is<br />
inadequate. For example, in Ghana a data<br />
checklist sent to 22 irrigation schemes,<br />
provided limited information for just three<br />
schemes. This lack <strong>of</strong> data was attributed to<br />
poor data keeping and the fact that, for the<br />
majority <strong>of</strong> schemes, assessment <strong>of</strong><br />
environmental and/or health impacts had<br />
never been undertaken (Kranjac-<br />
Berisavljevic and C<strong>of</strong>ie, 2004). In relation to<br />
health, baseline information on the health<br />
and socio-economic status <strong>of</strong> communities,<br />
and hence their susceptibility to change, is<br />
<strong>of</strong>ten lacking (Fehr, 1999).<br />
To a large extent the effectiveness <strong>of</strong><br />
environmental and health management<br />
depends on the abilities <strong>of</strong> those people who<br />
plan and manage mitigation measures. In<br />
many parts <strong>of</strong> sub-Saharan Africa, the<br />
requisite pr<strong>of</strong>essionals are unavailable or not<br />
pr<strong>of</strong>icient in the interdisciplinary working<br />
habits necessary for successful<br />
environmental and health planning and<br />
management. Furthermore, there is <strong>of</strong>ten a<br />
lack <strong>of</strong> coordination between relevant<br />
government departments. In a review <strong>of</strong><br />
World Bank projects in Africa, the most<br />
frequently cited recommendation for<br />
corrective action for environmentally<br />
sensitive projects was improvement <strong>of</strong><br />
capacity in responsible institutions (Green<br />
and Raphael 2000). This lack <strong>of</strong> capacity is<br />
being be exacerbated by the HIV/AIDS<br />
epidemic (Cohen, 2002).<br />
Another major limitation to formal<br />
environmental and health procedures is that<br />
<strong>of</strong>ten there are no mechanisms to ensure<br />
adaptation in the design <strong>of</strong> the project.<br />
Usually the people who demand the<br />
assessment are not the same as those who<br />
decide on changes in the project design or<br />
even whether or not the project will be<br />
carried out. Most sub-Saharan African<br />
countries have neither the necessary<br />
framework to ensure legal compliance nor<br />
organized civil society to ensure that<br />
recommended environmental and health<br />
safeguards are implemented. In such<br />
situations the contractual arrangement with<br />
the donor may be the major means for<br />
ensuring compliance. However, in the<br />
absence <strong>of</strong> a transparent accountable system<br />
this arrangement is rarely successful. Very<br />
little is known about the proportion <strong>of</strong><br />
assessments that lead to actual adaptations or<br />
implementation <strong>of</strong> mitigating measures.<br />
393
However, a study <strong>of</strong> the follow-up to the EIA<br />
conducted for the Koga irrigation scheme in<br />
Ethiopia found that only two <strong>of</strong> the twenty<br />
major recommendations made in the EIA<br />
were being implemented satisfactorily. The<br />
lack <strong>of</strong> follow-up was largely attributed to<br />
institutional failure, with no single authority<br />
being responsible for ensuring that the EIA<br />
recommendations were implemented (Abebe<br />
et al. 2007).<br />
In a global review <strong>of</strong> the effectiveness <strong>of</strong> its<br />
EA procedures the World Bank found that<br />
key constraints to successful implentation in<br />
projects for which EA was not deemed to<br />
have been performed effectively were: i) the<br />
lack <strong>of</strong> a definitive Environmental<br />
<strong>Management</strong> Plan (EMP) with time-bound<br />
actions and responsibilities; ii) the absence <strong>of</strong><br />
environmental monitoring indicators; iii) a<br />
lack <strong>of</strong> reporting requirements for project<br />
performance (including environmental and<br />
health indicators) and iv) the absence <strong>of</strong> legal<br />
commitments by borrowers to undertake<br />
environmental actions (World Bank 1997).<br />
4. Recommendations<br />
Clearly, if irrigation is to make a significant<br />
contribution to realizing the potential <strong>of</strong><br />
agriculture in sub-Saharan Africa, there is<br />
need for much improved and integrated<br />
planning. Measures that promote<br />
sustainability by, among other things,<br />
capitalizing on the opportunities for<br />
enhancing human health, should be at the<br />
core <strong>of</strong> agricultural water development. The<br />
EA process, recommended by most donors<br />
and governments, is widely recognized as a<br />
useful for identifying issues and developing<br />
plans to address them. However, within sub-<br />
Saharan Africa there are, as outlined above,<br />
many constraints to the process and<br />
subsequent follow-up is <strong>of</strong>ten weak.<br />
Furthermore, the process is inappropriate for<br />
many small-scale developments. Subjecting<br />
smallholder and community-led projects to<br />
full environmental and health assessment,<br />
and monitoring, although justifiable, is <strong>of</strong>ten<br />
neither economically feasible nor practical.<br />
Against this background, the following<br />
recommendations are a pragmatic attempt to<br />
address current limitations in environmental<br />
and health planning and management<br />
pertaining to irrigation development.<br />
Focused on what governments and donors<br />
can do to improve planning and<br />
management, the recommendations are<br />
divided into three categories:<br />
• strategic planning at national and<br />
regional level<br />
• agricultural water projects for which<br />
full environmental and health<br />
assessment should be mandatory (i.e.,<br />
all government and donor funded<br />
projects, whatever their size, plus all<br />
other projects involved in commercial<br />
agricultural production and greater than<br />
20 ha in extent 25 )<br />
• agricultural water projects that by-pass<br />
current procedures and for which it is<br />
unrealistic to expect full environmental<br />
and health assessment to be conducted<br />
(i.e., private, community and NGO<br />
organized projects smaller than 20 ha in<br />
extent 2 ).<br />
4.1 Strategic planning at national and<br />
regional level<br />
4.1 Implement Strategic Environmental<br />
Assessment at regional and national level<br />
Strategic environmental assessments (SEAs)<br />
can be used to plan irrigation development at<br />
national level and for major international<br />
river basins (e.g., Zambezi, Limpopo, Volta).<br />
SEAs are most valuable if they integrate<br />
environmental, health and social concerns<br />
and attempt to reconcile development,<br />
environmental protection, community rights<br />
and human health. Regional and national<br />
development goals, as well as issues such as<br />
climate change and loss <strong>of</strong> biodiversity, and<br />
commitments to international conventions<br />
(e.g., the Convention on Biological<br />
Diversity) should be considered.<br />
4.2 Improve and promote EHIA<br />
Currently health impact assessments are<br />
<strong>of</strong>ten conducted in isolation from<br />
environmental assessments. Since much <strong>of</strong><br />
the information to be collected on<br />
environmental receptivity and community<br />
25<br />
The suggested value <strong>of</strong> 20 ha is arbitrary but<br />
intended to make recommendations<br />
operationalizable. Governments could decide on<br />
a more appropriate figure, based on the specific<br />
agro-ecological conditions and development<br />
needs <strong>of</strong> their country.<br />
394
vulnerability is the same it is mutually<br />
beneficial if they are integrated. Where<br />
necessary, EHIA should specifically include<br />
the issues <strong>of</strong> migrants and livestock that<br />
hitherto have tended to receive very little<br />
attention.<br />
4.3 Improve regional capacity for<br />
Environmental and Health Assessment<br />
All countries without compulsory<br />
environmental and health assessment<br />
processes should consider enacting laws that<br />
make these mandatory for large infrastructure<br />
projects, including large irrigation projects. In<br />
many countries strengthened institutional<br />
arrangements would assist in the<br />
implementation <strong>of</strong> environmental and health<br />
assessment processes. For example,<br />
establishing environmental units within<br />
Government ministries responsible for<br />
irrigation could be contemplated. The<br />
effectiveness <strong>of</strong> such units would be enhanced<br />
if they work closely with national environment<br />
agencies and appropriate health authorities.<br />
4.4 Adopt harmonized environmental<br />
and health procedures<br />
The ability <strong>of</strong> governments to implement<br />
sound environmental and health practices<br />
would be improved if donor agencies<br />
harmonized procedures and developed a<br />
consistent framework for the evaluation,<br />
planning and management <strong>of</strong> environmental<br />
and health aspects <strong>of</strong> irrigation. Procedural<br />
requirements should conform to current<br />
international best practice and be clearly laid<br />
down in regulations and operational manuals.<br />
4.5 Conduct regionally specific research<br />
More research is needed on the benefits <strong>of</strong><br />
incorporating environmental and health<br />
safeguards in irrigation planning and<br />
operation versus the cost <strong>of</strong> not taking<br />
potential negative impacts into account.<br />
Another researchable issue stems from the<br />
lack <strong>of</strong> monitoring, both for water resources<br />
development projects and in the health<br />
sector. With baseline data not available,<br />
proxies need to be developed to provide<br />
alternative ways to the same information.<br />
Specific tools need to be developed to<br />
facilitate assessment <strong>of</strong> long-term health and<br />
environmental impacts. For example, long<br />
term cohort studies are required that are not<br />
feasible within the context <strong>of</strong> individual<br />
EHIA.<br />
Agricultural water projects for which full<br />
environmental and health assessment should<br />
be mandatory<br />
4.6 Implement comprehensive options<br />
assessment<br />
Comprehensive options assessments,<br />
undertaken during the scoping <strong>of</strong> irrigation<br />
projects, provide a means, early in the<br />
planning process, to eliminate unacceptable<br />
projects or project components.<br />
Comprehensive environmental and social<br />
audits can help determine the causality <strong>of</strong><br />
environmental and human impacts and the<br />
relative magnitude <strong>of</strong> impacts at a basin or<br />
regional level, which can then be compared<br />
to alternative development scenarios. It is<br />
essential that environmental, health and<br />
social criteria, as well as technical, economic<br />
and financial factors, are considered when<br />
comparing alternatives.<br />
4.7 Identify and quantify intended<br />
livelihood and health benefits<br />
The environmental and health impacts <strong>of</strong><br />
irrigation are diverse. As with any<br />
development process, trade-<strong>of</strong>fs between<br />
social, environmental and economic goals<br />
are inevitable. As far as possible these trade<strong>of</strong>fs<br />
need to be identified and made explicit.<br />
Often it is assumed that, by improving food<br />
security and/or peoples’ socio-economic<br />
status, water development will inevitably<br />
result in health benefits and improved<br />
livelihoods. However, the intended<br />
livelihood and health benefits are rarely<br />
made explicit, and in reality, neither costs<br />
nor benefits are evenly distributed amongst<br />
stakeholders. Environmental and health<br />
assessments, as well as management plans,<br />
need to take into account the socio-economic<br />
diversity <strong>of</strong> communities and ensure that the<br />
weakest and most vulnerable are not<br />
adversely affected. Intended health and<br />
livelihood benefits as well as means <strong>of</strong><br />
verification need to be identified and stated<br />
at the outset <strong>of</strong> any irrigation scheme.<br />
395
4.8 Plan and manage using a catchmentwide<br />
perspective<br />
Given the inter-linkages between impacts<br />
and what occurs elsewhere in the catchment<br />
it is essential that projects are planned and<br />
managed within the specific socio-economic<br />
and biophysical context in which they are<br />
located. Consideration must be given to<br />
potential environmental impacts on, as well<br />
as impacts caused by, the development.<br />
Assessments <strong>of</strong> impacts on the catchment<br />
water balance and sediment fluxes, including<br />
evaluation <strong>of</strong> possible future development<br />
(particularly relating to land-use change), are<br />
essential. The potential cumulative affect <strong>of</strong><br />
small-scale interventions should be<br />
specifically included in assessments.<br />
4.9 Improve data generation and<br />
analysis related to environmental and health<br />
impacts<br />
A major constraint to the sustainability <strong>of</strong><br />
agricultural water development is the lack <strong>of</strong><br />
site-specific data and long-term monitoring;<br />
pre-requisites for informed decision-making.<br />
For this reason measures to significantly<br />
improve data generation and analysis related<br />
to environmental and health impacts should<br />
be encouraged (e.g., coordination <strong>of</strong> existing<br />
data collection efforts between sectors and/or<br />
establishment <strong>of</strong> meta-databases). Ideally<br />
monitoring strategies would be mandatory in<br />
all projects and governments<br />
and donors must provide adequate funding to<br />
enable this.<br />
4.10 Develop innovative ways for<br />
financing environmental and health<br />
measures<br />
The cost <strong>of</strong> effective environmental and<br />
health measures is <strong>of</strong>ten very high and must<br />
usually be borne by the organization<br />
responsible for the irrigation development.<br />
The most common mechanism for financing<br />
these measures is to incorporate the costs<br />
into the capital financial package <strong>of</strong> the<br />
project. The costs that are most readily<br />
incorporated into the capital costs are those<br />
that occur once (e.g., construction <strong>of</strong> fish<br />
ladders in dams). Financing on-going<br />
obligations, such as environmental and<br />
health monitoring, is more difficult. Whilst it<br />
is sometimes appropriate for beneficiaries to<br />
cover these, in many cases it is not. For this<br />
reason donors and governments ought to<br />
investigate innovative ways <strong>of</strong> financing<br />
recurring costs, such as trust funds 26 .<br />
4.11 Develop innovative approaches<br />
to ensure compliance with<br />
environmental and health<br />
requirements<br />
Incorporating environmental protection and<br />
health measures into irrigation projects is<br />
made difficult by the failure <strong>of</strong> many project<br />
operators to fulfill voluntary and mandatory<br />
obligations. Innovative approaches to<br />
encourage compliance ought to be<br />
investigated. Options could include: a) the use<br />
<strong>of</strong> performance bonds, supported by financial<br />
guarantees and expressed in wellbeing-related<br />
outcomes and not just agricultural yields and<br />
water use efficiency; b) implementation <strong>of</strong> a<br />
sector-specific environmental management<br />
system, perhaps constructed around that<br />
developed by the <strong>International</strong> Standards<br />
Organization (ISO); c) development <strong>of</strong> an<br />
ethical code for large-scale irrigation projects<br />
to ensure that environmental and health<br />
concerns are adequately addressed.<br />
Agricultural water projects for which it is<br />
impractical to conduct full environmental<br />
and health assessment<br />
4.12 Increase local-level awareness <strong>of</strong><br />
environmental and health issues<br />
Governments and donors should support<br />
campaigns <strong>of</strong> health awareness carried out by<br />
community health teams and training<br />
programs that, in collaboration with<br />
community groups (e.g., farmers associations,<br />
agricultural water user associations, water<br />
committees and women groups), increase<br />
26 Trust funds have been suggested as a possible<br />
mechanism for financing the mitigation <strong>of</strong> the<br />
environmental impacts caused by large dams<br />
(Bizer 2000). A project-specific trust could be<br />
established at the outset <strong>of</strong> a project (by the<br />
project financier) with the condition that funds<br />
are used specifically for environmental and health<br />
management, including monitoring. The<br />
approach could incorporate annual contributions<br />
from the scheme owners/beneficiaries as well as<br />
other organizations (e.g., governments or donors),<br />
with the environment and health program funded<br />
from the proceeds <strong>of</strong> the trust.<br />
396
awareness <strong>of</strong> potential environmental hazards<br />
and approaches to mitigation. Information on<br />
practical ways to maximize health benefits<br />
should be provided, as well as outlining<br />
potential hazards and approaches to mitigate<br />
negative impacts.<br />
4.13 Develop “user-friendly” methods <strong>of</strong><br />
rapid appraisal for evaluating smallscale<br />
projects<br />
Donor and government funded programs that<br />
promote small-scale development (e.g., the<br />
community driven development program <strong>of</strong><br />
the World Bank), should conduct programspecific<br />
environmental and health<br />
assessments. These should assess the<br />
potential impacts <strong>of</strong> the micro-projects to be<br />
financed under the program and the possible<br />
cumulative impacts <strong>of</strong> scaling-up. They<br />
should set the context for lower-level<br />
assessments and, based on the priorities for<br />
attention, simple checklists, intended for use<br />
by small local organizations and<br />
communities, should be developed to<br />
evaluate the impacts for individual microprojects.<br />
4.14 Ensure programs that promote<br />
small-scale agricultural water<br />
development are embedded within<br />
rural development programs<br />
Governments and donors should ensure that<br />
programs promoting small-scale irrigation<br />
are undertaken in conjunction with broader<br />
rural development programs that include<br />
water and sanitation, as well as health<br />
components. Care must be taken that these<br />
projects are designed so that the main<br />
beneficiaries are clearly identified and the<br />
objective <strong>of</strong> improving livelihoods through<br />
irrigation remains the primary focus.<br />
Concluding remarks<br />
Addressing environmental and health<br />
impacts are crucial for the sustainability <strong>of</strong><br />
future irrigation development in sub-Saharan<br />
Africa. The recommendations presented<br />
above focus on ways to improve the policies<br />
and practices pertaining to impact<br />
assessment and planning for both large and<br />
small developments. To be effective the<br />
recommendations require a coordinated<br />
effort and long-term commitment from both<br />
governments and donors. If implemented<br />
they will contribute to better awareness <strong>of</strong><br />
the linkages between environmental and<br />
health impacts and improve the sustainability<br />
<strong>of</strong> irrigation development in sub-Saharan<br />
Africa.<br />
References<br />
Abebe, W., Douven, W.J.A.M., McCartney,<br />
M.P. and Leentvaar, J. (2007) EIA<br />
implementation and follow up: a case<br />
study <strong>of</strong> Koga irrigation and watershed<br />
management project. Paper presented at<br />
IWMI workshop 4-5 June 2007, Addis<br />
Ababa, Ethiopia.<br />
AdamsW.M. 1992. Wasting the rain: rivers,<br />
people and planning in West Africa.<br />
Earthscan, London.<br />
Amerasinghe, F. and Boelee, E. 2004.<br />
Assessing the impact <strong>of</strong> irrigation<br />
development on the environment and<br />
human health. In: Proceedings,<br />
Inception workshop on IWMI-BOKU-<br />
Siebersdorf-EARO-Arbaminch<br />
University collaborative study on the<br />
impact <strong>of</strong> irrigation development on<br />
poverty and the environment, 26-30<br />
April 2004, Addis Ababa, Ethiopia.<br />
Birley, M.H. 1995. The health impact<br />
assessment <strong>of</strong> development projects.<br />
HSMO, London, UK.<br />
Birley, M.H., Gomes, M. and Davy, A. 1997.<br />
Health aspects <strong>of</strong> environmental<br />
assessment. Environmental assessment<br />
sourcebook update 18. Washington D.C.,<br />
USA: World Bank<br />
Bizer, J.R. 2000. Avoiding, minimizing,<br />
mitigating and compensating the<br />
environmental impacts <strong>of</strong> large dams.<br />
Report to the World Commission on<br />
Dams. World Commission on Dams,<br />
Cape Town, South Africa<br />
Bos, R. 1999. <strong>Water</strong> resources development<br />
and health: the policy perspective. Pp31-<br />
46 in Kay, B.H. (ed) <strong>Water</strong> resources:<br />
Health, environment and development.<br />
New York, NY, USA: E & FN Spon Ltd.<br />
250 pages.<br />
397
Bos, R.; Birley, M.; Furu, P. and Engel, C.<br />
2003. Health opportunities in<br />
development. A course manual on<br />
developing intersectoral decision-making<br />
skills in support <strong>of</strong> health impact<br />
assessment. Geneva: World Health<br />
Organization.<br />
Cohen, D. 2002. Human capital and the HIV<br />
epidemic in sub-Saharan Africa. Geneva,<br />
Switzerland: ILO Programme on<br />
HIV/AIDS and the World <strong>of</strong> Work.<br />
Dougherty, T.C. and Hall, A.W. 1995.<br />
Environmental Impact Assessment <strong>of</strong><br />
Irrigation and Drainage Projects<br />
Irrigation and Drainage Paper 53, FAO,<br />
Rome, Italy: FAO.<br />
Fehr, R. 1999. Environmental health impact<br />
assessment, evaluation <strong>of</strong> a ten-step<br />
model. Epidemiology 10: 618-625.<br />
Furu, P.; Birley, M.; Engel, C. and Bos, R.<br />
1999. Health opportunities in water<br />
resources development: A course<br />
promoting intersectoral collaboration. In<br />
<strong>Water</strong> resources: Health, environment<br />
and development, ed. Kay, B.H. New<br />
York, USA: E & FN Spon Ltd. pp. 86-<br />
107.<br />
Ghebreyesus, T.A.; Haile, M.; Witten, K.H.;<br />
Getachew, A.; Yohannes, A.M.;<br />
Yohannes, M.; Teklehaimanot, H.D.;<br />
Lindsay, S.W. and Byass, P. 1999.<br />
Incidence <strong>of</strong> malaria among children<br />
living near dams in northern Ethiopia:<br />
Community based incidence survey.<br />
British Medical Journal 319: 663-666.<br />
Green, K.M. and Raphael, A. 2000. Third<br />
environmental assessment review (FY<br />
96-00). Environment<br />
Department,Washington, D.C.: World<br />
Bank<br />
Hunter, J.M., Rey, L., Chu, K.Y.,<br />
Adekolu-John, E.O. and Mott, K.E.<br />
1993. Parasitic diseases in water<br />
resources development. The need for<br />
intersectoral negotiation. WHO World<br />
Health Organization, Geneva. 152 pp<br />
Hussain, I. and Hanjra, M.A. 2004. Irrigation<br />
and poverty alleviation: review <strong>of</strong> the<br />
empirical evidence. Irrigation and<br />
Drainage 53: 1-15.<br />
Kay, B.H. (ed) 1999. <strong>Water</strong> resources:<br />
Health, environment and development.<br />
New York, NY, USA: E & FN Spon Ltd.<br />
Kemm, J.; Parry, J. and Palmer, S. 2004.<br />
Health impact assessment: Concepts,<br />
theory, techniques, and applications.<br />
Oxford: Oxford University Press.<br />
Kikuchi, M., Inocencio, A., Tonosaki, M.,<br />
Merrey, D., de Jong, I. and Sally, S.<br />
2005. Cost <strong>of</strong> Irrigation Projects: A<br />
Comparison <strong>of</strong> sub-Saharan Africa and<br />
Other Developing Regions and Finding<br />
Options to Reduce Costs. Report for the<br />
World Bank as part <strong>of</strong> the Investment in<br />
agricultural water management in Sub-<br />
Saharan Africa: Diagnosis <strong>of</strong> trends and<br />
opportunities. Pretoria, South Africa,<br />
IWMI. May 2005<br />
Konradsen, F.; Amerasinghe, F.P.; van der<br />
Hoek W. and Amerasinghe, P.H. 2000.<br />
Malaria in Sri Lanka: Current knowledge<br />
on transmission and control. Colombo,<br />
Sri Lanka: <strong>International</strong> <strong>Water</strong><br />
<strong>Management</strong> <strong>Institute</strong>.<br />
Kranjac-Berisavljevic, G. and C<strong>of</strong>ie, O.<br />
2004. Comparison <strong>of</strong> formal and<br />
informal agricultural water development<br />
using selected environmental and social<br />
indicators, in Ghana. Case Study Report<br />
for Collaborative Program on<br />
Investments in Agricultural <strong>Water</strong><br />
<strong>Management</strong> in Sub Saharan Africa:<br />
Diagnosis <strong>of</strong> Trends and Opportunities.<br />
Accra, Ghana: <strong>International</strong> <strong>Water</strong><br />
<strong>Management</strong> <strong>Institute</strong>.<br />
McCartney, M.P., Daka A.E. and Ntambo, I.<br />
2004. Environmental and health impact<br />
assessment <strong>of</strong> dambo utilization in<br />
Zambia. Case Study Report for<br />
Collaborative Program on Investments in<br />
Agricultural <strong>Water</strong> <strong>Management</strong> in Sub<br />
Saharan Africa: Diagnosis <strong>of</strong> Trends and<br />
Opportunities. <strong>International</strong> <strong>Water</strong><br />
<strong>Management</strong> <strong>Institute</strong><br />
Morardet, S., Seshoka, J., Sally, H. and<br />
Merrey, D. 2005. Review <strong>of</strong> irrigation<br />
398
planning and implementation process.<br />
Report to the African Development<br />
Bank. Pretoria, South Africa: IWMI<br />
Mutero, C.M.; Kabutha, C.; Kimani, V.;<br />
Kabuage, L.; Gitau, G.; Ssennyonga, J.;<br />
Githure, J.; Muthami, L.; Kaida, A.;<br />
Musyoka, L.; Kiarie, E. and Oganda, M.<br />
2004. A transdisciplinary perspective on<br />
the links between malaria and<br />
agroecosystems in Kenya. Acta Tropica<br />
89: 171-186.<br />
Oomen, J.M.V., de Wolf, J. and Jobin, W.R.<br />
1990. Health and irrigation:<br />
incorporation <strong>of</strong> disease-control<br />
measures in irrigation, a multi-faceted<br />
task in design, construction and<br />
operation. Wageningen, The<br />
Netherlands: ILRI.<br />
Ripert, C.L. and Raccurt, C.P. 1987. The<br />
impact <strong>of</strong> small dams on parasitic<br />
diseases in Cameroon. Parasitology<br />
Today 3(9): 287-289.<br />
Robel, L.W. 2005. Assessment <strong>of</strong> design<br />
practices and performance <strong>of</strong> small-scale<br />
irrigation structures in South Region.<br />
Unpublished MSc thesis, Arbaminch<br />
University, Ethiopia.<br />
Smith, L.E.D. 2004. Assessment <strong>of</strong> the<br />
contribution <strong>of</strong> irrigation to poverty<br />
reduction and sustainable livelihoods.<br />
<strong>International</strong> Journal <strong>of</strong> <strong>Water</strong> Resources<br />
Development 20: 243-257.<br />
World Bank, 1997. The Impact <strong>of</strong><br />
Environmental Assessment: a review <strong>of</strong><br />
World Bank Experience. Environment<br />
Department, Washington, D.C., USA:<br />
The World Bank.<br />
399
GIS And Remote Sensing Integrated Environmental Impact Assessment <strong>of</strong><br />
Irrigation Project In Finchaa Valley Area<br />
Ahmed Amdihun<br />
Addis Ababa University, Ethiopia<br />
aamdihun@yahoo.com<br />
Abstract<br />
This research was conducted in order to<br />
assess the environmental impacts <strong>of</strong> Finchaa<br />
irrigation project using GIS and remote<br />
sensing techniques. Because <strong>of</strong> the limited<br />
resources only some environmental<br />
parameters were selected. These parameters<br />
are natural vegetation, soil/land, water<br />
quality, climate and health conditions.<br />
The normalized vegetation index (NDVI)<br />
analysis was used to detect the spatial and<br />
temporal change <strong>of</strong> vegetation biomass in<br />
the study area. The result indicated that the<br />
natural vegetation biomass is declining. This<br />
is mainly due to the expansion <strong>of</strong><br />
agricultural land and escalating human made<br />
structures in the area.<br />
The water physico-chemical analysis<br />
demonstrated that the down stream water<br />
has more chemical substances and degraded<br />
physical properties than the up stream<br />
counterparts. The direct leakage <strong>of</strong> industrial<br />
liquid waste and the agro-chemicals from<br />
irrigation fields are supposed to contribute<br />
for this result. The GIS analysis <strong>of</strong> a 100<br />
meter buffer around Major rivers and<br />
tributary streams is found to be a necessary<br />
action to mitigate the problem <strong>of</strong> pollution.<br />
The soil chemical and physical property<br />
analysis in the irrigated and non irrigated<br />
fields reveals that the soil samples taken<br />
from irrigated fields contain higher<br />
phosphorous, Nitrogen and organic carbon<br />
compared to its counter parts. The use <strong>of</strong><br />
agro-chemicals in the irrigation fields<br />
contribute for the result.<br />
From the twenty two years rain fall,<br />
temperature and humidity data no abrupt<br />
inclining or declining trend is observed that<br />
could tell the possible impacts <strong>of</strong> the project.<br />
The post irrigation development years<br />
witness that some water born diseases and<br />
malaria case records have increased. It is<br />
also found out that expansion <strong>of</strong> irrigation<br />
fields and the respective Malaria case<br />
records are positively correlated.<br />
Generally, despite the significance <strong>of</strong> the<br />
Finchaa irrigation project, it has negative<br />
environmental repercussions. This is evident<br />
from vegetation cover distraction, water<br />
quality deterioration in the down stream<br />
area, alteration <strong>of</strong> soil physical and chemical<br />
components and increasing health threats. If<br />
the current condition continues the problems<br />
may out weight the benefits <strong>of</strong> the irrigation<br />
project. Thus in the project site and<br />
adjoining areas urgent environmental<br />
conservation is necessary. This helps to<br />
sustain the existing and revitalize the fading<br />
resources.<br />
1. Introduction<br />
1.1 Background Information<br />
The expansion <strong>of</strong> irrigation scheme in<br />
Ethiopia lend a hand to achieve food self<br />
sufficiency and poverty reduction. Irrigation<br />
agriculture makes production more<br />
unwavering than the rain fed agriculture.<br />
Proper planning and management aided<br />
irrigation projects contribute for the growth<br />
<strong>of</strong> national GDP and GNP. It also creates<br />
job opportunities for several thousands <strong>of</strong><br />
people directly or indirectly.<br />
Despite their significances, however,<br />
irrigation practices have sometimes adverse<br />
impact on environmental conditions. It is<br />
known that Human activities have a<br />
pr<strong>of</strong>ound effect up on the natural<br />
400
environment and are becoming the main<br />
agent <strong>of</strong> environmental degradation.<br />
Finchaa valley was one <strong>of</strong> the few areas in<br />
Ethiopia to preserve its natural conditions<br />
for years. The topographic set up made the<br />
area to be inaccessible. In 1975 the valley<br />
was selected as a suitable site by the state<br />
farm to produce food and commercial crops.<br />
After few years the area was again chosen to<br />
establish a sugar factory. Following these<br />
there were many activities carried out in the<br />
area. Some <strong>of</strong> these activities have an<br />
enormous positive contribution while some<br />
others have negative effect on the<br />
environment.<br />
In Finchaa valley, following the<br />
establishment <strong>of</strong> the sugar factory more<br />
pronounced land degradation is observed.<br />
There is large scale land clearance<br />
(deforestation) by the factory for new<br />
irrigation field.<br />
In addition there are many people in and<br />
outside the valley that earn their livelihood<br />
from forest and forest products.<br />
The factory uses agrochemicals like<br />
fertilizers, pesticides and herbicides in<br />
irrigation fields and the wash away collected<br />
in ditches and then join the nearby tributary<br />
stream. On the other hand some Part <strong>of</strong> the<br />
liquid waste from the factory spillover the<br />
treatment plant and joins Finchaa River. The<br />
problems emanate from the little attention<br />
given for environmental conservation as the<br />
main objective is to maximize production<br />
and productivity. The cumulative effects <strong>of</strong><br />
these all problems can result in<br />
environmental degradation.In Finchaa valley<br />
there exists a continuous disturbance on<br />
vegetation cover, soil, and water. If the trend<br />
goes on, there will be an extreme effect on<br />
the environment. Thus, it is indispensable to<br />
carry out environmental impact assessment<br />
(EIA) <strong>of</strong> the irrigation project in the area.<br />
Environmental Impact Assessment has been<br />
recognized as an integral part <strong>of</strong> the early<br />
planning studies <strong>of</strong> irrigation projects in<br />
order to identify any expected negative<br />
impacts and to suggest the necessary actions<br />
to curb the problem. In addition, EIA can<br />
consider different designed alternatives for<br />
the project as an essential step for better<br />
decision making. The application <strong>of</strong><br />
Geographic information system (GIS) and<br />
remote sensing can facilitate the study <strong>of</strong><br />
environmental impact assessment <strong>of</strong><br />
irrigation projects for a better outcome.<br />
1.2. Objectives <strong>of</strong> the study<br />
1.2.1. General Objectives<br />
‣ To Asses the impact <strong>of</strong> the<br />
irrigation project on the natural<br />
environment <strong>of</strong> Finchaa valley<br />
Area.<br />
1.2.2. Specific Objectives<br />
• To see the impacts <strong>of</strong> Finchaa<br />
irrigation scheme on vegetation<br />
cover using satellite images <strong>of</strong><br />
different years.<br />
• To explore the extent <strong>of</strong> soil quality<br />
degradation as a result <strong>of</strong> the<br />
irrigation scheme.<br />
• To asses the impact <strong>of</strong> the irrigation<br />
on water quality in the upstream<br />
and down steam water <strong>of</strong> Finchaa<br />
River.<br />
• To see the climatic change<br />
(temperature and rain fall) over the<br />
past 22 years and interpret the<br />
results on sustainability <strong>of</strong> the<br />
irrigation project.<br />
• To investigate some health threats<br />
following the irrigation project<br />
spatially and temporally.<br />
• To propose some valuable measures<br />
to be taken to mitigate the negative<br />
impacts <strong>of</strong> the irrigation project on<br />
the environment in such away that<br />
assures sustainable development.<br />
1.3 Research Methodology<br />
In order to make out the positive and<br />
negative impacts <strong>of</strong> the irrigation project on<br />
the environment <strong>of</strong> Finchaa valley area more<br />
<strong>of</strong> primary and some secondary data are<br />
collected. Some <strong>of</strong> these data are integrated<br />
with GIS and remote sensing techniques in a<br />
way that manifests the impacts <strong>of</strong> the<br />
irrigation project on the environment.<br />
To best investigate the positive as well as<br />
negative impacts some components <strong>of</strong> the<br />
401
environment are preferred for investigation.<br />
These are vegetation cover, soil/land, water,<br />
climate and health cases records.<br />
The first line consideration is given to the<br />
direct environmental impacts <strong>of</strong> the<br />
irrigation scheme. In light <strong>of</strong> this the indirect<br />
impacts are also inspected to the best <strong>of</strong> the<br />
researchers’ knowledge and available<br />
resources.<br />
Different years <strong>of</strong> satellite images are used<br />
for the vegetation cover change with the<br />
expansion <strong>of</strong> the irrigation in Finchaa valley.<br />
Under this the scope and extent <strong>of</strong> variation<br />
in land cover, land use, reflectance<br />
properties, Image differencing, erosion<br />
estimation and the NDVI analysis are<br />
explored and quantified.<br />
To investigate the impacts <strong>of</strong> the irrigation<br />
on the soil the physical and chemical soil<br />
analysis has been made. The soil samples in<br />
different sites were collected. These sites are<br />
the irrigated fields, ploughed but not yet<br />
planted and non irrigated (vegetated) areas.<br />
The samples were taken in three layers and<br />
totally nine samples were analyzed. The<br />
result is believed to show the soil<br />
component anomalies in the irrigated and<br />
non irrigated areas and the possible causes.<br />
Visual presentation <strong>of</strong> the land with and<br />
without irrigation also gives some idea about<br />
the level <strong>of</strong> land degradation. Some GIS<br />
integrated slope analysis also provides slope<br />
differences and the intensity <strong>of</strong> erosion.<br />
In order to investigate water quality<br />
problems water samples from upstream and<br />
down stream areas were taken and these<br />
samples are supposed to show the spatial<br />
water quality changes. This intern helps to<br />
examine the impacts <strong>of</strong> the project on water<br />
quality. Quantity wise the irrigation water<br />
use will be incorporated to asses the<br />
problems emanating from under and/or over<br />
utilization <strong>of</strong> water.<br />
Long year’s meteorological data are used in<br />
order to evaluate the micro climate <strong>of</strong><br />
Finchaa valley area for temporal anomalies.<br />
In light <strong>of</strong> this panorama other<br />
environmental components are examined<br />
and possible solutions recommended. This<br />
again helps to foretell the sustainability <strong>of</strong><br />
the irrigation scheme in relation to climatic<br />
favorability.<br />
The unstructured interview to the concerned<br />
bodies and past research works furnish with<br />
valuable information with respect to the<br />
past-present natural and socio-economic<br />
setup <strong>of</strong> the area. These data are integrated<br />
with impact assessment and GIS/RS<br />
techniques in such a way that shows the kind<br />
and extent <strong>of</strong> changes that have been taking<br />
place.<br />
2. Impacts <strong>of</strong> the Irrigation project on<br />
Vegetation and Soil<br />
2.1. Impacts <strong>of</strong> the Irrigation project on<br />
vegetation cover<br />
2.1.1. General Conditions <strong>of</strong> Natural<br />
Vegetation Cover<br />
In developing countries the attention given<br />
for vegetation conservation is less compared<br />
to the need for development. In realizing<br />
their policies for food self sufficiency and<br />
agricultural productivity preeminent value is<br />
given for irrigation developments even some<br />
times at the expense <strong>of</strong> environmental<br />
considerations.<br />
Depending on the management system<br />
irrigation projects can have both positive as<br />
well as negative impacts on vegetation<br />
cover. Undoubtedly the expansions <strong>of</strong><br />
irrigation projects have many advantages.<br />
However, in most cases there happens<br />
change in the natural ecosystem following<br />
large scale irrigation developments.<br />
Obviously in order to under take large scale<br />
irrigation projects the vegetation cover in the<br />
area needs to be cleared and different<br />
construction activities should be carried out.<br />
Natural Vegetation as one <strong>of</strong> the eminent<br />
part <strong>of</strong> the ecosystem is negatively affected<br />
with such development activities. Large<br />
scale forest resource degradation can change<br />
the natural environment. This in turn puts<br />
the sustainability <strong>of</strong> irrigation projects in<br />
question. Conversely if appropriate<br />
consideration is given for vegetation<br />
conservation the forest area can be<br />
delineated and effective afforestation and<br />
reforestation can be carried out. For that<br />
matter vegetation resource can be keep hold<br />
around the hills, on vacant and marginally<br />
suitable lands. The conservation <strong>of</strong> natural<br />
vegetation can fix the problem <strong>of</strong> soil<br />
402
erosion, micro climatic disturbances,<br />
biodiversity and it balances many <strong>of</strong> the<br />
environmental systems.<br />
Well planned irrigation schemes have good<br />
natural vegetation conservation and<br />
management plans. Effective management<br />
and proper balancing <strong>of</strong> these seemingly<br />
conflicting issues should be treated wisely.<br />
Finchaa valley in the pre 1975 years was<br />
virtually under natural vegetation cover. The<br />
tall savanna grasses mixed with short and<br />
medium trees predominate the elevation<br />
below 1600m.The steep escarpments and the<br />
far down stream areas experience dense<br />
vegetation growth. The gallery forests<br />
occupy the networks <strong>of</strong> major rivers and<br />
their tributaries. As it is evident from the<br />
MSS satellite image <strong>of</strong> 1972 there was no<br />
apparent human intrusion to the valley.<br />
From unstructured interview made with<br />
local elders there were some individuals<br />
who went to the area to collect wild honey<br />
from trees and hunters for valor.<br />
The first intrusion to the valley was<br />
successfully made by the state farm in 1975.<br />
Since this time it is estimated that the state<br />
farm cleared about 3,500 hectors <strong>of</strong> land<br />
(vegetation) .The 1986 TM image reveals<br />
that some parts <strong>of</strong> the eastern and western<br />
banks <strong>of</strong> Finchaa River are occupied with<br />
some food and commercial crops. Even at<br />
this moment most part <strong>of</strong> the valley was<br />
under the natural vegetation cover.<br />
The construction <strong>of</strong> the road dawn the<br />
escarpment made the forest resources<br />
accessible and vulnerable for human<br />
interference. This opened up a new episode<br />
for the forest resource exploitation. Still to<br />
the present Finchaa valley is considered as<br />
an ideal site for hard wood and bamboo<br />
forests used for fire wood and construction<br />
activities.The beginning <strong>of</strong> 1990s can be<br />
seen as the second turning point in the forest<br />
history <strong>of</strong> the area. In these years Finchaa<br />
valley was selected as the most suitable site<br />
for sugar cane plantation and industrial<br />
development. In the mean time the state<br />
farm abandoned the farm and handed over<br />
the area to Finchaa sugar Factory. In 1991<br />
the Finchaa sugar project started extensive<br />
mechanized vegetation clearance. From the<br />
three major Companies that carried out the<br />
feasibility study any <strong>of</strong> them did not<br />
recommend for any single area buffering for<br />
natural vegetation conservation. Almost all<br />
attention was on sugar cane production and<br />
strategies for expansion. Accordingly the<br />
west bank <strong>of</strong> Finchaa River was considered<br />
more suitable and fertile and at present<br />
about 8,064.88 hector is under sugar cane<br />
plantation. (See fig 4.3)The factory<br />
neglected the east bank until the recent<br />
years. This year Vegetation clearance and<br />
land preparation has been taking place on<br />
the eastern bank. The total area <strong>of</strong> 7,108<br />
hector is expected to be irrigated. Despite<br />
the fact that the expansion escalates the<br />
industrial productivity, it further aggravates<br />
the problem <strong>of</strong> deforestation in the valley.<br />
.<br />
Figure 2.1. RGB/321 MSS satellite images <strong>of</strong><br />
Valley Area 1972 with 30 meter resolution.<br />
Figure 2.2. RGB/321 TM satellite<br />
Valley Area 1986 with 30 meter resolution.<br />
403
From the visual image interpretation it is<br />
evident that there is land cover change. Some<br />
features like the vegetation biomass are<br />
diminishing while some others like Finchaa<br />
Lake are increased in size. Even though there<br />
is large scale vegetation clearance there are<br />
efforts made by the factory to plant trees on<br />
unused areas. To the present Finchaa sugar<br />
factory under forestry department planted 600<br />
hectors <strong>of</strong> land in the afforestation program.<br />
One <strong>of</strong> the tree species preferred is eucalyptus<br />
tree .This was so for the accessibility <strong>of</strong> the<br />
tree.<br />
Figure 4.1. RGB/321 ETM satellite images <strong>of</strong><br />
Finchaa Valley Area 2000<br />
Currently the department has the plan to cover<br />
2,200 hectors <strong>of</strong> land under the reforestation<br />
and afforestation programs.However, this<br />
amount is very less with respect to the<br />
vegetation clearance which has been taking<br />
place for long years in the area. In comparison<br />
to the vegetation that has been cleared the<br />
present afforestation program reclaim for not<br />
more than 7.5 percent <strong>of</strong> the land under<br />
irrigation. Even if the future goal <strong>of</strong> the<br />
department is attained it reclaims only for<br />
about 27.3 percent <strong>of</strong> the present land under<br />
irrigation. At the time 13,000 hectors <strong>of</strong> land<br />
is irrigated if only 2,200 hectors <strong>of</strong> land is<br />
under forest cover it means that less than 17<br />
percent <strong>of</strong> the cleared land is revitalized.<br />
The irrigated field has increased a lot. In<br />
1997/98 about 932.27 hectors <strong>of</strong> land was<br />
harvested and after eight years that is in<br />
2005/06 it increased by more than seven folds.<br />
By implication the vegetation cover is<br />
retreating with the same or even more rate.<br />
Deforestation is the major problem in Finchaa<br />
valley area. The large scale vegetation<br />
clearances by the factory together with<br />
individuals earning a livelihood from forest<br />
products are devastating the vegetation<br />
resource. Forest fire is one <strong>of</strong> the critical<br />
causes for the vegetation degradation. In<br />
addition to the naturally instigated fire the<br />
factory and some individuals play a significant<br />
role in triggering the problem. The fire<br />
escaping from the frequent cane burning by<br />
the factory and irresponsible action by<br />
individuals who are looking for timber,<br />
charcoal, fire wood, Wild honey collection,<br />
construction wood and others exacerbate the<br />
obliteration.<br />
2.1.2. The Normalized Difference Vegetation Index<br />
Figure4.6. The Normalized vegetation<br />
Index results <strong>of</strong> Sept.2000 ETM image<br />
Normalized difference vegetation index<br />
(NDVI) is a method used to analyze the<br />
vegetation cover <strong>of</strong> an area. NDVI is<br />
calculated from reflectance measured<br />
inthe visible and near infrared channels<br />
from satellite-based remote sensing.<br />
NDVI shows the temporal and spatial<br />
change <strong>of</strong> Vegetation cover. The<br />
difference between two images is<br />
calculated by finding the difference<br />
between each pixel in each image and<br />
404
generating an image based on the result. The NDVI Analysis<br />
Figure4.6. The Normalized vegetation<br />
Index results <strong>of</strong> Dec.1972 TM image<br />
<strong>of</strong> the 1972 Multi spectral scanner (MSS)<br />
image <strong>of</strong> Finchaa valley area reveals that there<br />
is more vegetation biomass in the study area<br />
(NDVI>0) compared to the later years.<br />
The Normalized vegetation index <strong>of</strong> 2000<br />
image shows lesser vegetation biomass<br />
compared to the 1972 image. The expansion<br />
<strong>of</strong> cultivated areas, bare lands and built up<br />
areas are apparent in the NDVI analysis.<br />
These areas appeared as deep red and NDVI <<br />
0.0. This means that many areas that were<br />
formerly under vegetation cover are turned up<br />
into Human made features.<br />
<strong>Table</strong> 4.1: The Normalized Vegetation index result <strong>of</strong> the 1972, 1986 and 2000 satellite images.<br />
Year<br />
Landsat MSS Landsat TM Landsat ETM<br />
Mean Standard Mean Standard<br />
deviation<br />
deviation<br />
1972 87.3427 66.2614 - -<br />
1986 - - 80.4064 63.1612<br />
Mean<br />
Standard<br />
deviation<br />
2000 68.2834 58.5612<br />
<strong>Table</strong> 4.1 Reveals that the mean and standard<br />
deviation <strong>of</strong> the 1972, 1986 and 2000 images<br />
has been decreasing. This could indicate the<br />
rate <strong>of</strong> vegetation cover destruction.<br />
Generally the Visual image interpretation and<br />
the Normalized vegetation index results<br />
confirm that the vegetation biomass <strong>of</strong><br />
Finchaa valley area has been diminishing.<br />
There are three major factors that can explain<br />
this circumstance. These are the expansion <strong>of</strong><br />
agricultural lands, growing settlement areas<br />
and large scale deforestation that has been<br />
taking place for many years. Still the present<br />
trend indicates that the deforestation will<br />
continue to the virgin lands. By taking the<br />
aspiration <strong>of</strong> the factory for expansion in to<br />
consideration large effort should be made in<br />
afforestation and reforestation projects. Strict<br />
measures should be taken to stop illegal forest<br />
resource exploitation and the frequent fire.<br />
Afforestation and reforestation activities<br />
should not be considered as a superfluous<br />
405
activity. Beyond harmonizing many <strong>of</strong> the<br />
natural systems they can serve as a means to<br />
solve many problems like soil erosion, hot<br />
4.2. Impacts <strong>of</strong> the Irrigation project on Soil<br />
Soil is one <strong>of</strong> the most decisive natural<br />
resources. It has been supporting the<br />
increasing number <strong>of</strong> life in our planet earth.<br />
Now a days the large number <strong>of</strong> population<br />
increased the demand for food, this in turn put<br />
forth full-size pressure on land /soil resource.<br />
Areas formerly considered as marginal are<br />
currently being cultivated. The demand for big<br />
yield created enthusiasm to look for<br />
alternative means. One <strong>of</strong> these is getting<br />
bigger yield through customary agricultural<br />
practices like irrigation systems, use <strong>of</strong><br />
fertilizers, pesticides, herbicides and many<br />
other agricultural inputs.<br />
Irrigation schemes beside their positive<br />
contributions have many shortcomings on the<br />
physical and chemical properties <strong>of</strong> soil in<br />
particular and the environment in general. The<br />
FAO repository document mentioned some <strong>of</strong><br />
the adverse impacts <strong>of</strong> irrigation schemes on<br />
weather conditions, degradation <strong>of</strong><br />
biodiversity, fire wood and wood product<br />
requirements and many others.<br />
soils which include Salinization, Alkalization,<br />
<strong>Water</strong> logging, soil pollution and Soil<br />
acidification.There are two dominant soil<br />
types in the project area; these are<br />
the Luvisols and vertisols. Luvisols covers 75<br />
percent <strong>of</strong> the irrigated land. These soils are<br />
partly made <strong>of</strong> alluvial and colluvial materials<br />
from the surrounding escarpments. Luvisols<br />
has limited fertility and agricultural suitability.<br />
<strong>Water</strong> logging is not a vital problem in the<br />
area as the factory is using over head sprinkler<br />
irrigation system. This consecutively evades<br />
the problem <strong>of</strong> salinization. In order to<br />
maximize production the Agro-chemicals have<br />
been used in the irrigation fields .The most<br />
common ones are fertilizers, pesticides and<br />
herbicides. The two commonly applied<br />
fertilizers are Urea and Dap. The brief<br />
summery <strong>of</strong> the total amount <strong>of</strong> agrochemicals<br />
is presented in table 4.1. (See<br />
Appendix 4 for the details)<br />
406
<strong>Table</strong> 4.2. Shows that the use <strong>of</strong> fertilizers, pesticides and herbicides has been increased in an<br />
alarming rate with the expansion <strong>of</strong> irrigation. The Use <strong>of</strong> large scale agro-chemicals alter the<br />
physical and chemical properties <strong>of</strong> the soil which can damage the soil quality and use full living<br />
organisms.<br />
Year Fertilizers (Qunt.) Pesticides(Lts.) Herbicides(Lts.)<br />
1994/95 219.4 480 5<br />
1995/96 5,224 20,074.5 8<br />
1996/97 5,806 10,403 267<br />
1997/98 4,003 311.8 20<br />
1998/99 15,952.68 5,278 716<br />
1999/00 17,264.9 10,914.56 216.51<br />
2000/01 23,097.01 25,794.31 2,943<br />
2001/02 19,444.25 17,585.9 2,330<br />
2002/03 23,274.7 15,899.51 1,019<br />
2003/04 25,760.3 14,370.63 2,368<br />
2004/05 36,538.69 17,837 2,712<br />
Total 176,584.93 138,949.21 12604.51<br />
In order to see whether there is change in the<br />
soil physico-chemical properties <strong>of</strong> the<br />
dominant Luvisols in the irrigated fields<br />
samples are collected and analyzed. Luvisols<br />
are preferred for analysis because 75 percent<br />
<strong>of</strong> the irrigation is carried out in this soil. The<br />
samples are taken from three sites in three<br />
layers. The first site is the non irrigated field<br />
where there is no human interference. The<br />
second site is ploughed but not yet planted<br />
field. In this site none <strong>of</strong> the agricultural inputs<br />
are applied. The third site is the irrigated field<br />
where the agricultural inputs have been used.<br />
In each <strong>of</strong> the three sites soil samples from<br />
three spots are collected and mixed to form<br />
only one composite soil sample. The three<br />
layers are the top layer (0-30 cm), the middle<br />
layer (30-60) and the bottom layer (60-<br />
90cm).Totally nine samples were investigated<br />
and the result will be presented under 4.2.1<br />
and 4.2.2. The three spots are believed to show<br />
the possible positive and/or negative impacts<br />
<strong>of</strong> irrigation scheme on the physical and<br />
chemical properties <strong>of</strong> the soil. In addition the<br />
comparative results <strong>of</strong> samples from cultivated<br />
but not planted and non irrigated spots can<br />
reveal weather the change is due to human<br />
intervention or natural causes. The soil sample<br />
from vegetation cover area is supposed to<br />
reveals the natural properties <strong>of</strong> the Luvisols<br />
in the area. Thus, the site selection for soil<br />
samples is intentional and made in such away<br />
that shows the impacts <strong>of</strong> irrigation on the<br />
physical and chemical properties <strong>of</strong> the soil.<br />
2.2.1. Irrigation and Physical properties <strong>of</strong><br />
the soil<br />
The Luvisols and vertisols occupy more than<br />
95 percent <strong>of</strong> the Finchaa valley area. Luvisols<br />
have reddish brown color and weakly<br />
developed structure. They have also shallow<br />
pr<strong>of</strong>ile and limited fertility. Luvisols are<br />
composed <strong>of</strong> sand which decreases with<br />
increasing depth. This soil is the most<br />
exploited soil in the valley. About 75 percent<br />
<strong>of</strong> the irrigation is carried out on Luvisols. The<br />
vertisols on the other hand have black color<br />
407
and shallow pr<strong>of</strong>ile. Vertisols contains more<br />
clay materials with increasing depth.<br />
<strong>Table</strong> 4.3.The physical properties <strong>of</strong> the Luvisols from irrigated, Ploughed<br />
vegetated area in three layers. (0-30, 30-60, 60-90)<br />
but not planted, and<br />
LUVISOLS FROM IRRIGATED<br />
FIELD<br />
FROM PLOUGHED<br />
BUT NOT PLANTED<br />
FROM VEGETATED<br />
AREA<br />
Depth(cm) 0-30 30-60 60-90 0-30 30-60 60-90 0-30 30-60 60-90<br />
Total sand (percent) 63.55 57.33 53.34 51.16 41.87 41.78 51.56 35.78 41.35<br />
Silt (percent) 4.17 2.08 7.26 7.60 4.39 4.39 12.37 25.27 11.52<br />
Clay (percent) 32.28 40.59 39.40 41.25 53.74 53.83 36.07 38.95 47.13<br />
Texture class SCL SC SC SC C C SC CL C<br />
Ph-H2o(1:2.5) 5.62 5.20 4.89 5.62 5.04 5.04 4.86 4.48 4.56<br />
Ph-kcl(1:2.5) 5.16 4.79 4.76 5.08 4.57 4.58 4.42 4.00 3.87<br />
Ec(ms/cm)(1:2.5) 0.03 0.04 0.02 0.03 0.01 0.01 0.06 0.02 0.01<br />
<strong>Table</strong> 4.3 illustrates that the total sand content<br />
<strong>of</strong> Luvisols decreases with increasing soil<br />
depth in all sampled layers. The silt content <strong>of</strong><br />
the soil from vegetated area is higher. This can<br />
be due to the lesser amount <strong>of</strong> erosion in<br />
vegetated areas compared to the cultivated<br />
areas. The clay content <strong>of</strong> the soil in ploughed<br />
and vegetated areas increases with the<br />
increasing depth. Unlike the non irrigated<br />
fields the clay content <strong>of</strong> the soil from<br />
irrigated site is higher in the 30-60 cm depth.<br />
This can be due to the excess water that<br />
dissolves soluble minerals and percolates<br />
down. On its way it accumulates the insoluble<br />
clay in this horizon. Generally the texture<br />
class <strong>of</strong> the Luvisols in all locations ranges<br />
from sand clay loam (SCL) to clay (C). Such<br />
soils are known to be suitable for irrigated<br />
cane plantation with cautious soil<br />
management. The soils in all the three spots<br />
<strong>of</strong> the three layers are found to be acidic. The<br />
PH is less than 5.6. It is investigated that there<br />
is perceptible PH difference between irrigated<br />
and non irrigated soil. The average PH value<br />
<strong>of</strong> the soil in the irrigated area is 5.3 where as<br />
in the vegetation area the value is 4.6. This<br />
shows that the soil in the vegetation cover site<br />
is more acidic than the soil in the irrigated<br />
field. Theoretically the fertilizers, pesticides<br />
and herbicides that have been applied to the<br />
cane fields seem to increase the PH <strong>of</strong> the soil.<br />
But the result shows that the soil in the<br />
irrigation field is less acidic than in the<br />
vegetation area. Three main reasons can<br />
explain this result. In the first place the surplus<br />
water use in the irrigated areas can wash the<br />
chemicals vertically and laterally. Secondly<br />
cultivation by itself can alter the inherent Ph<br />
<strong>of</strong> the soil by exposing the soil. Finally the<br />
respective composition <strong>of</strong> the soil forming<br />
parent material can be different in the sample<br />
sites.<br />
2.2.2 Irrigation and Chemical properties <strong>of</strong><br />
the soil<br />
The Normal Soil chemical properties can be<br />
altered by natural and human made factors.<br />
Industrial toxic wastes, hazardous chemicals,<br />
Agricultural malpractices and inputs, and<br />
many others constitute the human factors.<br />
Alternatively due to some natural processes in<br />
the system there may be alteration <strong>of</strong> soil<br />
chemical properties. In this respect the<br />
408
physico-climatic conditions play a key role to<br />
change the chemical properties <strong>of</strong> the soil.As<br />
it is illustrated in table 4.4 the average amount<br />
<strong>of</strong> chemical elements in the three sample areas<br />
are different. The amount <strong>of</strong> exchangeable<br />
bases (Exch. Na, K, Ca and Mg) varies with<br />
increasing depth. Generally speaking the<br />
amount <strong>of</strong> Potassium, Calcium and<br />
Magnesium decreases with increasing depth<br />
while sodium increases with<br />
depth.Exchangeable calcium and sodium is<br />
higher in the irrigation and cultivated but not<br />
planted fields than the vegetated areas. The<br />
total percentage <strong>of</strong> Nitrogen is higher in the<br />
irrigation field. The Available phosphorous is<br />
extremely high in the top layer <strong>of</strong> the<br />
irrigation fields. These higher amounts in the<br />
irrigation field are due to the fertilizers (Urea<br />
and DAP) that have been used in the irrigated<br />
areas. The organic carbon is found in higher<br />
quantity in the vegetated area. The soil sample<br />
from the vegetation area are found to be more<br />
acidic than the irrigation Fields. This is mainly<br />
due to high organic content in the vegetated<br />
areas. On the other hand the less acidic nature<br />
<strong>of</strong> the soil in the irrigated area is related to the<br />
exposure and excess water use in the irrigation<br />
fields.<br />
Luvisols Irrigated field Cultivated but<br />
not planted<br />
Vegetated area<br />
Depth in cm 0-30 30- 60-90 0-30 30-60 60-90 0-30 30-60 60-90<br />
60<br />
Exch. Na(meq/100gm <strong>of</strong> soil 0.13 0.16 0.13 0.15 0.13 0.17 0.13 0.11 0.13<br />
Exch. K(meq/100gm <strong>of</strong> soil) 0.20 0.15 0.16 0.27 0.20 0.21 0.48 0.18 0.16<br />
Exch.Ca(meq/100gm <strong>of</strong> soil) 5.82 5.82 5.18 9.50 8.72 8.72 4.99 3.36 3.36<br />
Exch. Mg (meq/100gm <strong>of</strong> soil 4.16 4.20 2.59 6.05 2.62 4.36 4.99 4.20 5.04<br />
Sum <strong>of</strong> cations (meq/100gm <strong>of</strong> 10.48 10.54 8.19 16.13 11.90 13.69 11.39 9.66 11.34<br />
soil)<br />
CEC(meq/100gm <strong>of</strong> soil) 14.02 14.48 14.56 23.95 25.12 26.54 24.87 21.46 15.52<br />
Organic carbon (percent) 1.17 0.58 1.69 0.90 0.65 0.65 1.40 1.14 0.78<br />
Nitrogen (percent) 0.14 0.10 0.14 0.13 0.09 0.09 0.09 0.07 0.05<br />
Available P(mg p 2 o5/kg soil) 29.20 5.10 4.00 7.80 2.80 2.80 2.60 2.70 2.70<br />
Exchangeable Acidity 0.17 0.21 0.13 0.13 0.22 0.22 0.38 1.79 2.65<br />
409
In addition the acidic nature <strong>of</strong> the soils in the<br />
vegetation areas shows that the soil in the area<br />
is naturally acidic and the human intervention<br />
minimizes the soil acidity.<br />
Generally the analysis <strong>of</strong> the three soil samples<br />
indicates that there is alteration <strong>of</strong> some <strong>of</strong> the<br />
soil physical and chemical properties as a<br />
result <strong>of</strong> the irrigation scheme. The level <strong>of</strong><br />
alteration hardly results in full-sized soil<br />
pollution at this level. However the<br />
cumulative impact could grow in to soil quality<br />
degradation. Thus there are signs <strong>of</strong> soil<br />
pollution in the Irrigated areas. There are<br />
several reasons that can explain this condition<br />
<strong>of</strong> which application <strong>of</strong> the agro-chemicals is<br />
one.<br />
2.2.3. Soil Degradation<br />
It is found out that one <strong>of</strong> the preeminent<br />
problems <strong>of</strong> soil in Finchaa valley area is<br />
erosion. There is active soil erosion in the<br />
surrounding areas and irrigated fields. The<br />
surrounding steep escarpments with average<br />
slope ranging from 5 to 65 percent create<br />
favorable condition for erosion. There is also<br />
high rain fall intensity (90-120mm/hr) which is<br />
highly erosive. Rain fall intensity greater than<br />
50mm/hr is believed to be erosive. In Finchaa<br />
valley area human intervention exacerbates the<br />
problem <strong>of</strong> erosion, especially deforestation<br />
and road construction. The large scale<br />
deforestation exposed the soil for agents <strong>of</strong><br />
erosion and contributes for high run<strong>of</strong>f. Due to<br />
terrain inconvenience the roads have been<br />
constructed by dissecting hills and uplands<br />
which facilitate the birth and intensification <strong>of</strong><br />
sheet, rill and gully erosions. Road<br />
construction and the frequent maintenance also<br />
play a vital role in aggravating the problem.<br />
The energetically operating sheet, rill and gully<br />
erosions around the escarpment donate the<br />
fertile top soil to the valley floor. This partly<br />
fed fertile soil to the irrigation fields. On the<br />
other hand however, the high run<strong>of</strong>f from<br />
elevated ridges accelerates the formation and<br />
intensification <strong>of</strong> gully and considerable<br />
deposition on the roads and cane fields. The<br />
active erosion and expansion <strong>of</strong> gully in the<br />
road side made road construction a year round<br />
activity. In addition beyond taking the fertile<br />
top soil erosion has been expanding active<br />
gullies and turns the potentially irrigable lands<br />
in to bad land.<br />
Figure 4.9. Slope based Interpolation Map<br />
showing General Conditions <strong>of</strong> erosion<br />
There is a general elevation decline from south<br />
to north and from the eastern and western<br />
edges to Finchaa River. This indicates that the<br />
general trend <strong>of</strong> erosion is to Finchaa River<br />
first and finally to the Abay gorge. The<br />
tributaries fed fertile soil to Finchaa River and<br />
the soil finally transported to Abay River.<br />
The digital elevation model based run <strong>of</strong>f<br />
estimate indicates that there is high run<strong>of</strong>f<br />
pattern in the areas that lies from the eastern<br />
and western escarpments to the banks <strong>of</strong><br />
Finchaa River. This is due to the steep slope<br />
down the escarpment to the valley floor.<br />
Obviously the high run<strong>of</strong>f in these areas<br />
contributes for high rate <strong>of</strong> erosion. Thus the<br />
topographic set up and human activities make<br />
soil erosion to be a critical problem in the<br />
study area.<br />
In a nutshell one <strong>of</strong> the critical problems <strong>of</strong> soil<br />
resource in the project area is erosion. The use<br />
<strong>of</strong> agro-chemicals in the irrigation fields has<br />
also its own share to degrade the soil quality.<br />
Soil pollution emanating from chemical<br />
pollutants is found to be moderate in the study<br />
area. This can be due to soluble nature <strong>of</strong><br />
chemicals that have been applied and the<br />
quantity in proportion to the total sampled<br />
soils. But there is greater possibility <strong>of</strong> the<br />
agro-chemical use in the irrigation fields to<br />
alter the soil quality in the long run.<br />
The Soil erosion mainly takes the fertile top<br />
soil and contributes for expansion <strong>of</strong> gullies<br />
and there by reduce the potentially irrigable<br />
lands. These two major soil problems needs<br />
proper follow up and management. If the<br />
present trend continues, in the long run the<br />
problem <strong>of</strong> soil/land degradation can put the<br />
sustainability <strong>of</strong> the project in question.<br />
Persistent and considerable efforts should be<br />
made to mitigate the impacts <strong>of</strong> erosion on the<br />
soil and potentially irrigable lands.<br />
410
2.2.4. Land use and Land cover<br />
Finchaa valley area have transformed from<br />
primary to secondary and tertiary economic<br />
activities; from traditional agriculture to<br />
industrial and commercial activities. There is<br />
land use land cover change in the area since<br />
1975.<br />
In the pre 1975 years there were no<br />
considerable land use classes in Finchaa valley<br />
area. Most <strong>of</strong> the areas were under the natural<br />
vegetation cover. From 1975-1991 the state<br />
farm used to produce some food and<br />
commercial crops on about 3,500 hectors <strong>of</strong><br />
land in the valley floor. This incident attracted<br />
few people to the area to get jobs in the farm<br />
but still the number was not that much<br />
substantial. During this period there were no<br />
significant land use classes except for the state<br />
farm and few fragmented private holdings out<br />
side the valley. With the beginning <strong>of</strong> the sugar<br />
project in 1991 extensive land has been cleared<br />
and irrigated. Currently the irrigated land is<br />
about 8,064.88 hectors and the built up areas<br />
occupy approximately 200 hectors <strong>of</strong> land in<br />
the valley. The dominant land use classes are<br />
irrigation agriculture; Rain fed agriculture,<br />
built up areas, roads, artificial reservoir, lakes,<br />
and others.<br />
The land cover <strong>of</strong> the study area can be<br />
categorized in to two classes. These are the<br />
natural and artificial land covers. The human<br />
made features in the area composed <strong>of</strong> towns,<br />
roads, drainage canals, ponds, agricultural and<br />
irrigated fields, and artificial lakes. Only a few<br />
artificial structures are observed near Finchaa<br />
dam in the MSS image <strong>of</strong> 1972 following the<br />
construction <strong>of</strong> the dam. (See figure 4.1) In<br />
these years approximately more than 95percent<br />
<strong>of</strong> the area was under natural environment.<br />
In the TM image <strong>of</strong> 1986 some artificial<br />
developments have been observed (See Figure<br />
4.2).This is mainly because <strong>of</strong> the introduction<br />
<strong>of</strong> the state farm to the valley and slight<br />
population growth in the surrounding high<br />
lands. From this time on wards agricultural<br />
lands have been expanding in the valley and<br />
the surrounding areas.<br />
it is evident that many <strong>of</strong> the area were under<br />
Savanna grasses, open wood land and dense<br />
forest. There were no significant land use<br />
classes in this year. The present Amerti Lake<br />
was in its swamp stage. In the upper right<br />
corner the area that appeared as lake is<br />
incorrect .Rather it is spike involved during<br />
Satellite image acquisition. In the land use<br />
classification <strong>of</strong> 1972 the built up area<br />
category is very small and insignificant and<br />
therefore not represented in the unsupervised<br />
classification. In this year very few agricultural<br />
plots are observed.<br />
In the ETM image <strong>of</strong> 2000, which is after 22<br />
years, significant human made features are<br />
evident in and around Finchaa valley. The vast<br />
irrigation fields and built up areas have<br />
increased. By implication the vegetation<br />
biomass in these areas has diminished. (See fig<br />
4.3)<br />
In the surrounding areas the rain fed<br />
agricultural plots have intensified. Some<br />
smaller towns and villages are observed<br />
including Finchaa town, Achane, Homi and<br />
Kombolcha villages. The size <strong>of</strong> Finchaa Lake<br />
is also increased compared to the pre 2000<br />
years. However from the field observation it is<br />
perceptible that in recent years the size <strong>of</strong> the<br />
lake is diminishing. In the<br />
Figure 4.12. Supervised Land use/ land cover<br />
Map Of 2000 image.<br />
unsupervised classification map agricultural<br />
land, built up areas, bare lands and the size <strong>of</strong><br />
the lake have increased in size. The Amerti<br />
swamps grow in to a perennial lake.<br />
Conversely the total share <strong>of</strong> dense forest,<br />
411
open wood land, savanna grass lands have<br />
diminished.<br />
Generally there have been land use and land<br />
cover changes in the study area. This is mainly<br />
due to favorable climate and environmental<br />
conditions which instigate agricultural and<br />
industrial development activities in the area.<br />
This phenomenon was in turn followed by<br />
population growth and intensification <strong>of</strong><br />
agriculture and industrial developments. The<br />
development <strong>of</strong> the irrigation scheme in the<br />
project area facilitates the alteration <strong>of</strong> the<br />
natural ecosystem and brought changes in the<br />
land use land cover <strong>of</strong> the study area.<br />
2.2 Irrigation project and water Quality<br />
and Health Conditions<br />
2.2.1. Impacts <strong>of</strong> Irrigation project on<br />
<strong>Water</strong> Quality<br />
2.2.2 General Conditions <strong>of</strong> water in<br />
Finchaa Valley Area<br />
In the study area the Finchaa and Amerti-<br />
Nashe rivers form the main drainage system.<br />
They both join the Abay River in the far down<br />
stream area. The irrigation field and the<br />
Finchaa sugar factory lie with in the networks<br />
<strong>of</strong> Finchaa river system. They both relay on<br />
this river to meet their water requirement.<br />
Finchaa River is diverted to cane fields near<br />
the power house in the upstream area through<br />
concrete canals. At present the west bank<br />
canals run for about 44 kilometers. <strong>Water</strong> from<br />
the canal is pumped to irrigation fields and<br />
finally sprinklers shower the water to the<br />
growing cane. The extra water from cane fields<br />
flow to the near by ditches and join one <strong>of</strong> the<br />
nearest tributary streams.<br />
On the other hand the industrial waste water is<br />
taken to the treatment plant which is situated to<br />
the east <strong>of</strong> the factory. The factory uses a rock<br />
filtration treatment method. However some <strong>of</strong><br />
the instruments <strong>of</strong> the treatment are<br />
nonfunctional. The waste water coming from<br />
the factory over flows due to these broken<br />
parts and two stream-sized crude waste water<br />
flows to Finchaa River. These direct leakages<br />
together with the agro-chemicals from<br />
irrigation fields indisputably alter the physicochemical<br />
properties <strong>of</strong> the water.<br />
This phenomenon affects the living organisms<br />
in water in particular and the environment in<br />
general. Again Finchaa River as one <strong>of</strong> the<br />
tributaries <strong>of</strong> Abay River crosses the<br />
boundaries <strong>of</strong> Sudan and Egypt. Any water<br />
quality problem in this place arise dispute with<br />
these countries. Thus strict water quality<br />
control works should be carried out in and<br />
around the industrial and agricultural sites.<br />
2.2.3. The Physico-Chemical Properties <strong>of</strong> the<br />
Up Stream and Down Stream <strong>Water</strong><br />
The physical and chemical properties <strong>of</strong> water<br />
characterize the water quality. These properties<br />
<strong>of</strong> water are susceptible for change. The<br />
addition <strong>of</strong> toxic wastes to the surface or sub<br />
surface water alters the normal composition.<br />
The PH for instance is sensitive and decisive<br />
factor for the survival <strong>of</strong> living organisms in<br />
water.On experimental lakes in North West<br />
Ontario Schindler (1988) find out that due to<br />
change <strong>of</strong> PH from 5.4 to 5.1 over all, the<br />
number <strong>of</strong> species in the lake at PH 5.1 was 30<br />
percent lower than in the pre acidification<br />
years. In order to asses the impacts <strong>of</strong> the<br />
agro-chemicals and industrial wastes, water<br />
Samples from the up stream and down stream<br />
areas are taken and analyzed. (See Appendix<br />
5)<br />
The up stream area refers to the water near the<br />
power house where the water does not get in<br />
contact with water from irrigation and<br />
industrial wastes sites. The down stream<br />
comprises the water after it mixes up with<br />
water from streams in the irrigated and<br />
industrial waste sites. (See Figure 5.2 for<br />
sample sites)<br />
In order to increase the accuracy <strong>of</strong> the results<br />
water sample was not taken from the irrigation<br />
ditches and direct industrial waste water.<br />
Rather the Mixed down stream water was<br />
preferred so as to avoid inaccuracies and<br />
exaggerated results.The physical properties <strong>of</strong><br />
water like pH, EC, Odor and color are found to<br />
be different in the upstream and down stream<br />
areas. The PH and EC are lower in the<br />
upstream water compared to the down stream<br />
water. This could be due to difference in the<br />
chemical constituents in these two sites. The<br />
color differences are also discernable.<br />
412
140<br />
120<br />
100<br />
80<br />
60<br />
40<br />
20<br />
0<br />
-2 0<br />
T e m p ( o c )<br />
P H<br />
E C<br />
A m m o n i a<br />
S o d i u m<br />
P o t a s s i u m<br />
T o t a l<br />
h a r d n e s s<br />
C a lc iu m<br />
M a g n e s i u m<br />
N i t r i t e<br />
N i t r a t e<br />
Upstream<br />
Dow n stream<br />
The results <strong>of</strong> the water chemical analysis also<br />
indicate that some elements are found in a<br />
higher quantity in the down stream than the<br />
upstream water. (See appendix 5)<br />
As it is evident from Figure 5.3 almost all <strong>of</strong><br />
the inspected elements are found to be higher<br />
in the down stream water. This could be due to<br />
two major reasons. In the first place the extra<br />
water washed the agro-chemicals from<br />
irrigated<br />
Figure 5.3. The physical and chemical<br />
properties <strong>of</strong> upstream<br />
and down Stream <strong>Water</strong> from Finchaa<br />
River.<br />
fields and joins the river.<br />
The Second main reason is the liquid waste<br />
from the industry and the urban areas that<br />
directly or indirectly drains to surface or<br />
subsurface water. These two cases comprise<br />
the point and non point source for the<br />
pollution. The industrial waste water escaping<br />
from the treatment plant forms the point source<br />
pollution while the agro-chemicals from<br />
irrigation field cover the non point source for<br />
the pollution.<br />
In an effort to alleviate the problem <strong>of</strong> water<br />
pollution the point and non point sources should<br />
be given priority. As a point source the<br />
contribution <strong>of</strong> waste <strong>Water</strong> from the industry<br />
can be addressed by continuous follow up and<br />
maintenance <strong>of</strong> the treatment plant. It is again<br />
advisable to replace the treatment plant with<br />
modern and effective instruments and methods.<br />
And the problem <strong>of</strong> non point source can be<br />
mitigated by avoiding the direct contact <strong>of</strong> the<br />
excess water from irrigation ditches and<br />
metropolitan wastes with the river and tributary<br />
streams. This can be possible by creating a<br />
buffer around Finchaa and Amerti-Nashe Rivers<br />
and major tributaries. (See figure 5.4)<br />
The buffered zone needs to be covered with<br />
vegetation so as to enhance soil and plant litter<br />
filtration and purification. As an alternative<br />
approach the extra water from the irrigation<br />
field can be collected in an artificial reservoir<br />
and treated before it discharges to the main<br />
rivers.<br />
Generally, the water samples from Finchaa<br />
River indicate that there is water quality<br />
difference between the upstream and down<br />
stream area. This shows that, to a greater or<br />
lesser extent, there is water pollution in the<br />
River. The discrepancy in the physicochemical<br />
properties <strong>of</strong> water is supposed to be<br />
from the industrial wastes, agro-chemicals<br />
from irrigation fields and to a lesser extent<br />
metropolitan wastes forming the point and non<br />
point sources.<br />
Figure 5.4. 100m Buffer around the Finchaa<br />
and Nashe rivers and their major tributaries.<br />
2.2.4. Health Conditions in the Post<br />
Development Years Of the Irrigation<br />
project<br />
There is no recorded health status data before<br />
the establishment <strong>of</strong> Finchaa sugar factory as<br />
there was no settlement in the valley.<br />
However, from unstructured interview made<br />
with local inhabitants some people asserted<br />
that the area had been affected by epidemics<br />
even before the arrival <strong>of</strong> the state farm. The<br />
interviewee sited the problem as one <strong>of</strong> the<br />
impeding factor for permanent settlement not<br />
to take place inside the valley in the former<br />
years.<br />
Booker international agriculture Ltd (1977) in<br />
the feasibility study for Finchaa sugar project<br />
affirmed that there exists Malaria and Tsetse<br />
fly in the valley. The company added that this<br />
could be a challenge for the project workers<br />
and residents <strong>of</strong> the valley. Currently there is<br />
one health center in the valley and some<br />
recorded case information is available.<br />
Accordingly the intestinal and malaria cases<br />
have been increased from 1992 on wards.<br />
From the informal interview made with the<br />
staff <strong>of</strong> the health center three possible<br />
rationales can explain this scenario. In the first<br />
place the water used for drinking is pumped<br />
from the canal with diminutive treatment.<br />
Secondly the expansion <strong>of</strong> irrigation can<br />
facilitate the spread <strong>of</strong> malaria and access to<br />
unclean water. Finally the population<br />
explosion in a short period <strong>of</strong> time may inflate<br />
413
the proportion <strong>of</strong> patients compared to the<br />
early years.<br />
Malaria is the top health problem in the last 12<br />
years. The fluctuating Weather conditions<br />
together with the expansion <strong>of</strong> irrigated fields<br />
and ditches can be the factors behind the<br />
problem. The fluctuation in malaria case<br />
records arises from the inconsistent use <strong>of</strong> antimalaria<br />
chemical sprays and expansion <strong>of</strong><br />
irrigated lands. The Second and third top<br />
health threats are Guardia and Ascaries. These<br />
intestinal problems in most cases are water<br />
born disease which can be related with<br />
unhygienic water use for drinking. The<br />
haphazard increment <strong>of</strong> intestinal parasite and<br />
malaria case records can be due to natural or<br />
human made reasons. On one hand the natural<br />
set up <strong>of</strong> the valley and the climatic conditions<br />
can facilitate the birth and growth <strong>of</strong><br />
pathogenic organisms in the area. On the other<br />
way round human interference have changed<br />
some <strong>of</strong> the existing natural systems. In other<br />
word the expansion <strong>of</strong> human made<br />
environments results in alteration and<br />
degradation <strong>of</strong> the natural ecosystem.<br />
These environmental modifications create a<br />
fertile ground for some insects and pathogenic<br />
organisms which give birth to the spread <strong>of</strong><br />
diseases. The classical example here is the<br />
4500<br />
4000<br />
3500<br />
3000<br />
2500<br />
2000<br />
1500<br />
1000<br />
500<br />
0<br />
1992 1993 1994 1995 1996 1997 1998 1999 2000<br />
M a le ria c a se<br />
Irrigation field(ha)<br />
expansion <strong>of</strong> irrigation and increasing malaria<br />
case records.<br />
Figure 5.9.Expansion <strong>of</strong> Irrigation fields Vs<br />
Malaria case records.<br />
As it is evident from figure 5.10 Malaria cases<br />
are increasing with the expansion <strong>of</strong> irrigation<br />
fields. In the beginning few malaria cases were<br />
seen in the valley. For the 1992 and 1993 there<br />
were no recorded malaria cases data available<br />
in the health center. But for the consecutive<br />
two years fewer malaria cases were recorded.<br />
From 1995-1997 large number <strong>of</strong> malaria<br />
cases were observed. (See appendix 3) In these<br />
years extensive sugar cane plantation was<br />
carried out in the valley. The lag time between<br />
highest malaria case and the expansion <strong>of</strong><br />
irrigation could be due to the time taken for<br />
reproduction and stages <strong>of</strong> development in<br />
human body.<br />
In general there is no health data available on<br />
the pre irrigation development years <strong>of</strong> the<br />
valley. Since 1992 malaria and intestinal<br />
parasite case records have increased.<br />
Conversely the health facility given in the<br />
valley has improved a lot since 1992.It is<br />
found out that there is a positive relation ship<br />
between malaria cases and expansion <strong>of</strong><br />
irrigation fields. The intestinal health threats<br />
are also interlinked with unclean drinking<br />
water. Well organized preventive and<br />
controlling measures should be implemented<br />
as the health cases are interrelated with<br />
workers productivity.<br />
3. Conclusions<br />
In order to see the possible environmental<br />
impacts <strong>of</strong> irrigation projects some parameters<br />
were selected. Some <strong>of</strong> the Geographic<br />
information system and remote sensing<br />
techniques were also used. Accordingly, it is<br />
observed that the natural environment in<br />
Finchaa valley has been modified due to<br />
agricultural and industrial developments since<br />
1975. Following this modification the<br />
irrigation project have both positive as well as<br />
negative impacts on the environment.<br />
From the positive contributions the project<br />
opened up large scale job opportunities for<br />
many thousands <strong>of</strong> people. It has also many<br />
socio-economic benefits for the valley and<br />
surrounding people. In addition Finchaa Sugar<br />
factory play a key role to address the current<br />
sugar demand in a local market. There are also<br />
many efforts to exploit the byproducts <strong>of</strong> the<br />
factory for other extra purposes like using<br />
ethanol for fuel. The project has also an<br />
important role for the growth <strong>of</strong> national GDP<br />
and GNP.<br />
On the other hand the attention given for<br />
natural resource conservation is less and this<br />
has been devastating some <strong>of</strong> the<br />
environmental components. There has been<br />
large scale vegetation clearance taking place in<br />
the study area. The NDVI image analysis <strong>of</strong><br />
the 1972 MSS and the 2000 ETM images<br />
shows that the vegetation biomass is<br />
diminishing. The intensification <strong>of</strong> agricultural<br />
and industrial developments together with<br />
population explosion has the coin share for the<br />
decrement. The large scale deforestation has<br />
414
een devastating the vegetation and wild life<br />
resources in particular and the biodiversity in<br />
general. There are efforts made by Finchaa<br />
sugar factory to rehabilitate the forest resource.<br />
But the amount and rate <strong>of</strong> deforestation in one<br />
side and the reforestation and afforestation<br />
projects on the other side are incomparable in<br />
any measure.<br />
In addition deforestation is facilitating the<br />
progress <strong>of</strong> run<strong>of</strong>f and accelerates erosion.<br />
Accordingly soil erosion is a critical problem<br />
in the project area. The active erosion, beyond<br />
taking the fertile top soil, is changing some <strong>of</strong><br />
the potentially irrigable lands in to Bad Lands.<br />
In some areas there are gullies that extend for<br />
about 30 m. The topographic set up and<br />
Human induced factors are responsible for the<br />
active erosion in the area. The steep slope in<br />
the escarpments surrounding the valley<br />
promotes greater run<strong>of</strong>f. The Road<br />
construction and the frequent maintenance<br />
down the valley made the soil ready for<br />
erosion.<br />
The physical and chemical analysis <strong>of</strong> the soil<br />
samples taken from irrigated field, cultivated<br />
but not yet planted and Vegetation cover area<br />
are found to be different. The total sand<br />
content <strong>of</strong> Luvisols decreases with increasing<br />
soil depth in all sampled layers. While the clay<br />
content increases with depth. The<br />
exchangeable bases are higher in the irrigated<br />
and cultivated area than the vegetation cover<br />
area. Relatively Organic carbon, Nitrogen and<br />
phosphorous are found in large quantities in<br />
the irrigation fields especially in the upper<br />
layer (0-30cm). The use <strong>of</strong> agro-chemicals in<br />
the irrigation fields are supposed to contributes<br />
for this result. In general some <strong>of</strong> the physical<br />
and chemical properties <strong>of</strong> the soil in the<br />
irrigated and non irrigated sites are found to be<br />
different. This shows that, to a lesser or greater<br />
extent, there is soil contamination that could<br />
lead to full-size soil pollution. The result <strong>of</strong><br />
water samples from up stream and down<br />
stream areas indicates that the physicochemical<br />
properties are different in these two<br />
areas. The down stream water contains more<br />
chemical substances than the up stream water.<br />
The point and non point sources contribute for<br />
the pollution. The point source comprises the<br />
industrial waste water that escapes from the<br />
treatment plant and join the river. The non<br />
point sources involve the use <strong>of</strong> agrochemicals<br />
(fertilizers, pesticides and<br />
herbicides) and the metropolitan wastes that<br />
join the tributary streams. Thus, based on the<br />
water samples inspected there is water<br />
pollution emanating from poor industrial waste<br />
water treatment and the leftovers <strong>of</strong> the agrochemicals<br />
used in the irrigation fields.In most<br />
cases climate is the reflection <strong>of</strong> the natural<br />
environment. Any system disturbance on the<br />
environment can affect the climatic conditions.<br />
The analysis <strong>of</strong> the 22 years rain fall,<br />
temperature and humidity data can not<br />
meaningfully imply any climatic change as a<br />
result <strong>of</strong> the irrigation project. This is due to<br />
the sluggish and unpredictable nature <strong>of</strong><br />
climatic anomalies. It is reasonable however to<br />
say that there is imperceptible changes<br />
following the environmental degradation. Still<br />
it is open for further specific and detailed<br />
works to see the impacts <strong>of</strong> irrigation on the<br />
local climate. Case records <strong>of</strong> Malaria and<br />
some water born disease have been increasing<br />
following the opening <strong>of</strong> Finchaa irrigation<br />
scheme. There is a positive correlation<br />
between malaria case records and expansion <strong>of</strong><br />
irrigation fields. Although the health care<br />
facility given has improved a lot, the number<br />
<strong>of</strong> patients boost up by a large number. This<br />
shows that big attention is given on disease<br />
control than prevention. The environmental<br />
modifications and the diminutive prevention<br />
measures contribute for the large number <strong>of</strong><br />
malaria and water born diseases case<br />
records.Generally despite <strong>of</strong> its positive<br />
consequences, the irrigation project in Finchaa<br />
valley area has a negative impact on the<br />
environmental components. Especially on the<br />
vegetation cover, soil quality, water quality<br />
and partly on some health conditions. But this<br />
does not, in any way, mean that the problems<br />
out weight the benefit <strong>of</strong> the factory and that<br />
the problems are out <strong>of</strong> control. The<br />
degradation is in its early to moderate stage<br />
and even not difficult to address and alleviate<br />
them all. The possible solutions are much<br />
easier and cheaper in this moderate stage <strong>of</strong> the<br />
environmental degradation. But undoubtedly if<br />
the current trend keeps on the problem would<br />
get more complex and difficult to reclaim.<br />
Thus, urgent attention should be given for the<br />
environmental rehabilitation and conservation.<br />
4. Recommendations<br />
In line with the findings <strong>of</strong> this selective<br />
parameter based environmental impact<br />
415
assessment the following recommendations are<br />
presented:<br />
1. The environmental considerations<br />
should not be disregarded in any way<br />
and with any justification seeing that<br />
well organized environmental<br />
management positively contribute for<br />
better productivity and sustainability.<br />
2. The rehabilitation <strong>of</strong> devastated<br />
vegetation biomass should be given<br />
first line attention as it helps to<br />
maintain the soil, water, climate and<br />
biodiversity <strong>of</strong> the area. Finchaa sugar<br />
factory should tackle the problem <strong>of</strong><br />
frequent Forest fire and large scale<br />
deforestation that are observed inside<br />
the valley.<br />
3. There should be well organized and<br />
effective afforestation and<br />
reforestation programs to reestablish<br />
the ecosystem. Some areas like the<br />
surrounding escarpments, river sides,<br />
agriculturally non suitable and<br />
marginal lands can be delineated and<br />
protected as the forest area.<br />
4. There should be continuous follow ups<br />
and assessment <strong>of</strong> the physicochemical<br />
properties <strong>of</strong> the soil in the<br />
irrigation fields. This helps to see the<br />
impacts <strong>of</strong> fertilizers, herbicides and<br />
pesticides on the soil quality and to<br />
take timely measures.<br />
5. Strict physical and biological measures<br />
should be taken to impede the actively<br />
operating erosion and growing gully<br />
problem in the irrigation fields and the<br />
surrounding areas.<br />
6. Finchaa sugar factory should establish<br />
a modern and efficient waste water<br />
treatment plant in order to stop the two<br />
stream-sized industrial waste water<br />
and irrigation field wash away<br />
leakages to the river. Further<br />
inspections should be carried out for<br />
the water quality problem in the down<br />
stream area and appropriate measures<br />
should be taken.<br />
7. In addition to disease controlling<br />
strategies, research based preventive<br />
approaches should be adopted so as to<br />
mitigate the escalating malaria and<br />
water born disease case records and<br />
their far reaching impact on production<br />
and productivity.<br />
References<br />
African development fund. (2002). The<br />
Federal Democratic Republic <strong>of</strong> Ethiopia.<br />
Agricultural review. Rural development<br />
department, Onar.<br />
Agrawal.M.L. and A.K. Dikshit (2002).<br />
Significance <strong>of</strong> Spatial Data and GIS for<br />
Environmental Impact Assessment <strong>of</strong><br />
highway projects. India.<br />
Ahmed A. (2002). A Geographical study on<br />
Finchaa sugar Factory. A senior essay<br />
.Haromaya University.<br />
Alan Gilpin (1995).Environmental Impact<br />
Assessment. Cutting Edge for the Twentyfirst<br />
century. Cambridge university press.<br />
London.<br />
Anuctech private. Ltd (1994), Finchaa sugar<br />
project proposal for the Finchaa Valley<br />
Forestry project, Finchaa sugar project<br />
<strong>of</strong>fice,<br />
Addis Ababa: 61pp.<br />
Atesmachew B., Yasin G., Girma T, Don<br />
Peden. (2000). GIS Application for<br />
Analysis <strong>of</strong> Land suitability and<br />
Determination <strong>of</strong> grazing pressure in up<br />
land <strong>of</strong> the Awash river basin. ILRI, Addis<br />
Ababa<br />
Bandaragoda.D.J. (1998).Need for Institutional<br />
Impact Assessment in planning Irrigation<br />
system Modernization. Delhi, India.<br />
Barrow.C.J. (2000). Environmental Impact<br />
assessment <strong>of</strong> developments. Longman<br />
printing press. USA.<br />
Birhanu.M. (2005). Remote Sensing and GIS<br />
techniques in land use/land cover mapping,<br />
change detection and evaluation <strong>of</strong><br />
environmental degradation in the main<br />
Ethiopian rift (MER) between Koka and<br />
Ziway.<br />
Booker Agricultural <strong>International</strong> Ltd.<br />
(1977).Finchaa valley Feasibility study<br />
main Report.vol.1.London.12-15pp.<br />
Chris Parker. (1998).GIS and Environmental<br />
<strong>Management</strong> in the Sultanate <strong>of</strong> Oman.<br />
Turkey.<br />
416
Darout Gum’a. (2004). The socio-economic<br />
Aspects <strong>of</strong> irrigation management. Addis<br />
Ababa University. Addis Ababa.<br />
Dereje.A. (2005). Assessment <strong>of</strong> Socioeconomic<br />
Impacts <strong>of</strong> Irrigation in Finchaa<br />
valley, Addis Ababa University, Addis<br />
Ababa.<br />
Donalds Ahrens (2005). Micros<strong>of</strong>t Encarta<br />
Reference Library2005 .1993-<br />
2004.Micros<strong>of</strong>t Corporation.<br />
FAO (2001). Environmental Impact<br />
Assessment report. Retrieved from<br />
http//www.<br />
Gideon. A. (2005).Environmental degradation.<br />
Forum for social study. Addis Ababa.<br />
Girma A. (2005). Evaluation <strong>of</strong> Irrigation<br />
<strong>Water</strong> Quality in Ethiopian sugar Estates.<br />
Research report. 23-34pp.<br />
Girma.T. (1995).Finchaa Sugar Project Soil<br />
Survey/west Bank. Land <strong>Management</strong> unit<br />
Final report.Vol. I. Addis Ababa.<br />
Glen Paleto (2003). Environmental Impact<br />
Assessment (EIA).Lecture Notes.<br />
Haklay.M, Feitelson E. and Doytsher.Y.<br />
(1998). The Potential <strong>of</strong> a GIS based<br />
Scoping<br />
System. An Israeli proposal and case study.<br />
Environmental Impact Assessment<br />
review.Israel.439-459pp.<br />
Hartza Engineering Company (1965).<br />
Appraisal <strong>of</strong> Potential Agricultural<br />
Development <strong>of</strong> Finchaa project. Final<br />
report. Addis Ababa.<br />
43-48pp.<br />
Mintesinot B., Mohammed A., Atinkut M.and<br />
Mustafa Y. (2004). Community Based<br />
Irrigation <strong>Management</strong> in the Tekeze<br />
Basin: Impact Assessment. A case study<br />
on three small-scale irrigation schemes<br />
(micro dams) .Mekele University, ILRI,<br />
and EARO.<br />
Morgan M.K. (1998).Environmental impact<br />
Assessment. A Methodological<br />
Perspective.Kluwer Academic publisher.<br />
Dordrecht.<br />
Painnly J.P. (1994). Environmental impact<br />
Assessment: A case study on the irrigation<br />
project. Gujarat. India.37-39pp.<br />
Paul Engelking (2005). Micro s<strong>of</strong>t Encarta<br />
Reference Library 2005. 1993-2004.<br />
Micros<strong>of</strong>t Corporation.<br />
Rosenqvst.I.T. (1978).Alternative sources <strong>of</strong><br />
acidification <strong>of</strong> river water in Norway. The<br />
science <strong>of</strong> the total environment.Oslo.39-<br />
49pp.<br />
Schiondler D.W. (1990).Effects <strong>of</strong> acid rain on<br />
fresh water ecosystem Ontario. Canada<br />
25pp.<br />
Shawinigan Company. (1981). Finchaa Sugar<br />
Project Design Report. Ethiopian Sugar<br />
Corporation. Addis Ababa.9-11pp.<br />
Smajstrla.A.G, Zazueat.F.S.and Haman D.Z.<br />
(2002). Potential Impacts <strong>of</strong> Improper<br />
Irrigation system Design. Florida<br />
University. Florida.<br />
Smol J.P. (2002). Pollution <strong>of</strong> lakes and rivers.<br />
A paleo environmental perspective. Arnold<br />
publishers. Network and Oxford<br />
University press. London 126pp.<br />
Sophie N. Laurence S. and Kai Sorensen<br />
(2003).Adaptive, participatory and<br />
integrated assessment (APIA) <strong>of</strong> the<br />
impacts <strong>of</strong> irrigation on Fisheries.<br />
Evaluation <strong>of</strong> the approach in Sri Lanka.<br />
Stockle.C.O. (2002). Environmental Impact <strong>of</strong><br />
Irrigation: A review water Research<br />
Washington<br />
state<br />
university.Washington.121-129pp.<br />
Vicharn A. and Sirirat S. (2001). GIS<br />
Application on the Strategy for Sustainable<br />
Development in Phitsanulok<br />
Province.Naresuan Unive4rsity.<br />
Phitsanulok. Thailand.<br />
Worku B. (1995).Agro ecological conditions<br />
and background information on Finchaa<br />
sugar project/Factory site. Finchaa<br />
valley.6-18pp.<br />
Zeleke K. (2005).GIS and remote sensing in<br />
Land use/Land cover change detection in<br />
Finchaa valley area. East wollega.Addis<br />
Ababa University. Addis Ababa.36-44p<br />
417
Entomological studies on the impact <strong>of</strong> a small-scale irrigation scheme<br />
on malaria transmission around Zeway, Ethiopia.<br />
Solomon Kibret 1 , Beyene Petros 1 , Eline Boelee 2 and Habte Tekie 1<br />
1<br />
Department <strong>of</strong> Biology, Addis Ababa University, Ethiopia.<br />
2 <strong>International</strong> <strong>Water</strong> <strong>Management</strong> <strong>Institute</strong>, Ethiopia.<br />
e-mail: solhitler@yahoo.com<br />
Abstract<br />
To evaluate the impact <strong>of</strong> a small-scale<br />
irrigation scheme on the level <strong>of</strong> malaria<br />
transmission in a semi-arid area,<br />
entomological studies were conducted in<br />
Zeway area, Central Ethiopia. Larval and<br />
adult anophelines were sampled during the<br />
dry and short-rainy seasons from irrigated<br />
and non-irrigated villages. Overall,<br />
significantly higher density <strong>of</strong> Anopheles<br />
larvae were found during the dry season in<br />
the irrigated village (Mean = 38.3 larvae/100<br />
dips) than the non-irrigated village (7.4<br />
larvae/100 dips). Canal leakage pools,<br />
irrigated fields and irrigation canals were the<br />
major sources <strong>of</strong> Anopheles mosquitoes.<br />
Larval and adult Anopheles pharoensis and<br />
An. arabiensis, principal malaria vectors in<br />
Ethiopia, were more abundant in the<br />
irrigated village than the non-irrigated<br />
village throughout the study period. Hourly<br />
light trap catches revealed that peak indoor<br />
and outdoor biting activities <strong>of</strong> An.<br />
arabiensis and An. pharoensis occurred<br />
during the early period <strong>of</strong> the night before<br />
the local inhabitants retire to bed. The<br />
majority <strong>of</strong> blood-engorged An. arabiensis<br />
(0.78) and An. pharoensis (0.69) had fed on<br />
humans, suggesting that their highly<br />
anthropophilic nature in Zeway area.<br />
Plasmodium falciparum infection rates <strong>of</strong><br />
1.02% and 0.54% were determined for An.<br />
arabiensis and An. pharoensis, respectively,<br />
in the irrigated village. This study<br />
demonstrated that due to poorly maintained<br />
irrigation structures, the irrigation scheme<br />
created conducive breeding grounds for<br />
malaria vector species, particularly during<br />
the dry season. Consequently, the period <strong>of</strong><br />
malaria transmission might possibly extend<br />
from seasonal to year-round, involving the<br />
dry season. Proper water management<br />
coupled with environmental management<br />
such as source reduction could reduce vector<br />
abundance and hence malaria transmission<br />
in the irrigation schemes.<br />
6.<br />
7. Key words: Anopheles, malaria<br />
transmission, small-scale irrigation scheme,<br />
Plasmodium falciparum sporozoite rate,<br />
Zeway, Ethiopia.<br />
1. Introduction<br />
Development <strong>of</strong> irrigation schemes is widely<br />
recognized as a key for promoting economic<br />
growth, ensuring food security and<br />
alleviating poverty in most developing<br />
countries (Lipton et al., 2003). However,<br />
past experience shows that inadequate<br />
consideration <strong>of</strong> both environmental and<br />
public health impacts can seriously<br />
undermine the sustainability <strong>of</strong> such<br />
schemes (Gratz, 1988; McCartney et al.,<br />
2007). Key among the potential negative<br />
impacts is the link between irrigation and<br />
malaria – a disease that affects between 300<br />
and 500 million people each year globally<br />
and claims the lives <strong>of</strong> 1.5 to 2.5 million<br />
people annually (WHO, 2006).<br />
By increasing the availability <strong>of</strong> surface<br />
water for breeding, irrigation favors the<br />
development <strong>of</strong> large populations <strong>of</strong> disease<br />
vectors such as anopheline mosquitoes<br />
responsible <strong>of</strong> transmission <strong>of</strong> malaria.<br />
Hence, there is great concern that irrigation<br />
can lead to increased malaria transmission<br />
especially in sub-Saharan Africa where 90%<br />
418
<strong>of</strong> the global malaria burden exists and the<br />
prevailing climatic factors support<br />
proliferation <strong>of</strong> malaria vector mosquitoes<br />
and development <strong>of</strong> the parasite in the<br />
vector. However, the relationship between<br />
irrigation and malaria is not straightforward<br />
and varies according to endemicity and<br />
seasonality. In stable malaria endemic areas<br />
<strong>of</strong> sub-Saharan Africa, studies have shown<br />
that malaria transmission is equal or less in<br />
irrigated-rice growing areas compared with<br />
neighboring areas without irrigated rice<br />
cultivation (Josse et al., 1987; Lindsay et al.,<br />
1991; Boudin et al., 1992; Faye et al., 1993;<br />
Henry et al., 2003). The explanation for this<br />
finding is yet unresolved, but in some cases<br />
at least, could be attributed to displacement<br />
<strong>of</strong> the most anthropophilic (human blood<br />
seeking) malaria vector Anopheles funestus<br />
by An. arabiensis with lower vectorial<br />
capacity, as the later thrives more than the<br />
former in irrigated fields (Ijumba and<br />
Lindsay, 2001). It has also been suggested<br />
that many communities near irrigation<br />
schemes benefit from the greater wealth<br />
created by the schemes, <strong>of</strong>ten leading to<br />
better access to improved health care and<br />
hence receive fewer infective bites<br />
compared to those outside such schemes. On<br />
the other hand, in areas where malaria is<br />
absent or unstable, introduction <strong>of</strong> irrigation<br />
was found to place the non-immune<br />
population at a high risk <strong>of</strong> acquiring the<br />
disease, increasing malaria morbidity and<br />
mortality (El Gaddal et al., 1985; Ijumba et<br />
al., 1990). In such areas, irrigation,<br />
especially during the dry season, might alter<br />
the malaria transmission pattern from<br />
seasonal to annual, as observed in the<br />
Sahelian region <strong>of</strong> Mali (Sissoko et al.,<br />
2004) and in sub-arid irrigated areas <strong>of</strong><br />
Madagascar (Marrama et al., 2004).<br />
In Ethiopia, where three quarters <strong>of</strong> its land<br />
mass are potentially malarious, introduction<br />
or expansion <strong>of</strong> irrigation schemes can<br />
increase the burden <strong>of</strong> malaria in the<br />
country. A detailed epidemiological study in<br />
the highlands <strong>of</strong> Tigray, northern Ethiopia,<br />
has reported that malaria incidence in young<br />
children was sevenfold higher in<br />
communities near irrigation microdams than<br />
those further away (Ghebreyesus et al.,<br />
1999). A recent entomological study in the<br />
same area has reported 5.9-7.2 times more<br />
adult An. arabiensis (the main malaria<br />
vector in Ethiopia) in the dam villages than<br />
the controls, non-irrigated villages<br />
(Yohannes et al., 2005). The study also<br />
indicated that seepage water at the base <strong>of</strong><br />
the dam, leaking irrigation canals and<br />
waterlogged fields were the main sources <strong>of</strong><br />
An. arabiensis throughout most <strong>of</strong> the year.<br />
However, despite extensive development <strong>of</strong><br />
irrigation schemes in semiarid fertile areas<br />
<strong>of</strong> the country with unstable disease<br />
transmission (MoWR, 2005), in-depth<br />
information on the link between irrigation<br />
and malaria in such environmental settings<br />
is lacking. The main objective <strong>of</strong> this study<br />
was to assess the possible impact <strong>of</strong><br />
irrigation-based agricultural activities on<br />
malaria transmission in a semi-arid area with<br />
seasonal disease transmission.<br />
2. Materials and Methods<br />
The study area<br />
The study was undertaken between February<br />
and May 2006, in two rural farming villages,<br />
Abene-Girmamo and Woshgulla, located in<br />
Zeway area (8 o 00`N, 38 o 40`E), Central<br />
Ethiopia, 165 Km south <strong>of</strong> Addis Ababa, in<br />
the middle course <strong>of</strong> the Ethiopian Rift<br />
Valley (Figure 1). Both study villages are at<br />
a distance <strong>of</strong> 5-6 Km from Zeway town,<br />
which is situated alongside Lake Zeway.<br />
The area receives between 700-800 mm <strong>of</strong><br />
annual rainfall, with the heavy rains during<br />
the months <strong>of</strong> June to September and short<br />
rains in April and May (National<br />
Meteorological Agency). The mean annual<br />
temperature is 20 0 C, and February is the<br />
hottest month <strong>of</strong> the year.<br />
Malaria transmission in Zeway area is<br />
generally unstable (seasonal), with peak<br />
transmission occurring between the months<br />
<strong>of</strong> September and November, immediately<br />
after the main rainy season, while the second<br />
less pronounced transmission period falls<br />
419
etween April and May in the short-rainy<br />
season. Plasmodium falciparum is the most<br />
prevalent malaria parasite in Zeway area,<br />
responsible for 60-70% <strong>of</strong> malaria cases.<br />
Vivax malaria is also common in the area,<br />
particularly in the dry season, but generally<br />
less prevalent. (Abose et al., 1998b; Zeway<br />
Malaria Control Unit, unpublished report).<br />
Anopheles arabiensis is the primary malaria<br />
vector in Zeway area, and elsewhere in<br />
Ethiopia, while An. pharoensis plays<br />
secondary role (Rishikesh, 1966; Abose et<br />
al., 1998a; Abose et al., 1998b; Ye-Ebiyo et<br />
al., 2000).<br />
Abene-Girmamo is an irrigated rural village,<br />
situated at an altitude <strong>of</strong> 1647 m. The village<br />
is inhabited by 934 people, mainly<br />
dependent on subsistence farming. The<br />
community is mainly comprised <strong>of</strong> the<br />
Oromo and Silte ethnic groups. Most<br />
families own livestock (mainly bovine,<br />
ovine and equine), with a human to cattle<br />
ratio <strong>of</strong> 1: 0.4. Woshgulla is a non-irrigated<br />
agricultural village, situated at an altitude <strong>of</strong><br />
1654 m, with a population size <strong>of</strong> 741. The<br />
village is located 8 Km away from the<br />
irrigation schemes in Abene-Girmamo. The<br />
inhabitants are dependent on subsistent rainfed<br />
agriculture during the months <strong>of</strong> the wet<br />
seasons. They also keep livestock (mainly<br />
cattle, equine and ovine), with the mean<br />
human to cattle ratio <strong>of</strong> 1: 0.6. The domestic<br />
animals in both villages spend the night<br />
either indoors in the same homesteads with<br />
the owners or outdoors in open cattle<br />
enclosures. The main type <strong>of</strong> housing in<br />
these villages was circular huts, made <strong>of</strong><br />
mud-brick walls and thatched ro<strong>of</strong>. Mudbrick-making<br />
pits, partly covered with<br />
water, were commonly found at the<br />
backyards <strong>of</strong> households that commonly<br />
practice brick-making either for domestic<br />
use or for sale. These pits were mostly<br />
functional during the dry season but became<br />
non-functional in the wet seasons, because<br />
the rains could damage newly formed moist<br />
mud-bricks before they dry. Each village<br />
had a water-harvesting pool, i.e., collection<br />
<strong>of</strong> rainwater in a wide and deep well<br />
(volume ~ 2m width x 2m length x 6m<br />
depth) with corrugated iron-ro<strong>of</strong>ing.<br />
The source <strong>of</strong> water for irrigation in Abene-<br />
Girmamo is Lake Zeway, located 5-6 Km<br />
away from the scheme. <strong>Water</strong> is pumped<br />
from the lake by three long plastic pipes (0.4<br />
m diameter and 4-5 km long) that run<br />
underneath the ground to reach the unlined<br />
surface canals at uplifted soil mass. The<br />
surface irrigation canals feed smaller field<br />
canals to cover the entire agricultural field.<br />
However, due to poor construction and lack<br />
<strong>of</strong> maintenance, there were many leaking<br />
canals, causing leakage pools at unwanted<br />
places. These pools never dry because <strong>of</strong><br />
continuous water leakage from the irrigation<br />
canals. <strong>Water</strong> logging also occurred in the<br />
agricultural field as a result <strong>of</strong> overirrigation<br />
and water retaining characteristics<br />
<strong>of</strong> the soil. Sometimes, poor drainage led to<br />
water logging in the field. The uplifted soil<br />
walls <strong>of</strong> the surface canals were also<br />
frequently perforated and formed leakages,<br />
mainly due to the action <strong>of</strong> domestic animals<br />
while drinking water in the canals. Onion,<br />
cabbage and maize (Zea m. mays) were<br />
commonly grown under irrigation<br />
throughout most <strong>of</strong> the year.<br />
420
Figure 1. Location <strong>of</strong> the study area in Ethiopia and map <strong>of</strong> Zeway area (the two study villages<br />
are shown in bold rectangles).<br />
surveyed using standard dippers (350ml).<br />
Entomological surveys<br />
The surface area <strong>of</strong> each potential mosquito<br />
Entomological surveys comprised larval and<br />
adult mosquito collections in the irrigated<br />
and non-irrigated study villages during the<br />
dry (February/March) and short-rainy<br />
(April/May) seasons <strong>of</strong> 2006.<br />
Anopheline larvae were sampled for eight<br />
days between February and March in the dry<br />
season and also between April and May in<br />
the short-rainy season <strong>of</strong> 2006. At each<br />
survey, all available potential mosquito<br />
breeding habitats such as irrigation canals<br />
(unlined surface canals with still water due<br />
to back-flow), canal leakage pools (pools<br />
formed from leaking main canals), irrigated<br />
field paddies (water logging in the field due<br />
to over-irrigation and poor drainage canals),<br />
water-harvesting pools, mud-brick-making<br />
pits and rain pools within one kilometer<br />
radius from each study village were<br />
breeding site was estimated in square meter<br />
(m 2 ) and sampling was made at a rate <strong>of</strong> 6<br />
dips/m 2 . One ‘sample’ was defined as 30<br />
dips (or less, in smaller sites) taken over a<br />
surface area <strong>of</strong> 5 m 2 . For sites in the range <strong>of</strong><br />
5-10 m 2 , one sample was taken, whereas two<br />
samples were taken from sites in the range<br />
<strong>of</strong> 11-20 m 2 and so forth. An upper limit <strong>of</strong><br />
six samples was set for all sites with water<br />
surface area exceeding 50 m 2 (Amerasinghe<br />
and Munasingha, 1988). Larval anophelines<br />
sampled from each type <strong>of</strong> breeding habitat<br />
were transferred to separate vials and killed<br />
by gently heating and preserved in 70%<br />
alcohol for later species identification.<br />
Adult anophelines were sampled from<br />
indoors and outdoors for ten consecutive<br />
nights between February and March in the<br />
dry season and between April and May in<br />
the short-rainy season <strong>of</strong> 2006. Three<br />
421
techniques: i.e., CDC light traps,<br />
mouthpiece aspirators and space-spray, were<br />
used for adult sampling. In order to obtain a<br />
representative sample <strong>of</strong> the mosquito<br />
population for the irrigated village, a total <strong>of</strong><br />
6 houses were randomly selected (2 from the<br />
edge <strong>of</strong> the village at close proximity to the<br />
irrigated field [~300 m], 2 from the middle<br />
[~600 m] and 2 from the far side <strong>of</strong> the<br />
village [~800m]). Similarly, the nonirrigated<br />
village was roughly divided into<br />
three sampling zones based on proximity to<br />
the non-irrigated agricultural field and two<br />
houses were randomly selected from each<br />
zone. Untreated bed nets were distributed<br />
for the households and the same houses<br />
were used throughout the study period. A<br />
total <strong>of</strong> six outdoor sites (~100 m away from<br />
occupied houses) was also selected in each<br />
village for outdoor light trap collection.<br />
A total <strong>of</strong> twelve (six indoors and six<br />
outdoors) CDC light traps (Model 512; J. W.<br />
Hock Co., Atlanta, USA) was operated in<br />
each village from 1800 to 0700 hours<br />
throughout each sampling night. Each<br />
indoor light trap was hung on a wall; with<br />
the bulb about 45 cm above the head <strong>of</strong> a<br />
person sleeping under an untreated bed net<br />
(Lines et al., 1991). Outdoor light traps were<br />
hung on trees at close proximity (~50 to 100<br />
m) to open cattle enclosures where some<br />
individuals spend the evening keeping their<br />
livestock from theft. To determine peak<br />
activity <strong>of</strong> anophelines during the period <strong>of</strong><br />
the night, hourly mosquito collections were<br />
also conducted indoors and outdoors by light<br />
traps. Using mouthpiece aspirators and<br />
space-spray, female Anopheles mosquitoes<br />
were collected from their daytime resting<br />
sites both indoors and outdoors (Service,<br />
1993). While collecting light traps the<br />
following morning, a team <strong>of</strong> three<br />
collectors holding aspirators and torchlight<br />
searched for resting mosquitoes from the six<br />
light trap houses and from possible outdoorresting<br />
sites (burrow pits, ground holes, tree<br />
holes, open cattle sheds and among<br />
vegetations) in each village. For the purpose<br />
<strong>of</strong> comparison, the team <strong>of</strong> collectors spent<br />
the same period <strong>of</strong> time (20 minutes)<br />
indoors and outdoors (Abose et al., 1998b).<br />
Using white sheets <strong>of</strong> cloth and an aerosol <strong>of</strong><br />
pyrethroids (Mobil flit; Mobil Africa Sales<br />
Inc., Belgium; Composition [% weight]:<br />
Tetramethrin 0.12; Phenothrin 0.12;<br />
Allethrin 0.25; Solvents, Propellants and<br />
essential oils 99.43), indoor-resting<br />
anophelines were also collected from six<br />
selected houses in each village. Before<br />
spraying the houses, all openings that could<br />
allow mosquito escaping (such as doors,<br />
windows, and holes on the walls) were<br />
closed, and the entire floor was covered with<br />
the white cloth. The houses were then<br />
sprayed with Mobil flit for about 5 minutes<br />
and left closed for 10 minutes. Thereafter,<br />
the sheets were brought outside the rooms to<br />
inspect and collect the knock-down<br />
mosquitoes. Mosquitoes collected by the<br />
different techniques were counted and kept<br />
in separate paper cups for latter<br />
identification and mosquito processing.<br />
Species identification and dissection<br />
At Zeway Malaria Control Laboratory,<br />
preserved anopheline larval samples were<br />
counted and individually mounted on<br />
microscope slides for species identification<br />
based on morphological characteristics<br />
(Verrone, 1962b). Only third and fourth<br />
larval instars were used for species<br />
identification <strong>of</strong> anopheline larvae. Adult<br />
anophelines collected by the different<br />
sampling methods were also sorted out into<br />
species based on morphological<br />
characteristics (Verron, 1962a). One-third <strong>of</strong><br />
unfed female Anopheles mosquito<br />
collections obtained from light trap catches<br />
and all unfed female anophelines caught<br />
resting indoors and outdoors were dissected<br />
to determine parity rates for each species<br />
during the dry and short-rainy seasons.<br />
Ovaries with coiled tracheal skeins were<br />
considered as nulliparous (did not lay eggs),<br />
while those with stretched out tracheoles<br />
were taken as parous (laid eggs) as<br />
described by Lewis (1958). All the<br />
remaining female anopheline samples and<br />
the head-thorax region <strong>of</strong> dissected<br />
mosquitoes were stored in the silica-gel<br />
422
dessicator and transported to Addis Ababa<br />
University, Biomedical Science Laboratory,<br />
and kept at room temperature (19-22 o C) for<br />
later mosquito processing.<br />
Mosquito processing<br />
The head-thorax region <strong>of</strong> each dried female<br />
anopheline was tested for the presence <strong>of</strong> P.<br />
falciparum and P. vivax sporozoite antigens<br />
using Enzyme-Linked Immunosorbent<br />
Assay (ELISA) (Wirtz et al., 1987). The<br />
direct ELISA procedure described by Beier<br />
and colleagues (Beier et al, 1988) was used<br />
to determine the sources <strong>of</strong> blood meals<br />
(human vs. bovine) <strong>of</strong> the blood-engorged<br />
female anophelines.<br />
Data analysis<br />
Daily larval and adult mosquito collections<br />
were entered into Micros<strong>of</strong>t Excel Database<br />
and log-transformed (log 10 [n+1]), and tested<br />
for normality before analysis. The<br />
abundance <strong>of</strong> larval and adult anophelines<br />
was compared between villages and seasons<br />
using nonparametric Mann-Whitney U-test.<br />
The same test was applied to compare the<br />
indoor and outdoor density <strong>of</strong> adult<br />
anophelines. The relative abundance <strong>of</strong><br />
Anopheles species in the larval and adult<br />
collections was compared using Kruskal-<br />
Wallis Test, a non-parametric test for<br />
ascertaining significance among more than<br />
two variables. Larval density was expressed<br />
as the mean number <strong>of</strong> anopheline larvae per<br />
100 dips. Sporozoite infection rate <strong>of</strong> each<br />
Anopheles species was expressed as the<br />
proportion <strong>of</strong> mosquitoes containing malaria<br />
sporozoite antigen from the total samples <strong>of</strong><br />
a species tested by ELISA. The Human<br />
Blood Index (HBI) for each Anopheles<br />
species was calculated as the proportion <strong>of</strong><br />
samples positive for human blood from the<br />
total blood meals <strong>of</strong> a particular species<br />
tested. The level <strong>of</strong> significance was<br />
determined at 0.05. All analyses were done<br />
using Micros<strong>of</strong>t Excel 2003 and statistical<br />
s<strong>of</strong>tware, SPSS version 13 (SPSS Inc,<br />
Chicago, IL, USA).<br />
3. Results<br />
Larval habitats and abundance<br />
Total number <strong>of</strong> positive larval habitats,<br />
number <strong>of</strong> Anopheles larvae collected and<br />
larval density in the irrigated and nonirrigated<br />
study villages during the two<br />
sampling seasons are presented in <strong>Table</strong> 1.<br />
Four-times more positive Anopheles larval<br />
sites were encountered in the irrigated<br />
village (n = 51) compared to the nonirrigated<br />
village (n = 12) during the study<br />
period. Consequently, higher Anopheles<br />
larval densities were found in the irrigated<br />
village (mean no. larvae per 100 dips = 36.0;<br />
95% CI = 25.4–48.5; z = -3.196, P < 0.001)<br />
than the non-irrigated village (mean no.<br />
larvae per 100 dips = 14.9; 95%CI = 9.1–<br />
20.8) throughout the study period. The<br />
difference in Anopheles larval abundance<br />
and positive larval sites between the dry and<br />
short-rainy seasons was significant in the<br />
non-irrigated village whereas there was<br />
insignificant seasonal difference in the<br />
irrigated village. Overall, Anopheles larval<br />
production in the non-irrigated village was<br />
associated with the wet seasons while high<br />
larval production in the irrigated village was<br />
evident both in the dry and wet seasons.<br />
Anopheles larval collections were composed<br />
<strong>of</strong> five species, among which Anopheles<br />
arabiensis, An. pharoensis and An. coustani<br />
were the major species. The distribution <strong>of</strong><br />
Anopheles species in different larval habitats<br />
in the irrigated and non-irrigated villages is<br />
shown in <strong>Table</strong> 2. Among the five types <strong>of</strong><br />
larval habitats in the irrigated village, canal<br />
leakage pools and irrigated field puddles<br />
were the most important sources <strong>of</strong> An.<br />
arabiensis, accounting for nearly 60% <strong>of</strong> the<br />
larval collection during the study period. For<br />
An. pharoensis, canal leakage pools and<br />
irrigation canals were the major larval<br />
habitats as more than 90% <strong>of</strong> larval<br />
collection <strong>of</strong> this species were obtained from<br />
these habitats. In the non-irrigated village,<br />
brick-making pits and rain pools were the<br />
most important Anopheles larval habitats.<br />
Overall, around 80% <strong>of</strong> the total Anopheles<br />
423
larval production in the irrigated village was<br />
from three types larval habitats (irrigated<br />
field puddles, canal leakage pools and<br />
irrigation canals) associated with the<br />
irrigation scheme.<br />
Adult anopheline collections<br />
A total <strong>of</strong> 1271 adult anophelines was<br />
collected from the two study villages during<br />
the study period, <strong>of</strong> which 94% (n = 1213)<br />
and 6% (n = 58) were from the irrigated and<br />
non-irrigated villages, respectively (<strong>Table</strong><br />
3). Anopheles pharoensis was the major<br />
species predominantly sampled in the<br />
irrigated village during the dry season<br />
(56.9%; n = 340; X 2 = 52.294; df = 2; P <<br />
0.001) while An. arabiensis predominated in<br />
short-rainy season (50.2%; n = 309; X 2<br />
=17.751, df = 2, P < 0.001). Of the few adult<br />
anophelines collected in the non-irrigated<br />
village during the short-rainy season, the<br />
majority (65.5%, n = 38) were An.<br />
arabiensis. No mosquito was collected in<br />
the non-irrigated village during the dry<br />
season.<br />
The density <strong>of</strong> An. pharoensis per light trapnight<br />
was higher during the dry season<br />
(mean no. mosquito/trap/night = 2.24; 95%<br />
CI = 1.21–3.17; Mann-Whitney U = 2422.0,<br />
z = -5.244, P < 0.001) than the short-rainy<br />
season (mean no. mosquito/trap/night =<br />
1.48). The difference between indoor and<br />
outdoor densities was significant, being<br />
higher outdoors (Mann-Whitney U =<br />
4646.0, z = -4.257, P < 0.001) than indoors.<br />
In contrast, the mean density <strong>of</strong> An.<br />
arabiensis was higher during the short-rainy<br />
season (mean no. mosquito/trap/night =<br />
1.70; Mann-Whitney U = 1840.0, z = -<br />
2.569, P = 0.01) than the dry season (mean<br />
no. mosquito/trap/night = 1.23; 95%). There<br />
was also significant difference between the<br />
indoor and outdoor densities, being higher<br />
indoors (Mann-Whitney U = 3849.5, z = -<br />
5.849, P < 0.001) than outdoors. The density<br />
An. coustani was higher outdoors (Mann-<br />
Whitney U = 5772.5, z = -2.342, P = 0.001)<br />
than indoors during the two sampling<br />
seasons. Although the densities <strong>of</strong><br />
Anopheles mosquitoes were generally very<br />
low in the non-irrigated village during the<br />
study period, similar indoor-outdoor trends<br />
were noted for the three species. Overall,<br />
An. arabiensis was more endophagic while<br />
An. pharoensis and An. coustani were more<br />
exophagic in the study area.<br />
Peak hourly activity <strong>of</strong> Anopheles species<br />
Peak indoor and outdoor activities <strong>of</strong> An.<br />
arabiensis were observed during the early<br />
period <strong>of</strong> the night, between 18:00-19:00<br />
and 19:00-20:00 hours, respectively<br />
(Figure 2). Thereafter, its activity steadily<br />
decreased both indoors and outdoors<br />
throughout the rest <strong>of</strong> the night. Peak<br />
indoor and outdoor activities <strong>of</strong> An.<br />
pharoensis occurred between 20:00-21:00<br />
and 19:00-20:00 hours, respectively,<br />
which gently declined thereafter, but with<br />
a remarkable increase between 22:00-<br />
23:00 hours at outdoors (figure 3). For An.<br />
coustani, its peak indoor and outdoor<br />
activities were recorded between 18:00-<br />
19:00 hours, which sharply dropped<br />
thereafter but with a remarkable peak<br />
between 22:00-23:00 and 05:00-06:00<br />
hours, indoors and outdoors, respectively<br />
(Figure 4). Overall, about 75%, 66%, and<br />
69% <strong>of</strong> the biting by An. arabiensis, An.<br />
pharoensis and An. coustani occurred<br />
during the early period <strong>of</strong> the night (before<br />
22:00 hours), before the local people retire<br />
to bed.<br />
Parous rate<br />
Parous rate <strong>of</strong> Anopheles species in the<br />
irrigated and non-irrigated study villages<br />
during the dry and short-rainy seasons is<br />
presented in <strong>Table</strong> 5. In the irrigated<br />
village, the parous rate <strong>of</strong> An. arabiensis<br />
was higher during the dry season (58.7%,<br />
n = 46) than the short-rainy season<br />
(22.2%, n = 81). In contrast, the parous<br />
rate <strong>of</strong> An. pharoensis did not vary<br />
significantly between the two sampling<br />
seasons; 43.3% (n = 39) and 41.2%<br />
(21/51) in the dry and short-rainy season,<br />
respectively. For An. coustani, higher<br />
424
parous rate was recorded during the dry<br />
season (18.2%, 4/22) than the short-rainy<br />
season (3.4%, 1/29). In the control village,<br />
among few anophelines caught during the<br />
short-rainy season, only two parous An.<br />
arabiensis females (5.3%; 2/38) were<br />
found. Overall, An. arabiensis and An.<br />
pharoensis had higher parous rate during<br />
the dry season, suggesting higher<br />
longevity <strong>of</strong> these species in this season.<br />
Host feeding preference<br />
<strong>Table</strong> 6 shows the sources <strong>of</strong> mosquito<br />
blood meals in the irrigated village.<br />
Among 120 blood-fed An. arabiensis<br />
specimens tested, 70.8% (n = 85) and<br />
14.2% (n = 17) were positive for only<br />
human and bovine bloods, respectively.<br />
Some (7.5%, n = 9) were mixed blood<br />
meals originated from human and bovine,<br />
and the remaining were unidentified<br />
(7.5%, n = 9) - possibly originated from<br />
other domestic hosts (e.g. equines and<br />
ovines). Overall, the Human Blood Index<br />
(HBI) for An. arabiensis was found to be<br />
0.78. Out <strong>of</strong> 142 blood-engorged female<br />
An. pharoensis specimens tested, 61.3% (n<br />
= 87) and 20.4% (n = 29) had human and<br />
bovine blood meals, respectively. Some<br />
blood meals (7.7%, n = 11) were<br />
composed <strong>of</strong> both human and bovine<br />
bloods, and 10.6% (n = 15) <strong>of</strong> An.<br />
pharoensis blood meals were not<br />
identified. Overall, the HBI for An.<br />
pharoensis was found to be 0.69. From a<br />
total <strong>of</strong> 16 blood-engorged An. coustani<br />
specimens, only one specimen (6.2%) was<br />
positive for human blood while the<br />
majority (75%, n = 12) gave positive<br />
result for bovine blood. The overall HBI<br />
for An. coustani was 0.06. The ELISA<br />
results showed that An. arabiensis and An.<br />
pharoensis are the most important<br />
anthropophagic species in Zeway area.<br />
Sporozoite rate<br />
The P. falciparum sporozoite rates <strong>of</strong><br />
Anopheles species in the irrigated village<br />
is presented in <strong>Table</strong> 7. None <strong>of</strong> the<br />
samples tested were positive for P. vivax<br />
sporozoites. Among 424 female An.<br />
arabiensis specimens collected from the<br />
irrigated village and tested for P.<br />
falciparum sporozoites, 5 (1.18%) were<br />
found to be positive. None <strong>of</strong> the thirtyone<br />
An. arabiensis specimens caught in<br />
the non-irrigated village were positive for<br />
P. falciparum. Among the total <strong>of</strong> 509 An.<br />
pharoensis collected from the irrigated<br />
village, three (0.59%) were tested positive<br />
for P. falciparum sporozoites. None <strong>of</strong> the<br />
four An. pharoensis and sixteen An.<br />
coustani specimens collected in the nonirrigated<br />
village was positive for malaria<br />
sporozoites. Seasonally, higher P.<br />
falciparum sporozoite rate <strong>of</strong> An.<br />
arabiensis was recorded in the short-rainy<br />
season (1.47%; 4/272) than the dry season<br />
(0.66%; 1/152). The P. falciparum<br />
sporozoite rate <strong>of</strong> An. pharoensis was<br />
0.92% (3/325) in dry season, while none<br />
(0/184) were positive in the short-rainy<br />
season. Overall, the P. falciparum<br />
sporozoite rate <strong>of</strong> An. arabiensis and An.<br />
pharoensis suggests the potential <strong>of</strong> these<br />
species in malaria transmission in the<br />
irrigated study village during the dry and<br />
the short-rainy seasons.<br />
425
<strong>Table</strong> 1. Total number <strong>of</strong> positive larval habitats, number <strong>of</strong> Anopheles larvae collected and<br />
larval density (mean no. larvae/100 dips) in irrigated (Abene-Girmamo) and non-irrigated<br />
(Woshgulla) villages in Zeway area, Central Ethiopia, during the dry (February/March)<br />
and short-rainy (April/May) seasons <strong>of</strong> 2006.<br />
Irrigated village<br />
Non-irrigated village<br />
Total no. positive No. <strong>of</strong> Anopheles Larval density δ Total no. positive No.<br />
<strong>of</strong> Anopheles Larval density<br />
Season larval habitats larvae collected (%) (95%CI) larval habitats<br />
larvae collected (95%CI)<br />
Dry 38 797 (46.0) 38.3 (26.2–50.5)* 5 69 (22.8)<br />
7.4 (4.4 –10.5)<br />
Short-rainy 33 936 (54.0) 34.9 (24..9–45.9)* 11 233 (77.2)<br />
15.2 (9.3–21.1)<br />
Overall 51 a 1733 (100) 36.0 (25.4–48.5)* 12 a 302 (100)<br />
14.9 (9.1– 20.8)<br />
δ<br />
Larval density refers to mean number <strong>of</strong> Anopheles larvae per 100 dips. 95% confidence<br />
interval is shown in brackets. * The difference in seasonal larval density between the two villages<br />
was significant (P < 0.001).<br />
a<br />
The overall total number <strong>of</strong> larval habitats in each village is not equal to the sum <strong>of</strong> positive<br />
larval habitats in the two<br />
sampling seasons since the same larval habitat can occur in both seasons.<br />
426
<strong>Table</strong> 2. Distribution <strong>of</strong> Anopheles species* in different types <strong>of</strong> larval habitats in irrigated<br />
(Abene-Girmamo) and non-irrigated (Woshgulla) villages in Zeway area, Central<br />
Ethiopia, between February and May 2006.<br />
* Only third and fourth larval instars were sorted out into species<br />
Village Larval habitats An. arabiensis (%) An. pharoensis (%) An. coustani (%) An. cinereu<br />
An. squamosus Total (%)<br />
(Total no. <strong>of</strong><br />
positive sites)<br />
Irrigated Brick-making pits (5) 70 (18.5) 2 (0.4) 72 (21.5) 0<br />
0 144 (12.3)<br />
Canal leakage pools (12) 108 (28.5) 242 (52.8) 57 (17.1) 0<br />
0 407 (34.6)<br />
Irrigated field puddles (23) 118 (31.1) 41 (9.0) 66 (19.8) 0<br />
0 225 (19.1)<br />
Irrigation canals (4) 45 (11.9) 173 (37.8) 85 (25.4) 0<br />
1 304 (25.9)<br />
Rain pools (7) 38 (10.0) 0 (0.0) 54 (16.2) 3<br />
0 95 (8.1)<br />
Total (51) (%) 379 (32.2) 458 (39.0) 334 (28.4) 3<br />
(0.3) 1 (0.1) 1175 (100)<br />
Non-irrigated Brick-making pits (7) 57 (52.8) 8 (88.9) 14 (45.2) -<br />
- 79 (53.4)<br />
Rain pools (4) 51 (47.2) 0 (0.0) 17 (54.8) -<br />
- 68 (45.9)<br />
<strong>Water</strong> harvesting pools (1) 0 (0.0) 1 (1.1) 0 (0.0) -<br />
- 1 (0.7)<br />
Total (12) (%) 108 (73.0) 9 (6.1) 31 (20.9) -<br />
- 148 (100)<br />
427
<strong>Table</strong> 3. Number <strong>of</strong> adult Anopheles mosquitoes collected from irrigated (Abene-Girmamo)<br />
and non-irrigated (Woshgulla) villages in Zeway area, using different sampling<br />
methods, during the dry (February/March) and short-rainy (May/April) seasons <strong>of</strong><br />
2006.<br />
Village Season An. arabiensis An. pharoensis An. coustani<br />
Total (%)<br />
Irrigated Dry (%) 182 (30.4) 340 (56.9) 76 (12.7)<br />
598 (49.3)<br />
Short-rainy (%) 309 (50.2) 212 (34.5) 94 (15.3)<br />
615 (50.7)<br />
Total (%) 491 (40.5) 552 (45.5) 170 (14.0)<br />
1213 (100)<br />
Non-irrigated Dry (%) 0 (0.0) 0 (0.0) 0 (0.0)<br />
0 (0.0)<br />
Short-rainy (%) 38 (65.5) 4 (6.9) 16 (27.6)<br />
58 (100)<br />
Total (%) 38 (65.5) 4 (6.9) 16 (27.6)<br />
58 (100)<br />
Grand Total (%) 529 (41.6) 556 (43.8) 186 (14.6<br />
1271 (100)<br />
428
<strong>Table</strong> 4. Indoor and outdoor density <strong>of</strong> Anopheles species (mean no. mosquitoes /light trap/<br />
night) in irrigated (Abene-Girmamo) and non-irrigated (Woshgulla) villages in<br />
Zeway area, during the dry (February/March) and short-rainy (April/May) seasons <strong>of</strong><br />
2006.<br />
Village Species Mean no. mosquito/ light trap/ night<br />
Dry season<br />
Short-rainy season<br />
In Out Mean In Out<br />
Mean<br />
Irrigated An. arabiensis 1.53 0.93 1.23 2.14 1.22<br />
1.70<br />
An. pharoensis 1.74 2.72 2.24 1.31 1.65<br />
1.48<br />
An. coustani 0.50 0.73 0.62 0.57 1.00<br />
0.79<br />
Any anopheline 3.77 4.38 4.09 4.02 3.87<br />
3.97<br />
Non-irrigated An. arabiensis 0.00 0.00 0.00 0.63 0.21<br />
0.32<br />
An. pharoensis 0.00 0.00 0.00 0.07 0.00<br />
0.03<br />
An. coustani 0.00 0.00 0.00 0.05 0.23<br />
0.13<br />
Any anopheline 0.00 0.00 0.00 0.75 0.44<br />
0.59<br />
429
Percentage <strong>of</strong> mosquitoes<br />
collected each hour<br />
50<br />
40<br />
30<br />
20<br />
10<br />
0<br />
1800-1900<br />
1900-2000<br />
2000-2100<br />
2100-2200<br />
2200-2300<br />
2300-0000<br />
0000-0100<br />
0100-0200<br />
Hour<br />
0200-0300<br />
0300-0400<br />
0400-0500<br />
0500-0600<br />
0600-0700<br />
Indoors (n = 24 light trapnights)<br />
Outdoors (n = 24 light trapnights)<br />
Figure 2. Hourly activity <strong>of</strong> Anopheles arabiensis indoors and outdoors from light trap catches<br />
(as percentage <strong>of</strong> mosquitoes collected each hour) in an irrigated village in Zeway<br />
area, during the study period (February to May 2006).<br />
Percentage <strong>of</strong> mosquitoes<br />
collected each hour<br />
50.0<br />
40.0<br />
30.0<br />
20.0<br />
10.0<br />
0.0<br />
1800-1900<br />
1900-2000<br />
2000-2100<br />
2100-2200<br />
2200-2300<br />
2300-0000<br />
0000-0100<br />
0100-0200<br />
Hour<br />
Indoors (n = 24 light trapnights)<br />
Outdoors (n = 24 light trapnights)<br />
0200-0300<br />
0300-0400<br />
0400-0500<br />
0500-0600<br />
0600-0700<br />
Figure 3. Hourly activity <strong>of</strong> Anopheles pharoensis indoors and outdoors from light trap catches<br />
(as percentage <strong>of</strong> mosquitoes collected each hour) in an irrigated village in Zeway<br />
area, during the study period (February to May 2006).<br />
430
Percentage <strong>of</strong> mosquitoes<br />
collected each hour<br />
40.0<br />
30.0<br />
20.0<br />
10.0<br />
0.0<br />
1800-1900<br />
1900-2000<br />
2000-2100<br />
2100-2200<br />
2200-2300<br />
2300-0000<br />
0000-0100<br />
0100-0200<br />
Hour<br />
0200-0300<br />
0300-0400<br />
Indoors (n = 24 light trapnights)<br />
Outdoors (n = 24 light trapnights)<br />
0400-0500<br />
0500-0600<br />
0600-0700<br />
Figure 4. Hourly activity <strong>of</strong> Anopheles coustani indoors and outdoors from light trap catches<br />
(as percentage <strong>of</strong> mosquitoes collected each hour) in an irrigated village in Zeway<br />
area, during the study period (February to May 2006).<br />
<strong>Table</strong> 5. Parous rate <strong>of</strong> Anopheles species in the irrigated (Abene-Girmamo) and non-irrigated<br />
(Woshgulla) villages in Zeway area, Central Ethiopia, in the dry (February/March) and<br />
short-rainy (April/May) seasons <strong>of</strong> 2006.<br />
Village Season An. arabiensis An. pharoensis An.<br />
coustani<br />
N 1 P (%) * N P (%) N<br />
P (%)<br />
Irrigated Dry 46 27 (58.7) 90 39 (43.3) 22<br />
4 (18.2)<br />
Short-rainy 81 18 (22.2) 51 21 (41.2) 29<br />
1 (3.4)<br />
Non-irrigated Dry - # - - - -<br />
-<br />
Short-rainy 38 2 (5.3) 4 0 (0.0) 16<br />
0 (0.0)<br />
1<br />
N = number <strong>of</strong> specimens dissected<br />
* P is the number <strong>of</strong> parous females, and the percentage <strong>of</strong> P is calculated from N.<br />
#<br />
- (minus sign) indicates that no mosquito was collected during that season and thus no<br />
dissection.<br />
431
<strong>Table</strong> 6. Number (and percentage) <strong>of</strong> blood-fed Anopheles mosquitoes tested positive for<br />
human and/or bovine bloods by direct ELISA, from collections obtained from an<br />
irrigated village in Zeway area, Central Ethiopia, during the study period (February to<br />
May 2006).<br />
Species No. <strong>of</strong> mosquito Human only (%) Bovine only (%) Mixed blood* (%<br />
Unidentified (%)<br />
tested<br />
An. arabiensis 120 85 (70.8) 17 (14.2) 9 (7.5) 9<br />
(7.5)<br />
An. pharoensis 142 87 (61.3) 29 (20.4) 11 (7.7) 15<br />
(10.6)<br />
An. coustani 16 1 (6.2) 12 (75.0) 0 (0.0) 3<br />
(18.8)<br />
* Mixed blood meal refers to a blood meal containing both human and bovine bloods.<br />
<strong>Table</strong> 7. Plasmodium falciparum sporozoite rate <strong>of</strong> Anopheles species collected from an<br />
irrigated village (Abene-Girmamo) in Zeway area, Central Ethiopia, during the dry<br />
(February/March) and short-rainy (April/May) seasons <strong>of</strong> 2006.<br />
Season An. arabiensis An. pharoensis An. coustani<br />
N SR (%) N SR (%) N SR<br />
(%)<br />
Dry 152 1 (0.66) 325 3 (0.92) 61 0<br />
(0.00)<br />
Short-rainy 272 4 (1.47) 184 0 (0.00) 70 0<br />
(0.00)<br />
Overall 424 5 (1.18) 509 3 (0.59) 131<br />
(0.00)<br />
N – number <strong>of</strong> mosquitoes tested by ELISA.<br />
SR – number <strong>of</strong> mosquitoes tested positive for P. falciparum sporozoites.<br />
Note: none <strong>of</strong> the mosquitoes collected from the non-irrigated village were positive for<br />
malaria sporozoites.<br />
432
4. Discussion<br />
The present study revealed that the smallscale<br />
irrigation scheme in Zeway area has<br />
created breeding sites for the two malaria<br />
vector species, namely, An. arabiensis and<br />
An. pharoensis. The most important<br />
prolific Anopheles larval habitats were<br />
found to be poorly constructed irrigation<br />
canals (that allow water to stand for a<br />
period <strong>of</strong> time), canal leakage pools<br />
(formed due to perforated soil walls <strong>of</strong> the<br />
irrigation canals) and waterlogged fields<br />
(field puddles formed due to overirrigation).<br />
The same breeding habitats<br />
have been shown to create conducive<br />
breeding grounds for An. arabiensis in the<br />
dam villages <strong>of</strong> Tigray, where microdambased<br />
irrigation is practiced during the dry<br />
season (Yohannes et al., 2005). In<br />
agreement to our findings, in Mwea<br />
irrigation scheme, Kenya, it has been<br />
reported that An. arabiensis, An.<br />
pharoensis and An. coustani thrive well in<br />
irrigated fields where rice was commonly<br />
grown (Ijumba et al., 1990; Muturi et al.,<br />
2006). In irrigation schemes <strong>of</strong> Faiyum<br />
Governorate, Egypt, irrigation ditches,<br />
seepage water collections and irrigated<br />
fields with moderate crop growth were<br />
shown to be the major sources <strong>of</strong> An.<br />
pharoensis during the dry season (Soliman<br />
et al., 1967), in line with our finding for<br />
the same species in the present study.<br />
We also observed that larvae <strong>of</strong> An.<br />
arabiensis were predominantly abundant<br />
in newly formed canal leakage pools and<br />
field puddles, while larval An. pharoensis<br />
preferred canal leakage pools and<br />
irrigation canals covered with vegetations.<br />
Even in the same larval habitats where the<br />
two species coexisted (such as canal<br />
leakage pools), Anopheles arabiensis<br />
mostly preferred the shallow, sunlit and<br />
disturbed (muddy) margins <strong>of</strong> the habitat<br />
while An. pharoensis was frequently<br />
sampled around the shaded and deeper<br />
parts <strong>of</strong> the habitat with encroaching<br />
vegetation. This indicated that An.<br />
arabiensis and An. pharoensis have<br />
different larval habitat requirements.<br />
Previous studies have shown that An.<br />
arabiensis prefers open, shallow and<br />
temporary breeding habitats while An.<br />
pharoensis thrives in shaded, permanent<br />
water bodies with emergent vegetation<br />
(Snow, 1983; Gillies and Coetzee, 1987).<br />
Rains are known to have dual effect on the<br />
development <strong>of</strong> mosquito larvae. When it<br />
rains, new mosquito-breeding sites are<br />
created; at the same time at other<br />
previously existing sites, some individuals<br />
will be washed away. We observed that<br />
newly formed breeding sites were sooner<br />
colonized by An. arabiensis and An.<br />
coustani (as these species prefer such<br />
habitats) while older permanent larval<br />
habitats <strong>of</strong> An. pharoensis diminished.<br />
Similar observations were reported in<br />
Mwea irrigation scheme in Kenya, where<br />
larval An. arabiensis were found<br />
abundantly in newly flooded rice fields in<br />
the wet season but a few weeks later,<br />
when the rice moderately grew, An.<br />
pharoensis was the one predominated<br />
(Mukiama and Mwangi, 1989).<br />
This study generally confirmed that the<br />
irrigation scheme in Zeway area has<br />
created good Anopheles mosquito<br />
breeding conditions by restoring the lost<br />
surface water during the dry season. Thus,<br />
Anopheles larval production in the<br />
irrigated villages <strong>of</strong> Zeway area is no<br />
longer restricted to the wet seasons; rather<br />
continuous breeding <strong>of</strong> Anopheles<br />
mosquitoes throughout most <strong>of</strong> the year is<br />
possible as the crucial linkage between the<br />
rainy seasons is provided by the irrigation<br />
activities. Therefore, there is a potential<br />
for dry season malaria transmission in the<br />
irrigated villages <strong>of</strong> Zeway area, as<br />
malaria vector mosquitoes (An. arabiensis<br />
and An. pharoensis) thrive well in<br />
breeding sites created by the irrigation<br />
scheme coupled with the prevailing<br />
climatic factors that could facilitate<br />
development <strong>of</strong> the aquatic stages <strong>of</strong> the<br />
vector as well as the malaria parasites<br />
inside the female anopheline.<br />
433
Consistent with the observed seasonal<br />
trend in larval abundance, variations in<br />
seasonal adult densities were also evident<br />
during the study period. The density <strong>of</strong><br />
adult An. arabiensis was higher in the<br />
short-rainy season than the dry season<br />
while the densities <strong>of</strong> An. pharoensis and<br />
An. coustani peaked in the dry season.<br />
Similar seasonal trend was observed in<br />
villages at close proximity to Lake Zeway,<br />
where An. arabiensis outnumbered An.<br />
pharoensis during the wet season while<br />
the latter dominated the former in the dry<br />
season. These species are common in<br />
irrigated villages elsewhere in Africa<br />
where they occur sympatrically (Snow,<br />
1983; Mukiama and Mwangi, 1989;<br />
Ijumba et al., 1990; Muturi et al., 2006).<br />
Indoor and outdoor light trap catches<br />
revealed that An. arabiensis was more<br />
endophagic while An. pharoensis and An.<br />
coustani showed a more exophagic<br />
behavior. We observed that the local<br />
people in the study area spend the early<br />
part <strong>of</strong> the night (on average up to 10 pm)<br />
outdoors either working on their field or<br />
taking care <strong>of</strong> their cattle. Such night time<br />
behavior <strong>of</strong> the local people might<br />
increase the chance <strong>of</strong> receiving more<br />
bites by the inherently exophagic<br />
populations <strong>of</strong> An. arabiensis and An.<br />
pharoensis in the study area. Similar<br />
suggestion for An. arabiensis was<br />
previously made by Ameneshewa (1995)<br />
who worked in Gergedi (Awash valley,<br />
about 80 Km from Zeway) reported that<br />
the biting behavior <strong>of</strong> this species depends<br />
strongly on the availability <strong>of</strong> host either<br />
indoors or outdoors during the period <strong>of</strong><br />
its biting activity in the evening. An.<br />
pharoensis and An. coustani are well<br />
known exophagic species in Ethiopia<br />
(Nigatu et al., 1994; Adugna and Petros,<br />
1997; Abose et al., 1998b; Taye et al.,<br />
2006) and elsewhere in Africa, such as<br />
Kenya (Ijumba et al., 1990; Mukiama and<br />
Mwangi, 1989), Sudan (El Gaddal et al.,<br />
1985) and Cameroon (Antonio-Nkondjio<br />
et al., 2006).<br />
We found that peak indoor and outdoor<br />
activities <strong>of</strong> An. arabiensis, An.<br />
pharoensis and An. coustani occurred<br />
during the early period <strong>of</strong> the night (before<br />
22:00 hours), coinciding with the night<br />
time behavior <strong>of</strong> the local people in the<br />
study area. Similar early biting behavior<br />
was previously reported for An. arabiensis<br />
and An. pharoensis in Zeway (Abose et<br />
al., 1998b), and An. arabiensis in Tigray<br />
(Yohannes et al., 2005). In Sille, an<br />
irrigated village in southern Ethiopia,<br />
Taye et al., (2006) reported that peak<br />
biting activities <strong>of</strong> An. pharoensis and An.<br />
coustani occurred between 18:00 and<br />
20:00 hours, which is in agreement with<br />
the present findings for the two species. In<br />
contrast to the observed early biting<br />
periodicity <strong>of</strong> An. arabiensis in the present<br />
study area, these authors reported a peak<br />
biting activity between 23:00 and 3:00<br />
hours for the same species in Sille.<br />
Interestingly, 40 years ago, in Zeway area<br />
most An. gambiae s.l. (presumably An.<br />
arabiensis) fed readily after 23:00 hours<br />
and little early evening biting activity was<br />
recorded (Rishikesh, 1966), suggesting<br />
that the early biting behavior <strong>of</strong> this<br />
species has evolved since then. The early<br />
biting activity <strong>of</strong> An. arabiensis is likely to<br />
be a consequence <strong>of</strong> long-term application<br />
<strong>of</strong> residual insecticides, particularly DDT,<br />
selecting for early biting behavior as it has<br />
also been suggested recently in Tigray<br />
(Yohannes et al., 2005). Moreover, such<br />
early biting activity <strong>of</strong> the malaria vector<br />
populations in the current study area is<br />
likely to compromise the efficacy <strong>of</strong><br />
insecticide-treated bed nets as large<br />
proportion <strong>of</strong> bites occurred before the<br />
local people, including children, go to<br />
sleep under their bed nets.<br />
In the present study, An. arabiensis had a<br />
higher parous rate during the dry season<br />
than the short-rainy season while An.<br />
pharoensis showed insignificant variation<br />
in its parous rate during the two seasons.<br />
This report is inconsistent with a previous<br />
finding in Upper Awash that recorded a<br />
434
higher parous rate for An. arabiensis<br />
during the wet season than the dry season<br />
(Ameneshewa, 1995). The explanation for<br />
this discrepancy is that following the<br />
unusual heavy rains in April, high<br />
recruitment <strong>of</strong> young ones into the<br />
existing older population might have<br />
resulted in a higher proportion <strong>of</strong><br />
nulliparous females and hence lower<br />
parous rate. The parity rate <strong>of</strong> An.<br />
arabiensis and An. pharoensis thus<br />
suggested higher longevity during the dry<br />
season, hence likely to maintain malaria<br />
transmission during this season <strong>of</strong> the<br />
year.<br />
The reported Human Blood Index (HBI)<br />
for An. arabiensis (0.78) and An.<br />
pharoensis (0.69) in the present study<br />
reaffirmed the importance <strong>of</strong> these species<br />
in malaria transmission in Zeway area.<br />
Yohannes et al (2005) reported an HBI <strong>of</strong><br />
0.72 for indoor-resting An. arabiensis in<br />
Tigray, northern Ethiopia, which is a<br />
comparable finding for the same species in<br />
the present study. An HBI <strong>of</strong> 0.66 was<br />
reported for An. arabiensis in Konso,<br />
southern Ethiopia, (Tirados et al., 2006),<br />
which is lower than the present finding, as<br />
the species population in Konso was<br />
reported to be exclusively exophagic.<br />
Adugna and Petros (1996) reported higher<br />
HBI for An. pharoensis (0.84) and An.<br />
coustani (0.26) from samples collected in<br />
mixed dwellings. In our study, An.<br />
coustani had shown an exceptionally high<br />
preference <strong>of</strong> An. coustani (75%) for<br />
bovine blood – hence less likely to play<br />
significant role in malaria transmission.<br />
Hence, the present study confirmed that<br />
An. arabiensis and An. pharoensis are the<br />
two most important anthropophagic<br />
species in Zeway area, which is in<br />
agreement with previous reports from the<br />
same area (Rishikesh, 1966; Abose et al.,<br />
1998b).<br />
The P. falciparum sporozoite rate <strong>of</strong><br />
1.18% for An. arabiensis in the present<br />
study is comparable to the 1.1%<br />
sporozoite rate reported from Arbaminch<br />
(Habtewold et al., 2001) and Sille (Taye<br />
et al., 2006; Tirados et al., 2006), but<br />
lower than a 1.52% sporozoite rate in the<br />
adjacent, Wonji area (Ameneshewa,<br />
1995). A 0.88% P. falciparum sporozoite<br />
rate <strong>of</strong> An. pharoensis in the dry season<br />
confirms the vectorial role <strong>of</strong> this species<br />
in malaria transmission in the irrigated<br />
villages <strong>of</strong> Zeway area particularly during<br />
the dry season. On the other hand,<br />
Anopheles arabiensis was found infected<br />
with P. falciparum sporozoites both in the<br />
dry and short-rainy seasons, suggesting<br />
that this species play significant role in<br />
malaria transmission both in the dry and<br />
wet seasons <strong>of</strong> the year. These findings<br />
could be the first report for the dry season<br />
and also for An. pharoensis. Hence, the<br />
role <strong>of</strong> An. pharoensis in transmitting P.<br />
falciparum should not be underestimated<br />
in areas where this species is abundant.<br />
The major short-coming <strong>of</strong> the current<br />
study was that larval and adult collections<br />
were made merely on seasonal basis, only<br />
focusing on the dry and short-rainy<br />
seasons, due to which monthly variations<br />
at different periods <strong>of</strong> the year were not<br />
shown. Hence, further longitudinal studies<br />
in the same area are required to ascertain<br />
the present findings.<br />
In conclusion, although development <strong>of</strong><br />
irrigation schemes is <strong>of</strong> paramount<br />
importance to increase crop yield and<br />
hence to ensure food security and<br />
economic growth in Ethiopia, its adverse<br />
health problems may pose significant<br />
public health concerns. The findings <strong>of</strong> the<br />
present study underscore the importance<br />
<strong>of</strong> irrigation schemes in semi-arid areas<br />
like Zeway in maintaining malaria<br />
transmission particularly during the dry<br />
season, when mosquito abundance is<br />
normally presumed to be limited. Proper<br />
water management and control measures<br />
such as source reduction through<br />
environmental management could help to<br />
reduce mosquito-breeding sites and thus<br />
malaria transmission.<br />
435
References<br />
Abose, T., Ameneshewa, B., Teklehaimanot,<br />
A., Tulu, A., Colluzi, M., Petrica., V.<br />
and Petrangeli, G. 1998a. Cytogenetic<br />
studies on the Anopheles gambiae<br />
complex species in Ethiopia. Ethiop. J.<br />
Health Dev.. 12: 81-83.<br />
Abose, T., Ye-ebiyo, Y., Olana, D.,<br />
Alamirew, D., Beyene, Y., Regassa, L.<br />
and Mengesha, A. 1998b. Reorientation<br />
and definition <strong>of</strong> the role <strong>of</strong> malaria<br />
vector control in Ethiopia.<br />
WHO/Mal/1998.1085. World Health<br />
Organization. Geneva. Pp 38.<br />
Adugna, N. and Petros, B. 1996.<br />
Determination <strong>of</strong> the human blood index<br />
<strong>of</strong> some anopheline mosquitoes by using<br />
ELISA. Ethiop Med J. 34:1-10.<br />
Ameneshewa, B. 1995. The behavior and<br />
biology <strong>of</strong> Anopheles arabiensis in<br />
relation to epidemiology and control <strong>of</strong><br />
malaria in Ethiopia. Ph.D. Thesis.<br />
University <strong>of</strong> Liverpool, UK. Pp 288.<br />
Ameneshewa, B. and Service, M.W. 1996.<br />
Resting habits <strong>of</strong> Anopheles arabiensis<br />
in the Awash Valley <strong>of</strong> Ethiopia. Annals<br />
Trop Med Parasitol. 90: 515-521.<br />
Amerasinghe, F.P. and Munasingha, N.B.<br />
1988. A predevelopment mosquito<br />
survey in the Mahaweli Development<br />
Project area, Sri Lanka: immatures. J<br />
Med Entomo.125: 286-294.<br />
Antonio-Nkondjio, C., Kerah, C.H., Simard,<br />
F., Awono-Ambene, P., Chouaibou, M.,<br />
Tchuinkam, T. and Fontenille, D. 2006.<br />
Complexity <strong>of</strong> malaria vectorial system<br />
in Cameroon: contribution <strong>of</strong> secondary<br />
vectors to malaria transmission. J Med<br />
Entomo. 43(6): 1215-1221.<br />
Beier, J.C., Perkins, P.V., Wirtz, R.A.,<br />
Koros, J., Diggs, D., Gargian, T.P. and<br />
Koech, D.K. 1988. Bloodmeal<br />
identification by Enzyme-Linked<br />
Immunosorbent Assay (ELISA), tested<br />
on Anopheles (Diptera: Culicidae) in<br />
Kenya. J Med Entomo. 25: 9-16.<br />
Boudin, C., Robert, V., Carnevale, P.,<br />
Ambroise, T.P., 1992. Epidemiology <strong>of</strong><br />
Plasmodium falciparum in a rice field<br />
and a savanna area in Burkina Faso:<br />
comparative study on the acquired<br />
immunoprotection in native populations.<br />
Acta Trop. 51:103–111.<br />
Bradley, D.J. 1988. The epidemiology <strong>of</strong><br />
ricefield-associated<br />
diseases.<br />
<strong>International</strong> Rice Research <strong>Institute</strong> in<br />
collaboration with WHO/FAO/UNEP,<br />
Panel <strong>of</strong> Experts on Environmental<br />
<strong>Management</strong> for Vector Control.<br />
<strong>International</strong> Rice Research <strong>Institute</strong>,<br />
Philippines. pp 29-39.<br />
El Gaddal, A.A., Haridi, A.M., Hassan, F.T.<br />
and Hussein, H. 1985. Malaria control in<br />
the Gezira-Managil irrigated scheme <strong>of</strong><br />
the Sudan. J Trop Med Hyg. 88:153-9.<br />
Faye, O., Gaye, O., Herve, J.P., Diack, P.A.<br />
and Diallo, S. 1993.Malaria in the<br />
sahelian zone <strong>of</strong> Senegal: Parasitic<br />
indices. Ann Soc Belg Med Trop. 73:<br />
31–36.<br />
Ghebreyesus, T.A., Haile, M., Witten, K.,<br />
Getachew, A., Yohannes, A., Yohannes,<br />
M., Teklehaimanot, H. and Lindsay,<br />
S.W. 1999. Incidence <strong>of</strong> malaria among<br />
children living near dams in northern<br />
Ethiopia: community-based incidence<br />
survey. Brit Med J. 319:663-669.<br />
Gillies, M.T. and Coetzee, M. 1987. A<br />
supplement to the Anophelinae <strong>of</strong><br />
Africa, South <strong>of</strong> Sahara (Afrotropical<br />
Region). Publications <strong>of</strong> the South<br />
African <strong>Institute</strong> <strong>of</strong> Medical Research.<br />
Pp 66.<br />
Gratz, N.G. 1988. The impact <strong>of</strong> rice<br />
production on vector-borne disease<br />
problems in developing countries.<br />
<strong>International</strong> Rice Research <strong>Institute</strong> in<br />
collaboration with WHO/FAO/UNEP,<br />
Panel <strong>of</strong> Experts on Environmental<br />
<strong>Management</strong> for Vector Control.<br />
<strong>International</strong> Rice Research <strong>Institute</strong>,<br />
Philippines. pp7-12.<br />
Habtewold, T., Walker, A.R., Curtis, C.F.,<br />
Osir, E.O. and Thapa, N. 2001. The<br />
feeding behavior and Plasmodium<br />
infection rates <strong>of</strong> Anopheles mosquitoes<br />
in southern Ethiopia in relation to use <strong>of</strong><br />
insecticide-treated livestock for malaria<br />
control. Trans Royal Soc Trop Med<br />
Hyg. 95: 584-586.<br />
436
Henry, M.C., Rogier, C., Nzeyimana, I.,<br />
Assi, S.B., Dossou-Yovo, J., Audibert,<br />
M., Mathonnat, J., Keundjian, A.,<br />
Akodo, E., Teuscher, T. and Carnevale,<br />
P. 2003. Inland valley rice production<br />
systems and malaria infection and<br />
disease in the savannah <strong>of</strong> Cote d’Ivoire.<br />
Trop Med Int Health. 8: 449–458.<br />
Ijumba, J.N. and Lindsay, S.W. 2001.<br />
Impact <strong>of</strong> irrigation on malaria in<br />
Africa: paddies paradox. Med Vet<br />
Ent.15: 1-11.<br />
Ijumba, N.J. Mwangi, R.W. and Beier, J.C.<br />
1990. Malaria transmission potential <strong>of</strong><br />
Anopheles mosquitoes in the Mwea-<br />
Tebere irrigation schemes, Kenya. Med<br />
Vet Entomo. 4: 425-432.<br />
Josse, R., Josseran, R., Audibert, M., 1987.<br />
Malariometry and seasonal variations <strong>of</strong><br />
malaria indices in the rice fields <strong>of</strong><br />
Maga (north Cameroon) and in the<br />
adjacent region. Med Parasitol. 25: 63–<br />
71.<br />
Lewis, D.J. 1958. The recognition <strong>of</strong><br />
nulliparous and parous Anopheles<br />
gambiae by examining the ovarioles.<br />
Trans Royal Soc Trop Med Hyg. 52:<br />
456-461.<br />
Lindsay, S.W., Wilkins, H.A., Zieler, H.A.,<br />
Daly, R.J., Petrarca, V. and Byass, P.<br />
1991. Ability <strong>of</strong> Anopheles gambiae<br />
mosquitoes to transmit malaria during<br />
the dry and wet seasons in an area <strong>of</strong><br />
irrigated rice cultivation in The Gambia.<br />
J Trop Med Hyg. 94: 313–324.<br />
Lines, J.D., Curtis, C.F., Wilkes, T.J. and<br />
Njunwa, K.J. 1991. Monitoring humanbiting<br />
mosquitoes (Diptera:Culicidae) in<br />
Tanzania with light traps hung beside<br />
mosquito nets. Bull Entomo Res. 81:77-<br />
84.<br />
Lipton, M., Litchfield, J. and Faures, J-M.<br />
2003. The effects <strong>of</strong> irrigation on<br />
poverty: a framework for analysis.<br />
<strong>Water</strong> Policy. 5: 413-427.<br />
Marramaa, L., Jambou, R., Rakotoarivony,<br />
I., Pock Tsi, J.M.L., Duchemine, J.B., S.<br />
Laventure, S., J. Mouchet, J. and Rouxh,<br />
J. 2004. Malaria transmission in<br />
Southern Madagascar: influence <strong>of</strong> the<br />
environment and hydro-agricultural<br />
works in sub-arid and humid regions.<br />
Part 1. Entomological investigations.<br />
Acta Trop. 89: 193–203.<br />
McCartney, M.P., Lankford, B.A. and<br />
Mahoo, H. 2007. Agricultural water<br />
management in a water stressed<br />
catchment: lessons from the<br />
RIPARWIN project. Research Report<br />
116. <strong>International</strong> <strong>Water</strong> <strong>Management</strong><br />
<strong>Institute</strong>. Colombo, Sri Lanka.<br />
Ministry <strong>of</strong> <strong>Water</strong> Resource (MWR). 2002.<br />
<strong>Water</strong> sector development program<br />
2002-2016. Volume II. Main Report.<br />
Ministry <strong>of</strong> <strong>Water</strong> Resources, Federal<br />
Democratic Republic <strong>of</strong> Ethiopia. Addis<br />
Ababa. October 2002.<br />
Mukiama, T. and Mwangi, R. 1989.<br />
Seasonal population changes and<br />
malaria transmission potential <strong>of</strong><br />
Anopheles pharoensis and the minor<br />
anophelines in Mwea Irrigation Scheme,<br />
Kenya. Acta Tropica. 46(3): 181-189.<br />
Muturi, E., Shililu, J., Jacob, B., Gu, W.,<br />
Githure, J. and Novak, R. 2006.<br />
Mosquito species diversity and<br />
abundance in relation to land use in<br />
riceland agroecosystem in Mwea,<br />
Kenya. J Vect Biol. 31(1): 129-137.<br />
Nigatu, W., Petros, B., Lulu, M., Adugna, N.<br />
and Wirtz, R. 1994. Species<br />
composition, feeding and resting<br />
behavior <strong>of</strong> the common anthropophilic<br />
anopheline mosquitoes in relation to<br />
malaria transmission in Gambella,<br />
Southwest Ethiopia. Ins Scie Appls.<br />
15(3): 371-377.<br />
Rishikesh, N. 1966. Observations on<br />
Anopheline Vectors <strong>of</strong> Malaria in an<br />
unsprayed Upland Valley in Ethiopia.<br />
WHO/MAL/66.554. Geneva. 26pp.<br />
Service, M.W. 1993. Mosquito Ecology:<br />
Field Sampling Methods. 2nd Edition.<br />
Chapman and Hall, London. UK.<br />
Sissoko, M.S., Dicko, A., Briët, O.J.T.,<br />
Sissoko, M., Sagara, I., Keita, H.D.,<br />
Sogoba, M., Rogier, C., Touré, Y.T. and<br />
Doumbo, O.K. 2004. Malaria incidence<br />
in relation to rice cultivation in the<br />
irrigated Sahel <strong>of</strong> Mali. Acta Trop. 89:<br />
161–170.<br />
437
Snow, F. 1983. Mosquito production and<br />
species secession from an area <strong>of</strong><br />
irrigated rice fields in The Gambia,<br />
West Africa. J Trop Med Hyg. 86: 237-<br />
245.<br />
Soliman, A.A., Rifaat, M.A. and Ibrahim,<br />
M.T.H. 1967. Biology <strong>of</strong> Egyptian<br />
Anophelines. I. Biological activities <strong>of</strong><br />
Anopheles pharoensis in nature. J Trop<br />
Med Hyg. 70(3): 63-67.<br />
Taye, A., Haddis, M., Adugna, N., Tilahun,<br />
D. and Wirtz, R.A. 2006. Biting<br />
behavior and Plasmodium infection<br />
rates <strong>of</strong> Anopheles arabiensis from Sille,<br />
Ethiopia. Acta Trop. 97:50-54.<br />
Tirados, I., Constantini, C. Gibsson, G. and<br />
Torr, S.J. 2006. Blood-feeding behavior<br />
<strong>of</strong> the malaria mosquito Anopheles<br />
arabiensis: implication for vector<br />
control. Med Vet Entomo. 20: 425-437.<br />
Verrone, G.A. 1962a. Outline for the<br />
determination <strong>of</strong> malaria mosquitoes in<br />
Ethiopia. Part I. Adult female<br />
anophelines. Mosq News. 22: 37-49.<br />
Verrone, G.A. 1962b. Outline for the<br />
determination <strong>of</strong> malaria mosquitoes in<br />
Ethiopia. Part II. Anopheline Larvae.<br />
Mosq News. 22:394-401.<br />
Wirtz, R.A., Zavala, F., Charoenvit, Y.,<br />
Campbell, G.H., Burkot, T.R.,<br />
Schneider, I., Esser, K.M., Beaudoin,<br />
R.L. and Andre, R.G. 1987.<br />
Comparative testing <strong>of</strong> monoclonal<br />
antibodies against Plasmodium<br />
falciparum sporozoites for ELISA<br />
development. Bull WHO. 65(1): 39-45.<br />
World Health Organization (WHO). 2006.<br />
Global Malaria Situation. WHO<br />
Technical Report Series.<br />
WHO/RBM/2006.3. Geneva. Pp34.<br />
Ye-Ebiyo, Y., Pollack, R. J. and Spielman,<br />
A. 2000. Enhanced development in<br />
nature <strong>of</strong> larval Anopheles arabiensis<br />
mosquitoes feeding on maize pollen.<br />
Am J Trop Med Hyg. 63(1): 90-93.<br />
Ye-ebiyo, Y., Pollack, R.J., Kiszewski, A.<br />
and Spielman, A. 2003. Enhancement <strong>of</strong><br />
development <strong>of</strong> larval Anopheles<br />
arabiensis by proximity to flowering<br />
maize (Zea mays) in turbid water and<br />
when crowded. Am J Trop Med Hyg.<br />
68(6): 748-752.<br />
Yohannes, M., Haile, M., Ghebreyesus,<br />
T.A., Witten, K., Getachew, A., Byass,<br />
P. Lindsay, S.W. 2005. Can source<br />
reduction <strong>of</strong> mosquito larval habitat<br />
reduce malaria transmission in Tigray,<br />
Ethiopia? Trol Med Int Health. 10(12):<br />
1274-1285.<br />
438
Malaria Transmission In Ziway, Eastern Shewa Zone, As Related to<br />
Irrgation Development<br />
Yihenew Alemu 1 , Eline Boelee 2 , Beyene Petros 1 , Dawit Alemu 3 , Solomon Kibret 1<br />
1 Department <strong>of</strong> Biology, Addis Ababa University (AAU), Addis Ababa, Ethiopia<br />
2 <strong>International</strong> <strong>Water</strong> <strong>Management</strong> <strong>Institute</strong> (IWMI) Addis Ababa, Ethiopia<br />
3 Ethiopian <strong>Institute</strong> <strong>of</strong> Agricultural Research (EIAR) Addis Ababa, Ethiopia<br />
Abstract<br />
Malaria is the major public health problem<br />
in Ethiopia in general and in the Oromia<br />
Regional State in particular. Ziway is one <strong>of</strong><br />
Oromia regions with frequent malaria<br />
epidemics usually occurring at the end <strong>of</strong> the<br />
main rainy season, September to mid<br />
December. In addition it is one <strong>of</strong> the<br />
regions in Ethiopia where unreliable rainfall<br />
frequently affects agricultural production.<br />
The government <strong>of</strong> Ethiopia supported the<br />
development <strong>of</strong> small-scale irrigation<br />
schemes to ensure food self-sufficiency and<br />
sustain agricultural productivity. However,<br />
without proper planning such schemes are<br />
known to worsen vector-borne disease<br />
endemicity. The objective <strong>of</strong> the study was<br />
to assess the effect <strong>of</strong> small-scale irrigation<br />
schemes on malaria transmission around<br />
Ziway. Blood smear samples were examined<br />
at the end <strong>of</strong> the main rainy season and the<br />
dry season <strong>of</strong> 2005/2006. Overall irrigated<br />
areas had significantly higher (19.2%;<br />
p
small scale modern schemes. Such schemes<br />
were expanded after the catastrophic<br />
drought in 1973/74 to achieve food security<br />
and better peasants’ livelihoods by<br />
producing cash crops. Such schemes involve<br />
dams and diversions <strong>of</strong> streams and rivers<br />
(Awulachew et al., 2005).<br />
Irrigation schemes in some parts <strong>of</strong> the<br />
country were found to increase malaria<br />
transmission (Ghebreyesus et al., 1999).<br />
These irrigation schemes had been<br />
introduced to reduce dependence <strong>of</strong> local<br />
agriculture on irregular rainfall. However,<br />
while the schemes have had a positive<br />
impact on agriculture, the effect on health<br />
has been worrying, with an increased<br />
incidence <strong>of</strong> malaria. The findings in<br />
Ethiopia raise fears that, unless properly<br />
thought out schemes to improve the<br />
environment are in place, irrigation could do<br />
as much harm as good (Ghebreyesus et al.,<br />
1999). Therefore, it is vital to gain a better<br />
understanding <strong>of</strong> the influence that irrigation<br />
and agricultural activities have on the spread<br />
<strong>of</strong> malaria especially as developing<br />
countries extend their irrigated areas to feed<br />
rapidly growing populations.<br />
The general objective <strong>of</strong> this study was<br />
to generate information for an effective<br />
and economically viable integrated<br />
management strategy that describes<br />
health and irrigation factors, to create<br />
effective malaria prevention in irrigated<br />
area. Hence, malaria transmission has<br />
been assessed as related to irrigation<br />
development at the study sites, by<br />
determining the prevalence <strong>of</strong> the<br />
Plasmodium infections in irrigated and<br />
non-irrigated areas at different villages<br />
around Ziway. Secondly, options have<br />
been identified for creative malaria<br />
control if it is found increased with<br />
irrigation.<br />
Materials and Methods<br />
Study Area<br />
The study was conducted in Oromia<br />
Regional state, East Showa Zone, Adamitulu<br />
Judo Kombolcha Woreda (figure: 1). It is<br />
163 Km south <strong>of</strong> Addis Ababa alongside<br />
Lake Ziway. Similar to other Ethiopian<br />
regions the main rainy season <strong>of</strong> the area<br />
starts in June and extends up to<br />
August/September while the short rainy<br />
season begins in March and extends to<br />
April/May. The area mean annual<br />
temperature <strong>of</strong> 20 O C and annual maximum<br />
and minimum temperature <strong>of</strong> 27.5 O C and<br />
13.9 O C respectively. The mean annual rain<br />
fall <strong>of</strong> the area varies between 700 and 800<br />
mm (Figure: 2) .The area is characterized as<br />
lowland with sparsely distributed Acacia<br />
trees and thorny bushes.<br />
At the beginning <strong>of</strong> the study, relevant<br />
socio-demographic information was sought<br />
from the agricultural and health <strong>of</strong>fice<br />
experts <strong>of</strong> the area through structured<br />
interviews. This was followed by selection<br />
<strong>of</strong> specific sites/villages and two crosssectional<br />
surveys at the end <strong>of</strong> the rainy and<br />
during the dry season. The rainy season data<br />
were colleted in September/October, which<br />
is the period with the highest malaria<br />
transmission almost every year in Ziway<br />
(Abose et al., 1998; Seyoum et al., 2002).<br />
The dry season study was conducted in<br />
February/March before the beginning <strong>of</strong> the<br />
short rainy season and before the second<br />
round indoor insecticide spray begins.<br />
440
160<br />
35<br />
140<br />
120<br />
R e l a t i v<br />
R<br />
e<br />
a<br />
H<br />
i n<br />
u<br />
f<br />
m<br />
a l l<br />
d<br />
( m<br />
i t i y<br />
m<br />
( %<br />
)<br />
) a n d<br />
100<br />
80<br />
60<br />
40<br />
20<br />
30<br />
25<br />
20<br />
15<br />
10<br />
5<br />
T e m p e r a t u r e<br />
0<br />
Jan Feb Mar Apr May Jun Jul Aug Sep Oct Nov Dec<br />
Months, 1995- 2006<br />
0<br />
Rain Fall (mm) Relative Humditiy (%) Mean Min Temp Mean Max Temp<br />
Figure 2. Monthly rainfall (mm), mean relative humidity, mean maximum<br />
and minimum monthly air temperatures ( o C) <strong>of</strong> Ziway area, 1995-2006.<br />
Figure 1: Map <strong>of</strong> Ethiopia showing location <strong>of</strong> the study site<br />
Agency (NMA)<br />
Source: National Meteorological<br />
Selection <strong>of</strong> the irrigated area was done<br />
based on pre-defined criteria 1) the irrigation<br />
site should be far from the lake that is the<br />
main source <strong>of</strong> irrigation water in order to<br />
avoid the effect <strong>of</strong> vectors that breed in<br />
natural habitats; 2) farmers should live in<br />
close proximity to the irrigation fields but<br />
away from the lake; 3) the site should be<br />
accessible and close to the Woreda health<br />
center for easy <strong>of</strong> sample transport and<br />
examination. Abine Germamo was found to<br />
be the area, which best fitted to the selection<br />
criteria. It is found more than 5 km away<br />
from the source <strong>of</strong> irrigation water (the lake)<br />
and non- irrigated area.<br />
Abine Germamo is found at the northern<br />
outskirts <strong>of</strong> Ziway town by the side <strong>of</strong> the<br />
road coming from Addis Ababa. It includes<br />
previous kebeles Hizbawi Betele, Abine<br />
Gijota and Abine Germamo. It is located at<br />
1647 meters above sea level. According to<br />
the information obtained from the<br />
agricultural <strong>of</strong>fice, the number <strong>of</strong><br />
households in this kebele reaches up to 934.<br />
However, the beneficiaries <strong>of</strong> irrigation in<br />
the 2004/2005 production season were only<br />
75 households. Lake Ziway is the source <strong>of</strong><br />
irrigation water. Both the eastern (the field<br />
between the lake and the road) and the<br />
western side <strong>of</strong> the main road are irrigated<br />
441
ut almost all the farmers are living on the<br />
western side <strong>of</strong> the road. Pumps are used in<br />
order to lift the water, then it is delivered<br />
over a long distance through pipes and<br />
surface canals. Finally the water is diverted<br />
down to all irrigation fields by surface<br />
irrigation with the help <strong>of</strong> the force <strong>of</strong><br />
gravity. The houses <strong>of</strong> the farmers are found<br />
in close proximity to the irrigation fields. All<br />
the inhabitants <strong>of</strong> the area, those benefited<br />
from irrigation (irrigators) and those without<br />
access to irrigation (non-irrigators) are<br />
almost all found in close proximity to the<br />
irrigation fields.<br />
The main criteria for selecting the nonirrigated<br />
area were: 1) it should be at a<br />
distance beyond the reach <strong>of</strong> mosquitoes<br />
from the irrigated area and the lake<br />
(Ghebreyesus et al., 1999; Klinkenberg et<br />
al., 2005; Yohannes et al., 2005); 2) with the<br />
same topographical position, comparable<br />
agricultural production system and other<br />
important features except irrigation as the<br />
irrigated areas (Ghebreyesus et al., 1999;<br />
Klinkenberg et al., 2005; Yohannes et al.,<br />
2005); 3) accessibility. Three areas were<br />
taken into consideration for the selection <strong>of</strong><br />
the non-irrigated area but Weshgule was<br />
found to be the area, which fitted to the<br />
selection criteria best. Weshgule is found at<br />
the southern outskirts <strong>of</strong> Ziway town at 1654<br />
meters above sea level.<br />
Sample selection<br />
We assessed malaria parasite prevalence,<br />
a direct indicator <strong>of</strong> the impact <strong>of</strong><br />
malaria, in communities with and<br />
without irrigation (Klinkenberg et al.,<br />
2005). Six year <strong>of</strong> malaria case data in<br />
the study areas from the Health <strong>of</strong>fice at<br />
Ziway was taken for the determination<br />
<strong>of</strong> sample size. Average <strong>of</strong> positive cases<br />
1999/2000 - 2004/2005 <strong>of</strong> the irrigation<br />
area divided by the population <strong>of</strong><br />
2003/04 <strong>of</strong> the area was taken as average<br />
annual prevalence in irrigated area and<br />
average <strong>of</strong> positive cases <strong>of</strong> 1999/2000 -<br />
2004/2005 <strong>of</strong> the non-irrigated areas<br />
divided by the population <strong>of</strong> 2003/04 <strong>of</strong><br />
the area was used to estimate the<br />
prevalence in the non-irrigated area.<br />
Using Win Episcope 2.0 (developed by<br />
facultad de veternaria Zara goza,<br />
Wagningen University and University <strong>of</strong><br />
Edinburgh) computer s<strong>of</strong>t-ware the<br />
sample size was determined. It was<br />
estimated by using the difference<br />
between proportions with 95% level <strong>of</strong><br />
confidence interval and value <strong>of</strong> 80% for<br />
the power with the formula (for the<br />
sample size) for a two-tailed test:<br />
2<br />
⎡Z(<br />
a)<br />
+ Z(<br />
b)<br />
⎤<br />
n = ⎢ ⎥ ∗[ ( p1<br />
* q1)<br />
+ ( p2<br />
* q2)<br />
]<br />
⎣ p1<br />
− p2<br />
⎦<br />
Where Z (a) and Z (b) are the value <strong>of</strong><br />
student’s t at specified confidence level<br />
and at the specified power, respectively,<br />
and p 1 and p 2 are proportion in<br />
population one and two respectively and<br />
p 1 .q 1 and p 2 .q 2 are the variance <strong>of</strong> the<br />
proportion in population one and two.<br />
Hence the sample size according to this<br />
method was calculated to be 700.<br />
Meanwhile, based on prevalence rate<br />
obtained from parasitological survey<br />
conducted at Ziway Eddo-Gojola<br />
irrigation area by Abose et al., (1998), the<br />
sample size was calculated to be 280.<br />
Then by taking the average <strong>of</strong> these two<br />
calculations the sample size was finally<br />
determined to be approximately 500<br />
samples (individuals) each from the<br />
irrigated and non-irrigated areas.<br />
The applied sampling method was<br />
probability sampling; where each member <strong>of</strong><br />
the population has a known non-zero<br />
probability <strong>of</strong> being selected. Systematic<br />
sampling was used in the study. The list <strong>of</strong><br />
households for the selected areas, knowing<br />
that the list does not contain any hidden<br />
order, was obtained from the kebele leaders<br />
and it was used as a sampling frame. After<br />
442
the required sample size had been calculated<br />
every n th record, calculated by dividing the<br />
sample size by the average family size <strong>of</strong> the<br />
area, selected from a list <strong>of</strong> population<br />
members. Every head <strong>of</strong> the household<br />
found at home during sample collection was<br />
informed about the study and the consent<br />
form was read to them. When they agreed to<br />
participate in the study blood smear samples<br />
were collected from all family members. In<br />
case a household did not want to participate<br />
in the study or if the head <strong>of</strong> the household<br />
not found at home, then the next house was<br />
taken as a replacement.<br />
Parasitological survey<br />
Blood samples were colleted by skin<br />
pricking <strong>of</strong> the finger onto glass slides at the<br />
end <strong>of</strong> the rainy season and during the dry<br />
season <strong>of</strong> the study. Specialized laboratory<br />
technicians <strong>of</strong> the Woreda malaria control<br />
laboratory did the blood sample collection<br />
from the selected households (Figure 6 & 7).<br />
The thick and thin blood smears were<br />
prepared on the same slide side by side,<br />
properly labeled, air dried and then the thin<br />
blood smears were fixed with methanol onsite.<br />
The samples were carefully transported<br />
to the Ziway Woreda health <strong>of</strong>fice<br />
laboratory where specialized laboratory<br />
technicians did the staining and<br />
parasitological test by microscopic<br />
examination. The samples were put into<br />
slide boxes and transported to Addis Ababa<br />
and further examination <strong>of</strong> all the positive<br />
samples and 10% <strong>of</strong> the negative samples<br />
(Ghebreyesus et al.,. 1999) were also done<br />
in AAU Biomedical Science laboratory. The<br />
thick and the fixed thin blood film slides <strong>of</strong><br />
the second season (dry season) samples were<br />
properly stained and examined at Ziway<br />
Woreda health <strong>of</strong>fice laboratory.<br />
Afterwards, these were also put into slide<br />
boxes and then transported to the Ethiopian<br />
Health and Nutrition Research <strong>Institute</strong><br />
(EHNRI) Laboratory, Addis Ababa, where<br />
further conformational examination was<br />
done by technicians <strong>of</strong> the institute.<br />
The quality <strong>of</strong> the Giemsa staining solution<br />
was checked before using directly to the<br />
samples. A fresh 10% Giemsa solution in<br />
tap water was prepared and the air-dried<br />
slides were immersed into a staining jar for<br />
10 minutes. The stained slides were rinsed<br />
by tap water and put in upright position to<br />
dry (Schilchtherle et al., 2000). The stained<br />
thick and thin films were observed under<br />
100x oil immersion objective light<br />
microscope. First, the thick blood smear<br />
samples were observed in order to know<br />
whether the sample is positive or negative.<br />
When a sample was found positive then the<br />
thin blood smear was used to identify the<br />
species.<br />
Ethical considerations<br />
Ethical considerations were addressed by<br />
treating positive malaria cases according to<br />
the standard drug regimen. Informed consent<br />
was obtained from adult study subjects and<br />
from parents and guardians in case <strong>of</strong><br />
children before sampling. The project<br />
obtained ethical approval from the Ethical<br />
Committee <strong>of</strong> the School <strong>of</strong> Graduate<br />
Studies <strong>of</strong> Addis Ababa University. The<br />
project was also discussed with concerned<br />
authorities in the study areas and their<br />
agreement was obtained. Those individuals<br />
with positive results were treated with the<br />
required treatment and dose free <strong>of</strong> charge.<br />
The treatment was given in collaboration<br />
with the Woreda health <strong>of</strong>fice according to<br />
the guidelines <strong>of</strong> Ethiopian Ministry <strong>of</strong><br />
Health. In this study, no invasive procedure<br />
other than the finger pricking, which is used<br />
for routine diagnosis, was used. Experienced<br />
laboratory technicians performed fingerpricking<br />
in order to avoid unnecessary pain<br />
and bleeding. For finger pricking, a single<br />
disposable sterile lancet was used per person<br />
to avoid possible transmission <strong>of</strong> infection.<br />
Results<br />
Blood smear samples were examined from a<br />
total <strong>of</strong> 2435 study participants, 1060 males<br />
and 1375 females. A total <strong>of</strong> 427 parasite<br />
positive slides were found in both study<br />
sites, 232 (19.2%) in irrigated villages and<br />
443
195 (16%) in non-irrigated areas. Out <strong>of</strong> 198<br />
(18.6%) infected males 10.3 % were in<br />
irrigated areas and 8.3% were in nonirrigated<br />
areas. Out <strong>of</strong> 229 (16.6%) infected<br />
females 8.9% were in irrigated areas and<br />
7.7% in non-irrigated areas. Overall malaria<br />
infection prevalence in irrigated areas was<br />
significantly (P0.05) difference in malaria<br />
infection prevalence between the two sexes<br />
(<strong>Table</strong> 1).<br />
<strong>Table</strong> 1. Overall malaria infection prevalence in the irrigated and non-irrigated<br />
areas, Ziway (2005/06).<br />
Malaria positive cases (%)<br />
No. <strong>of</strong> study participants Irrigated Non-irrigated<br />
Male 1060 110 (10.3) 88 (8.3)<br />
Female 1375 122 (8.9) 107 (7.7)<br />
Total 2435 232 (19.2)* 195(16.0)<br />
* Significant difference at (X 2 , P
Comparison <strong>of</strong> infection prevalence <strong>of</strong><br />
malaria in different age categories in<br />
irrigated and non-irrigated areas during the<br />
rainy and the dry seasons <strong>of</strong> the study is<br />
shown in table 3. In irrigated areas all age<br />
categories in the dry season showed higher<br />
malaria infection prevalence as compared to<br />
their infection prevalence in the rainy<br />
season. However, the difference was<br />
significantly (P
Discussion<br />
Irrigation structures <strong>of</strong>ten <strong>of</strong>fer ideal habitats<br />
for the proliferation <strong>of</strong> anopheline<br />
mosquitoes, including vectors <strong>of</strong> malaria. A<br />
study conducted in Tigray (Northern<br />
Ethiopia) for instance, indicated an overall<br />
increase in incidence <strong>of</strong> malaria in the<br />
villages close to dams as compared with the<br />
control villages (Ghebreyesus et al., 1999).<br />
Another study in Southeastern Ethiopia had<br />
shown malaria due to P. falciparum and P.<br />
vivax to be the main health problems in<br />
irrigation schemes along the Genale River<br />
(Birrie et al., 1997). A study in Arba-minch<br />
also showed irrigation activity to have<br />
created a year round breeding habitat for the<br />
anopheline mosquitoes (Ashenafi, 2003).<br />
The present study looked into the situation in<br />
Ziway where small-scale irrigation has been<br />
in practice for decades but the extent <strong>of</strong> its<br />
linkage with malaria has not been studied.<br />
The study findings are in agreement with the<br />
earlier reports that assessed the impact <strong>of</strong><br />
construction <strong>of</strong> small irrigation dams on the<br />
incidence <strong>of</strong> malaria in Tigray (Ghebreyesus<br />
et al., 1999) and that <strong>of</strong> Klinkenberg et al.<br />
(2005) in the irrigated areas in Ghana.<br />
The difference in malaria prevalence<br />
between irrigated and non-irrigated sites was<br />
more pronounced during the dry season.<br />
Probably, this is because the irrigation<br />
structures in the area would provide suitable<br />
breeding sites for malaria vector mosquitoes<br />
during the dry season, while those in the<br />
non-irrigated area dry out. Since mosquitobreeding<br />
sites such as pools and puddles<br />
would be equally available both in the<br />
irrigated and non-irrigated areas during the<br />
rainy season, such increase in malaria<br />
prevalence was not observed with irrigation.<br />
The humid environment during the small<br />
rains (March, April and May) which was at<br />
the same level <strong>of</strong> humidity following the big<br />
rains (October) (National Meteorological<br />
Agency, NMA) and the humid environment,<br />
which also is created through irrigation<br />
during the dry season, would enhance vector<br />
longevity. Moreover, Robert (2004)<br />
observed, the increase in the density <strong>of</strong><br />
foliage <strong>of</strong> plants will provide more shelter<br />
for adult mosquitoes, extending their<br />
longevity. Likewise, when the residual soil<br />
moisture increases with irrigation, it will<br />
extend the range <strong>of</strong> sheltered habitats for<br />
mosquitoes. This would explain the higher<br />
adult density <strong>of</strong> An. pharoensis in irrigated<br />
areas during the dry season (Abose et al.,<br />
1998).<br />
An. pharoensis is the second important<br />
vector, next to An. arabiensis, implicated in<br />
malaria transmission in Ziway (Abose et al.,<br />
1998; Seyoum et al., 2002). This species<br />
mostly rests outdoors on vegetation. The<br />
irrigated farming in the area where<br />
vegetables such as onion, cabbage, tomato,<br />
and cucumber, as well as cereal crops,<br />
mainly maize, were grown and other trees<br />
planted for fencing irrigation fields would<br />
provide ideal sites for resting and enhancing<br />
longevity <strong>of</strong> this vector species. The<br />
relevance <strong>of</strong> enhancement <strong>of</strong> longevity <strong>of</strong><br />
vector mosquitoes to malaria transmission<br />
has been shown by the findings <strong>of</strong> Mukiama<br />
and Mwangi (1989) where higher adult<br />
population <strong>of</strong> sporozoite-infected An.<br />
pharoensis was more abundant in irrigation<br />
schemes in Kenya. Moreover, the higher<br />
minimum temperature <strong>of</strong> the dry season in<br />
the irrigated areas would contribute to<br />
completion <strong>of</strong> parasite life cycle inside<br />
vectors.<br />
Furthermore, according to Carrara et al.<br />
(1990), An. pharoensis was the main malaria<br />
vector for intensive P. falciparum<br />
transmission in Senegal River delta where all<br />
examined An. gambiae Giles sensu lato were<br />
P. falciparum sporozoite negative. Besides<br />
the report from Senegal, the role <strong>of</strong> An.<br />
Pharoensis in P. falciparum-dominated<br />
malaria transmission in Ziway study area<br />
during the dry season is supported by the<br />
entomological survey concomitantly<br />
conducted in the area (Solomon Kibret et al.,<br />
2008 also in this proceedings).<br />
The higher dry season malaria transmission,<br />
related to availability <strong>of</strong> water bodies, was<br />
similar to what was reported by Carlson et<br />
al. (2004) that water in pits created during<br />
brick-making supported the development <strong>of</strong><br />
malaria vectors and thus enhanced dry<br />
season malaria transmission in western<br />
Kenya. On the other hand, the higher<br />
prevalence <strong>of</strong> malaria in the non-irrigated<br />
areas during the rainy season might be due to<br />
“draw-down” phenomenon in the irrigated<br />
areas whereby rapid drying and over-flowing<br />
<strong>of</strong> the irrigation structures would disturb the<br />
vector breeding sites and lead to decreased<br />
transmission. Bziava and Kruashvili (2002)<br />
had shown that periodic “draw-down” <strong>of</strong><br />
irrigation canals can be used as an ecological<br />
measure for malaria control.<br />
451
In irrigated areas farmers in older age groups<br />
will be at work early in the evenings when<br />
the prominent vector <strong>of</strong> the dry season will<br />
be active so these people will have a higher<br />
risk <strong>of</strong> infection. Higher malaria prevalence<br />
in older age groups in Ethiopia was also<br />
reported by Yohannes and Petros (1996) by<br />
observing the absence <strong>of</strong> apparent decrease<br />
in prevalence with increasing age in<br />
Nazareth, Ethiopia. Although Abose et al.<br />
(1998) reported that men in the area were<br />
affected more than women, considering that<br />
adult men are more likely to spend the<br />
evening hours outdoors working in their<br />
plantations and might receive more mosquito<br />
bites than women, the present study revealed<br />
no significant difference in malaria infection<br />
prevalence between the two sexes. This<br />
suggests lack <strong>of</strong> difference in the outdoor<br />
stay behavior <strong>of</strong> the two sexes and is<br />
consistent with the findings <strong>of</strong> Himeidan et<br />
al. (2005) in an irrigated area in Eastern<br />
Sudan.<br />
It is generally known that P. falciparum is<br />
dominant during the peak malaria<br />
transmission season in September and<br />
October, while P. vivax tends to dominate<br />
during the dry season in Ethiopia (Tulu,<br />
1993). The present findings from the nonirrigated<br />
areas confirm the above<br />
generalization for P. falciparum. Decreases<br />
in P. falciparum prevalence have been<br />
shown to allow the potency <strong>of</strong> other parasite<br />
species (Smith et al., 2001). The lower<br />
infection prevalence <strong>of</strong> P. vivax in irrigated<br />
areas during the dry season could be due to<br />
the fact that P. vivax is most prevalent in<br />
unstable transmission conditions (Gilles and<br />
Warrell, 1993) and hence its rate <strong>of</strong><br />
transmission may not be influenced by<br />
irrigation.<br />
Irrigation has created enhanced conditions<br />
for endemicity <strong>of</strong> falciparum malaria by<br />
changing its seasonal patterns. In irrigated<br />
areas, stable malaria transmission favors P.<br />
falciparum, whereas transmission <strong>of</strong> P. vivax<br />
was much lower as its transmission would be<br />
suppressed by P. falciparum (Smith et al.,<br />
2001). An irrigation-associated increase <strong>of</strong> P.<br />
falciparum infection prevalence during the<br />
dry season was also reported from India,<br />
where extensive irrigation had triggered P.<br />
falciparum dominated malaria in the virgin<br />
levees <strong>of</strong> Thar Desert in India (Tyagi, 2004).<br />
Although all factors that contribute to<br />
malaria risk are not fully understood (Robert<br />
et al., 2003), seasonality features, which<br />
could be altered in time through irrigation,<br />
availability <strong>of</strong> surface water, humidity and<br />
temperature are factors which affect vector<br />
abundance, longevity and parasite<br />
development inside vectors (Woyessa et al.,<br />
2004; Teklehaimanot et al., 2004). The study<br />
site (Ziway) has an average temperature <strong>of</strong><br />
20.7 0 C with the higher temperature occurring<br />
during dry season (Figure 4) (Teklehaimanot<br />
et al., 2004). At 20 0 C, 3 weeks are needed<br />
for P. falciparum development inside<br />
mosquitoes while P .vivax can develop in 16<br />
days (Gilles and Warrell, 1993; CDC, 2004).<br />
As the temperature increases, for instance at<br />
22 0 C, mosquito’s life cycle and P.<br />
falciparum development inside mosquitoes<br />
will be completed in 18 and 7.9 days,<br />
respectively (Teklehaimanot et al., 2004),<br />
and hence P. falciparum would be favored<br />
and could suppress other human Plasmodium<br />
species (Smith et al., 2001).<br />
Persistence in P. falciparum malaria may<br />
also be due to other more direct human<br />
activities (Singh et al., 2004). For example,<br />
P. falciparum has developed resistance to<br />
sulfadoxine pyrimethamine in most parts <strong>of</strong><br />
Ethiopia (Worku et al., 2005) and hence<br />
Coartem (Artemisin-based Combination<br />
Therapy) is now recommended as substitute<br />
therapy. However, the population in Ziway,<br />
during the study time, mainly uses<br />
sulfadoxine pyrimethamine (personal<br />
communication with health worker), as this<br />
is available on the market. Such patients are<br />
likely to serve as reservoirs <strong>of</strong> the parasite<br />
and may lead to augmented P. falciparum<br />
transmission in the dry season.<br />
Conclusions and Recommendations<br />
The following conclusions can be drawn<br />
from the present study on the impact <strong>of</strong> small<br />
scale irrigation on malaria transmission in<br />
Ziway. Significantly higher prevalence <strong>of</strong><br />
malaria was observed in irrigated areas as<br />
compared to the non-irrigated areas in<br />
Ziway. This suggests that the irrigated areas<br />
around Ziway are more favorable for<br />
breeding and activity <strong>of</strong> malaria vector<br />
mosquitoes, which enhances their longevity<br />
and facilitates completion <strong>of</strong> parasite life<br />
cycle for most months <strong>of</strong> the year. Malaria<br />
infection prevalence significantly increased<br />
at irrigated sites during the dry season when<br />
compared with the parallel scenario during<br />
the rainy season. This was exhibited in all<br />
age groups but, older age groups (greater<br />
452
than 15 years old) in irrigated areas had<br />
significantly higher infection prevalence<br />
during the dry season as compared to the<br />
same age group in the rainy season.<br />
To counter the increased malaria risk near<br />
developed water resources, there is a need<br />
for special attention to health issues in the<br />
implementation <strong>of</strong> ecological and<br />
environmental development programs.<br />
Simultaneously, awareness creation<br />
educational interventions must be undertaken<br />
so that the use <strong>of</strong> ecological control<br />
measures, mainly focusing on eliminating<br />
breeding sites and personal protection<br />
through the use <strong>of</strong> ITN are effectively<br />
practiced. In depth studies including<br />
comparisons between different agroecological<br />
zones are needed to assess the<br />
overall importance <strong>of</strong> irrigation-related<br />
epidemiology <strong>of</strong> malaria in Ethiopia.<br />
References<br />
Abose, T., Yeebiyo, Y., Olana, D.,<br />
Alamirew, D., Beyene, Y., Regassa, L.<br />
and Mengesha, (1998). Re-orientation<br />
and Definition <strong>of</strong> the Role <strong>of</strong> Malaria<br />
Vector Control in Ethiopia.<br />
(WHO/MAL/ 98.1085) WHO, Geneva,<br />
pp.1-37.<br />
Ashenafi, Madebo. (2003). Design and water<br />
management <strong>of</strong> irrigation systems to<br />
control breeding <strong>of</strong> Anopheles<br />
mosquitoes. Case study: Hara irrigation<br />
project, Arba Minch, Ethiopia. M.Sc.<br />
Thesis. Wageningen University,<br />
Wageningen. The Netherlands.<br />
Awulachew, S.B., Merrey, D.J., Kamara, A.<br />
B., Van koppen, B., Penning de Vries,<br />
F., Boelee, E. and Makombe, G.<br />
(2005). Experiences and opportunities<br />
for promoting small-scale/micro<br />
irrigation and rainwater harvesting for<br />
food security in Ethiopia. IWMI<br />
Working Paper 98.Colombo,<br />
<strong>International</strong> <strong>Water</strong> <strong>Management</strong><br />
<strong>Institute</strong>.<br />
Birrie, H., Gemetchu, T., Balcha, F., Bero,<br />
G., Balkew, M. and Girmay, M. (1997).<br />
Health risk assessment <strong>of</strong> planed<br />
irrigation scheme along the Genale<br />
River, South Ethiopia. Ethiop. J. Health<br />
Dev. 11: 229-233.<br />
Bziava, J. and Kruashvili, L. (2002).<br />
Ecological changes <strong>of</strong> malaria mosquito<br />
larvae at the rehabilitation <strong>of</strong> irrigation<br />
and drainage systems. In: Boelee, E.,<br />
Konradsen, F., Van der Hoek W, (eds).<br />
Malaria in irrigated agriculture: papers<br />
and abstracts for the SIMA Special<br />
Seminar at the ICID 18th <strong>International</strong><br />
Congress on Irrigation and Drainage,<br />
Montreal, 23 July 2002. IWMI Working<br />
Paper 47 SIMA Document 2, Colombo,<br />
Sri Lanka.<br />
Carlson, J.C., Byrd, B.D., Omlin, F.X.<br />
(2004) Field assessments in western<br />
Kenya link malaria vectors to<br />
environmentally disturbed habitats<br />
during the dry season. BMC Public<br />
Health 4: 33.<br />
Carrara ,C., Petrarca, V., Niang, M. and<br />
Coluzzi, M. (1990). Anopheles<br />
pharoensis and transmission <strong>of</strong><br />
Plasmodium falciparum in the Senegal<br />
River delta. West Africa. Med. Vet.<br />
Entomol. 4:421-424.<br />
Ghebreyesus, T., Haile, M., Witten, K.,<br />
Getachew, A., Yohannes, A., Yohannes,<br />
M., Teklehaimanot, H. and Lindsay,<br />
S.W. (1999). Incidence <strong>of</strong> malaria<br />
among children living near dams in<br />
northern Ethiopia: Community based<br />
incidence survey. BMJ. 319: 663-666.<br />
Gilles, H.M. and Warrell, D.A. (1993).<br />
Bruce- Chewatt’s Essential malariology.<br />
3rd edition. Arnold. London.<br />
Himeidan, Y. E., Elbashir, M.I., Rayah, E.A.<br />
and Adam, I. (2005). Epidemiology <strong>of</strong><br />
malaria in New Halfa, an irrigated area<br />
in eastern Sudan. Eastern. Mediter.<br />
Health J. 11 : 499-504.<br />
Kibret, S., Petros, B., Boelee, E., Tekie, H.<br />
(2008) Entomological studies on the<br />
impact <strong>of</strong> a small-scale irrigation scheme<br />
on malaria transmission around Zeway,<br />
Ethiopia. Paper presented at Symposium<br />
on Impacts <strong>of</strong> Irrigation on Poverty and<br />
Environment, Addis Ababa, Ethiopia,<br />
26-29 November 2007.<br />
Klinkenberg, E., McCall, P.J., Hastings,<br />
I.M., Wilson, M.D., Amerasinghe, F.P,<br />
and Donnelly, M.J.. (2005). Malaria and<br />
Irrigated Crops, Accra, Ghana. Emerg.<br />
Infect. Dis. 11:1290-1293.<br />
Ministry <strong>of</strong> <strong>Water</strong> Resources (MoWR).<br />
(2002). <strong>Water</strong> sector development<br />
programme 2002-2016, Volume II: Main<br />
Report. Ministry <strong>of</strong> <strong>Water</strong> Resource,<br />
Federal Democratic Republic <strong>of</strong><br />
Ethiopia, October 2002. Addis Ababa.<br />
Mukiama, T.K. and Mwangi, R.W. (1989).<br />
Seasonal population changes and malaria<br />
transmission potential <strong>of</strong> Anopheles<br />
453
pharoensis and the minor anopheline in<br />
Mwea Irrigation Scheme, Kenya. Acta<br />
Tropica 46: 181-189.<br />
Schlichtheerle, M., Wahlgren, M., Perlman,<br />
H. and Scherf, A. (2000). Methods in<br />
Malaria Research. Third edition<br />
MR4/ATCC, Manassas, Virginia.<br />
Seyoum, A., Balcha, F., Balkew, M., and<br />
Gebre-Michael, T. (2002). Impact <strong>of</strong><br />
cattle keeping on human biting rate <strong>of</strong><br />
anopheline mosquitoes and malaria<br />
transmission around Ziway, Ethiopia.<br />
East. Afr. Med. J. 79:485-490.<br />
Smith, T., Genton, B., Baea, K., Gibson, N.,<br />
Narara, A. and Alpers, P. (2001).<br />
Prospective risk <strong>of</strong> morbidity in relation<br />
to malaria infection in an area <strong>of</strong> high<br />
endemicity <strong>of</strong> multiple species <strong>of</strong><br />
Plasmodium. Am. J. Trop. Med. Hyg. 64<br />
: 262–267.<br />
Teklehaimanot, H., Lipsitch, M.,<br />
Teklehaimanot, A. and Schwartz, J.<br />
(2004). Weather-based prediction <strong>of</strong><br />
Plasmodium falciparum malaria in<br />
epidemic-prone regions <strong>of</strong> Ethiopia I.<br />
Patterns <strong>of</strong> lagged weather effects<br />
reflects biological mechanisms. Malar J.<br />
3: Published on line [http:<br />
//www.pubmedcentral.nih.gov/redirect3.<br />
cgi.].<br />
Tulu, A. (1993). Malaria In: Kloos, H and<br />
Zein, Z.A (Eds).The Ecology <strong>of</strong> Health<br />
and Disease in Ethiopia, pp 341-352,<br />
.West view Press, Boulder.<br />
Tyagi, K. B. (2004). A review <strong>of</strong> the<br />
emergence <strong>of</strong> Plasmodium falciparum<br />
dominated malaria in irrigated areas <strong>of</strong><br />
the Thar Desert, India. Acta Trop. 89:<br />
227-239.<br />
WHO. (2005). Roll back malaria report.<br />
Ethiopia, country pr<strong>of</strong>ile. 6 pp.<br />
Worku, S., Girma, T. and Shiferaw, Y.<br />
(2005). Therapeutic efficacy <strong>of</strong><br />
Sulfadoxine/ Pyrimethamine in the<br />
treatment <strong>of</strong> uncomplicated malaria in<br />
children. Ethiop. J. Health Dev. 19:11-<br />
15.<br />
Woyessa, A., Gebre- Michael, T., Ali, A. and<br />
Kebede, D. (2004). An indigenous<br />
malaria transmission in the outskirts <strong>of</strong><br />
Addis Ababa, Akaki Town and its<br />
environs. Ethiop. J. Health Dev. 18: 2-7.<br />
Yohannes, M., Haile, M., Ghebreyesus, T.<br />
A., Witten, K.H., Getachew, A., Byass,<br />
P., Lindsay, S.W. (2005). Can source<br />
reduction <strong>of</strong> mosquito larval habitat<br />
reduce malaria transmission in Tigray,<br />
Ethiopia? Tropical Medicine and<br />
<strong>International</strong> Health 10:1274-1285.<br />
Yohannes, M. and Petros, B. (1996). Urban<br />
malaria in Nazareth, Ethiopia:<br />
parasitological studies. Ethiopian<br />
Medical Journal 34: 83-91.<br />
454
Manuals<br />
How to enhance water efficiency?<br />
Minimise excess water use through implementation <strong>of</strong> efficient irrigation methods, effective<br />
irrigation scheduling, and soil moisture determination and retention. The following practices are<br />
designed to minimize water losses from evaporation, deep percolation and run<strong>of</strong>f:<br />
• Develop a crop demand-dependent irrigation schedule.<br />
• Determine soil type characteristics to estimate effective irrigation application rates, durations<br />
and frequencies. For instance, sandy soils may require more frequent but shorter duration<br />
applications.<br />
• Till the land along the topographic contours to reduce run<strong>of</strong>f.<br />
• <strong>Water</strong> early in the morning or evening to reduce evaporation losses.<br />
• Collect stormwater and irrigation run<strong>of</strong>f in a series <strong>of</strong> ditches or drains that return the excess water to a<br />
storage pond, if appropriate and necessary.<br />
• Maintain all parts <strong>of</strong> the irrigation system, routinely inspect all water lines, tanks, valves and pumps for leaks.<br />
Keep replacement and repair parts on hand.<br />
How to prevent soil erosion?<br />
Soil erosion by water depends on:<br />
• the slope: steep, sloping fields are more exposed to erosion;<br />
• the soil structure: light soils are more sensitive to erosion;<br />
• the volume or flow rate <strong>of</strong> surface run<strong>of</strong>f water: larger or rapid flows induce<br />
more erosion.<br />
• the vegetation cover <strong>of</strong> the soil.<br />
Erosion is usually heaviest during the early part <strong>of</strong> irrigation, especially when<br />
irrigating on slopes. The dry surface soil, sometimes loosened by cultivation,<br />
is easily removed by flowing water.<br />
After the first irrigation, the soil is moist and settles down, so erosion is reduced. Newly irrigated areas are more<br />
sensitive to erosion, especially in their early stages.<br />
There are two main types <strong>of</strong> erosion caused by water:<br />
• Sheet erosion - even removal <strong>of</strong> a very thin layer or "sheet" <strong>of</strong> topsoil from sloping land. It occurs over large<br />
areas <strong>of</strong> land and causes most <strong>of</strong> the soil losses.<br />
• Gully erosion - removal <strong>of</strong> soil by a concentrated water flow, large enough to form channels or gullies. These<br />
gullies carry water during heavy rain or irrigation and gradually become wider and deeper.<br />
Therefore pay attention to use low flow velocities when applying water, especially at the beginning <strong>of</strong> the crop<br />
vegetation period and at higher terrain slopes.<br />
KEYS FOR SUCCESSFUL<br />
IIRRIIGAT IION IIN ETHIIOP IIA<br />
Why irrigation?<br />
Irrigation is one <strong>of</strong> many important initiatives that can <strong>of</strong>fer<br />
opportunities for change. Good access to a whole range <strong>of</strong> agricultural<br />
technical skills and inputs is needed if the benefits are to be<br />
maximised.<br />
• Higher agricultural yields<br />
• Wider variety <strong>of</strong> crops in wet and dry seasons<br />
• Longer growing seasons, multi-harvesting<br />
• Increase agricultural production and enhance food security<br />
• Poverty reduction<br />
The amount <strong>of</strong> water used by the plants depends on the crop type and<br />
will rise with evapotranspiration as a result <strong>of</strong>:<br />
• High temperatures<br />
• High wind speed<br />
• Low humidity<br />
• High intensity <strong>of</strong> sunlight<br />
Which water resources are available and can be used?<br />
• Rainwater harvesting (tanks or ponds)<br />
• Streams, rivers, lakes or pools<br />
• Shallow or deep groundwater resources, springs<br />
How to prevent water related disease hazards?<br />
Irrigation alters the environment by creating conditions<br />
suitable for parasitic vectors, which then spread disease<br />
among producers and the wider population. Irrigation can<br />
in general increase the risk <strong>of</strong> water related diseases, like<br />
malaria etc. Especially stagnant irrigation water can serve<br />
as breeding site for mosquitoes.<br />
Therefore reduce mosquito breeding sites by avoiding water stagnation on irrigation basins, cover open water<br />
surfaces <strong>of</strong> storage ponds or tanks and apply efficient drainage measures.<br />
This leaflet was prepared in the framework <strong>of</strong> the collaborative project “Impact <strong>of</strong> Irrigation on Poverty and<br />
Environment in Ethiopia” (2004-2007).<br />
Authors: M. Schönerklee, R. Spendlingwimmer, W. Loiskandl, D. Ruffeis<br />
455
Consider the following key issues and natural conditions when using<br />
irrigation for agriculture<br />
Why is water quality important?<br />
The suitability <strong>of</strong> water for irrigation depends on the amount and the type <strong>of</strong> salt the<br />
irrigation water contains. A high salt content <strong>of</strong> irrigation water leads to salinization<br />
<strong>of</strong> soils.<br />
• Salinity – amount <strong>of</strong> salt contained in the water (“salt concentrations”)<br />
o Electric conductivity<br />
o Total dissolved solids<br />
The salinity <strong>of</strong> water is easily measured by means <strong>of</strong> an electrical device, it is then<br />
expressed in terms <strong>of</strong> electrical conductivity.<br />
The higher the salt concentration <strong>of</strong> the irrigation water, the greater the risk <strong>of</strong> salinization.<br />
Which irrigation method is appropriate?<br />
Each irrigation method has advantages and disadvantages that should be taken into consideration when choosing<br />
the most suitable irrigation method. The main factors influencing the selection <strong>of</strong> the type <strong>of</strong> irrigation are:<br />
• Natural conditions (soil type, slope, climte, water quality, water quantity)<br />
• Type <strong>of</strong> crops to be grown<br />
<strong>Water</strong>ing-Can/Bucket irrigation<br />
This water-efficient method is appropriate for small plots <strong>of</strong> land, such as vegetable<br />
gardens, which are close to the water source.<br />
Salt concentration Electric conductivity Soil salinization risk Restrictions on use<br />
Less than 0.5 g/l Less than 800 µS/cm No risk No restriction on its use<br />
0.5 – 2 g/l 800 – 3100 µS/cm Slight to moderate risk<br />
Should be used with appropriate water<br />
management practices<br />
More than 2 g/l<br />
More than 3100<br />
Not generally advised for use unless<br />
High risk<br />
µS/cm<br />
consulted with specialists<br />
If possible, a full water analysis should be carried out by an analytical laboratory to assess potential impacts on<br />
the infiltration rate and soil:<br />
• Major mineral compounds (Calcium, Magnesium, Sodium, Potassium, Chloride, Sulfate, Nitrate, Carbonate,<br />
Boron, Fluoride)<br />
• Calculation <strong>of</strong> Sodium Adsorption Ratio (SAR)<br />
Furrow irrigation<br />
Furrows are narrow ditches dug on the field between the<br />
rows <strong>of</strong> crops. The water runs along them as it moves<br />
down the slope <strong>of</strong> the field and is gradually absorbed into<br />
the bottom and the sides <strong>of</strong> the furrows wetting the soil.<br />
Furrows are generally used on farms with large uniform<br />
fields where long furrows can be formed at regular intervals<br />
between the crop rows.<br />
How to conserve the soil fertility and avoid salinization?<br />
The irrigation water will move much faster through a soil with large pores (sandy soil) than through a heavy clay<br />
soil with smaller pores. Soil structure influences how easily water and air can move through the soil (permeability)<br />
and the penetration <strong>of</strong> roots.<br />
The soil structure can be improved by good practices such as crop rotation.<br />
Cycles <strong>of</strong> wetting and drying improve soil structure whereas cultivation <strong>of</strong> very<br />
wet or very dry soils can destroy the structure. Adequate soil cultivation like<br />
tilling is also required to prevent water-logging problems.<br />
After irrigation, the water added to the soil is used by the crop or evaporates<br />
directly from the moist soil. The salt, however, is left behind in the soil. If not<br />
removed, it accumulates in the soil; this process is called salinization. Soils that<br />
contain a high amount <strong>of</strong> salt are harmful to plants and therefore reduce soil<br />
fertility and agricultural yields.<br />
Furthermore the presence <strong>of</strong> salts, especially in heavy clay soils, has the effect<br />
<strong>of</strong> breaking down the soil structure and therefore reducing the soil permeability<br />
to air and water.<br />
Why is drainage needed?<br />
During irrigation the water infiltrates into the soil and is stored in its pores.<br />
When all the pores are filled with water, the soil is said to be saturated and no<br />
more water can be absorbed. The water flowing from the saturated soil<br />
downward to deeper layers, feeds the groundwater reservoir. As a result, the<br />
groundwater level rises. Following heavy rainfall or continuous over-irrigation,<br />
water-logging may occur which means that the groundwater table may even<br />
reach and saturate part <strong>of</strong> the root zone. If this situation lasts too long, the<br />
plants may suffer.<br />
In order to prevent these negative effects, drainage measures are necessary. Excess surface water is removed<br />
through shallow open drains. Excess groundwater is removed through deep open drains or underground pipes.<br />
Leaching <strong>of</strong> salts by sufficient percolation water can only be achieved if an efficient drainage system exists and<br />
water-logging can be avoided.<br />
Basin irrigation<br />
Basins are horizontal, flat plots <strong>of</strong> land,<br />
surrounded by small dykes or bunds which are<br />
totally flooded during irrigation. Flooding should be<br />
carried out rapidly so that water spreads quickly<br />
across the whole basin and an even water<br />
distribution can be achieved.<br />
<strong>Water</strong> is normally brought to the basin in earth<br />
channels using gravity.<br />
Where water has to be pumped from the water source it should be pumped to the highest point and then be<br />
distributed in channels by gravity.<br />
Drip irrigation<br />
Sub-surface irrigation<br />
<strong>Water</strong> is supplied to the plants from below the surface by controlling the<br />
level <strong>of</strong> naturally occurring shallow groundwater. The water is made to flow<br />
into open channels where the level is controlled by earth banks. However,<br />
a regular drawing down <strong>of</strong> the water level is essential to avoid waterlogging<br />
<strong>of</strong> the plots and crop damage.<br />
In drip irrigation the water is led to the field through a<br />
pipe system. The distribution system within the field<br />
consists <strong>of</strong> tubes perforated at regular intervals. In<br />
this way water is slowly and directly supplied drop by<br />
drop to the plants.<br />
Drip irrigation is most efficient for irrigating individual<br />
plants such as trees or widely spaced row crops like<br />
vegetables.<br />
456
Discussion on Theme 4: Environmental and Health Impact <strong>of</strong><br />
Irrigation<br />
Chair: Dr. Akissa Bahri<br />
Rapporture: Gayathri Jayasinghe<br />
The chairman for this session introduced the theme and the floor was opened for<br />
questions, comments and suggestions.<br />
Questions and Discussions<br />
4.1 Intervention in the development <strong>of</strong><br />
small scale irrigation development<br />
will cause some environmental<br />
impact but their impact may not be<br />
significant. Is there a limit (lower)<br />
for which EIA study may not be<br />
required in view <strong>of</strong> size?<br />
Ans: The impact is similar, thus<br />
there is no difference between<br />
schemes in terms <strong>of</strong> size. Focus<br />
should be made on strategic<br />
approach and the assessment<br />
should be made using simple<br />
questionnaires that could be used<br />
by the communities or NGOs. The<br />
cumulative effect <strong>of</strong> a number <strong>of</strong><br />
small scale schemes should be<br />
considered rather than isolated<br />
individual schemes.<br />
Comment: The issue <strong>of</strong><br />
environmental impact should be<br />
seen by balancing the positives and<br />
the negatives without affecting the<br />
resource base. Using inputs like<br />
water will be positively<br />
influencing the environment by<br />
producing more food per area!<br />
4.2 In the two large scale irrigation<br />
schemes how come that NO 3 -<br />
leakage is not monitored? Notable<br />
effect is expected on downstream<br />
users.<br />
Is it not possible that the soil<br />
organic matter accumulation could<br />
be expected to be stable, given the<br />
vegetation cover from the perennial<br />
crop and good management (in the<br />
sugar cane schemes)?<br />
4.3 Whether there is irrigation or nonirrigation,<br />
there is malaria in the<br />
prone areas. Instead <strong>of</strong> talking<br />
about irrigation as causing malaria<br />
spread it would be better to<br />
associate this with improper<br />
management <strong>of</strong> irrigation water.<br />
What is your comment on this?<br />
Ans. Yes, it is bad management <strong>of</strong><br />
water that causes leakages in the<br />
systems, but still the problem is<br />
due to the introduction <strong>of</strong> irrigation<br />
4.4 The papers from Solomon and<br />
Kibret are <strong>of</strong> the same supervisor<br />
and the same area <strong>of</strong> investigation.<br />
The facts were known like when<br />
there was incidence, type <strong>of</strong><br />
malaria occurance, so<br />
i) what were the big<br />
differences between the two?<br />
ii)<br />
What was the significance <strong>of</strong><br />
this study?<br />
iii) What idea are you<br />
forwarding to policy makers<br />
and the new findings drawn<br />
from these studies?<br />
4.5 The comment about watershed<br />
management around Fincha where<br />
they spend 2 million Birr per year;<br />
- where is the soil erosion going<br />
on? Is it in the sugar estate or<br />
outside?<br />
- What would be the picture <strong>of</strong><br />
Fincha if there is no<br />
intervention in the form <strong>of</strong><br />
sugar estate?<br />
Irrigation schemes are found in the<br />
Malaria belt <strong>of</strong> Ethiopia. It could<br />
have been better to compare the<br />
before and after irrigation<br />
development situation<br />
Comment: Put irrigation water<br />
management as one <strong>of</strong> the<br />
preventive measures to be<br />
recommended in the research<br />
undertaking.<br />
457
4.6 What are the environmental<br />
impacts (negative) or concerns<br />
related to Wonji/Shoa sugar estate<br />
given the sugar estate is working<br />
for the last 50 years or more?<br />
4.7 What is the objective <strong>of</strong> the EIA<br />
on Fincha and Wonji since this<br />
should have been done before the<br />
project is implemented? If, what<br />
is presented is environmental<br />
monitoring and evaluation how<br />
can it be carried out in the absence<br />
<strong>of</strong> baseline data and initial EIA?<br />
How do you assess the impact <strong>of</strong><br />
Koga before the construction is<br />
completed? There is integrated<br />
watershed management being<br />
done. The downstream impact<br />
indicated is not based on concrete<br />
data and research.<br />
Ans: What has been done is<br />
analysis (status quo) <strong>of</strong> existing<br />
projects to see the impact <strong>of</strong><br />
irrigation on environment.<br />
The watershed management project<br />
lags behind the dam. Downstream<br />
flooding <strong>of</strong> the dam is not<br />
considered.<br />
Comment: Environment impact in<br />
Koga is an issue <strong>of</strong> sequencing. It<br />
is a first measure which integrates<br />
watershed management, irrigation,<br />
and storage. Some are delayed<br />
due to capacity, but those<br />
measures are yet to be<br />
implemented and should not be<br />
perceived as failures.<br />
4.8 Paper on Wonji and Fincha:<br />
When we say there was no<br />
database, does it mean were/are no<br />
project appraisal documents when<br />
the estates were developed?<br />
Paper on “key success factors…..”<br />
Clarification: does this mean that<br />
such knowledge/practice(s) is not<br />
known here in Ethiopia?<br />
The statement that health impact<br />
assessment should consider not<br />
only diseases, but also health<br />
improvement from improved food<br />
security and economic status. Is it<br />
possible to integrate the two<br />
aspects?<br />
4.9 What is the optimum investment<br />
cost per hectare for SSI in<br />
Ethiopia?<br />
What is the contribution <strong>of</strong><br />
investment on flower industries to<br />
the national economy? (they also<br />
use drip irrigation)<br />
How are the riparian and<br />
appropriative laws being practiced<br />
in the context <strong>of</strong> the project<br />
Comment:<br />
Although<br />
environmental issue is a common<br />
concern that should be looked at<br />
for ensuring sustainability, one<br />
needs to be clear about whether or<br />
not we need to carry out EIA<br />
before and after interventions.<br />
4.10 Irrigation and Malaria<br />
transmission in Ziway area:<br />
People living near the lake are<br />
anyway more exposed than those<br />
who are living away from the<br />
lake, so how is it possible to<br />
conclude that irrigation is<br />
responsible rather than the lake?<br />
Ans: This condition was taken into<br />
consideration and the study<br />
covered villages away from the<br />
lake in 4-5km distance<br />
Brief discussion was made with the<br />
presenter and satisfactory answers<br />
were given.<br />
4.11 From the indicators <strong>of</strong><br />
environmental resilience, in these<br />
farms, Fincha and Wonji, lots <strong>of</strong><br />
fertilizers are used. Can expect<br />
nitrogen leakage impact on<br />
downstream users. Has this been<br />
investigated.<br />
Ans: Observed increase in Nitrogen<br />
in the water.<br />
One slide shows a decline in<br />
organic matter in the soil. I<br />
thought in these intensive systems,<br />
because <strong>of</strong> the year round crop<br />
cover one would expect to see<br />
458
increased organic matter in the<br />
soil.<br />
Ans: Problem could be that it is a<br />
monoculture. But need to look<br />
into this.<br />
4.12 Not clear about the objective <strong>of</strong><br />
the EIA. My understanding is that<br />
EHIA is done prior to investment.<br />
Fincha and Wonji are very old. So<br />
is what you are doing really env<br />
monitoring and evaluation? If so,<br />
are you doing this because pre<br />
investment EIA for these schemes<br />
are not available?<br />
4.13 Not having baseline data is<br />
common. Is there no project<br />
appraisal documents? If we don’t<br />
have appraisal documents does it<br />
mean we cannot do an impact<br />
assessment?<br />
Ans: True, but what we did was<br />
trying to assess the status quo <strong>of</strong><br />
impact <strong>of</strong> existing irrigation<br />
schemes.<br />
4.14 Koga, is the first project <strong>of</strong> large<br />
scale scheme for smallholder<br />
irrigation. Scheme under mid<br />
construction. SO how did you<br />
reach the conclusion that there are<br />
environmental impacts?<br />
One aspect <strong>of</strong> Koga is watershed<br />
management. And Environmental<br />
authority is a member <strong>of</strong> the<br />
steering committee.<br />
Ans: EIA was conducted but this<br />
didn’t consider downstream<br />
impacts <strong>of</strong> change in flow regime.<br />
Possible impact on fisheries. 2.<br />
EIA made recommendations<br />
about a lot <strong>of</strong> things that should<br />
be done before the dam is<br />
constructed. Eg water shed<br />
conservation work that should<br />
have been done before the dam is<br />
constructed. Although these have<br />
commenced, not progressed as<br />
planned. The organization that is<br />
supposed to make sure the<br />
recommendations are carried out<br />
is not pushing hard enough to<br />
make sure these are implemented.<br />
4.15 It is a known fact that in any<br />
intervention in irrigation there is<br />
env impact. Must be some<br />
relation to size <strong>of</strong> sheme and<br />
delay <strong>of</strong> impact. Is there any<br />
conditions where EIA is not<br />
necessary?<br />
Ans: In-field impact is the same<br />
regardless <strong>of</strong> size <strong>of</strong> scheme, but<br />
other kinds <strong>of</strong> impacts may have a<br />
delayed effect, eg fertilizer use.<br />
For small scale irrigation, total<br />
amout <strong>of</strong> water abstracted from<br />
the water source can have an<br />
impact.<br />
Ans: Small schemes do have<br />
impacts. Yes, economically not<br />
feasible to make EIA for every<br />
small scheme. For small<br />
schemens recommendations is to<br />
do strategic EIA to see what the<br />
impact would be <strong>of</strong> upscaling.<br />
Also for a small scheme rapid<br />
assessment methods through<br />
questionnaires…etc may be more<br />
appropriate rather than a full scale<br />
EIA.<br />
Ans: has the experience that in<br />
the regions, consultants have to<br />
include EIA. They are there but<br />
content is sometimes weak.<br />
Ans: don’t ignore the cumulative<br />
effects.<br />
4.16 Although I personally believe in<br />
EIA. I have difficulty in<br />
understanding if this EIA can be<br />
done before implementation.<br />
Need basic understanding <strong>of</strong> EIA.<br />
Ans: EIA is a means <strong>of</strong> preventing<br />
failure rather than costly repairs.<br />
Learning from past lessons rather<br />
than re-inventing the wheel.<br />
4.17 Assessment <strong>of</strong> the health and<br />
Env/: we tend to be biased by<br />
looking at impact in terms <strong>of</strong><br />
diseases. How can we balance<br />
the negative <strong>of</strong> the diseases vis a<br />
vis the food security impact on<br />
health.<br />
459
Ans: Absolutely true. Looking at<br />
+ve and _ve is the best. What<br />
happens now is that assumptions<br />
are made about +ve impacts but<br />
these are not quantified. Useful<br />
as far as possible if impacts are<br />
quantified in a way that they can<br />
be validated and trade-<strong>of</strong>fs<br />
assessed.<br />
Ans: Koga is the first experience<br />
in the country to integrate<br />
watershed management to reduce<br />
sedimentation in the dam. Not<br />
complete ignorance but delay in<br />
implementation <strong>of</strong> certain<br />
components due to complex<br />
problems. In Ethiopia it is not<br />
water development that has<br />
contributed to degredation but the<br />
absence <strong>of</strong> it. Important to<br />
reverse this.<br />
Ans: the koga study shows<br />
lessons on how to follow up on<br />
EIA s that are done.<br />
Comment: It seems there is a<br />
North South conflict <strong>of</strong> priorities.<br />
? Advisors from WB “promote<br />
eco-agriculture” for example. Is<br />
this really appropriate for<br />
Ethiopia?<br />
4.18 Skeptical <strong>of</strong> the results because<br />
villages near the lake are more<br />
susceptible than villages farther<br />
away. How did you attribute the<br />
high malaria to irrigation rather<br />
than the lake? One alternative is<br />
proper water management to<br />
prevent malaria. Advise<br />
inclusion <strong>of</strong> this point in the<br />
recommendations.<br />
Ans: Both control and study<br />
villages were at the same distance<br />
from the lake and 4-5 km away<br />
which is more than the average<br />
flight range <strong>of</strong> the arabiensis<br />
vector.<br />
4.19 <strong>Water</strong>shed management is<br />
practiced by Fincha with a<br />
spending <strong>of</strong> about 2m per year.<br />
Where does the soil erosion<br />
actually occure? Is within the<br />
sugar estate or around the area<br />
where there is deforestation?<br />
What would happen if the sugar<br />
estate was not there? Generally,<br />
unplanned interventions can have<br />
devastating effect on ecosystems.<br />
For example, in lake Tana where<br />
we thought there were large areas<br />
<strong>of</strong> wetlands and actually<br />
intensively cultivated. So,<br />
whether there is a scheme or not,<br />
degradation is going to happen<br />
anyway. So it is better that<br />
studies compare impacts <strong>of</strong><br />
planned vs unplanned use.<br />
Comment: Most <strong>of</strong> our irrigation<br />
schemes are in Malaria belt.<br />
Better to compare before-after<br />
situation.<br />
4.20 Is it irrigation or type <strong>of</strong> crop that<br />
is related to increased Malaria?<br />
There is a recent discussion on<br />
maize contributing to the increase<br />
<strong>of</strong> Malaria. Can change in crop<br />
management mitigate malaria?<br />
What are the policy<br />
recommendations we can make?<br />
Comment: With or without<br />
irrigation there is malaria. Try to<br />
find out the impact <strong>of</strong> quality <strong>of</strong><br />
management <strong>of</strong> scheme on<br />
Malaria. It is preferable to say<br />
that bad water management<br />
causes fertile ground for malaria<br />
breeding. Effective irrigation will<br />
not produce impounding,<br />
seepage, etc so relating to<br />
management sounds better.<br />
Ans: Proximity <strong>of</strong> the study<br />
villages to lake zeway 4-5km a<br />
little beyond a common flight<br />
range <strong>of</strong> arabiensis. Both villages<br />
are equi-distant from lake. There<br />
are also “buffer” villages between<br />
Ziway and the study villages that<br />
deflect vectors from the study<br />
villages.<br />
Canal leakage and over-irrigation<br />
has been observed in the study<br />
sites as ‘bad’ management.<br />
460
Group discussion and findings<br />
After the presentation <strong>of</strong> the four themes i.e. statues quo analysis, characterization and assessment<br />
<strong>of</strong> performance <strong>of</strong> irrigation in Ethiopia; irrigation impact on poverty and economy; irrigation<br />
institutions and support services; and environmental and health impacts <strong>of</strong> irrigation development.<br />
Participants were sub divided into four groups (working group I to IV) according to the above<br />
themes. The outcome <strong>of</strong> their discussions is shown in the group work presentations as indicated in<br />
the home page.<br />
Way Forward and Synthesis Plan<br />
Dr. Deboorah Bossio made a summary <strong>of</strong> the symposium and discussion points pertinent for the<br />
way forward. Her presentation is included in the paper presentations shown in the home page.<br />
Intensive discussions and recommendations were provided by the participants based on the<br />
following two leading questions<br />
• What impacts would we like to have?<br />
• Who could make it happen?<br />
Exhibition<br />
Under the poster exhibition displays <strong>of</strong> posters related to the project and supplementing some <strong>of</strong><br />
the papers presented in the symposium by the respective authors and the overall description <strong>of</strong> the<br />
project. A total <strong>of</strong> 11 posters were exhibited and demonstrated by authors as shown below.<br />
<strong>Table</strong>: Posters presented<br />
Name Poster title Institution<br />
Abdu Beshir Analysis <strong>of</strong> irrigation systems using comparative<br />
performance indicators: A case study <strong>of</strong> two large<br />
scale irrigation systems in the upper Awash River<br />
Basin<br />
Oromia <strong>Water</strong> Works<br />
Design Enterprise<br />
Abonesh Tesfaye The Impact <strong>of</strong> Small Scale Irrigation on Household MoWR<br />
Food security:<br />
The Case <strong>of</strong> Godino and Filtino Irrigation Schemes<br />
in<br />
Ada Liben District<br />
Ahmed Amdeyehun GIS and Remote sensing Integrated Environmental<br />
Impact Assessment <strong>of</strong> Irrigation Project in Finchaa<br />
Valley<br />
Aster Yilma Irrigation potential <strong>of</strong> Ethiopia IWMI-NBEA<br />
Belete Bantero Hare River Irrigation close to Arba Minch has World Vision<br />
become a way out for Many Households from<br />
Poverty to Prosperity<br />
Dr. Seleshi Bekele Impact <strong>of</strong> Irrigation on Poverty and Environment: IWMI-NBEA<br />
Research Project<br />
Yihenew<br />
Malaria Transmission In Ziway, Eastern Oromia<br />
Zone, As Related To Irrigation Development<br />
Field Parameter Evaluation to Support<br />
Environmental Impact Analysis <strong>of</strong> Irrigation in<br />
Ethiopia<br />
Wallner K. a<br />
a Department <strong>of</strong> <strong>Water</strong>,<br />
Atmosphere and<br />
Environment, <strong>Institute</strong> <strong>of</strong><br />
Hydraulics and Rural<br />
<strong>Water</strong> <strong>Management</strong>,<br />
BOKU, Austria<br />
Judit Christine Impact <strong>of</strong> irrigation on livelihood and food security University <strong>of</strong> Natural<br />
461
in the modern Hare river irrigation scheme in<br />
Southern Ethiopia<br />
Resources and Applied<br />
Life Sciences, Vienna-<br />
Austria<br />
Closing<br />
The symposium was <strong>of</strong>ficially closed by Ato Abara Mekonnen, Chief Engineer <strong>of</strong> the Ministry <strong>of</strong><br />
<strong>Water</strong> Resources. In his closing remark he emphesized the importance and value that this research<br />
will add to irrigation development in Ethiopia.<br />
462
List <strong>of</strong> Participants<br />
Abdu Beshir<br />
<strong>Water</strong> Resource Engineer<br />
Ministry <strong>of</strong> <strong>Water</strong> Resource<br />
P.O.Box 5744<br />
A.A, Ethiopia<br />
Tel: 0911-19 05 59<br />
E-mail: abdubeshir@yahoo.com<br />
Abera Girma Abebe<br />
Wonji-Shoa Sugar Factory<br />
P.O.Box 51<br />
Wonji, Ethiopia<br />
Tel: 0911387216<br />
E-mail: aberagirmaabebe@yahoo.com<br />
Abera Mekonnen<br />
Ministry <strong>of</strong> <strong>Water</strong> Resources<br />
P.O.Box 5744<br />
A.A, Ethiopia<br />
Tel: 0116-62 55 06<br />
E-mail: abera_ermy@yahoo.com<br />
Abonesh Tesfaye (Economist)<br />
Ministry <strong>of</strong> <strong>Water</strong> Resources<br />
P.O.Box 11490<br />
A.A, Ethiopia<br />
Tel: 0911-19 15 58<br />
E-mail: abuye_t@yahoo.com<br />
Abraham Asmare (Manager)<br />
WVE<br />
P.O.Box; 3330<br />
A.A, Ethiopia<br />
Tel: 0116-29 33 50<br />
E-mail: abreham_asmare@wvi.org<br />
Abraham Woldemichael<br />
Hawassa University<br />
P.O.Box; 5<br />
Hawassa, Ethiopia<br />
Tel; 0916-82 36 43<br />
Fax 046-220 54 21<br />
E-mail: abrhamwm@yahoo.co.uk<br />
Ademe Teferi (Head <strong>of</strong> Planning and<br />
programming)<br />
Benishangul Gumuze BoARD<br />
P.O.Box; 30<br />
Assossa, Ethiopia<br />
Tel; 0911-96 89 87<br />
Fax 057-775 07 26<br />
Adinew Abate<br />
Kobo Girana Valley Dev. Program <strong>of</strong>fice<br />
P.O.Box; 182<br />
Woldia, Ethiopia<br />
Tel; 033-334 00 89, 0918-34 01 72<br />
Fax 033-334 04 74<br />
E-mail: kgvdp@ethionet.et<br />
Afework G/Kidan(Irrigation Eng. Dept.<br />
Head)<br />
Fincha Sugar Factory<br />
P.O.Box; 5734<br />
Fincha(Wolega), Ethiopia<br />
Tel: 057-664 10, 0911-39 70 63<br />
Alemayehu Mengiste (Managing<br />
Director)<br />
Concert Engineering<br />
P.O.Box; 7553<br />
A.A, Ethiopia<br />
Tel; 0116-63 92 44, 0116-63 92 45<br />
E-mail: coneng@ethionet.et<br />
Alessandro Dinucci<br />
WFP<br />
A.A, Ethiopia<br />
Tel; 0911-75 43 62<br />
E-mail: abessandro.dinucci@wfp.org<br />
Amhed Amdihun<br />
AAU<br />
A.A, Ethiopia<br />
Tel; 0911-48 47 21<br />
E-mail: aamdihun@yahoo.com<br />
Andegna Shinale (Office head)<br />
Arba Mich District BoARD<br />
P.O.Box:24<br />
463
Arba Minch, Ethiopia<br />
Tel; 046-881-01 22, 0911-95 56 28<br />
Fax 046-881-01 43<br />
Asfaw Negassa (Dr.)<br />
ILRI<br />
P.O.Box:5689<br />
A.A, Ethiopia<br />
Tel: 0911-74 06 99<br />
E-mail:a.negassa@cgiar.org<br />
Asmelash Birhane<br />
MU<br />
Mekelle,Ethiopia<br />
Tel 0914-72 65 02 0344-40 93 04<br />
E-mail:asmieg@yahoo.com<br />
Asnake Abera<br />
Food Security Expert<br />
EC Deligatgion to Ethiopia<br />
A.A, Ethiopia<br />
Tel 0116-61 25 11<br />
E-mail asnake.abera@ec.europa.eu<br />
Asrat Melaku<br />
ORDA 132<br />
Bahir Dar, Ethiopia<br />
E-mail orda@ethionet.et<br />
Aster Denekew Ms<br />
P.O.Box IWMI 5689<br />
A.A, Ethiopia<br />
Tel 0116-17 21 94, 0911-60 19 94<br />
E-mail: a.denekew@cgiar.org<br />
Ayalew Abate<br />
<strong>Water</strong> Bureau Engineering<br />
P.O.Box 5673<br />
A.A, Ethiopia<br />
Tel 0116-63 70 34, 0911-46 54 80,<br />
0116-61 07-10<br />
E-mail: ayalewabget@yahoo.com<br />
Bahri Akissa<br />
Director IWMI<br />
Accra, Ghana E-mail a.bahri@cgiar.org<br />
Belay Bancha<br />
W.S.S study & design team leader<br />
Benishangul Gumz Region <strong>Water</strong>, Mine<br />
& Energy Resources Dev't Bureau<br />
P.O.Box 51, Asossa, Ethiopia<br />
Tel 0577-75 22 50, 0913-25 80 64,<br />
0577-75 00 60<br />
E-mail wegayehubelay@yahoo.com<br />
Belay Demissie<br />
Agricultural Economist<br />
USAID<br />
P.O.Box 1014<br />
A.A, Ethiopia<br />
Tel 0115-51 00 88<br />
E-mail: bdemissie@usaid.gov<br />
Belete Bantero<br />
UN-Industrial Dev't Organization<br />
P.O.Box 23248<br />
A.A, Ethiopia<br />
Tel 0115-54 45 87, 0911-86 16 95<br />
E-mail: bele2080@yahoo.com<br />
Benhard Meier<br />
Regional Director<br />
German Agro Action<br />
P.O.Box 1866<br />
A.A, Ethiopia<br />
Tel 0116-62 47 65, 0116-62 47 31<br />
E-mail: gaa.eth@ethionet.et<br />
Berhanu Adinew<br />
EEA<br />
P.O.Box 34282<br />
A.A, Ethiopia<br />
Tel 0114-16 21 21, 0114-16 09 67<br />
E-mail: berhanuad@yahoo.com<br />
Berhanu Gebremedhin<br />
ILRI, IPMS<br />
P.O.Box 5689<br />
A.A, Ethiopia<br />
E-mail: b.gebremedhin@cgiar.org<br />
Bob Yoder<br />
Technical Director<br />
IDE<br />
P.O.Box 7892<br />
A.A, Ethiopia<br />
Tel 0114-16 26 40<br />
E-mail: yoder@ideorg.org<br />
Burke Vindevoghtel<br />
Oxfam Canada, A.A, Ethiopia<br />
Tel 0911-40 56 10<br />
E-mail: x2002+kb@stfr.ca<br />
464
Dawit Kelemework<br />
Haramaya University<br />
P.O.Box 115, Dire Dawa, Ethiopia<br />
Tel 0911-61 78 70<br />
E-mail: dawitkelemework@yahoo.com<br />
Deborah Bossio (Dr).<br />
IWMI<br />
P.O.Box 2075, Sri Lanka<br />
Tel 0094-112-787-400<br />
E-mail: d.bossio@cgiar.org<br />
Degu Teressa<br />
<strong>Water</strong> Use Expert<br />
Indris Scheme (tokke Kuttaye Irrigation<br />
Office)<br />
Guder, Ambo, Ethiopia<br />
Tel 0112- 82 04 05, 0911-38 06 90<br />
Dejene Abesha<br />
Dept. Head MoARD<br />
P.O.Box 21855, A.A, Ethiopia<br />
Tel 0115-15 68 04 , 0115-54 68 04<br />
E-mail:sgeth@ethionet.et<br />
Dejene Kebede<br />
Program Manager<br />
Austrian Embassy Development<br />
Cooperation<br />
P.O.Box 11553, A.A, Ethiopia<br />
Tel 0115-53 38 28, 0115-55 38 31<br />
E-mail: dereje.kebede@ada.gv.at<br />
Desta Bayena<br />
FC-Consultant Oromia<br />
KfW-SUN, A.A, Ethiopia<br />
Tel 0114-42 10 89, 0911-90 19 65,<br />
0114-42 10 89<br />
E-mail: sun-fc-oromia@ethionet.et<br />
Dominik Ruffeis<br />
BOKU muthgasse<br />
P.O.Box 18, Austria<br />
Tel 0911-73 98 81<br />
E-mail:dominik.ruffeis@boku.ac.at<br />
Dr. Awad Ghanem<br />
MoARD GTZ/CiM<br />
P.O.Box 91, A.A, Ethiopia<br />
Tel 0911-25 01 10, 011-61 30 71<br />
E-mail: drghanem@ethionet.et<br />
Dr. Dejene Aredo<br />
Associate Pr<strong>of</strong>essor<br />
AAU<br />
P.O.Box 150008, A.A, Ethiopia<br />
Tel 0911-22 77 80<br />
E-mail: aredodejene@yahoo.com<br />
Dr. Solomon Seyoum<br />
<strong>Water</strong> Resources Specialist<br />
NBI-WRPM<br />
P.O.Box 60173, A.A, Ethiopia<br />
Tel 0116-46 70 11, 0912-05 50 08,<br />
0116-46 70 14<br />
E-mail: sdemissie@nilebasin.org<br />
Endeshaw Goshu<br />
Golgota Irrigation Scheem<br />
Merti, Ethiopia<br />
Tel 224530390, 0912-02 93 06<br />
Enyew Adgo (Dr)<br />
ARARI<br />
P.O.Box 527, Bahir Dar, Ethiopia<br />
Tel 0918-76 56 21, 058-220 51 74<br />
E-mail: enyewadgo@yahoo.com<br />
Etafa Emama<br />
MoWR<br />
P.O.Box 5744, A.A, Ethiopia<br />
Tel 0116-61 11 11, 0911-12 17 25,<br />
0116-61 08 85<br />
E-mail: etafa-emama@yahoo.com<br />
Fekadu Fufa<br />
Researcher (PhD)<br />
<strong>Institute</strong> <strong>of</strong> Biodiversity Conservation<br />
(IBC)<br />
A.A, Ethiopia<br />
Tel 0913-03 17 30<br />
E-mail: fekadufufa@yahoo.com<br />
Fekahmed Negash<br />
Ministry <strong>of</strong> <strong>Water</strong> Resource<br />
P.O.Box 5744<br />
A.A, Ethiopia<br />
Tel 0911-67 92 44, 0116-63 70 38<br />
E-mail: abbaybasin@ethionet.et<br />
Fentaw Abegaz Dr.<br />
EIAR<br />
465
P.O.Box 2003<br />
A.A, Ethiopia<br />
Tel 0116-46 01 34, 0911-88 64 05, 0116-<br />
48 94 12<br />
E-mail:fentaw@rediffmail.com<br />
Feyera Abdi<br />
Executive Director<br />
SOS Sahel - UK<br />
P.O.Box 3262<br />
A.A, Ethiopia<br />
Tel 0114-16 03 91/ 0114-16 02 78, 0911-<br />
20 88 38, 0114-16 02 88<br />
Fitsum Hagos (Dr.)<br />
IWMI<br />
P.O.Box 5689<br />
A.A, Ethiopia<br />
Tel 0116-17 21 91, 0911-55 96 16, 0116-<br />
17 20 01<br />
E-mail:f.hagos@cgiar.org<br />
Fitsum Tesfaye<br />
Lecturer<br />
Hawassa University<br />
P.O.Box5<br />
Hawassa, Ethiopia<br />
Tel 0911-71 34 78<br />
E-mail: fitsum5@yahoo.com<br />
G/Hawaria G/Egziabher<br />
Noewegian University <strong>of</strong> life Sciences,<br />
IOR<br />
P.O.Box 5003, N1432 AS<br />
AS, Norway<br />
Tel 0047-952-302-27<br />
E-mail: gebrge@umb.no<br />
Gashaye Chekole<br />
Head, <strong>Water</strong> Resources Dev't Division<br />
Ethiopian Orthodox Church Dev't and<br />
Inter church Aid Commission (EOC-<br />
DICAC)<br />
A.A, Ethiopia<br />
Tel 0911-33 67 69, 0111-55 14 55<br />
E-mail: gashayechek@yahoo.com<br />
Gayathree Jayasinghe<br />
Researcher (Biometrician)<br />
IWMI<br />
P.O.Box 5689<br />
A.A, Ethiopia<br />
Tel 0116-17 21 92, 01116-17 20 01<br />
E-mail: g.jayasinghe@cgiar.org<br />
Getachew Alem<br />
Private Consultant<br />
P.O.Box 30361<br />
A.A, Ethiopia<br />
Tel 0113-71 35 07, 0911-22 33 46<br />
Getachew Alemayehu(Dr).<br />
ARARI<br />
P.O.Box 527<br />
Bahir Dar, Ethiopia<br />
Tel 0918-76 26 64 0582-20 51 74<br />
E-mail: arari@ethionet.et<br />
Getachew Haile<br />
REST<br />
P.O.Box 222<br />
Mekelle,Ethiopia<br />
Tel 0344-41 08 20, 0914-70 65 62<br />
Getachew Tikubet<br />
Director<br />
YINRM<br />
P.O.Box 3893<br />
A.A, Ethiopia<br />
Tel 0911-25 23 37<br />
E-mail: bea@ethionet.et<br />
Gete Zeleke (Dr.)<br />
Global Mountain Program<br />
P.O.Box 5689<br />
A.A, Ethiopia<br />
E-mail: g.zeleke@cgiar.org<br />
Gezahegn Alemu<br />
JICA<br />
P.O.Box 5384<br />
A.A, Ethiopia<br />
Tel 0115-50 44 65<br />
E-mail:gezahegn_alemu@yahoo.com<br />
Gezahegne Ayele<br />
Senior Scientist<br />
EDRI<br />
P.O.Box 2479<br />
A.A, Ethiopia<br />
Tel 0911-21 69 35 0115-50 55 85<br />
E-mail: ayeleg2002@yahoo.com<br />
466
Girma Tadesse(Dr)<br />
ILRI<br />
P.O.Box 5689<br />
A.A, Ethiopia<br />
Tel 0116-60 37 86<br />
E-mail: g.taddesse@cgiar.org<br />
Girma Yosef<br />
Head, Department <strong>of</strong> Agriculture<br />
ESTC<br />
P.O.Box 2490<br />
A.A, Ethiopia<br />
Tel 0115-53 49 44, 0115-52 44 00<br />
E-mail: estcagri@yahoo.com<br />
Godswill Makombe(Dr.)<br />
IWMI<br />
P.O.Box 5689<br />
A.A, Ethiopia<br />
Tel 0116-46 32 15, 0911-68 40 82, 0116-<br />
46 46 45<br />
E-mail: g.makombe@cgiar.org<br />
Habte Honeligne<br />
Irrigation Agronomist Amhara Regional<br />
Bureau <strong>of</strong> Agriculture<br />
P.O.Box 437<br />
Bahir Dar, Ethiopia<br />
Tel 058-220 73 77, 0918-78 79 82,058-<br />
220 15 10<br />
E-mail: boa@ethionet.et<br />
Habtemariam Kassa<br />
CIFOR<br />
P.O.Box5689, A.A, Ethiopia<br />
Tel 0116-46 32 15, 011-46 46 45<br />
E-mail:h.kassa@cgiar.org<br />
Hailemariam Hailemeskel<br />
Agricultural Economist<br />
ADB<br />
P.O.Box 25543 code 1000<br />
A.A, Ethiopia<br />
Tel 0911-48 09 43<br />
E-mail: h.hailemeskel@afdb.org<br />
Ibrahim Ahmed<br />
MoARD<br />
P.O.Box 62347<br />
A.A, Ethiopia<br />
Tel 0115-15 78 64<br />
E-mail:dimuye@yahoo.com<br />
Judith Christie<br />
BOKU<br />
Vienna, Austria<br />
Tel 0043(0)650-8811223<br />
E-mail:christine_judt@yahoo.com<br />
Kalkidan Assefa<br />
IPMS/IWMI<br />
P.O.Box 101266<br />
A.A, Ethiopia<br />
Tel 091171 77 43<br />
E-mail: kalkidan_2006@yahoo.com<br />
Katrien Descheemacker(Dr.)<br />
ILRI-IWMI<br />
P.O.Box 5689<br />
A.A, Ethiopia<br />
Tel 0913-40 33 12<br />
E-mail: k.descheemacker@cgiar.org<br />
Kebede Thehayu<br />
GIS consultant FAO-Nile Project<br />
P.O.Box 521<br />
Kampala, Uganda<br />
E-mail: kebede-tsehayu@yahoo.co.uk<br />
Kifle Abegaz<br />
Program Officer II<br />
CRS-Ethiopia<br />
P.O.Box 6592<br />
A.A, Ethiopia<br />
Tel 0911-61 99 36, 0114-6544 50<br />
E-mail: kifleab@crsethiopia.org.et<br />
Kifle Amene<br />
Irrigation Team Leader<br />
Agrigulture & Rural Dev't<br />
Bish<strong>of</strong>tu<br />
Tel 0911-77 05 94, 0114-33 17 21<br />
Kim Geheb<br />
IWMI<br />
P.O.Box 5689<br />
A.A, Ethiopia<br />
E-mail: k.geheb@cgiar.org<br />
Lakech Haile<br />
Department Head<br />
467
Ministry <strong>of</strong> <strong>Water</strong> Resource<br />
P.O.Box 335243, A.A, Ethiopia<br />
Tel 0911-19 40 94<br />
E-mail: lakechhaile@yahoo.com<br />
Lemessa Mekonta<br />
Head, <strong>Water</strong> Resources Study & Design<br />
Dep't<br />
Oromia <strong>Water</strong> Resources Bureau<br />
P.O.Box 21685 CODE 1000<br />
A.A, Ethiopia<br />
Tel 0115-52 70 68, 0911-44 25 31<br />
E-mail: lemessam@yahoo.com<br />
Leonhard Moll<br />
Austrian Embassy Development<br />
Cooperation, A.A, Ethiopia<br />
Tel 0115-53 38 28<br />
E-mail: leonhard.moll@ada.gv.at<br />
Luaskandl Willibald<br />
University <strong>of</strong> Bodenhultus Wien<br />
Vienna, Austria<br />
Tel 0043(1)36006-5499<br />
E-mail: willibald.loiskandl@boku.ac.at<br />
Makonnen Loulseged<br />
IWMI<br />
P.O.Box 170121, A.A, Ethiopia<br />
Tel 0116-17 21 48, 0116-17 20 01<br />
E-mail: m.loulseged@cgiar.org<br />
Matthew McCartney (Dr.)<br />
IWMI 5689<br />
A.A, Ethiopia<br />
Tel 0116-17 22 46, 0116-12 20 01<br />
E-mail:m.mccartney@cgiar.org<br />
Mekonnen Ayana<br />
AMU<br />
P.O.Box 21<br />
Arba Minch, Ethiopia<br />
Tel 046-8810453, 0916-83 10 51, 0468-<br />
81 02 79<br />
E-mail:meko_amu@yahoo.com<br />
Melaku Mekonnen<br />
Metaferia Consulting Engineers<br />
P.O.Box 3192<br />
A.A, Ethiopia<br />
Tel 0115-51 71 93, 0911547808, 0115-<br />
51 44 66, 0911-48 72 84<br />
E-mail: aym.mce@ethionet.et;<br />
melakomek@yahoo.com<br />
Menkir Girma<br />
Irriggation Engineering (Expert)<br />
Upper Awash Agro Industrhy Enterprise<br />
P.O.Box 12624<br />
Merti Jeju, Ethiopia<br />
Tel 0221-12 17 05, 0221-12 27 03<br />
Mesfin Shiferaw<br />
<strong>Water</strong> <strong>Management</strong> Expert<br />
Ade'a Irrigation Dev't Office<br />
P.O.Box318, Akaki Beseka<br />
Debre Zeite, Ethiopia<br />
Tel 0911-47 18 00, 0114-33 17 21<br />
E-mail: mesfinshife@yahoo.com<br />
Michael Abebe<br />
Head, Dams & Hydropower Des.<br />
Department<br />
Ministry <strong>of</strong> <strong>Water</strong> Resource<br />
P.O.Box 17598<br />
A.A, Ethiopia<br />
Tel 0911-60 45 45<br />
E-mail: michael.abebe@gmail.com<br />
Michael Menkir Mr.<br />
IWMI<br />
P.O.Box 5689<br />
A.A, Ethiopia<br />
Tel 0116-17 22 49, 0911-11 19 99 Fax<br />
0116-17 20 01<br />
E-mail: m.menker@cgiar.org<br />
Million Alemayehu<br />
Head, Liason Office-ORDA<br />
ORDA<br />
P.O.Box8122<br />
A.A, Ethiopia<br />
Tel 0115-5044 55/54<br />
Fax 0115-517244<br />
E-mail: orda.liaison@ethionet.et<br />
Mitiku Bedru<br />
Deputy bureau head for Irrigation Dev't<br />
Sector, SNNPRS<br />
SNNPR <strong>Water</strong> Res. Dev't Bureau<br />
Irrigation Dev't Sector<br />
468
P.O.Box 153<br />
Hawassa, Ethiopia<br />
Tel 046-220 91 70 046-221-00 20<br />
Fax 046-220-20 37<br />
E-mail: mitikubed@yahoo.com<br />
Mohamed Badel Mohamed<br />
SORPARi<br />
P.O.Box 398<br />
Jigjiga, Ethiopia<br />
Tel 0915-74 48 22<br />
Fax 0257-75 31 27<br />
E-mail: mohamed_badel@yahoo.com<br />
Monika Jaeber<br />
University <strong>of</strong> Innsbruck<br />
Kenwelscheiben<br />
P.O.Box 21, 6173 Oberperpuss<br />
Innsbruck, Austria<br />
E-mail: monika.jaeger@tb.jaeger.at<br />
Mulatu Daba<br />
Golgota Irrigation Scheem<br />
P.O.Box 3334<br />
Merti, Ethiopia<br />
Tel 022-119-08 43, 0912-03 76 30<br />
Mulugeta Dejene<br />
Plant production & protection desk head<br />
Arba Mich District BoARD<br />
P.O.Box 24<br />
Arba Minch, Ethiopia<br />
Tel 046-881-01 22 0916-83 22 57<br />
Fax 046-881 01 43<br />
Rebeka Amha<br />
Monitoring & Evaluation Assistant<br />
ILRI, IPMS<br />
P.O.Box 5689<br />
A.A, Ethiopia<br />
Tel 0911-63 43 60<br />
E-mail: r.amha@cgiar.org<br />
Rehel Deribe<br />
MSc. Student<br />
AAU<br />
P.O.Box 4991<br />
A.A, Ethiopia<br />
Tel 0911-15 39 25<br />
E-mail: rahelderibe@yahoo.com<br />
Rieckh Helene<br />
University <strong>of</strong> Bodenkuetur<br />
Vienna, Austria<br />
E-mail: helene.riechh@gmail.com<br />
Robel Lambisso<br />
Program Coordinator<br />
WVE<br />
P.O.Box 3330<br />
A.A, Ethiopia<br />
Tel 0911-18 66 51<br />
Fax 0116-29 33 46<br />
E-mail: robelwam2@yahoo.com<br />
Schneider Jean<br />
Pr<strong>of</strong>. Dr. ChairIAG-BOKU VIENN<br />
Vienna, Austria<br />
0043147654/5401, 5409<br />
E-mail: jean.schneider@boku.ac.at<br />
Nadia Manning<br />
Researcher / outreach coordinator<br />
IWMI<br />
P.O.Box 5689<br />
A.A, Ethiopia<br />
Tel 0116-46 32 15<br />
E-mail: n.manning@cgiar.org<br />
Phillippe Lemperiere<br />
BRLi/ENTRO<br />
A.A, Ethiopia<br />
Tel 0911-76 05 36<br />
E-mail: philippe.lemperiere@bl.fz<br />
Schonerklee Monika DI, MSc<br />
Austrian Research Centers Seibersdoaf<br />
Seibersdoaf, Austria, Vienna<br />
Tel 0043-664-62 07 637<br />
Fax 0043-50 550-3452<br />
E-mail: monika.schoenecklee@arcs.ac.at<br />
Shimelis Dejene<br />
Development Studies Lecturer (MA)<br />
Jimma University, Ambo College<br />
Ambo, Ethiopia<br />
Tel 0911-30 48 50<br />
E-mail: dejene_shimelis@yahoo.com<br />
469
Sihin Tekle<br />
Researcher<br />
Debre Zeit Agricultural research Center<br />
P.O.Box32, Debre Zeite, Ethiopia<br />
Tel 0114-67 19 00 (Res.), 0913-10 74 00<br />
E-mail: sihiniti@yahoo.com<br />
Sintayehu Asfaw<br />
PR Officer (Public Relation)<br />
MoWR<br />
P.O.Box 40955<br />
A.A, Ethiopia<br />
Tel 0116-62 63 24 0911-13 97 32<br />
Fax 0116-61 08 85<br />
E-mail: sinta_a2006@yahoo.com<br />
Solomon G/Selassie<br />
ILRI<br />
P.O.Box5690<br />
A.A, Ethiopia<br />
Tel 0116-46 32 15<br />
E-mail: s.gsellassie@cgiar.org<br />
Solomon Kibret<br />
Independent<br />
P.O.Box 14001<br />
A.A, Ethiopia<br />
Tel 0911-65 29 78<br />
E-mail: solhitler@yahoo.com<br />
Spendling-Wimmer Robert (Dr.)<br />
Austrian Research Centers Seiberdou<br />
Seibersdoaf, Austria, Vienna<br />
Tel 0043-664-6207654<br />
E-mail:<br />
robert.spendlingwimmer@arcs.ac.at<br />
Svat Matula Pr<strong>of</strong>.<br />
CzechUniversity <strong>of</strong> Life Science<br />
Prague, Czech Republic<br />
Tel 00420-23438 4636<br />
Fax 00420-23438-1835<br />
E-mail: matula@af.czu.cz<br />
Tammo Steenhuns Pr<strong>of</strong>.<br />
Cornell University<br />
Iuhaca NY<br />
USA<br />
Tel 01607 255 4080<br />
Fax 01 607 255 40 80<br />
E-mail: tss1@cornell.edu<br />
Taye Duressa<br />
Irrigation & Drainage Enginer<br />
WWDSE<br />
A.A, Ethiopia<br />
Tel 0116-63 18 96, 0911-31 82 28<br />
Tegegne Sishaw<br />
Haramaya University<br />
P.O.Box 189(138)<br />
Dire Dawa, Ethiopia<br />
Tel 0915-74 20 60<br />
E-mail: tegegneshishaw@yahoo.com<br />
Temesgen Birhanu<br />
MoFED<br />
A.A, Ethiopia<br />
Tel 0911-07 23 01<br />
E-mail: temeshita22@yahoo.com<br />
Tena Alamirew(Dr.)<br />
Haramaya University<br />
P.O.Box 138<br />
Dire Dawa, Ethiopia<br />
Tel 0915-33 04 71<br />
Fax 0255-53 03 31<br />
E-mail: alamirew2004@yahoo.com<br />
Teressa Alemayehu<br />
<strong>Water</strong> Use Expert<br />
Indris Irrigation Scheeme<br />
Guder, Ambo, Ethiopia<br />
Tel 0112-82 04 05, 0911-97 67 60<br />
Tesfaye Zeleke<br />
Lecturer<br />
Axum University<br />
Axum, Ethiopia<br />
Tel 0911-30 21 70<br />
E-mail: tesfayezeleke@yahoo.com<br />
Teshome Asmare<br />
Expert Amhara Regional Bureau <strong>of</strong><br />
Agriculture<br />
Bahir Dar, Ethiopia<br />
Tel 058-220 46 16<br />
Fax 058-220 29 69<br />
470
Teshome Atnafe<br />
Head, Irrigation and Drainage Dev't<br />
Studies Department<br />
Ministry <strong>of</strong> <strong>Water</strong> Resource<br />
P.O.Box 100894, A.A, Ethiopia<br />
Tel 0911-61 12 38<br />
Fax 0116-63 70 48<br />
E-mail: teshome987@yahoo.com<br />
Teshome Lemma<br />
Program Manager<br />
Millinium <strong>Water</strong> Program<br />
P.O.Box4710<br />
A.A, Ethiopia<br />
Tel 0911-41 93 64<br />
Fax 0116-18 32 95<br />
E-mail: teshomel@care.org.et<br />
Tilahun Amede<br />
ILRI-IWMI<br />
P.O.Box5689<br />
A.A, Ethiopia<br />
Tel 0116-46 32 15<br />
E-mail: t.amede@cgiar.org<br />
Tilahun Hord<strong>of</strong>a(Dr.)<br />
EIAR<br />
P.O.Box 2003<br />
Nazareth, Ethiopia<br />
Tel 022-111 14 49, 0911-84 24 92<br />
Fax 022-111 46 22/23<br />
E-mail: tilahun_hord<strong>of</strong>a@yahoo.com<br />
Tirufat Hailemariam<br />
BOKU<br />
Vienna, Austria<br />
Tel 06991-01-61 660<br />
E-mail: trufat@gmail.com<br />
Wagnew Ayalineh<br />
Research Assistant<br />
ILRI<br />
P.O.Box 5689, A.A, Ethiopia<br />
Tel 0116-613215<br />
E-mail: wayalneh@cgiar.org<br />
Wiebke Foerch<br />
University <strong>of</strong> Arizona GTZ-SUN<br />
Mekelle, Ethiopia<br />
Tel 0912-04 86 69<br />
E-mail: wiebke@email-arizona.edu<br />
Woldeab Teshome (Dr.)<br />
AAU<br />
P.O.Box 150197, A.A, Ethiopia<br />
Tel 011-167 34 13<br />
E-mail: woldeabt@yahoo.com<br />
Wubishet Yilma<br />
D/G/Manager<br />
Middle Awash Agri. Dev't Ent.<br />
M/Sedi, Ethiopia<br />
Tel 022-456-01 45, 0911-20 18 95<br />
Fax 022-459-01 39<br />
Yihenew Alemu<br />
AAU<br />
P.O.Box 40762<br />
Jimma & A.A, Ethiopia<br />
Tel 0911-30 43 89<br />
E-mail: yihenewtesfaye@yahoo.com<br />
Yodit Balcha<br />
IWMI<br />
P.O.Box 5689, A.A, Ethiopia<br />
Tel 0911-88 01 41<br />
E-mail: yodibal@gmail.com<br />
Yohannes Belay<br />
German Agro Action<br />
P.O.Box 1866, A.A, Ethiopia<br />
Tel 0116-62 47 31<br />
E-mail: yohannes.balay@dwhh.org<br />
Yohannes Geleta<br />
Design Enginer<br />
OromiaIrrigation Dev't<br />
A.A, Ethiopia<br />
Tel 0114-67 15 03, 0911-98 16 65<br />
E-mail: yohketi@yahoo.com<br />
Zachar, Easton (Dr.)<br />
Cornell University<br />
USA<br />
Tel 607-255-2463<br />
E-mail: zme2@cornell<br />
471
Partial View <strong>of</strong> Symposium Participants<br />
472