Workplace Travel Plans - main body - Final Jan 2010 ENGLISH - FCM
Workplace Travel Plans - main body - Final Jan 2010 ENGLISH - FCM
Workplace Travel Plans - main body - Final Jan 2010 ENGLISH - FCM
Create successful ePaper yourself
Turn your PDF publications into a flip-book with our unique Google optimized e-Paper software.
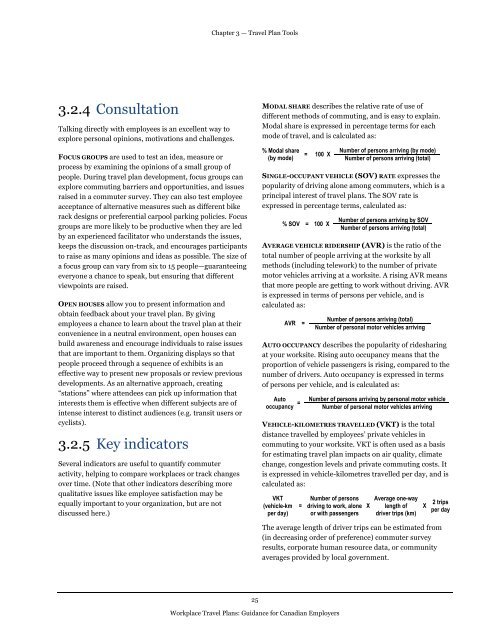
Chapter 3 — <strong>Travel</strong> Plan Tools<br />
3.2.4 Consultation<br />
Talking directly with employees is an excellent way to<br />
explore personal opinions, motivations and challenges.<br />
FOCUS GROUPS are used to test an idea, measure or<br />
process by examining the opinions of a small group of<br />
people. During travel plan development, focus groups can<br />
explore commuting barriers and opportunities, and issues<br />
raised in a commuter survey. They can also test employee<br />
acceptance of alternative measures such as different bike<br />
rack designs or preferential carpool parking policies. Focus<br />
groups are more likely to be productive when they are led<br />
by an experienced facilitator who understands the issues,<br />
keeps the discussion on-track, and encourages participants<br />
to raise as many opinions and ideas as possible. The size of<br />
a focus group can vary from six to 15 people—guaranteeing<br />
everyone a chance to speak, but ensuring that different<br />
viewpoints are raised.<br />
OPEN HOUSES allow you to present information and<br />
obtain feedback about your travel plan. By giving<br />
employees a chance to learn about the travel plan at their<br />
convenience in a neutral environment, open houses can<br />
build awareness and encourage individuals to raise issues<br />
that are important to them. Organizing displays so that<br />
people proceed through a sequence of exhibits is an<br />
effective way to present new proposals or review previous<br />
developments. As an alternative approach, creating<br />
“stations” where attendees can pick up information that<br />
interests them is effective when different subjects are of<br />
intense interest to distinct audiences (e.g. transit users or<br />
cyclists).<br />
3.2.5 Key indicators<br />
Several indicators are useful to quantify commuter<br />
activity, helping to compare workplaces or track changes<br />
over time. (Note that other indicators describing more<br />
qualitative issues like employee satisfaction may be<br />
equally important to your organization, but are not<br />
discussed here.)<br />
MODAL SHARE describes the relative rate of use of<br />
different methods of commuting, and is easy to explain.<br />
Modal share is expressed in percentage terms for each<br />
mode of travel, and is calculated as:<br />
% Modal share<br />
(by mode)<br />
= 100 X<br />
Number of persons arriving (by mode)<br />
Number of persons arriving (total)<br />
SINGLE-OCCUPANT VEHICLE (SOV) RATE expresses the<br />
popularity of driving alone among commuters, which is a<br />
principal interest of travel plans. The SOV rate is<br />
expressed in percentage terms, calculated as:<br />
% SOV = 100 X<br />
Number of persons arriving by SOV<br />
Number of persons arriving (total)<br />
AVERAGE VEHICLE RIDERSHIP (AVR) is the ratio of the<br />
total number of people arriving at the worksite by all<br />
methods (including telework) to the number of private<br />
motor vehicles arriving at a worksite. A rising AVR means<br />
that more people are getting to work without driving. AVR<br />
is expressed in terms of persons per vehicle, and is<br />
calculated as:<br />
AVR =<br />
Number of persons arriving (total)<br />
Number of personal motor vehicles arriving<br />
AUTO OCCUPANCY describes the popularity of ridesharing<br />
at your worksite. Rising auto occupancy means that the<br />
proportion of vehicle passengers is rising, compared to the<br />
number of drivers. Auto occupancy is expressed in terms<br />
of persons per vehicle, and is calculated as:<br />
Auto<br />
occupancy =<br />
Number of persons arriving by personal motor vehicle<br />
Number of personal motor vehicles arriving<br />
VEHICLE-KILOMETRES TRAVELLED (VKT) is the total<br />
distance travelled by employees’ private vehicles in<br />
commuting to your worksite. VKT is often used as a basis<br />
for estimating travel plan impacts on air quality, climate<br />
change, congestion levels and private commuting costs. It<br />
is expressed in vehicle-kilometres travelled per day, and is<br />
calculated as:<br />
VKT<br />
(vehicle-km<br />
per day)<br />
=<br />
Number of persons<br />
driving to work, alone<br />
or with passengers<br />
X<br />
Average one-way<br />
length of<br />
driver trips (km)<br />
X<br />
2 trips<br />
per day<br />
The average length of driver trips can be estimated from<br />
(in decreasing order of preference) commuter survey<br />
results, corporate human resource data, or community<br />
averages provided by local government.<br />
25<br />
<strong>Workplace</strong> <strong>Travel</strong> <strong>Plans</strong>: Guidance for Canadian Employers


