Integrated remote sensing and GIS approach to groundwater ... - RMZ
Integrated remote sensing and GIS approach to groundwater ... - RMZ
Integrated remote sensing and GIS approach to groundwater ... - RMZ

Create successful ePaper yourself
Turn your PDF publications into a flip-book with our unique Google optimized e-Paper software.
<strong>RMZ</strong> – Materials <strong>and</strong> Geoenvironment, Vol. 58, No. 3, pp. 303–328, 2011<br />
303<br />
<strong>Integrated</strong> <strong>remote</strong> <strong>sensing</strong> <strong>and</strong> <strong>GIS</strong> <strong>approach</strong> <strong>to</strong><br />
<strong>groundwater</strong> potential assessment in the basement terrain of<br />
Ekiti area southwestern Nigeria<br />
Povezava daljinskega ugotavljanja in <strong>GIS</strong> za oceno potenciala<br />
podtalnice v kristalinični podlagi območja Ekiti v jugozahodni<br />
Nigeriji<br />
Abel O. Talabi 1, * & Moshood N. Tijani 2<br />
1<br />
University of Ado-Ekiti, Faculty of Science, Department of Geology,<br />
Ado-Ekiti, Nigeria<br />
2<br />
University of Ibadan, Faculty of Science, Geology Department, Ibadan,<br />
Nigeria<br />
*Corresponding author. E-mail: soar_abel@yahoo.com<br />
Received: March 15, 2011 Accepted: September 6, 2011<br />
Abstract: Occurrence of <strong>groundwater</strong> in the Basement Complex terrain<br />
of Ekiti area, southwestern Nigeria is controlled by secondary<br />
porosities developed through weathering <strong>and</strong> fracturing of<br />
the crystalline bedrocks. Here, the aquifers are characteristically<br />
discontinuous (localized) warranting assessment of the <strong>groundwater</strong><br />
potential of the area <strong>to</strong> serve as a guide for <strong>groundwater</strong><br />
exploration. Remote <strong>sensing</strong> (RS) <strong>and</strong> Geographical Information<br />
System (<strong>GIS</strong>) have been useful in assessing, moni<strong>to</strong>ring <strong>and</strong><br />
conserving <strong>groundwater</strong> occurrence. Hence, this paper presents<br />
the integrated <strong>approach</strong> of RS <strong>and</strong> <strong>GIS</strong> <strong>to</strong> <strong>groundwater</strong> potential<br />
zonation in the study area. Thematic maps of geology, geomorphology,<br />
lineament, slope, drainage <strong>and</strong> drainage density were<br />
prepared <strong>and</strong> integrated using Arc<strong>GIS</strong> 9.1 software <strong>to</strong> produce<br />
the <strong>groundwater</strong> potential map of the study area. The <strong>GIS</strong> evaluation<br />
produced a <strong>groundwater</strong> potential map in which the study<br />
area was categorized in<strong>to</strong> zones; very good, good-moderately<br />
good <strong>and</strong> poor. Furthermore, superimposition of the groundwa-<br />
Original scientific paper
304 Talabi, A. O. & Tijani, M. N.<br />
ter yield data from the study area on the <strong>groundwater</strong> potential<br />
map revealed that there are more number of high-yield wells<br />
in the favourable zones (very good <strong>to</strong> good-moderately good)<br />
indicated by the <strong>GIS</strong> <strong>approach</strong>. This study highlights that the<br />
<strong>groundwater</strong> potential map would apart from its role as exploration<br />
guide be useful for the development of sustainable <strong>groundwater</strong><br />
scheme in the area.<br />
Izvleček: Navzočnost podtalnice v stari podlagi območja Ekiti v jugozahodni<br />
Nigeriji je odvisna od sekundarne poroznosti, ki je posledica<br />
preperelosti in razpokanosti kristaliničnih kamnin. Značilno<br />
za vodonosnike v njih je, da so nepovezani (lokalizirani)<br />
in je za<strong>to</strong> mogoče podatke o potencialu podtalnice v njih uporabiti<br />
kot vodilo za njeno sledenje. Daljinsko ugotavljanje (RS)<br />
in geografski informacijski sistem (<strong>GIS</strong>) sta uporabni orodji<br />
za ocenjevanje, spremljanje in varstvo podtalnice. V članku je<br />
opisana povezana uporaba RS in <strong>GIS</strong> za zoniranje potenciala<br />
podtalnice na raziskovanem ozemlju. Izdelane tematske karte<br />
geologije, geomorfologije, lineamen<strong>to</strong>v, nagiba reliefa, površinskih<br />
vodnih <strong>to</strong>kov in njihove gos<strong>to</strong>te so združili s programsko<br />
opremo Arc<strong>GIS</strong> 9.1 v kar<strong>to</strong> potenciala podtalnice raziskovanega<br />
ozemlja. Na tej karti, izdelani z uporabo <strong>GIS</strong>, je ozemlje<br />
razdeljeno na območja dobrega, dobrega do zmerno dobrega in<br />
slabega potenciala. Ob prekritju karte izdatnosti podtalnice na<br />
raziskovanem ozemlju s kar<strong>to</strong> njenega potenciala se je dalje izkazalo,<br />
da so visoko izdatni vodnjaki številnejši v ugodnih območjih<br />
(z zelo dobrim in dobrim-zmerno dobrim potencialom),<br />
kakor so bili določeni z me<strong>to</strong>dologijo <strong>GIS</strong>. Iz raziskave izhaja,<br />
da je kar<strong>to</strong> potenciala podtalnice mogoče uporabiti ne le kot<br />
vodilo pri sledenju, vendar tudi za trajnostno gospodarjenje s<br />
podtalnico na danem ozemlju.<br />
Key words: Remote <strong>sensing</strong>, <strong>GIS</strong>, <strong>groundwater</strong> potential zonation,<br />
Ekiti area, Basement Complex, thematic maps, high yield wells.<br />
Ključne besede: daljinsko ugotavljanje, <strong>GIS</strong>, zonalnost vodnega potenciala,<br />
območje Ekiti, kristalinična podlaga, tematske karte,<br />
vodnjaki visoke izdatnosti<br />
<strong>RMZ</strong>-M&G 2011, 58
<strong>Integrated</strong> <strong>remote</strong> <strong>sensing</strong> <strong>and</strong> <strong>GIS</strong> <strong>approach</strong> <strong>to</strong> <strong>groundwater</strong> potential assessment ...<br />
305<br />
Introduction<br />
Water is an important constituent of all<br />
forms of life <strong>and</strong> is required in sufficient<br />
quantity <strong>and</strong> acceptable quality <strong>to</strong> meet<br />
the ever increasing dem<strong>and</strong> for various<br />
domestic, agricultural <strong>and</strong> industrial<br />
processing operations. This requirement<br />
is hardly fulfilled because 97.5 %<br />
of the world global water is saline existing<br />
in the ocean, 69.5 % of the remaining<br />
2.5 % world global water that is<br />
fresh is locked up in glaciers/permafrost<br />
while 30.1 % <strong>and</strong> 0.4 % of it represent<br />
<strong>groundwater</strong> <strong>and</strong> surface/atmospheric<br />
water respectively (http://ga.water.usgs.<br />
gov/edu/waterdistribution.html). Surface<br />
water on the one h<strong>and</strong> is prone <strong>to</strong><br />
seasonal fluctuations <strong>and</strong> contamination<br />
through anthropogenic activities while<br />
<strong>groundwater</strong> on the other h<strong>and</strong> is more<br />
in quantity, readily available as it exists<br />
in virtually all geologic formations<br />
<strong>and</strong> is naturally protected from direct<br />
contamination by surface anthropogenic<br />
activities. In the basement terrain<br />
of Ekiti area, south western Nigeria,<br />
availability of surface water is seasonal;<br />
during the relatively dry period of November<br />
<strong>to</strong> February each year, shallow<br />
<strong>groundwater</strong> in form of h<strong>and</strong>-dug wells<br />
<strong>and</strong> boreholes remain the only source of<br />
water supply as most streams <strong>and</strong> rivers<br />
are dried up. However, the occurrence<br />
<strong>and</strong> movement of <strong>groundwater</strong> in this<br />
crystalline bedrock setting depend on<br />
the degree of weathering <strong>and</strong> extent of<br />
fracturing of the rocks (Oloruniwo &<br />
Olorunfemi, 1987).<br />
The highlighted scenario warrants a<br />
detailed investigation of the <strong>groundwater</strong><br />
potential characteristics of the area<br />
so that an exploration guide as well as<br />
sustainable <strong>groundwater</strong> management<br />
strategy can be developed.<br />
Groundwater prospect in an area is<br />
controlled by many fac<strong>to</strong>rs such as<br />
geology, geomorphology, drainage,<br />
slope, depth of weathering, presence<br />
of fractures, surface water bodies, canals<br />
<strong>and</strong> irrigated fields amongst others<br />
(Jain, 1998). Slope for example is<br />
one of the fac<strong>to</strong>rs that control the rate<br />
of infiltration of rainwater in<strong>to</strong> the subsurface<br />
<strong>and</strong> could therefore be used<br />
as an index of <strong>groundwater</strong> potential<br />
evaluation. In the gentle slope area the<br />
runoff is slow allowing more time for<br />
rainwater <strong>to</strong> percolate, whereas high<br />
slope area facilitate high runoff allowing<br />
less residence time for rainwater<br />
hence comparatively less infiltration.<br />
In one way or the other, each of the listed<br />
fac<strong>to</strong>rs contributes <strong>to</strong> <strong>groundwater</strong><br />
occurrence. These fac<strong>to</strong>rs can be interpreted<br />
or analyzed with <strong>GIS</strong> using RS<br />
data. Burrough (1986) defined a <strong>GIS</strong><br />
‘‘as a powerful set of <strong>to</strong>ols for collecting,<br />
s<strong>to</strong>ring, retrieving at will, transforming<br />
<strong>and</strong> displaying spatial data<br />
from the real world for a particular set<br />
of purpose’’. <strong>GIS</strong> thus enables a wide<br />
<strong>RMZ</strong>-M&G 2011, 58
306 Talabi, A. O. & Tijani, M. N.<br />
range of map analysis operations <strong>to</strong> be<br />
undertaken in support of <strong>groundwater</strong><br />
potential zonation of an area.<br />
Several conventional methods exist<br />
for the exploration <strong>and</strong> preparation<br />
of <strong>groundwater</strong> potential map of an<br />
area. These methods include; geological,<br />
geophysical <strong>and</strong> hydrogeological.<br />
However, RS amongst these methods is<br />
considered <strong>to</strong> be more favourable as it<br />
is less expensive <strong>and</strong> applicable even in<br />
inaccessible areas. It is a rapid <strong>and</strong> cost<br />
effective <strong>to</strong>ol in producing valuable<br />
data in geology <strong>and</strong> geomorphology.<br />
In classifying <strong>groundwater</strong> potential<br />
zones, visual integration of data generated<br />
from <strong>remote</strong> <strong>sensing</strong> is feasible<br />
but cumbersome. However, with the advent<br />
of <strong>GIS</strong> technologies, the mapping<br />
of <strong>groundwater</strong> potential zones within<br />
each geological unit has become easy.<br />
Gustafsson (1993) used <strong>GIS</strong> for the<br />
analysis of lineament data derived from<br />
SPOT imagery for <strong>groundwater</strong> potential<br />
mapping in a semi-arid area in south<br />
eastern Botswana. Also, Jain (1998)<br />
demonstrated the use of hydro geomorphological<br />
map by using Indian Remote<br />
Sensing Satellite Linear Imaging Self-<br />
Scanning II geocoded data on 1 : 50 000<br />
scale along with the <strong>to</strong>pographic maps<br />
<strong>to</strong> indicate the <strong>groundwater</strong> potential<br />
zones in qualitative terms (i.e., good <strong>to</strong><br />
very good, moderate <strong>to</strong> good <strong>and</strong> poor).<br />
Previous research efforts in the study<br />
area have been directed at locating <strong>and</strong><br />
developing potable <strong>groundwater</strong> using<br />
geophysical <strong>and</strong> geological techniques.<br />
Such studies, including the work of Reboucas<br />
& Cavalcante (1989), classified<br />
the basement terrains aquifers in<strong>to</strong><br />
three; the weathered basement aquifer,<br />
the basement detrital overburden aquifer<br />
<strong>and</strong> the fractured rock aquifer. Also,<br />
Oyinloye & Ademilua (2005) examined<br />
the nature of aquifer in the crystalline<br />
Basement rocks of Ado-Ekiti, Igede-<br />
Ekiti <strong>and</strong> Igbara-odo areas, southwestern<br />
Nigeria <strong>and</strong> concluded that aquifers<br />
occurred both in the regolith <strong>and</strong> fractured<br />
basement rocks of the area.<br />
The highlighted previous <strong>groundwater</strong><br />
investigations concentrated on<br />
identifying fracture zones <strong>and</strong> areas<br />
with thick overburden employing geophysical<br />
<strong>and</strong> geological techniques as<br />
pathfinders <strong>to</strong> <strong>groundwater</strong> availabity.<br />
However, basic knowledge of <strong>groundwater</strong><br />
location, its potential in terms<br />
of quantity <strong>and</strong> availability can provide<br />
basis for more rational planning.<br />
Therefore, the present study assessed<br />
the <strong>groundwater</strong> potentials of the study<br />
area using integrated RS <strong>and</strong> <strong>GIS</strong> <strong>approach</strong>.<br />
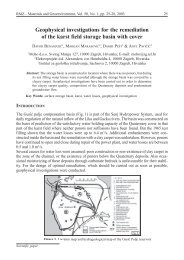
Study area<br />
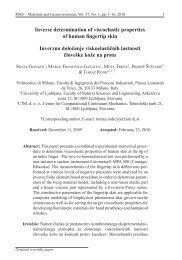
The study area (Figure 1) lies between<br />
latitudes 7 0 15’–8 0 5’ N <strong>and</strong> longitudes<br />
4 0 44’–5 0 45’ E <strong>and</strong> fall within the Basement<br />
Complex setting of southwestern<br />
<strong>RMZ</strong>-M&G 2011, 58
<strong>Integrated</strong> <strong>remote</strong> <strong>sensing</strong> <strong>and</strong> <strong>GIS</strong> <strong>approach</strong> <strong>to</strong> <strong>groundwater</strong> potential assessment ...<br />
307<br />
Nigeria. It covers area extent of about<br />
6 353 km 2 . The study area enjoys tropical<br />
climate with two distinct seasons;<br />
rainy <strong>and</strong> dry seasons covering (April<br />
<strong>to</strong> Oc<strong>to</strong>ber) <strong>and</strong> (November <strong>to</strong> March)<br />
respectively. The annual temperature<br />
range is between 25 o C <strong>and</strong> 30 o C while<br />
the annual rainfall is 1 500 mm. The<br />
study area is drained by many streams<br />
<strong>and</strong> rivers most of which dry off at the<br />
pick of the dry season usually between<br />
January <strong>and</strong> February causing supply<br />
of water for domestic <strong>and</strong> agricultural<br />
purposes <strong>to</strong> depend heavily on <strong>groundwater</strong><br />
system. Groundwater supply in<br />
the area is mainly from shallow h<strong>and</strong><br />
dug wells <strong>and</strong> limited boreholes. Two<br />
major aquiferous units (weathered <strong>and</strong><br />
fractured layers) have been identified<br />
as source of supply <strong>to</strong> the wells <strong>and</strong><br />
boreholes (Ademilua & Olorunfemi,<br />
2000).<br />
Figure 1. Location map of Nigeria showing the study area<br />
<strong>RMZ</strong>-M&G 2011, 58
308 Talabi, A. O. & Tijani, M. N.<br />
The <strong>to</strong>pography is generally undulating<br />
with most area lying above 250 m above<br />
sea level. The l<strong>and</strong>scape is characterized<br />
by old plains, broken steep sided<br />
outcrops of dome shaped Inselbergs that<br />
may occur singularly or in ridges. Such<br />
outcrops exist mainly in form of rugged<br />
hills at Ado-Ekiti (central part of study<br />
area) <strong>and</strong> Ikere-Ekiti in the southern part<br />
of the study area.<br />
Geology of study area<br />
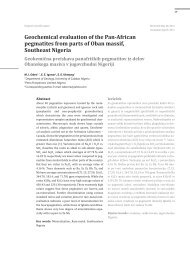
Geologically, the study area is underlain<br />
by Precambrian crystalline rocks mostly<br />
of igneous-metamorphic origin with iso<strong>to</strong>pic<br />
ages greater than 300 Ma <strong>to</strong> 450<br />
Ma (Matheis, 1987). Prominent rock<br />
units include porphyritic granite, finemedium<br />
grained granite, granite gneiss,<br />
schist/quartz schist, migmatites <strong>and</strong> charnockite.<br />
The gneisses <strong>and</strong> migmatite are<br />
intimately associated such that they are<br />
hardly distinguishable on the field. The<br />
gneisses <strong>and</strong> the migmatite rock units<br />
are ubiqui<strong>to</strong>us <strong>and</strong> form the bulk of the<br />
rocks in the study area. In some places,<br />
these rocks display characteristic feature<br />
of b<strong>and</strong>ing of varying width (Figure 2).<br />
Migmatite is a mixed rock composed of<br />
a gneissic host <strong>and</strong> intruded by the granitic<br />
<strong>and</strong> pegmatitic rocks. It covers over<br />
50 % of the whole study area (Figure 3).<br />
Figure 2. Migmatite rock outcrop along a road cut (Iworoko-Ifaki) in the<br />
study area.<br />
<strong>RMZ</strong>-M&G 2011, 58
<strong>Integrated</strong> <strong>remote</strong> <strong>sensing</strong> <strong>and</strong> <strong>GIS</strong> <strong>approach</strong> <strong>to</strong> <strong>groundwater</strong> potential assessment ...<br />
309<br />
Figure 3. Geology Map of the Study Area.<br />
<strong>RMZ</strong>-M&G 2011, 58
310 Talabi, A. O. & Tijani, M. N.<br />
The quartzite occurs as relatively minor<br />
concordant layers within the gneissmigmatite<br />
units. On account of high<br />
content of late crystal1ised mineral <strong>and</strong><br />
consequently resistance <strong>to</strong> weathering/<br />
erosion, the quartzite tends <strong>to</strong> st<strong>and</strong> out<br />
as prominent hills <strong>and</strong> ridges within the<br />
study area.<br />
The granitic units occur as intrusive<br />
bodies of various dimensions in the<br />
pre-existing basement rocks i.e. the<br />
gneiss-migmatite units <strong>and</strong> the schist/<br />
quartz schist bedrock. The granitic<br />
units consisting of a suite of porphyritic<br />
<strong>and</strong> non-porphyritic granite rocks<br />
as well as medium <strong>to</strong> coarse grained<br />
textural varieties are widely distributed<br />
in the study area especially the central<br />
<strong>and</strong> south- eastern part. One striking<br />
feature of the granitic unit is the occurrence<br />
as picturesque inselbergs (prominent<br />
hills) rising sharply above their<br />
surrounding plains.<br />
System integration, which involves<br />
the integration of computer software<br />
(Au<strong>to</strong>CAD 2000, Cad overlay R.14<br />
<strong>and</strong> Arc<strong>GIS</strong> 9.1) <strong>and</strong> hardware, imagery<br />
processing, information extraction<br />
<strong>and</strong> analysis formed the basic<br />
methodology of this work. System integration<br />
involves the use of computer<br />
hardware (equipment), software, data<br />
<strong>and</strong> personnel as well as other accessories<br />
such as digitizer <strong>and</strong> scanner at<br />
building capable expert system <strong>to</strong> extract<br />
geo-referenced information from<br />
the acquired satellite imagery. The<br />
processing flow chart of the methodology<br />
used in this study is presented<br />
in Figure 4. The first step in system<br />
integration is <strong>to</strong> identify data need,<br />
conceptualize how it would be captured<br />
<strong>and</strong> display in a <strong>GIS</strong> platform.<br />
The data required <strong>and</strong> used for this<br />
study were identified <strong>and</strong> their sources<br />
verified. The data sources include<br />
the Geological Survey Department of<br />
Nigeria, Abuja, National Institute of<br />
In some places, charnockite, a bluishgreen<br />
rock, is found associated with the<br />
granitic units. The charnockite features<br />
prominently at Ikere <strong>and</strong> Ado <strong>to</strong>wns in<br />
the study area.<br />
Methodology<br />
Figure 4. <strong>GIS</strong> in <strong>groundwater</strong> potential<br />
assessment<br />
<strong>RMZ</strong>-M&G 2011, 58
<strong>Integrated</strong> <strong>remote</strong> <strong>sensing</strong> <strong>and</strong> <strong>GIS</strong> <strong>approach</strong> <strong>to</strong> <strong>groundwater</strong> potential assessment ...<br />
311<br />
Remote <strong>sensing</strong>, Bukuru, Jos, Nigeria<br />
<strong>and</strong> Federal Ministry of Solid Mineral<br />
Resources, Abuja, Nigeria.<br />
Data acquisition, Conversion <strong>and</strong><br />
Information extraction<br />
The relevant data acquired which include<br />
existing analogue maps, charts,<br />
plans <strong>and</strong> records are presented in<br />
Table 1. Consequently, assembling<br />
<strong>and</strong> detail data structuring were also<br />
carried out before the compilation<br />
<strong>and</strong> digital conversion for logical<br />
data structure. The data as highlighted<br />
in Table 1 conformed <strong>to</strong> the National<br />
Geospatial Data Infrastructure<br />
(NGDI) - an initiative for co-sharing<br />
information in a Geoinformationbased<br />
economy. Subsequently, the<br />
analogue spatial <strong>and</strong> attribute data<br />
acquired were captured, rasterized,<br />
georeferenced <strong>and</strong> manipulated in<br />
CAD software (CAD Overlay R14)<br />
<strong>and</strong> converted <strong>to</strong> <strong>GIS</strong> supported GeoTIFFs<br />
raster format. These were<br />
subsequently exported in<strong>to</strong> Arc<strong>GIS</strong><br />
9.1 software for further processing<br />
which include editing of both spatial<br />
<strong>and</strong> tabular data on a continuous <strong>and</strong><br />
interactive basis.<br />
As part of the follow up activities,<br />
the information required were extracted<br />
using supervised, unsupervised<br />
<strong>and</strong> ground truthing <strong>approach</strong><br />
plus existing data <strong>and</strong> information.<br />
To classify the image in<strong>to</strong> unique<br />
characters comprising of pixels<br />
with similar spectral characteristics,<br />
unique clusters which represent one<br />
or more features according <strong>to</strong> some<br />
statistically determined criteria,<br />
were also employed. Subsequently,<br />
fieldwork was embarked upon <strong>to</strong><br />
validate <strong>GIS</strong> processed information.<br />
Where outcrops were not visible, the<br />
slope <strong>and</strong> drainage were used <strong>to</strong> validate<br />
the results.<br />
Table 1. Relevant spatial data, information extracted <strong>and</strong> data sources for the research<br />
Spatial Data Attribute Data Source<br />
L<strong>and</strong> sat Imagery<br />
NigerSat-1 Imagery<br />
Mineral Maps of Nigeria<br />
Aero Magnetic Map of<br />
Southwestern Nigeria<br />
Digital Elevation Modeling/<br />
Terrain/Geology<br />
Digital Elevation Modeling/<br />
Terrain/Drainage<br />
Metadata<br />
Lineation<br />
National Institute of Remote Sensing,<br />
Bukuru, Jos, Nigeria<br />
National Institute of Remote Sensing,<br />
Bukuru, Jos, Nigeria<br />
Geological Survey Department of Nigeria,<br />
Abuja, Nigeria<br />
Ministry of Solid Mineral Resources, Abuja,<br />
Nigeria<br />
<strong>RMZ</strong>-M&G 2011, 58
312 Talabi, A. O. & Tijani, M. N.<br />
Integration of data<br />
Consequently, each of the thematic<br />
maps in raster format was assigned<br />
suitable weightage fac<strong>to</strong>r (Table 2)<br />
based on previous works of researchers<br />
such as Srinivasa Rao & Jugran<br />
(2003), Krishnamurthy et al. (1996),<br />
Saraf & Choudhary (1998) <strong>and</strong> Parasad<br />
et al. (2008). Each of the thematic<br />
maps such as geology, geomorphology,<br />
drainage density, lineament <strong>and</strong> slope<br />
provides certain clue in respect of the<br />
occurrence of <strong>groundwater</strong>. To unify<br />
these information, there is the need for<br />
integration of the data with appropriate<br />
fac<strong>to</strong>r. Though, it is possible <strong>to</strong> superimpose<br />
the information manually,<br />
however, it is time consuming <strong>and</strong> may<br />
be proned <strong>to</strong> errors. Therefore, the information<br />
were integrated through the<br />
application of <strong>GIS</strong>. Various thematic<br />
maps were reclassified on the basis<br />
Table 2. Weightage assigned <strong>to</strong> various thematic maps based on prospective contribution<br />
of input fac<strong>to</strong>rs <strong>to</strong> <strong>groundwater</strong> occurrence (Srinivasa Rao & Jugran, 2003).<br />
Feature Classification Weightage<br />
Geology<br />
Geomorphology<br />
Slope<br />
Lineaments<br />
Drainage density<br />
Drainage density<br />
Migmatites<br />
Charnockite<br />
Granite gneiss<br />
Granite<br />
Quartzite/quartzite schist<br />
Hilly area<br />
Lowl<strong>and</strong> area<br />
Extreme steep slope (76.3 0 )<br />
Very steep slope (35.2 0 )<br />
Steep slope (30.81 0 )<br />
Moderate-steep slope (22.13 0 )<br />
Moderate slope (9.21 0 )<br />
Gentle slope (8.4 0 )<br />
Very gentle slope (4.57 0 )<br />
Lowl<strong>and</strong>/Nearly Level (0.25 0 )<br />
Present<br />
Absent<br />
Low density/coarse texture<br />
Medium density/medium texture<br />
High density/fine texture<br />
Very high density/very fine texture<br />
Low density/coarse texture<br />
Medium density/medium texture<br />
High density/fine texture<br />
Very high density/very fine texture<br />
1<br />
1<br />
2<br />
2<br />
3<br />
1<br />
3<br />
1<br />
1<br />
1<br />
1<br />
1<br />
2<br />
3<br />
4<br />
3<br />
1<br />
4<br />
2<br />
1<br />
1<br />
4<br />
2<br />
1<br />
1<br />
<strong>RMZ</strong>-M&G 2011, 58
<strong>Integrated</strong> <strong>remote</strong> <strong>sensing</strong> <strong>and</strong> <strong>GIS</strong> <strong>approach</strong> <strong>to</strong> <strong>groundwater</strong> potential assessment ...<br />
313<br />
of weightage assigned <strong>and</strong> processed<br />
using the ‘‘Raster Calcula<strong>to</strong>r’’ function<br />
of Spatial Analysist Extension of<br />
Arc<strong>GIS</strong> 9.1 for integration.The procedure<br />
adopt simple arithmetical model<br />
<strong>to</strong> integrate the various thematic maps<br />
by averaging of the weightage <strong>to</strong> produce<br />
a final <strong>groundwater</strong> potential map<br />
of the study area. Finally, <strong>to</strong> validate<br />
or authenticate the evaluation method,<br />
existing borehole yield data were correlated<br />
with the various <strong>groundwater</strong><br />
potential zones in the study area.<br />
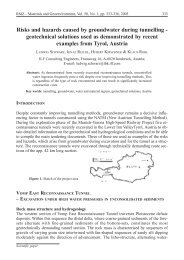
Results <strong>and</strong> discussion<br />
Results of the integrated <strong>approach</strong> of<br />
RS <strong>and</strong> <strong>GIS</strong> <strong>to</strong> delineate <strong>groundwater</strong><br />
potential zones in hard rock terrain<br />
of Ekiti area are presented in form of<br />
thematic maps (Figures 3, 5 & 7–10).<br />
Figure 5. Lineament map of the study area.<br />
<strong>RMZ</strong>-M&G 2011, 58
314 Talabi, A. O. & Tijani, M. N.<br />
The final <strong>groundwater</strong> potential map<br />
in which the study area were zoned<br />
in<strong>to</strong> three categories (Very good, goodmoderately<br />
good & poor) is represented<br />
in Figure 11. Furthermore, Figure<br />
12 represents a typical weathered overburden<br />
soil in charnockite bed rock<br />
terrain at Ikere in the southern par<strong>to</strong>f<br />
the study area while graphical evaluation<br />
of the highlighted zones with well<br />
depths <strong>and</strong> yield data are presented in<br />
Figures 13 <strong>and</strong> 14 respectively.<br />
Lineaments<br />
The study area is criss-crossed with lineaments<br />
characterized by dominant NW-<br />
SE <strong>and</strong> NE-SW directions while a few<br />
numbers of the lineaments also trend<br />
E-W (Figure 5) this strongly agree with<br />
result of the directional analysis presented<br />
in rose diagram (Figure 6). Lineaments<br />
cut across the entire bedrock<br />
units of the whole area. Futher evaluation<br />
revealed that migmatite has low<br />
lineament density with 0.02 km –2 com-<br />
Figure 6. Rose Diagram<br />
<strong>RMZ</strong>-M&G 2011, 58
<strong>Integrated</strong> <strong>remote</strong> <strong>sensing</strong> <strong>and</strong> <strong>GIS</strong> <strong>approach</strong> <strong>to</strong> <strong>groundwater</strong> potential assessment ...<br />
315<br />
pare <strong>to</strong> quartzite, granite <strong>and</strong> charnockite<br />
with density range from 0.05 km –2 <strong>to</strong><br />
0.13 km –2 . These lineament density revealed<br />
existence of more lineaments on<br />
the granitic /charnockitic rocks which<br />
might be as a result of transpressive<br />
forces exhibited during intrusion of the<br />
rocks in<strong>to</strong> the parent migmatite/metasedimentary<br />
rocks. However, the lineaments<br />
in the low lying part of the study<br />
area are of significant interest with respect<br />
<strong>to</strong> <strong>groundwater</strong> occurrence because<br />
the lineaments on migmatite are<br />
mostly on the hilly <strong>and</strong> high slope areas<br />
with little or no overburden which are<br />
regarded as less significant due <strong>to</strong> possible<br />
high runoff rather than favouring<br />
vertical groudwater infiltration.<br />
Figure 7. Drainage Map of the Study Area<br />
<strong>RMZ</strong>-M&G 2011, 58
316 Talabi, A. O. & Tijani, M. N.<br />
Drainage<br />
Usually, drainage patterns are said <strong>to</strong><br />
be reflections of surface <strong>and</strong> subsurface<br />
formations while drainage density<br />
is proportional <strong>to</strong> surface run-off due <strong>to</strong><br />
the fact that the more the drainage density,<br />
the higher the runoff. (Parasad et<br />
al, 2008). Hence, the drainage density<br />
characterizes the runoff in an area as<br />
the volume of relative water that was<br />
unable <strong>to</strong> penetrate in<strong>to</strong> the subsurface.<br />
In addition, drainage density do give<br />
Figure 8. Drainage Density Map of the Study Area<br />
<strong>RMZ</strong>-M&G 2011, 58
<strong>Integrated</strong> <strong>remote</strong> <strong>sensing</strong> <strong>and</strong> <strong>GIS</strong> <strong>approach</strong> <strong>to</strong> <strong>groundwater</strong> potential assessment ...<br />
317<br />
indications of closing or otherwise of<br />
stream/river channels which inturn<br />
will depend on the nature <strong>and</strong> degree<br />
of weathering of the surface <strong>and</strong> subsurface<br />
lithologic units. Low drainage<br />
density therefore enhances the chance<br />
of recharge <strong>and</strong> contributes positively<br />
<strong>to</strong> <strong>groundwater</strong> availability if other<br />
<strong>groundwater</strong> occurrence conditions<br />
are favourable. In this study thematic<br />
map extracted from the <strong>to</strong>pographic<br />
map shows dendritic pattern (Figure<br />
7) while the drainage density map presented<br />
in Figure 8 reflects the infiltration<br />
characteristics with high drainage<br />
density indicating low-infiltration <strong>and</strong><br />
the low drainage density high infiltration<br />
respectively. Most of the drainage<br />
originates from the quartzite ridge <strong>and</strong><br />
granitic/charnockitic hills with dense<br />
drainage pattern. The lowl<strong>and</strong> part of<br />
the study area that are characterized<br />
mainly by diverse rock units (porphyritic<br />
granite, fine-medium grained<br />
granite, granite gneiss <strong>and</strong> migmatite)<br />
presents low density an indication of<br />
favourable condition for vertical infiltration<br />
of runoff from surrounding hills<br />
<strong>and</strong> thus enhancing grounwater occurrence.This<br />
observation signify that<br />
<strong>groundwater</strong> occurrence in the lowl<strong>and</strong><br />
part of the study area is not only controlled<br />
by rock formations but other<br />
fac<strong>to</strong>rs like <strong>to</strong>pography <strong>and</strong> weathering<br />
as weathering products from the<br />
surrounding hills pile up <strong>to</strong> form overburden<br />
thickness aquifer while during<br />
igneous rocks intrusion fractures favourable<br />
for vertical infiltration were<br />
developed <strong>and</strong> thus additionally support<br />
<strong>groundwater</strong> occurrence.<br />
Slope/Geomorphology<br />
Results of slope <strong>and</strong> geomorphology<br />
thematic maps produced from integrated<br />
RS <strong>and</strong> <strong>GIS</strong> as presented in Figures<br />
9 <strong>and</strong> 10 respectively revealed eight<br />
slope categories ranging from extreme<br />
slope <strong>to</strong> lowl<strong>and</strong> <strong>and</strong> two main geomorphic<br />
units; hilly area <strong>and</strong> lowl<strong>and</strong><br />
area. Geomorphology is a reflection<br />
of the various l<strong>and</strong>form <strong>and</strong> structural<br />
features of an area. Such l<strong>and</strong>form<br />
<strong>and</strong> structural features are useful in<br />
categorizing <strong>groundwater</strong> occurrence.<br />
Generally, field observation revealed<br />
that the lowl<strong>and</strong> areas are covered by<br />
thick weathered material representing<br />
alluvium matrials from the hilly areas<br />
(Figure 12). The weathered overburden<br />
revealed three principal horizons<br />
designated A, B <strong>and</strong> C. The “A” horizon<br />
is dark brown <strong>to</strong> redish lateritised<br />
soil, littered with some plant residues<br />
which implies organic soil form. The<br />
“B” horizon is subdivided in<strong>to</strong> three<br />
distinct sub-units but all the three units<br />
are generally finer in texture compared<br />
<strong>to</strong> “A” horizon <strong>and</strong> of a lighter brown.<br />
The first two subunits of ‘‘B’’ horizon<br />
constitute the vadoze zone where active<br />
leaching <strong>and</strong> vertical of infiltration<br />
water occurs.The third sub-unit of the<br />
horizon constitute the phreatic zone<br />
representing the aquiferous layer.Soil<br />
horizon ‘‘C’’ is grey <strong>to</strong> white in col-<br />
<strong>RMZ</strong>-M&G 2011, 58
318 Talabi, A. O. & Tijani, M. N.<br />
our due mainly <strong>to</strong> absence or substantial<br />
reduction of weathering activities<br />
<strong>and</strong> represents fresh parent rock which<br />
may or may not be fractured. However,<br />
when the parent rock is fractured, it<br />
compliments the overburden thickness<br />
in terms of <strong>groundwater</strong> occurrence.<br />
The hilly areas comprise of gentle<br />
sloping surfaces with transported sediments<br />
lying between hills <strong>and</strong> plains.<br />
Additionally, the hilly areas are also<br />
characterized by presence of residual<br />
hills occuppying over 64 % of the<br />
study area (Figure 11). The ground-<br />
<strong>RMZ</strong>-M&G 2011, 58
<strong>Integrated</strong> <strong>remote</strong> <strong>sensing</strong> <strong>and</strong> <strong>GIS</strong> <strong>approach</strong> <strong>to</strong> <strong>groundwater</strong> potential assessment ...<br />
319<br />
water prospect in this zone is poor.<br />
Further evaluation with respect <strong>to</strong> the<br />
slope characteristics of the study area<br />
revealed that gentle slope are indicative<br />
of slow runoff allowing more time<br />
for rainwater infitration, whereas extremly<br />
steep slope area facilitate high<br />
runoff allowing less residence time for<br />
rainwater hence, comparatively less infiltration.<br />
Extreme slope <strong>to</strong> moderately<br />
Figure 10. Geomorphology Map of the Study Area<br />
<strong>RMZ</strong>-M&G 2011, 58
320 Talabi, A. O. & Tijani, M. N.<br />
steep slope occupy over 50 % of the<br />
study area <strong>and</strong> <strong>groundwater</strong> prospect<br />
in this area is poor in agreement with<br />
the earlier observation infereed from<br />
geomorphologic thematic map.<br />
Synthesis <strong>and</strong> Groundwater potential<br />
map of the study area<br />
The integration of the thematic maps<br />
resulted in the production of <strong>groundwater</strong><br />
potential map of the study area<br />
Figure 11. Groundwater Potential Map of the Study Area<br />
<strong>RMZ</strong>-M&G 2011, 58
<strong>Integrated</strong> <strong>remote</strong> <strong>sensing</strong> <strong>and</strong> <strong>GIS</strong> <strong>approach</strong> <strong>to</strong> <strong>groundwater</strong> potential assessment ...<br />
321<br />
(Figure 11). As shown in the map, the<br />
area that has very good potential for<br />
<strong>groundwater</strong> is situated in the south<br />
eastern part covering about 21.15 % of<br />
the study area. The good <strong>to</strong> moderately<br />
good potential area covers only 6.12 %<br />
while the greatest portion of the area<br />
about 64.04 % belongs <strong>to</strong> poor <strong>groundwater</strong><br />
potential zone. The poor <strong>groundwater</strong><br />
potential zone on the one h<strong>and</strong><br />
is characterized majorly by migmatite<br />
<strong>and</strong> migmatite gneiss with quartzite/<br />
quartz-schist <strong>and</strong> charnockite constituting<br />
the minority rock units while<br />
on the other h<strong>and</strong>, the very good <strong>and</strong><br />
good <strong>to</strong> moderately good <strong>groundwater</strong><br />
potential zones are covered majorly by<br />
granitic <strong>and</strong> charnockitic rocks with<br />
migmatite <strong>and</strong> quartzite constituting<br />
minority rock units. The various rock<br />
units cut across the different <strong>groundwater</strong><br />
potential zones. However, the<br />
migmatite rocks that cover greater<br />
parts of poor <strong>groundwater</strong> potential<br />
zone are less fractured <strong>and</strong> in most<br />
cases covered with shallow overburden<br />
Figure 12. Showing weathered overburden soil in a typical charnockite<br />
bed rock terrain at Ikere<br />
<strong>RMZ</strong>-M&G 2011, 58
322 Talabi, A. O. & Tijani, M. N.<br />
Figure 13. Frequency distribution of well depth with respect <strong>to</strong> <strong>groundwater</strong><br />
potential zones.<br />
Figure 14. Frequency distribution of well yield with respect <strong>to</strong> <strong>groundwater</strong><br />
potential zones<br />
<strong>RMZ</strong>-M&G 2011, 58
<strong>Integrated</strong> <strong>remote</strong> <strong>sensing</strong> <strong>and</strong> <strong>GIS</strong> <strong>approach</strong> <strong>to</strong> <strong>groundwater</strong> potential assessment ...<br />
323<br />
thickness when compared <strong>to</strong> the granitic<br />
<strong>and</strong> charnockitic rocks that form<br />
the major rock units of the very good<br />
<strong>and</strong> good <strong>to</strong> moderately good potential<br />
zones. Obviously, weathering, thickness<br />
of overburden mateerial as well as<br />
fracture system in the various <strong>groundwater</strong><br />
potential zones are major fac<strong>to</strong>rs<br />
controlling <strong>groundwater</strong> occurrence<br />
in the study area <strong>and</strong> these fac<strong>to</strong>rs are<br />
more favoured in the very good <strong>and</strong><br />
good <strong>to</strong> moderately good <strong>groundwater</strong><br />
potential zones compared <strong>to</strong> the poor<br />
<strong>groundwater</strong> potential zones.<br />
Result validation<br />
In order <strong>to</strong> validate the classification of<br />
the study area in<strong>to</strong> different <strong>groundwater</strong><br />
potential zones (i.e. very good, good<br />
<strong>to</strong> moderately good <strong>and</strong> poor), bohole<br />
yield data of existing wells from Benin/Owena<br />
River Basin Development<br />
Authority (BRBDA), Ikere-Ekiti, <strong>and</strong><br />
Federal Ministry of Water Resources,<br />
Lagos, Nigeria were collected <strong>and</strong> evaluated.<br />
The data revealed that boreholes<br />
in the study area can be categorized<br />
in<strong>to</strong> high (>100 m 3 /d), moderate (50–<br />
100 m 3 /d) <strong>and</strong> low yield (100 m 3 /d) while 21 % of<br />
well in both migmatite <strong>and</strong> charnockitic<br />
also exhibited high yield compared<br />
<strong>to</strong> 12 % of the quartzite terrain. These<br />
are characteristics of very good <strong>to</strong> good<br />
<strong>groundwater</strong> potential zones which is<br />
consistent with the trend of the <strong>GIS</strong>based<br />
potential zones. However, migmatite,<br />
charnockite, granite <strong>and</strong> quartzite<br />
bedrocks are characterized by 63 %,<br />
16 %, 13 % <strong>and</strong> 3 % of the low yield<br />
(
324 Talabi, A. O. & Tijani, M. N.<br />
9 Ado(Italaoro) 30 3.3 86.4 Very good granite<br />
10 Igede 35 8 69.12 Very good granite<br />
11 Temidire 43.8 6 131.33 Very good granite<br />
12 Ilumoba 45 7 354.24 Very good migmatite<br />
13 Ago-Aduloju 29.6 2.7 129.6 very good charnockite<br />
14 Bolorunduro 31.3 3.2 30.24 very good charnockite<br />
15 Ado-Com. School 40 6.8 132.19 Very good granite<br />
16 Aro Camp-Ikere 42 3.2 54.43 Very good charnockite<br />
17 ESGSC-Ikere 68 18 203.04 Very good charnockite<br />
18 Ado grammar school 51.4 7.2 25.92 Very good granite<br />
29 Ogbese 48.6 1.5 283.39 Very good migmatite<br />
20 Itawure 37 2 103.68 Good quartzite<br />
21 Ikoro 60 9 112.32 Good migmatite<br />
22 Egbewa 50 21 103.68 Good migmatite<br />
23 Owode 43 2.1 175.39 Good granite gneiss<br />
24 Ilupo 26 4 103.68 Good granite gneiss<br />
25 Imesi 46.6 8 114.05 Good quartz-schist<br />
26 Ijero-Ekiti 80 8.1 304.99 Good. quartz-schist<br />
27 Aramoko-Ekiti 48 14.61 160.70 Good granite gneiss<br />
28 Ogotun-Ekiti 92 2 129.6 Good granite<br />
29 Iloro-Temidire 38 9.1 95.04 Good granite<br />
30 Soso 31.4 8.7 98.49 Good granite<br />
31 Itawure 21.3 5.7 95.04 Good quartzite<br />
32 Ado-Ekiti 74 2.7 191.81 Good granite<br />
33 Ifaki 40 18 69.12 Poor migmatite<br />
34 Ijero(palace) 50 6 69.12 Poor quartz-schist<br />
35 Ipoti 50 1.7 53.57 Poor migmatite<br />
36 Epe 31 12 69.12 Poor migmatite<br />
37 Are 40 4.6 34.56 Poor migmatite<br />
38 Iworoko 42 5 43.2 Poor migmatite<br />
39 Ipoti 50 11.8 51.84 Poor migmatite<br />
40 Erinjiyan 40 10 43.2 Poor quartzite<br />
41 Igede-Ekiti 72 1.3 114.91 Poor granite<br />
<strong>RMZ</strong>-M&G 2011, 58
<strong>Integrated</strong> <strong>remote</strong> <strong>sensing</strong> <strong>and</strong> <strong>GIS</strong> <strong>approach</strong> <strong>to</strong> <strong>groundwater</strong> potential assessment ...<br />
325<br />
42 Orin farm settlement 60 12.4 8.64 poor charnockite<br />
43 Aba Igbira 37.8 13.9 17.28 poor migmatite<br />
44 MGHS Ifaki 59 1 86.4 poor migmatite<br />
45 Ofale community 50 11 11.23 poor migmatite<br />
46 Ipao CHC 25.5 2.9 21.6 poor migmatite<br />
47 Eda-Ile 54.7 12.3 31.10 poor migmatite<br />
48 Ilasa 46.6 6.2 27.65 poor migmatite<br />
49 Kajola 30 7.2 17.28 poor migmatite<br />
50 Ipole Iloro 43.5 9.2 11.23 poor migmatite<br />
51 Ipoti-Ekiti 72 13.97 95.90 poor granite<br />
52 Igede-Ekiti 72 1.33 114.91 Poor granite<br />
53 Otun-Ekiti 72 3.89 102.81 poor migmatite<br />
54 Ilawe-Ekiti 89 NN 86.4 poor granite<br />
55 Usi-Ekiti 80 10.63 64.8 poor charnockite<br />
56 Iyin-Ekiti 72 9.15 26.78 poor granite<br />
57 Ilogbo-Ekiti 70 4.85 44.06 poor migmatite<br />
58 Iworoko-Ekiti 78 3.5 120.09 poor migmatite<br />
59 Ire-Ekiti 74 12.8 28.512 poor migmatite<br />
60 Ijan-Ekiti 70 1.9 40.61 poor charnockite<br />
61 Igogo-Ekiti 46 1.33 40.61 poor migmatite<br />
62 Usi-Ekiti 80 10.63 64.8 poor migmatite<br />
63 Ajeb<strong>and</strong>ele 41.5 3 17.28 poor migmatite<br />
64 Ikogosi 42 14.4 103.68 poor quarzite<br />
65 Irare Fulani 46.1 NN 36.29 poor migmatite<br />
66 Irare community 48.4 6.1 8.64 poor migmatite<br />
67 Ogunnire School 29 8.5 8.64 poor charnockite<br />
68 Obalatan 50.6 4.5 8.64 poor charnockite<br />
69 EKSC Ayede 23.4 2.1 21.6 poor migmatite<br />
Source: Federal Ministry of Water Resources, Lagos, Nigeria <strong>and</strong> Benin/Owena River<br />
Basin Development Authority, Ikere- Ekiti, Nigeria<br />
NN: Not known<br />
BHD: Borehole depth<br />
SWL: Static water level<br />
GWZ: Groundwater zones<br />
<strong>RMZ</strong>-M&G 2011, 58
326 Talabi, A. O. & Tijani, M. N.<br />
Further evaluations revealed low correlation<br />
(r = 0.37) between well yield<br />
<strong>and</strong> well depth suggesting that well<br />
yield depends on aquifer characteristics<br />
such as porosity, permeability<br />
<strong>and</strong> fracture system rather than depth.<br />
This is consistent with the frequency<br />
distribution of well depth with respect<br />
<strong>to</strong> <strong>groundwater</strong> potential zones (Figure<br />
13) revealed that well yield is not<br />
controlled by depth due <strong>to</strong> the fact that<br />
wells with depth >40 m are more represented<br />
in the poor <strong>groundwater</strong> potential<br />
zone. This is a clear indication<br />
of the localized nature of weathered<br />
basement aquifer in the study area.<br />
Nonetheless, the frequency diagram<br />
of well yield distribution (Figures 14)<br />
support the early observation because<br />
wells with low yield (
<strong>Integrated</strong> <strong>remote</strong> <strong>sensing</strong> <strong>and</strong> <strong>GIS</strong> <strong>approach</strong> <strong>to</strong> <strong>groundwater</strong> potential assessment ...<br />
327<br />
eastern <strong>and</strong> south-western parts of<br />
the study area. These zones have an<br />
area extent of 868.97 km 2 representing<br />
6.12 % coverage. However, the<br />
poor <strong>groundwater</strong> potential zone<br />
with an area extent of 3 759.83 km 2<br />
represents 64.04 % coverage <strong>and</strong> is<br />
variably located in the remaining<br />
portions of the study area.<br />
2) That the very good potential<br />
<strong>groundwater</strong> zone is undelain<br />
mostltly by granitic/ charnockitic<br />
rocks while the good <strong>to</strong> moderately<br />
good <strong>groundwater</strong> potential zone is<br />
covered by quartzite/quartz-schist,<br />
granite <strong>and</strong> charnockitic rocks. The<br />
poor <strong>groundwater</strong> potential zone,<br />
however, are underlain by predominantly<br />
by migmatite/ migmatite<br />
gneiss bedrock with few charnockite<br />
<strong>and</strong> granitic rock units.<br />
3) That fractures on the migmatite<br />
bedrocks are poorly developed with<br />
thin overburden thickness accounting<br />
for the poor <strong>groundwater</strong> occurrence<br />
in this terrain. However, the<br />
relatively moderate <strong>to</strong> thick weathered<br />
overburden units characterized<br />
the quartzite <strong>and</strong> granitic bedrocks<br />
where greater proportion of high<br />
yield (>100 m 3 /d) are located.<br />
4) That yield is not controlled by well<br />
depth as wells with depth >40 m<br />
are more represented in the poor<br />
<strong>groundwater</strong> potential zone compared<br />
<strong>to</strong> very good <strong>and</strong> good <strong>to</strong><br />
moderately good <strong>groundwater</strong> potential<br />
zones. This is a clear indication<br />
of the localized nature of<br />
weathered basement aquifer in the<br />
study area.<br />
5) That superimposition of existing<br />
<strong>groundwater</strong> yield data on the deciphered<br />
<strong>groundwater</strong> potential zones<br />
revealed more frequent occurrence<br />
of high <strong>to</strong> medium yield wells in<br />
the favourable <strong>groundwater</strong> potential<br />
zones which support the result<br />
of integrated <strong>GIS</strong> thematic maps.<br />
In summary the overall asssessment as<br />
presented in this study highlight that<br />
mapping of <strong>groundwater</strong> potential using<br />
integrated RS/<strong>GIS</strong> <strong>approach</strong> could<br />
be an effective means of charcaterization<br />
of <strong>groundwater</strong> potential zones<br />
as well as serving as a usuful <strong>to</strong>ol <strong>and</strong><br />
guide in groundwaer exploration <strong>and</strong><br />
development in the study area. However,<br />
further geophysical investigation<br />
<strong>to</strong> determine the aquifer characteristics<br />
<strong>and</strong> the overburden thickness of various<br />
<strong>groundwater</strong> potential zones highlighted<br />
is recommended <strong>to</strong> compliment<br />
the present study.<br />
References<br />
Ademilua, O. L. & Olorunfemi, M. O.<br />
(2000): Geoelectric/Geology estimation<br />
of the <strong>groundwater</strong> potential of<br />
the Basement Complex area of Ekiti<br />
<strong>and</strong> Ondo States, Nigeria. Journal of<br />
Techno science. Vol. 4, pp. 4–20.<br />
Burrough, P. A. (1986): Principles of Geographical<br />
Information Systems for<br />
<strong>RMZ</strong>-M&G 2011, 58
328 Talabi, A. O. & Tijani, M. N.<br />
L<strong>and</strong> Resource aassessment. Clarendon<br />
Press, Oxford, U. K.<br />
Gustafsson, P. (1993): High Resolution<br />
Satellite Data <strong>and</strong> <strong>GIS</strong> as a Tool for<br />
Assessment of the Groundwater Potential<br />
of a Semi-Arid Area. Proceedings<br />
of the Ninth Thematic Conference on<br />
Geologic Remote <strong>sensing</strong>. Vol. 1, pp.<br />
609–619.<br />
Gustafsson, P. (1994): Spot satellite data<br />
for exploration of fractured aquifers in<br />
a semi-arid area in south eastern Botswana.<br />
Applied Hydrogeology J. Vol.<br />
2, pp. 9–18.<br />
Jain, P. K. (1998): Remote <strong>sensing</strong> techniques<br />
<strong>to</strong> locate ground water potential<br />
zones in upper Urmil River basin,<br />
district Chatarpur-central India. J Ind<br />
Soc Remote Sens. Vol. 26, No. 3, pp.<br />
135–47.<br />
Krishnamurthy, J. N., Venkatesa, K.,<br />
Jayaraman, V. & Manivel, M. (1996):<br />
An <strong>approach</strong> <strong>to</strong> demarcate ground<br />
water potential zones through <strong>remote</strong><br />
<strong>sensing</strong> <strong>and</strong> geographical information<br />
system. Int J Remote Sens. Vol. 17, pp.<br />
1867–1884.<br />
Matheis, G. (1987): Nigeria Rare Metal<br />
Pegmatites <strong>and</strong> their lithologic framework.<br />
Geol. Journ. Vol. 22, pp. 271–<br />
291.<br />
Oloruniwo, M. A. & Olorunfemi, M. O.<br />
(1987): Geophysical i n v e s -<br />
tigation for <strong>groundwater</strong> in Precambrian<br />
terrains: a case study from Ikare.<br />
Southwestern Nigeria. Journal of African<br />
Earth Sciences. Vol. 6, No. 6,<br />
pp.787–796.<br />
Oyinloye, A. O. & Ademilua, O. L. (2005):<br />
The nature of aquifer in the crystalline<br />
basement rocks of Ado-Ekiti, Igede-<br />
Ekiti <strong>and</strong> Igbara-Odo areas, southwestern<br />
Nigeria. Pak. J. sci. Ind. Res. Vol.<br />
48, No. 3, pp. 154–161.<br />
Prasad, R. K., Mondal, N. C., Banerjee,<br />
Pallavi, N<strong>and</strong>akumar, M. V. & Rao,<br />
N. Subba (2006): Groundwater potential<br />
index in a crystalline terrain using<br />
<strong>remote</strong> <strong>sensing</strong> data. Environmental<br />
Geology. Vol. 50, pp. 1067–1076.<br />
Prasad, R. K., Mondal, N. C., Banerjee,<br />
Pallavi, N<strong>and</strong>akumar, M. V. & Singh,<br />
V. S. (2008): Deciphering potential<br />
<strong>groundwater</strong> zone in hard rock through<br />
the application of <strong>GIS</strong>. Environ. Geol.<br />
Vol. 55, pp. 467–475.<br />
Reboucas, A. C. & Cavalcante, I. N.<br />
(1989). Hydrogeology of crystalline<br />
rocks in Brazil. In <strong>groundwater</strong> exploration<br />
<strong>and</strong> development in crystalline<br />
basement aquifers. (Proceedings,<br />
Zimbabwe, 15–24 June, 1987, vol.1<br />
sessions 1–5), Commonwealth Science<br />
Council, Pall Mall, London: 103–126.<br />
Saraf, A. & Choudhary, P. R. (1998): <strong>Integrated</strong><br />
<strong>remote</strong> <strong>sensing</strong> <strong>and</strong> <strong>GIS</strong> for<br />
ground water exploration <strong>and</strong><br />
identification of artificial recharge site.<br />
Int J Remotes sense. Vol. 19, pp.1825–<br />
1841.<br />
Singh, V. S. (2008): Deciphering potential<br />
<strong>groundwater</strong> zone in hard rock through<br />
the application of <strong>GIS</strong>. Environ Geol.<br />
Vol. 55, pp. 467–475.<br />
Srinivasa, Rao Y. & Jugran, K. D. (2003):<br />
Delineation of <strong>groundwater</strong> potential<br />
zones <strong>and</strong> zones of <strong>groundwater</strong> quality<br />
suitable for domestic purposes using<br />
<strong>remote</strong> <strong>sensing</strong> <strong>and</strong> <strong>GIS</strong> Hydrogeol.<br />
Sci. J. Vol. 48, pp. 821–833.<br />
USGS – General Interest Publication<br />
‘‘Groundwater’’ – retrieved from<br />
http://pubs.usgs.gov/edu/waterdistribution.html.<br />
<strong>RMZ</strong>-M&G 2011, 58