The Canonical Distribution of Commonness and Rarity: Part I F. W ...
The Canonical Distribution of Commonness and Rarity: Part I F. W ...
The Canonical Distribution of Commonness and Rarity: Part I F. W ...

You also want an ePaper? Increase the reach of your titles
YUMPU automatically turns print PDFs into web optimized ePapers that Google loves.
Spring 1962 CANONICAL DISTRIBCTIO~T 209<br />
It was, I think, hlacArthur's original view that<br />
a genuine "community" might correspond approximately<br />
with his predictions, while fortuitous<br />
aggregations would more likely come close to the<br />
lognormal. This presents us with the problem <strong>of</strong><br />
defining a genuine community. Superficially one<br />
might imagine that a heronry or a colony <strong>of</strong> gulls<br />
<strong>and</strong> terns <strong>and</strong> cormorants like Belknap's is a "community"<br />
since in some sense the birds "attract"<br />
one another in much the same way as human communities<br />
are brought together. But we see from<br />
Fig. 17 <strong>and</strong> from the data in Tables XI <strong>and</strong> XII,<br />
that it is precisely such communities that depart<br />
most from the MacArthur prediction. We should<br />
have to define a community as a group <strong>of</strong> persons,<br />
animals, or plants that insist on holding their<br />
fellows at arm's length, or that are repelled by one<br />
another.<br />
Margaret Perner's breeding birds at Clevel<strong>and</strong>,<br />
Ohio <br />
Since the MacArthur formula seems more appropriate<br />
to territorial species that1 others, I<br />
thought we might examine one instance in more<br />
detail, <strong>and</strong> for that purpose use Perner's ( 1955)<br />
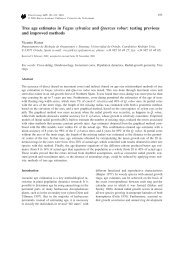
data on 25 species <strong>of</strong> nesting birds. This time<br />
we plot simply the nests per species as ordinate<br />
SCALE OF OCTAVES (Indtv!duak per Spectes><br />
against ordinal rank (<strong>of</strong> increasing commonness)<br />
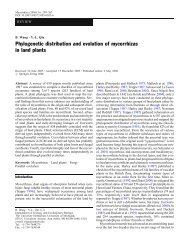
FIG.22. <strong>The</strong> MacArthur distribution for 5, 10, 100, as abscissa (Figure 23), <strong>and</strong> the 3IacArthur pre<strong>and</strong><br />
1OOO species. diction is plotted on the same graph. <strong>The</strong> de-<br />
It lies at an distance<br />
partures <strong>of</strong> the observations from the prediction<br />
the pints .re not r<strong>and</strong>om, but systematic. so that this aggre-<br />
for gregarious or cololliall~-nesting birds <strong>and</strong> for<br />
the "contagious" plant communities. Since the does not agree well with prediction.<br />
effects <strong>of</strong> contagion may be expected to smooth<br />
out, <strong>and</strong> die out, with very large areas or very<br />
gation <strong>of</strong> species, tho~lgl~ negatively contagious,<br />
Otlzcr pecztlarities <strong>of</strong> the Species-Area clrmre for<br />
large ensembles <strong>of</strong> species, in the overall picture,<br />
satnples<br />
while the MacArthur distribution, even for 1000<br />
species (see Fig. 22) gives a 3-value not much<br />
Samples, especially small ones, have a number<br />
higher than for 100 species, the distribution would<br />
oi peculiarities, partly because they are sarrlples<br />
not apply to such aggregrations oi species, as Mac<strong>and</strong><br />
therefore likely to be incomplete or truncated<br />
Arthur himself has said.<br />
distributions, <strong>and</strong> partly because they are small,<br />
I therefore suggest somewhat tentatively that<br />
especially in numbers <strong>of</strong> species. <strong>and</strong> therefore<br />
the MacArthur distribu.tion is not the norm, <strong>and</strong><br />
likely to be affected by contagion, positive or negathat<br />
the frequent agreement <strong>of</strong> Icohn's diagrams tive. JVhereas the Species-Area curves for isotherewith<br />
is due to the cone-shells being somewhat<br />
lates can be understood comparatively easily, those<br />
over-regularized in their spacial distribution. lye<br />
for samples may present greater difficulties. Even<br />
may note here Kohn's own comment that in a<br />
in the matter <strong>of</strong> graphing the plots there are<br />
~iumher <strong>of</strong> his diagrams "common species are<br />
problems, <strong>and</strong> in interpreting the results there are<br />
too common <strong>and</strong> rare ones too rare" to agree with<br />
worse uncertainties.<br />
the ?.lacLlrthur prediction. This statement<br />
JIcthods<br />
amounts to saying that the logarithmic st<strong>and</strong>ard<br />
a~tdprobleuu <strong>of</strong> plottitzg the<br />
deviation <strong>of</strong> abundances is too high, which means<br />
Species-Area cztrves<br />
that his points (not those I have plotted in Fig. This subject is almost a monopoly <strong>of</strong> plant<br />
17) are <strong>of</strong>ten above the RiacArthur line. perhaps ecologists. who set out "quadrats" <strong>of</strong> various<br />
approaching the canonical line.<br />
sizes <strong>and</strong> count the species in the quadrats. <strong>The</strong>y