Physics 241 Lab: Oscilloscope
Physics 241 Lab: Oscilloscope
Physics 241 Lab: Oscilloscope

Create successful ePaper yourself
Turn your PDF publications into a flip-book with our unique Google optimized e-Paper software.
<strong>Physics</strong> <strong>241</strong> <strong>Lab</strong>: <strong>Oscilloscope</strong><br />
Name:____________________________<br />
Section 1:<br />
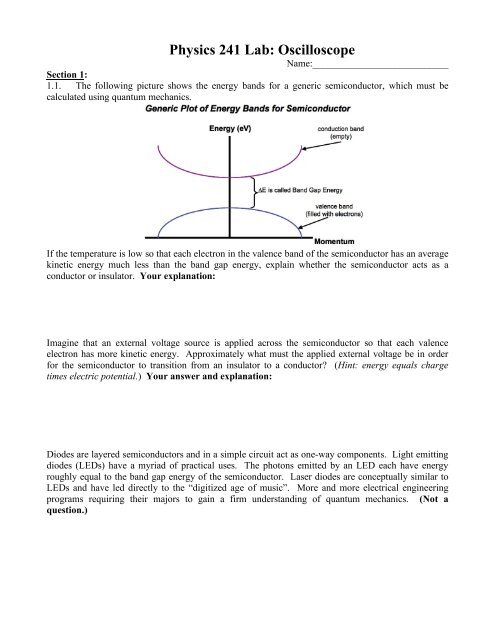
1.1. The following picture shows the energy bands for a generic semiconductor, which must be<br />
calculated using quantum mechanics.<br />
If the temperature is low so that each electron in the valence band of the semiconductor has an average<br />
kinetic energy much less than the band gap energy, explain whether the semiconductor acts as a<br />
conductor or insulator. Your explanation:<br />
Imagine that an external voltage source is applied across the semiconductor so that each valence<br />
electron has more kinetic energy. Approximately what must the applied external voltage be in order<br />
for the semiconductor to transition from an insulator to a conductor? (Hint: energy equals charge<br />
times electric potential.) Your answer and explanation:<br />
Diodes are layered semiconductors and in a simple circuit act as one-way components. Light emitting<br />
diodes (LEDs) have a myriad of practical uses. The photons emitted by an LED each have energy<br />
roughly equal to the band gap energy of the semiconductor. Laser diodes are conceptually similar to<br />
LEDs and have led directly to the “digitized age of music”. More and more electrical engineering<br />
programs requiring their majors to gain a firm understanding of quantum mechanics. (Not a<br />
question.)
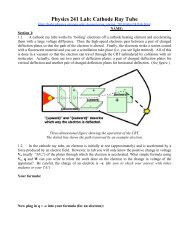
Section 2:<br />
2.1. Before actually using the oscilloscope, you need to be able to understand and predict what will<br />
appear on the oscilloscope screen. For the next few pages you will be asked predict what would<br />
appear on the oscilloscope screen, then later you will use the oscilloscope to make measurements. Feel<br />
free to experiment with your oscilloscope as you work through the prediction-making activities of this<br />
section.<br />
An oscilloscope is a device that measures voltage differences over time. It can be used to study<br />
rapidly oscillating voltages. For example, the voltage supplied by a wall outlet oscillates at the<br />
incredibly slow rate of 60 Hz. However, the oscilloscope can easily measure an oscillation of 1MHz<br />
or more.<br />
Most DMMs indicate that they can measure an oscillating voltage. However, a DMM can only<br />
make average measurements of sinusoidal 60 Hz voltages. In other words, a DMM is only useful for<br />
alternating current measurements (AC) on household circuits, not radios or other electronics.<br />
What is the period T of one oscillation for a linear frequency f = 5 MHz sinusoidal oscillating<br />
voltage? What is the angular frequency? Remember: T=1/f and ω=2πf. Your work and answers:<br />
2.2. The simplest way to use an oscilloscope is as a DMM measuring a constant voltage. Imagine<br />
you have a 1.5 Volt battery and you measure the voltage every second for 5 seconds. Make an<br />
imaginary data table. Then use the data table to make a graph of what you would see on the<br />
oscilloscope screen. Your oscilloscope allows you to control the size of the tick marks on its screen.<br />
FOR THIS PROBLEM ONLY you are provided a choice of axis settings and selection of origin. For<br />
all other problems, you will need to select the appropriate axis settings yourself. Connect your data<br />
points on your graph to demonstrate what the oscilloscope would really show. Fill out the data table<br />
and make your graph directly in the oscilloscope screen below.
!<br />
2.3. Now imagine you have a 6 Volt sinusoidal power supply with a<br />
frequency of 60 Hz. What is V MAX and V MIN for this voltage?<br />
_____________ and ___________ .<br />
What is the period of one oscillation? _________________<br />
Mathematically, this voltage is described as V (t) = 6sin(2" # 60# t) where<br />
2" # 60 is often referred to as the angular frequency, ω. Use this formula<br />
and a calculator to complete the given data table and make a graph on the<br />
oscilloscope. Be sure to label your axes and choose your units per<br />
division on the time axis wisely so that<br />
!<br />
all your data fits on the screen.
2.4. Now imagine you have two sinusoidal voltage signals. Both have a frequency of 60 Hz, but V 1<br />
has an amplitude of 6 Volts while V 2 has an amplitude of 12 Volts. Furthermore, V 2 lags behind V 1<br />
out of phase by 90 o . Without making a data table, sketch what would appear on the oscilloscope. Feel<br />
free to use a graphing calculator with the functions<br />
%<br />
V 1<br />
(t) = 6sin(2" # 60 # t) and V 2<br />
(t) =12sin 2" # 60# t $ " (<br />
'<br />
*.<br />
& 2 )<br />
Be sure to label your axes and choose appropriate time and voltage units per division for your graph.<br />
!
2.5. Finally, let’s imagine taking the two alternating voltage sources from the previous problem, but<br />
now graph V 1 (t) on the x-axis and V 2 (t) on the y-axis. In oscilloscope terminology, this is called an<br />
XY plot. Thus we are graphing V 2 vs. V 1 . Note: this is a voltage vs. voltage graph NOT a voltage vs.<br />
time graph. Make a data table using some points of common time provided below and the formulas<br />
from the previous sections. Use this table to graph V 2 vs. V 1 . Be sure to label your axes and choose<br />
appropriate voltage units per division for your graph.
Section 3:<br />
3.1. Use the oscilloscope to examine the voltage vs. time graphs of many different sine waves,<br />
square waves and saw tooth waves created by the function generator (oscillating voltage supply). Be<br />
sure to experiment with all sorts of frequencies, voltage amplitudes and DC offsets. Practice making<br />
the voltage functions fit nicely on the oscilloscope screen. Take the time to twiddle every knob and<br />
switch. Once you feel comfortable with your understanding of each operational control of the<br />
oscilloscope and function generator, write a short statement explaining what each control does.<br />
Describe the operation of the oscilloscope by writing a short description about the function of<br />
each knob, switch and button on the oscilloscope and function generator:
Section 4:<br />
4.1. Use the function generator to create a 5-volt sine wave with 1,000 Hz frequency. Use the<br />
oscilloscope (as shown in the picture below) to set the function generator amplitude correctly at 5.0<br />
Volts.<br />
Use this sinusoidal voltage to power a 1,000 Ω resistor. Use the oscilloscope to measure the voltage<br />
drop across the resistor (set up as shown in the picture below). What should the voltage drop across the<br />
resistor be according to conservation of energy? Be sure your measurement indicates this. Your<br />
answer and explanation:<br />
Now switch to a 10 Ω resistor and examine the voltage drop across it. Theoretically, this smaller<br />
resistor should still have the same 5 Volt difference (amplitude) as the 1,000 Ω resistor. However, you<br />
should notice the voltage amplitude decrease. This is a result of the function generator output<br />
changing. The smaller resistor will allow a greater current to flow through the circuit, but the function<br />
generator has a maximum current that it is able to produce. Therefore, once the resistance becomes<br />
low, the function generator cannot output the full 5 volts. Should you measure the amplitude of the<br />
source voltage coming from the function generator before or after you have hooked up the function<br />
generator to your circuit? Your answer and explanation:<br />
Use the equation I amplitude<br />
= V amplitude<br />
in with the 10 Ω resistor to find the maximum current amplitude<br />
R<br />
I amplitude,max that the function generator is able to produce. Your work and answer:<br />
!
Section 5:<br />
5.1. You may use the oscilloscope to measure two circuit components separately. Set up the<br />
function generator to output a 200 Hz square wave with 3 Volt amplitude through a 100 Ω and a 200 Ω<br />
resistor in series.<br />
Use the oscilloscope to measure the voltage across each resistor simultaneously on both<br />
channels by setting up a “bottom ground” (set up as shown in the figure). The voltage between red 1<br />
and ground will tell you the potential difference across both resistors while the voltage between red 2<br />
and ground will tell you the voltage across the 200 Ω resistor. What must you do mathematically to<br />
find the voltage across the 100 Ω resistor? Are the two oscillating voltages across the resistors in<br />
phase with each other? Determine the amplitudes of the voltage differences across each resistor and<br />
explain why this makes sense. Your answers and explanation:<br />
Now use the oscilloscope to measure the voltage across each resistor simultaneously on both<br />
channels by setting up a “middle ground” (set up as shown in the figure). Note that the middle ground<br />
measurement requires that the function generator NOT be grounded (use a 3-to-2 prong plug adapter).<br />
The voltage between red 1 and ground will tell you the potential difference across the 100 Ω resistor<br />
while the voltage between red 2 and ground will tell you the inverted voltage across the 200 Ω resistor.<br />
Are the two oscillating voltages across the resistors in phase with each other? Determine the<br />
amplitudes of the voltage differences across each resistor and explain why this makes sense. Your<br />
answers and explanation:
5.2. Using the same set up as in the last problem, measure the changing voltage across both resistors<br />
in “X-Y” mode. You should see an “ellipse edge on” i.e. a diagonal line. In section 2.5, you found an<br />
elliptical x-y graph because the voltages being plotted were out of phase. However, in today’s lab we<br />
don’t have any components that cause phase shifts (i.e. capacitors or inductors). Since both voltages<br />
are oscillating temporally in phase they will both reach zero simultaneously. Thus they will trace a<br />
diagonal line that some experimentalists simply consider an ellipse viewed “on-edge”. How does the<br />
height and width of the “ellipse” in your x-y measurement relate to the voltage amplitudes across each<br />
resistor? Be sure to compare “apples to apples” by not confusing the volts-per-div in the y-direction<br />
with a different volts-per-div in the x-direction. Your answer:<br />
Section 6:<br />
6.1. A diode is a one-way circuit component. If a potential difference is applied the wrong way<br />
across a diode, it will act as an infinite resistance and not conduct electricity. If a voltage is applied<br />
correctly across a diode and above a minimum value, the diode will act with zero resistance and allow<br />
the current to flow through it. This strange behavior is entirely quantum mechanical and non-Ohmic.<br />
Create the powered diode circuit with a light emitting diode (LED) in series with a resistor. On<br />
many diode boards, the diode is already soldered in series with a 330 Ω resistor. Do not forget the<br />
resistor as it protects the diode! Then set up your oscilloscope in the “bottom ground” set up to<br />
measure the voltage across the resistor on the y-axis and the applied voltage on the x-axis (see figure<br />
below).
6.2. Experimentally determine if the diode is Ohmic by constructing it’s current versus applied<br />
voltage graph (see figure below). Note that you cannot directly measure the current through the LED<br />
with the oscilloscope. Therefore, answer the following questions first in order to learn how to<br />
construct the I LED vs. V applied graph.<br />
In this circuit, how is the current through the LED related to the current through the resistor? Your<br />
explanation:<br />
Which component of your circuit is known to be Ohmic? Your answer:<br />
While the circuit is in operation, if you know the voltage across the resistor and its resistance, what can<br />
you find? Your answer:<br />
6.3. Your answers to the previous questions should help you understand that you need to measure<br />
the voltage across the resistor in order to find the current through the resistor. Therefore, you need to<br />
create the V R vs V applied graph and turn it into the I LED vs. V applied graph simply by dividing the y-values<br />
by the resistors resistance:<br />
!<br />
Make measurements to obtain the first graph and use it to calculate and create the second<br />
graph. Finally, your measurements allow you to experimentally obtain the quantum mechanical<br />
property of the material: the band gap energy E gap . Find the energy of the diode band gap energy using<br />
E band gap<br />
= q "V turn on<br />
. Select the value of q as that of the charge carrying particles in the circuit. Note<br />
that since you must use a middle ground measurement with the oscilloscope, one of the signals will<br />
always be inverted on your oscilloscope screen. Fix your sign of one column of your data to<br />
“uninvert” this graph. (Make graphs). Your measured E gap :
Report Guidelines: Write a separate section using the labels and instructions provided below. You<br />
may add diagrams and equations by hand to your final printout. However, images, text or equations<br />
plagiarized from the internet are not allowed!<br />
• Title – A catchy title worth zero points so make it fun.<br />
• Goals – Write a 3-4 sentence paragraph stating the experimental goals of the lab (the big<br />
picture). Do NOT state the learning goals (keep it scientific). [~1-point]<br />
• Concepts & Equations – [~5-points] Be sure to write a separate paragraph to explain each of<br />
the following concepts.<br />
o How does an oscilloscope work?<br />
• How/why do you measure time dependent voltage?<br />
• How/why do you measure two time dependent voltages?<br />
• How/why do you measure two voltages in an XY plot?<br />
• How do you use VOLTS/DIV and SECONDS/DIV to get numerical data from<br />
the oscilloscope screen?<br />
• How do you use all the other various knobs and levers on the oscilloscope?<br />
o What does a diode (or a light emitting diode) do in a circuit? Explain what we mean when<br />
we say that a diode is a one-way component.<br />
• Discuss the concept of time dependent voltages and how to measure them.<br />
• Discuss the theory and measurement of diodes.<br />
• Procedure & Results – Write a 2-4 sentence paragraph for each section of the lab describing<br />
what you did and what you found. Save any interpretation of your results for the conclusion.<br />
[~4-points]<br />
• Conclusion – Write at least three paragraphs where you analyze and interpret the results you<br />
observed or measured based upon your previous discussion of concepts and equations. It is all<br />
right to sound repetitive since it is important to get your scientific points across to your reader.<br />
Do NOT write personal statements or feeling about the learning process (keep it scientific).<br />
[~5-points]<br />
• Graphs – All graphs must be neatly hand-drawn during class, fill an entire sheet of graph<br />
paper, include a title, labeled axes, units on the axes, and the calculated line of best fit if<br />
applicable. [~5-points]<br />
o The two graphs from section 6.3.<br />
• Worksheet – thoroughly completed in class and signed by your TA. [~5-points.]