A Comprehensive Study of Dilute Magnetic ... - OPUS Würzburg
A Comprehensive Study of Dilute Magnetic ... - OPUS Würzburg
A Comprehensive Study of Dilute Magnetic ... - OPUS Würzburg

You also want an ePaper? Increase the reach of your titles
YUMPU automatically turns print PDFs into web optimized ePapers that Google loves.
7.2. Quantum dot coupled to both baths 87<br />
0.75<br />
0.70<br />
Γ<br />
0.65<br />
0.60<br />
35 40 45 50 55<br />
VmV<br />
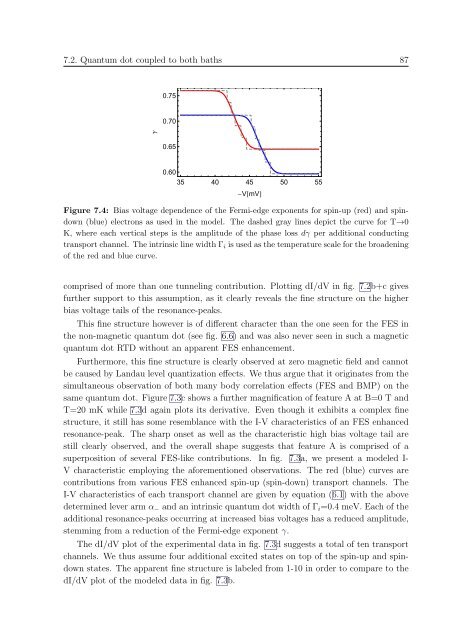
Figure 7.4: Bias voltage dependence <strong>of</strong> the Fermi-edge exponents for spin-up (red) and spindown<br />
(blue) electrons as used in the model. The dashed gray lines depict the curve for T→0<br />
K, where each vertical steps is the amplitude <strong>of</strong> the phase loss dγ per additional conducting<br />
transport channel. The intrinsic line width Γ i is used as the temperature scale for the broadening<br />
<strong>of</strong> the red and blue curve.<br />
comprised <strong>of</strong> more than one tunneling contribution. Plotting dI/dV in fig. 7.2b+c gives<br />
further support to this assumption, as it clearly reveals the fine structure on the higher<br />
bias voltage tails <strong>of</strong> the resonance-peaks.<br />
This fine structure however is <strong>of</strong> different character than the one seen for the FES in<br />
the non-magnetic quantum dot (see fig. 6.6) and was also never seen in such a magnetic<br />
quantum dot RTD without an apparent FES enhancement.<br />
Furthermore, this fine structure is clearly observed at zero magnetic field and cannot<br />
be caused by Landau level quantization effects. We thus argue that it originates from the<br />
simultaneous observation <strong>of</strong> both many body correlation effects (FES and BMP) on the<br />
same quantum dot. Figure 7.3c shows a further magnification <strong>of</strong> feature A at B=0 T and<br />
T=20 mK while 7.3d again plots its derivative. Even though it exhibits a complex fine<br />
structure, it still has some resemblance with the I-V characteristics <strong>of</strong> an FES enhanced<br />
resonance-peak. The sharp onset as well as the characteristic high bias voltage tail are<br />
still clearly observed, and the overall shape suggests that feature A is comprised <strong>of</strong> a<br />
superposition <strong>of</strong> several FES-like contributions. In fig. 7.3a, we present a modeled I-<br />
V characteristic employing the aforementioned observations. The red (blue) curves are<br />
contributions from various FES enhanced spin-up (spin-down) transport channels. The<br />
I-V characteristics <strong>of</strong> each transport channel are given by equation (6.1) with the above<br />
determined lever arm α − and an intrinsic quantum dot width <strong>of</strong> Γ i =0.4 meV. Each <strong>of</strong> the<br />
additional resonance-peaks occurring at increased bias voltages has a reduced amplitude,<br />
stemming from a reduction <strong>of</strong> the Fermi-edge exponent γ.<br />
The dI/dV plot <strong>of</strong> the experimental data in fig. 7.3d suggests a total <strong>of</strong> ten transport<br />
channels. We thus assume four additional excited states on top <strong>of</strong> the spin-up and spindown<br />
states. The apparent fine structure is labeled from 1-10 in order to compare to the<br />
dI/dV plot <strong>of</strong> the modeled data in fig. 7.3b.