Wire & Cable R i l St d egional Study - Integer Research
Wire & Cable R i l St d egional Study - Integer Research
Wire & Cable R i l St d egional Study - Integer Research

Create successful ePaper yourself
Turn your PDF publications into a flip-book with our unique Google optimized e-Paper software.
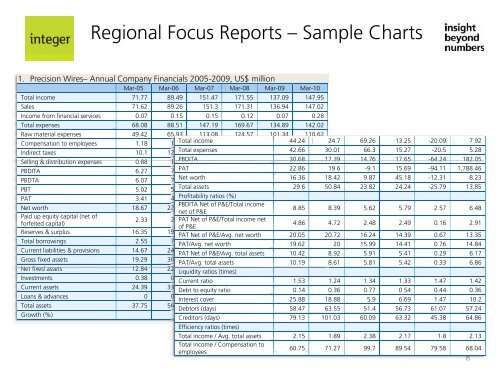
R<strong>egional</strong> Focus Reports – Sample Charts<br />
1. Precision <strong>Wire</strong>s– Annual Company Financials 2005-2009, US$ million<br />
Mar-05 Mar-06 Mar-07 Mar-08 Mar-09 Mar-10<br />
Total income 71.77 89.49 151.47 171.55 137.09 147.95<br />
Sales 71.62 89.26 151.3 171.31 136.94 147.02<br />
Income from financial services 0.07 0.15 0.15 0.12 0.07 0.28<br />
Total expenses 68.08 88.51 147.19 169.67 134.89 142.02<br />
Raw material expenses 49.42 65.93 113.08 124.57 101.34 110.62<br />
Compensation to employees 1.18 1.26<br />
Total income<br />
1.52 1.92 1.72<br />
44.24<br />
2.17<br />
24.7 69.26 13.25 -20.09 7.92<br />
Indirect taxes 10.1 12.71<br />
Total expenses<br />
21.88 28.72 19.98<br />
42.66<br />
14.11<br />
30.01 66.3 15.27 -20.5 5.28<br />
Selling &distribution ib ti expenses 088 0.88 105 1.05 PBDITA<br />
116 1.16 144 1.44 139 1.39 30.68 151 1.51<br />
17.39 14.76 17.65 -64.24 182.05<br />
PBDITA 6.27 7.36<br />
PAT<br />
8.45 9.94 3.55<br />
22.86<br />
10.02<br />
19.6 -9.1 15.69 -94.11 1,788.46<br />
PBDTA 6.07 7.02<br />
Net worth<br />
7.29 8.79 2.69<br />
16.36<br />
9.31<br />
18.42 9.87 45.18 -12.31 8.23<br />
PBT 5.02 5.95<br />
Total assets<br />
5.62 6.55 0.44<br />
29.6<br />
7.02<br />
50.84 23.82 24.24 -25.79 13.85<br />
PAT 3.41 4.08<br />
Profitability<br />
3.71<br />
ratios (%)<br />
4.29 0.25 4.77<br />
PBDITA Net of P&E/Total income<br />
Net worth 18.67 22.09 24.26 35.22 30.88 8.85 33.42 8.39 5.62 5.79 2.57 6.48<br />
net of P&E<br />
Pid Paid up equity capital (net of<br />
2.33 2.36 PAT Net of 2.31 P&E/Total income 2.87 net 2.52 2.44<br />
forfeited capital)<br />
4.86 4.72 2.48 2.49 0.16 2.91<br />
of P&E<br />
Reserves & surplus 16.35 19.72<br />
PAT Net of<br />
21.95<br />
P&E/Avg. net<br />
32.35<br />
worth<br />
28.36<br />
20.05<br />
30.98<br />
20.72 16.24 14.39 0.67 13.35<br />
Total borrowings 2.55 7.99<br />
PAT/Avg.<br />
18.68<br />
net worth<br />
18.98 13.67<br />
19.62<br />
11.91<br />
20 15.99 14.41 0.76 14.84<br />
Current liabilities & provisions 14.67 24.55<br />
PAT Net of<br />
24.59<br />
P&E/Avg. total<br />
29.55<br />
assets<br />
16.78<br />
10.42<br />
24.92<br />
8.92 5.91 5.41 0.29 6.17<br />
Gross fixed assets 19.29 30.21<br />
PAT/Avg.<br />
35.72<br />
total assets<br />
45.07 42.37<br />
10.19<br />
42.65<br />
8.61 5.81 5.42 0.33 6.86<br />
Net fixed assets 12.84 22.67 Liquidity ratios 26.7 (times)<br />
32.71 29.33 27.84<br />
Investments 0.38 0.49<br />
Current ratio<br />
1.37 0.04 0.03<br />
1.53 1.24 1.34 1.33 1.47 1.42<br />
Current assets 24.39 33.65<br />
Debt to equity<br />
41.39<br />
ratio<br />
54.76 35.42<br />
0.14<br />
46.08<br />
0.36 0.77 0.54 0.44 0.36<br />
Loans & advances 0 0.01<br />
Interest cover<br />
0.01 0 0<br />
25.88 18.88 5.9 6.69 1.47 10.2<br />
Total assets 37.75 56.94<br />
Debtors (days)<br />
70.5 87.59 65.01<br />
58.47<br />
74.01<br />
63.55 51.4 56.73 61.07 57.24<br />
Growth (%)<br />
Creditors (days) 79.13 101.03 60.09 63.32 45.38 64.86<br />
Efficiency ratios (times)<br />
Total income / Avg. total assets 2.15 1.89 2.38 2.17 1.8 2.13<br />
Total income / Compensation to<br />
employees<br />
60.75 71.27 99.7 89.54 79.58 68.04<br />
8