Download Presentation (pdf) - International Pipeline Conference
Download Presentation (pdf) - International Pipeline Conference
Download Presentation (pdf) - International Pipeline Conference

Create successful ePaper yourself
Turn your PDF publications into a flip-book with our unique Google optimized e-Paper software.
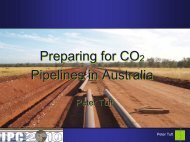
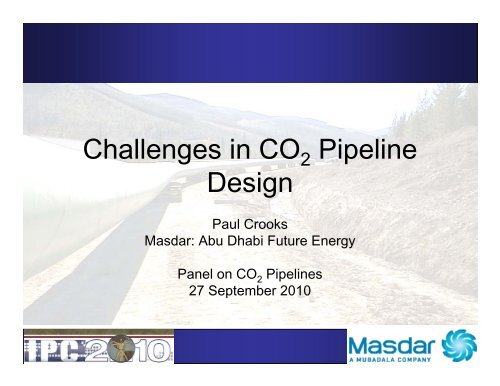
Challenges in CO 2 <strong>Pipeline</strong><br />
Design<br />
Paul Crooks<br />
Masdar: Abu Dhabi Future Energy<br />
Panel on CO 2 <strong>Pipeline</strong>s<br />
27 September 2010
Introduction to Masdar – its Mission<br />
• Masdar is Abu Dhabi’s future energy initiative<br />
• It is a wholly-owned subsidiary of the Mubadala<br />
Development Company
Introduction to Masdar – its Business<br />
Units
Abu Dhabi CCS Project<br />
• Create a national Carbon Capture,<br />
Usage & Storage network<br />
–CO 2 capture from power & industrial<br />
sources<br />
– Transportation pipelines<br />
– Injection in oil reservoirs for EOR<br />
• Technical potential for 30 million Tons<br />
by 2030<br />
• Phased approach:<br />
Phase 1, ~6 million Tons of CO 2<br />
• Build an early model of large scale<br />
commercial stage application
CCS Project Phase 1 - FEED<br />
• FEED Completed 2008 -2010 by Mustang / JPK<br />
– Pressure: 90, 230, 245barg (min., MAOP, DP)<br />
– Temperature: 13, 30, 65 o C (min., Normal, DT)<br />
– Throughput: 6.2MT/a, CO 2 Dense Phase<br />
• <strong>Pipeline</strong> Network:<br />
– Design complete with all route approvals<br />
– Initially 179km <strong>Pipeline</strong>, Additional 318km with Phase<br />
development<br />
–CO 2 sources: Steel, Processing and Power Industries<br />
– Delivery to ADCO Oil Fields for EOR
CCS Project Phase 1 - FEED<br />
• Significant challenges in Design & Material choices.<br />
– Exacerbated by lack of Recommended Practices for<br />
CO 2 <strong>Pipeline</strong>s<br />
• Challenges:<br />
– Flow Modelling, Phase Issues and System Hydraulics<br />
– <strong>Pipeline</strong> Operating Pressure, Running Ductile Fracture<br />
and required Wall Thickness<br />
– Risk Assessment and Dispersion Modelling<br />
– <strong>Pipeline</strong> Design Factors and Population Densities<br />
– Water content and <strong>Pipeline</strong> Integrity during Blowdown
Hydraulics and Flow Modeling<br />
• CO 2 composition worst case used – Future-Proof <strong>Pipeline</strong><br />
– CO 2 composition > 95% purity - Balance: H 2 S, H 2 , CO, N 2 , O 2 , etc<br />
• Static hydraulics: ASPEN HYSIS<br />
– PR Equations of State – checked against NIST CO 2 properties<br />
• Dynamic Flow Assurance: OLGA<br />
– OLGA model – checked against NIST CO 2 properties<br />
• Good comparison: 1% – 4% variation<br />
• Surge analysis: within Design Margin (< 245barg)<br />
• Hydraulic Flow Modeling Issues:<br />
– Lack of validated CO 2 + Impurities Physical Properties data<br />
– Lack of validated CO 2 Hydraulic Models with actual flow data<br />
• Operating at high pressure: increased margin to uncertain areas<br />
of physical data/modelling.
Operating Pressure, Ductile Fracture<br />
and <strong>Pipeline</strong> Wall Thickness<br />
• Operating & Design Pressure a function of:<br />
– Min Pressure - 90barg (no two phase transition),<br />
practically110barg<br />
– Network line losses: 40-50barg<br />
– Source Compression Power<br />
• <strong>Pipeline</strong> Wall Thickness a function of:<br />
– Hoop stress: 1500# in all cases<br />
– Ductile Fracture Arrest: Wall thickness and toughness<br />
of steel<br />
• Masdar Design considered:<br />
– PSL2 X65 Pipe, NACE, toughness values (27J – 60J)<br />
;no premium for pipe<br />
– Wall Thickness: Battelle Two Curve method
Operating Pressure, Ductile Fracture<br />
and <strong>Pipeline</strong> Wall Thickness<br />
“Race”<br />
Velocity of crack propagation<br />
And<br />
Depressurization wave<br />
Aim: Keep crack propagation velocity > Depressurization wave
Operating Pressure, Ductile Fracture<br />
and <strong>Pipeline</strong> Wall Thickness<br />
• For a Design Pressure of ~175barg<br />
– WT CA<br />
> WT HS<br />
for readily available steels (toughness < 120J)<br />
– Premium for material and operating below capacity of pipeline<br />
• For a Design Pressure of 245barg<br />
– WT HS<br />
> WT CA<br />
for steels with toughness: 27J and 60J<br />
– No premium for material and operating at capacity of pipeline<br />
• Benefits of High Pressure Design<br />
– Compression at source, delivery to wellhead at ~170barg. Limited sink<br />
compression required<br />
– Line sizes for given throughput reduced<br />
– Overall cost reduction for <strong>Pipeline</strong> Network Operations ref [King]<br />
• Possible Disadvantages of Design<br />
– Wall thickness limits vendors capable of ERW/SAW pipe<br />
– More complex welding procedures: (wall thickness, NACE, high toughness)<br />
– Perceived increased hazard of Operating at High Pressure
Risk Assessment & Dispersion<br />
Modelling<br />
• Risk Assessment by conventional methods<br />
– Frequency assessment: leak data from hydrocarbon<br />
industry<br />
– Consequence Modelling: exposure criteria for lethality<br />
• CO 2 dispersion based on conventional methods<br />
– Release rates based on MAOP and postulated hole size<br />
– Horizontal jet plume followed by passive dispersion<br />
• But…<br />
– The behaviour of CO 2 on release not like Hydrocarbon<br />
– Lack of validated models to match plume behaviour with<br />
reality
Risk Assessment & Dispersion<br />
Modelling<br />
• Release model behaviour determined in FEED:<br />
– Ductile Fracture release model [King]<br />
– Mustang/JPK <strong>Pipeline</strong> Blowdown Simulations<br />
• CO 2 Consequence modelling effects therefore<br />
conservative and potentially misleading<br />
– Consequence dispersion: 235barg as compared to
• Start Pressure 175barg<br />
• CO 2<br />
rapidly moves from<br />
single to multi phase<br />
• Liquid/Vapour/Solid<br />
• Discharge Pressure rapidly<br />
settles < 80barg<br />
• Highly Chocked flow with<br />
low sonic velocity<br />
• Phenomena occurs at<br />
higher operating<br />
pressures as well<br />
• Discharge Pressure<br />
rapidly < 80barg<br />
• Start Pressure 245barg
• Full bore blowdown<br />
• Rapid settle out to less than 60barg in<br />
all cases<br />
• Start Pressure 235barg
<strong>Pipeline</strong> Design Factors<br />
• <strong>Pipeline</strong> design to B31.4<br />
– Design Factor of 0.72 with no guidance on proximity<br />
– Conservatively applied B31.8 criteria for <strong>Pipeline</strong> Location Class<br />
• Majority of the <strong>Pipeline</strong> Route is Location Class 1 and OK<br />
• Loc Class 3 & 4 areas:<br />
– For High Pressure Op: Wall Thickness over ½ inch for 8, 12, 14inch Pipe<br />
– Manufacturing issues for ERW pipe<br />
• Consider Providing alternate protection methods aside from Pipe Wall<br />
– Providing Concrete Slabs in Populated Loc Class 4 areas<br />
– Providing Fibre Optic leak Detection throughout pipeline<br />
• Optimisation of <strong>Pipeline</strong> Wall Thickness ongoing:<br />
– Release of recent DNV Recommended Practice for CO 2<br />
<strong>Pipeline</strong>s<br />
– Benefits of wall thickness > ½ inch<br />
Design Factor Loc Class 1 Loc Class 2 Loc Class 3 Loc Class 4<br />
B31.8 0.72 0.6 0.5 0.4<br />
DNV RP J202 0.83 0.77 0.67 0.55
Water Content and Blowdown<br />
• Avoidance free water in CO 2 systems well documented<br />
– Need to consider Operating conditions and Environmental<br />
conditions when setting water content<br />
• US and European Design: water content typically<br />
Water Content and Blowdown<br />
• However - Design Issue associated with Blowdown<br />
– Depending on blowdown rate: rapid cooling of the CO 2 stream,<br />
Steel temperatures in area of Blowdown fall to -80 o C / -20 o C<br />
– Maintenance Blowdown not time critical: reduce rate to ensure<br />
temperatures remain above -29 o C<br />
• For a 12” <strong>Pipeline</strong>, a typical <strong>Pipeline</strong> section between Block<br />
Valves (32km) via 2” Blowdown Valve (for UAE conditions):<br />
– Water Drop out occurs for initial water contents above 10lb/mmscf<br />
– Reducing water content to less than 10lb/MMSCF involves<br />
considerable CAPEX/OPEX<br />
• For UAE conditions, design to 40lb/MMSCF and manage<br />
Blowdown<br />
– Manage <strong>Pipeline</strong> Blowdown to a rare occurrence<br />
– Manage at reduced rate to avoid temperature impacts<br />
– Nitrogen sweep after Blowdown to remove free water
• Reduced blowdown rate<br />
ensures temperatures<br />
remain above min pipe wall<br />
temperatures
• Majority of water drop out resaturated<br />
on recovery of <strong>Pipeline</strong><br />
Temp after Blowdown<br />
• Water Drop out increases 7<br />
fold above 40lb/mmscf initial<br />
water content
Other Design/Operating Issues<br />
• Other issues not specifically mentioned:<br />
–CO 2 environment valve, gasket, etc materials<br />
– Leak detection – use of Fibre Optics along with<br />
SCADA<br />
– Start-Up methodology and use of Nitrogen<br />
– Pigging – no lubricated environment<br />
– Booster Pumps vs Compression
Summary<br />
• Design of CO 2 systems must consider safety<br />
– Need for CO 2 system Design Guidance is critical<br />
• Impact of impurities<br />
– Hydraulics, Dew Point, Crack Propagation: Future Proof<br />
• <strong>Pipeline</strong> operating pressure and wall thickness<br />
– Ductile Fracture a controlling element<br />
• CO 2 Dispersion modelling needs validation<br />
– Behaviour of CO 2 in near field should be paramount<br />
• <strong>Pipeline</strong> Design Factors<br />
– Optimisation and use of alternates<br />
• Initial Water content is application and environment specific<br />
– In UAE – operation with higher water content: avoids high cost of<br />
dehydration<br />
– Need to control Blowdown is critical
Thank You for your attention