Better Crops 2004 #2 - International Plant Nutrition Institute
Better Crops 2004 #2 - International Plant Nutrition Institute
Better Crops 2004 #2 - International Plant Nutrition Institute

You also want an ePaper? Increase the reach of your titles
YUMPU automatically turns print PDFs into web optimized ePapers that Google loves.
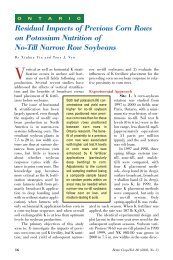
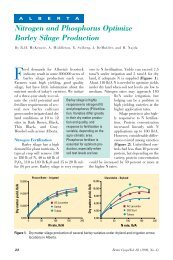
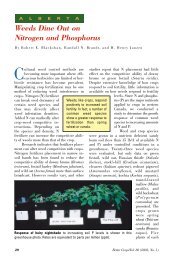
Figur<br />
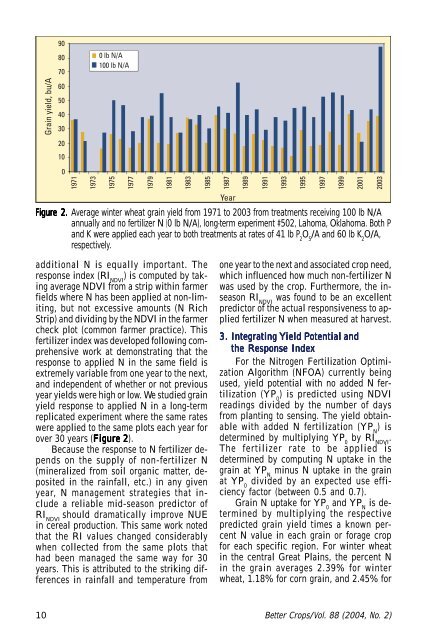
igure e 2. Average winter wheat grain yield from 1971 to 2003 from treatments receiving 100 lb N/A<br />
annually and no fertilizer N (0 lb N/A), long-term experiment #502, Lahoma, Oklahoma. Both P<br />
and K were applied each year to both treatments at rates of 41 lb P 2<br />
O 5<br />
/A and 60 lb K 2<br />
O/A,<br />
respectively.<br />
additional N is equally important. The<br />
response index (RI NDVI<br />
) is computed by taking<br />
average NDVI from a strip within farmer<br />
fields where N has been applied at non-limiting,<br />
but not excessive amounts (N Rich<br />
Strip) and dividing by the NDVI in the farmer<br />
check plot (common farmer practice). This<br />
fertilizer index was developed following comprehensive<br />
work at demonstrating that the<br />
response to applied N in the same field is<br />
extremely variable from one year to the next,<br />
and independent of whether or not previous<br />
year yields were high or low. We studied grain<br />
yield response to applied N in a long-term<br />
replicated experiment where the same rates<br />
were applied to the same plots each year for<br />
over 30 years (Figure 2).<br />
Because the response to N fertilizer depends<br />
on the supply of non-fertilizer N<br />
(mineralized from soil organic matter, deposited<br />
in the rainfall, etc.) in any given<br />
year, N management strategies that include<br />
a reliable mid-season predictor of<br />
RI NDVI<br />
should dramatically improve NUE<br />
in cereal production. This same work noted<br />
that the RI values changed considerably<br />
when collected from the same plots that<br />
had been managed the same way for 30<br />
years. This is attributed to the striking differences<br />
in rainfall and temperature from<br />
one year to the next and associated crop need,<br />
which influenced how much non-fertilizer N<br />
was used by the crop. Furthermore, the inseason<br />
RI NDVI<br />
was found to be an excellent<br />
predictor of the actual responsiveness to applied<br />
fertilizer N when measured at harvest.<br />
3. Integrating Yield Potential and<br />
the Response Index<br />
For the Nitrogen Fertilization Optimization<br />
Algorithm (NFOA) currently being<br />
used, yield potential with no added N fertilization<br />
(YP 0<br />
) is predicted using NDVI<br />
readings divided by the number of days<br />
from planting to sensing. The yield obtainable<br />
with added N fertilization (YP N<br />
) is<br />
determined by multiplying YP 0<br />
by RI NDVI<br />
.<br />
The fertilizer rate to be applied is<br />
determined by computing N uptake in the<br />
grain at YP N<br />
minus N uptake in the grain<br />
at YP 0<br />
divided by an expected use efficiency<br />
factor (between 0.5 and 0.7).<br />
Grain N uptake for YP 0<br />
and YP N<br />
is determined<br />
by multiplying the respective<br />
predicted grain yield times a known percent<br />
N value in each grain or forage crop<br />
for each specific region. For winter wheat<br />
in the central Great Plains, the percent N<br />
in the grain averages 2.39% for winter<br />
wheat, 1.18% for corn grain, and 2.45% for<br />
10 <strong>Better</strong> <strong>Crops</strong>/Vol. 88 (<strong>2004</strong>, No. 2)