Better Crops 2004 #2 - International Plant Nutrition Institute
Better Crops 2004 #2 - International Plant Nutrition Institute
Better Crops 2004 #2 - International Plant Nutrition Institute

You also want an ePaper? Increase the reach of your titles
YUMPU automatically turns print PDFs into web optimized ePapers that Google loves.
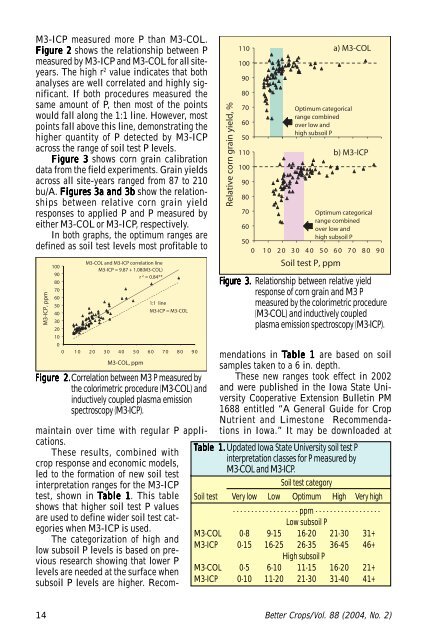
M3-ICP measured more P than M3-COL.<br />
Figure 2 shows the relationship between P<br />
measured by M3-ICP and M3-COL for all siteyears.<br />
The high r 2 value indicates that both<br />
analyses are well correlated and highly significant.<br />
If both procedures measured the<br />
same amount of P, then most of the points<br />
would fall along the 1:1 line. However, most<br />
points fall above this line, demonstrating the<br />
higher quantity of P detected by M3-ICP<br />
across the range of soil test P levels.<br />
Figure 3 shows corn grain calibration<br />
data from the field experiments. Grain yields<br />
across all site-years ranged from 87 to 210<br />
bu/A. Figures 3a and 3b show the relationships<br />
between relative corn grain yield<br />
responses to applied P and P measured by<br />
either M3-COL or M3-ICP, respectively.<br />
In both graphs, the optimum ranges are<br />
defined as soil test levels most profitable to<br />
Figur<br />
igure e 3. Relationship between relative yield<br />
response of corn grain and M3 P<br />
measured by the colorimetric procedure<br />
(M3-COL) and inductively coupled<br />
plasma emission spectroscopy (M3-ICP).<br />
Figure 2.Correlation between M3 P measured by<br />
the colorimetric procedure (M3-COL) and<br />
inductively coupled plasma emission<br />
spectroscopy (M3-ICP).<br />
maintain over time with regular P applications.<br />
These results, combined with<br />
Table 1.Updated Iowa State University soil test P<br />
crop response and economic models,<br />
interpretation classes for P measured by<br />
M3-COL and M3-ICP.<br />
led to the formation of new soil test<br />
interpretation ranges for the M3-ICP<br />
Soil test category<br />
test, shown in Table 1. This table Soil test Very low Low Optimum High Very high<br />
shows that higher soil test P values<br />
- - - - - - - - - - - - - - - - - - ppm - - - - - - - - - - - - - - - - - -<br />
are used to define wider soil test categories<br />
when M3-ICP is used.<br />
Low subsoil P<br />
M3-COL 0-8 9-15 16-20 21-30 31+<br />
The categorization of high and<br />
M3-ICP 0-15 16-25 26-35 36-45 46+<br />
low subsoil P levels is based on previous<br />
research showing that lower P<br />
High subsoil P<br />
M3-COL 0-5 6-10 11-15 16-20 21+<br />
levels are needed at the surface when<br />
subsoil P levels are higher. Recom-<br />
M3-ICP 0-10 11-20 21-30 31-40 41+<br />
mendations in Table 1 are based on soil<br />
samples taken to a 6 in. depth.<br />
These new ranges took effect in 2002<br />
and were published in the Iowa State University<br />
Cooperative Extension Bulletin PM<br />
1688 entitled “A General Guide for Crop<br />
Nutrient and Limestone Recommendations<br />
in Iowa.” It may be downloaded at<br />
14 <strong>Better</strong> <strong>Crops</strong>/Vol. 88 (<strong>2004</strong>, No. 2)