Better Crops 2004 #2 - International Plant Nutrition Institute
Better Crops 2004 #2 - International Plant Nutrition Institute
Better Crops 2004 #2 - International Plant Nutrition Institute

You also want an ePaper? Increase the reach of your titles
YUMPU automatically turns print PDFs into web optimized ePapers that Google loves.
C O N T E N T S<br />
Will We Run Out of Phosphorus? 3<br />
David W. Dibb<br />
Vol. LXXXVIII (88) <strong>2004</strong>, No. 2<br />
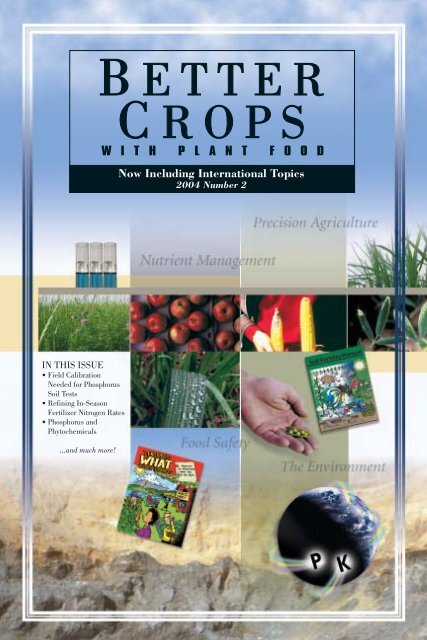
Our Cover: Images reflect the dynamic topics of crop nutrition and<br />
soil fertility.<br />
Cover Design: A&S Creative<br />
Editor: Donald L. Armstrong<br />
Assistant Editor: Katherine P. Griffin<br />
Circulation Manager: Carol Mees<br />
Design: Kathy Hefner<br />
Potash & Phosphate <strong>Institute</strong> (PPI)<br />
M.M. Wilson, Chairman of the Board<br />
Agrium Inc.<br />
W.J. Doyle, Vice Chairman of the Board<br />
PotashCorp<br />
D.A. Pertz, Chairman, Finance Committee<br />
IMC Global Inc.<br />
HEADQUARTERS: NORCROSS, GEORGIA, U.S.A.<br />
D.W. Dibb, President<br />
T.L. Roberts, Vice President, PPI and<br />
Vice President, PPIC, Latin America<br />
C.V. Holcomb, Assistant Treasurer<br />
S.J. Couch, IT Manager<br />
B. Rose, Statistics/Accounting<br />
NORTH AMERICAN PROGRAMS-Brookings, South Dakota<br />
P.E. Fixen, Senior Vice President, North American Program<br />
Coordinator, and Director of Research<br />
P. Pates, Secretary<br />
REGIONAL DIRECTORS-North America<br />
T.W. Bruulsema, Guelph, Ontario<br />
A.M. Johnston, Saskatoon, Saskatchewan<br />
R.L. Mikkelsen, Davis, California<br />
T.S. Murrell, Woodbury, Minnesota<br />
C.S. Snyder, Conway, Arkansas<br />
W.M. Stewart, San Antonio, Texas<br />
INTERNATIONAL PROGRAMS-Saskatoon, Saskatchewan<br />
M.D. Stauffer, Senior Vice President, <strong>International</strong><br />
Programs (PPI), and President, Potash &<br />
Phosphate <strong>Institute</strong> of Canada (PPIC)<br />
L.M. Doell, Corporate Secretary and Administrative<br />
Assistant<br />
G. Sulewski, Agronomist<br />
INTERNATIONAL PROGRAM LOCATIONS<br />
Brazil T. Yamada, POTAFOS, Piracicaba<br />
China Ji-yun Jin, Beijing<br />
Fang Chen, Wuhan<br />
Shihua Tu, Chengdu<br />
India K.N. Tiwari, Gurgaon, Haryana<br />
T.N. Rao, Hyderabad, Andhra Pradesh<br />
K. Majumdar, Calcutta (Kolkata), West Bengal<br />
Northern Latin America J. Espinosa, Quito, Ecuador<br />
Latin America-Southern Cone F.O. Garcia, Buenos Aires, Argentina<br />
Southeast Asia C. Witt, Singapore<br />
BETTER CROPS WITH PLANT FOOD<br />
(ISSN:0006-0089) is published quarterly by the Potash & Phosphate<br />
<strong>Institute</strong> (PPI). Periodicals postage paid at Norcross, GA, and at<br />
additional mailing offices (USPS 012-713). Subscription free on<br />
request to qualified individuals; others $8.00 per year or $2.00 per<br />
issue. POSTMASTER: Send address changes to <strong>Better</strong> <strong>Crops</strong> with <strong>Plant</strong><br />
Food, 655 Engineering Drive, Suite 110, Norcross, GA 30092-2837.<br />
Phone (770) 447-0335; fax (770) 448-0439. www.ppi-ppic.org.<br />
Copyright <strong>2004</strong> by Potash & Phosphate <strong>Institute</strong>.<br />
Soil Fertility Manual Revised Edition Available<br />
5<br />
Phosphorus and Phytochemicals (Ontario) 6<br />
T.W. Bruulsema, G. Paliyath, A. Schofield,<br />
and M. Oke<br />
In-Season Fertilizer Nitrogen Rates Using 8<br />
Predicted Yield Potential and the<br />
Response Index (Oklahoma)<br />
W.R. Raun, G.V. Johnson, J.B. Solie,<br />
M.L. Stone, K.L. Martin, and K.W. Freeman<br />
Detecting Phosphorus with Plasma Emission 12<br />
Spectroscopy May Require Unique Field<br />
Calibration Data (Iowa)<br />
Antonio P. Mallarino and T. Scott Murrell<br />
New Publication Offers Insight about 15<br />
Food Quality/Safety Concerns<br />
Greensand as a Soil Amendment (New Jersey) 16<br />
J.R. Heckman and J.C.F. Tedrow<br />
Cropping System Impact on Phosphorus 18<br />
Management of Flax (Western Canada)<br />
C.A. Grant, M. Monreal, D.D. Derksen,<br />
R.B. Irvine, D. McLaren, R.M. Mohr, and<br />
J.J. Schoneau<br />
PKalc Software Checks Nutrient Balance 20<br />
INTERNATIONAL TIONAL SECTION<br />
Site-Specific Nutrient Management for 21<br />
Optimal Foodgrain Production in Haryana<br />
(India)<br />
K.S. Yadav and Hira Nand<br />
Alfalfa Production as a Function of 24<br />
Soil Extractable Phosphorus in the<br />
Semi-arid Pampas (Argentina)<br />
Martín Díaz-Zorita and Daniel E. Buschiazzo<br />
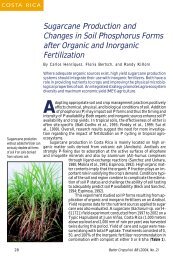
Sugarcane Production and Changes in 28<br />
Soil Phosphorus Forms after Organic and<br />
Inorganic Fertilization (Costa Rica)<br />
Carlos Henríquez, Floria Bertsch,<br />
and Randy Killorn<br />
PPI/PPIC on the Web: www.ppi-ppic.org<br />
31<br />
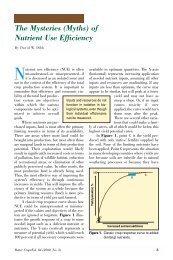
Commentary: Limitations of the Mind 32<br />
M.D. Stauffer<br />
Members: Agrium Inc. • Cargill Crop <strong>Nutrition</strong> • IMC Global Inc.<br />
Intrepid Mining, LLC/Moab Potash • PotashCorp • Simplot • Yara <strong>International</strong>
Will We Run Out of Phosphorus?<br />
By David W. Dibb<br />
The question occasionally arises as to whether the world will eventually use all the<br />
supply and reserves of an essential nutrient such as phosphorus (P). This article<br />
gives a brief explanation of why there is no danger of running out of P sources.<br />
Will we run out of P fertilizer for<br />
food production? The short and<br />
definitive answer is “no.” How<br />
can that assertion be absolute? Phosphorus<br />
is one of the most abundant basic mineral<br />
elements on the earth. Phosphorus is a<br />
necessary component for all living organisms.<br />
The form of P can be changed, the<br />
location can be changed, but the total mass<br />
(the total existing amount of P) is unchanged.<br />
The availability of P for use in food<br />
production…and thus availability to living<br />
organisms…depends on our ability to recover<br />
P from wherever it resides and place<br />
it near the plants that produce food and<br />
become the energy source for all living<br />
things…in a form plants can use.<br />
Currently<br />
ently, , there e is abundant P avail-<br />
able to produce food. In large part, this is<br />
because we have learned to extract P from<br />
large mineral phosphate rock deposits,<br />
convert it to a form that is more available<br />
to plants, and deliver it to farmers, who<br />
Concentrat<br />
ated<br />
phosphate rock deposits are the main<br />
source of P fertilizers today.<br />
apply the P to their crops and produce our<br />
food. This process is the foundation of the<br />
current commercial P fertilizer industry.<br />
Some of the P we need to make our<br />
bodies function properly comes to us directly<br />
in vegetables, fruits, grains, etc. Some<br />
comes to us indirectly through animal products<br />
such as meat, milk, and eggs. Some is<br />
consumed in vitamin or mineral supplements.<br />
All of this P originally came from<br />
one of the naturally occurring mineral P<br />
deposits…whether from the sources that<br />
were concentrated in phosphate rock deposits,<br />
or from those diffused in soils during<br />
their natural development processes. As<br />
crops are grown and as P is removed from<br />
soils, P has to be replaced to sustain the<br />
potential to produce more food. This replacement<br />
represents the current practice<br />
of crop fertilization.<br />
But, what about when all of these mineral<br />
deposits we are mining are depleted?<br />
Will that happen soon? When it does, will<br />
we run out of P for food production? Again,<br />
the definitive answer is “NO<br />
NO.” To understand<br />
why, we need to take a look at historical<br />
uses and sources of P for food production,<br />
what is happening today, the current<br />
reserves of P, and some possible other<br />
sources of P for the future. With this perspective,<br />
we will be able to understand why<br />
the world will not run out of P.<br />
First, consider the historical use of P<br />
in food production.<br />
We all know the story<br />
of how the Native Americans showed the<br />
early Pilgrims in colonial times how to put<br />
a fish in the hole where corn seeds were<br />
planted in order to produce more abundant<br />
crops. As the fish decomposed, needed P<br />
<strong>Better</strong> <strong>Crops</strong>/Vol. 88 (<strong>2004</strong>, No. 2) 3
and other nutrients were supplied to the corn<br />
plants. Others learned that manures from animals<br />
would also supply some of the P needs<br />
for crops. Crop residues contain P and, if returned<br />
to the soil, helped maintain the P supply.<br />
As human and animal populations increased,<br />
there were not sufficient supplies of<br />
fish, manure, or crop residues to maintain soil<br />
fertility and productivity. Many soils were depleted<br />
of P and other nutrients. In fact, the<br />
early migration of people from the east coast<br />
of the U.S. to more fertile lands further west<br />
was in part because of the depletion of soil<br />
fertility of those early-farmed lands. The inability<br />
of those who grew crops to replace the<br />
nutrients they had removed resulted in those<br />
lands, which were depleted of nutrients, being<br />
abandoned for more productive lands in<br />
the frontier.<br />
New sources of P were found. Bones were<br />
known to be rich in P. Ground bonemeal from<br />
slaughtered animals became a source of nutrient<br />
P. Blood meal, fishmeal, and other<br />
sources of P became commercially available.<br />
Supply was insufficient to sustain P levels<br />
and the productivity of soils declined.<br />
Advances in chemistry opened up a new,<br />
abundant source of P. Newly discovered concentrated<br />
phosphate rock deposits could be<br />
treated with acids similar to those occurring<br />
naturally in soils. Phosphorus could be made<br />
available to plants and could be concentrated<br />
and transported in a highly efficient form to<br />
the farmer. This was the birth of today’s<br />
commercial P fertilizer businesses. Some<br />
phosphate rock deposits have been mined<br />
and depleted and other commercially viable<br />
deposits have been located and started into<br />
production. Other deposits remain unused…<br />
and under current economics are not considered<br />
useful. Under newer extraction and<br />
process technology, and with different<br />
economics, many of these deposits will later<br />
become sources of P.<br />
As part of our historical look at P, compare<br />
today’s known phosphate rock reserves<br />
to those of 50 years ago, and what the usage<br />
was then and now. See Table 1.<br />
Several interesting facts emerge from this<br />
table and from supporting data:<br />
• Since 1953, the world has mined a total<br />
of 5.5 billion tons of phosphate rock.<br />
• Known reserves with today’s economics<br />
are very large, about 3.3 billion tons<br />
more than they were 50 years ago.<br />
• As economics and technologies change,<br />
additional known reserves will be made<br />
available, just as they have been since<br />
1950.<br />
• Reserves plus all other mineral P rock<br />
deposits that may potentially be economically<br />
feasible at some time in the<br />
future have been conservatively estimated<br />
at over 100 billion tons.<br />
In today’s economic environment, no<br />
one has any great incentive to explore for<br />
new P reserves. Any P reserves found today<br />
are probably the result of exploration<br />
for other products, such as petroleum, natural<br />
gas, and precious metals. With a specific<br />
focus on looking for P reserves, additional<br />
finds are possible.<br />
Even if no other reser<br />
eserves ves are e found<br />
and these known reser<br />
eserves ves are e ultimately<br />
depleted, will we run out of P for food<br />
production?<br />
Again, the definitive answer<br />
is “NO<br />
NO.” New technologies are even now<br />
being developed that could exploit other<br />
large sources of P. A couple of examples<br />
can give insight into where some of that P<br />
might come from.<br />
Phosphorus exists naturally in all pro-<br />
ductive water bodies. If P were not there,<br />
aquatic life would not exist. Some water<br />
Table 1. World reserves and annual mine<br />
production of phosphate rock.<br />
World reserves 1 , World mine production,<br />
Year billion metric tons million metric tons<br />
1953 46.7 27.2<br />
2003 50.0 138.0 2<br />
1<br />
World reserves include resources (measured plus<br />
indicated reserves and reserve base) that are<br />
exploitable with today’s economics and technology,<br />
or have a reasonable potential for becoming<br />
economically available.<br />
2<br />
Estimated<br />
4 <strong>Better</strong> <strong>Crops</strong>/Vol. 88 (<strong>2004</strong>, No. 2)
odies have enhanced levels of soluble P,<br />
which could be ‘mined’ or extracted.<br />
Seawaters contain abundant dissolved<br />
P...estimated conservatively at more than 90<br />
billion metric tons. Seawater is currently being<br />
processed to provide fresh, potable water<br />
through desalinization processes. Perhaps a<br />
simple additional step, when economically<br />
feasible, could be to extract and separate P,<br />
somewhere during this process, for later use<br />
in crop production. Similarly, wastewaters from<br />
sewage treatment plants can contain even<br />
higher levels of P. Technology is available for<br />
extraction of this P. Its development into fertilizer<br />
P and its return to replenish soils and<br />
produce food is only constrained by today’s<br />
economics.<br />
Just as the major source of P has<br />
changed from fish and manures in pilgrim<br />
times to processed rock phosphates in our<br />
time, the future may see a shift to P<br />
extraction from municipal waste waters and<br />
ocean waters as major sources...or through<br />
some other currently unknown process or procedure,<br />
from some other source. More likely,<br />
in the future, there will be a combination of<br />
all of these mentioned sources plus some new<br />
ones.<br />
Just as today, when the more ancient<br />
methods are still incorporated with current<br />
methods to meet total needs, so will newer<br />
technology extract the P from where it resides,<br />
dependent on the economics, efficiencies,<br />
and ecology of each source. The P will<br />
be there for our use to produce the needed<br />
food. As in the past, human ingenuity will<br />
provide the answer. Will we run out of P<br />
for food production? The answer is sure and<br />
simple: “NO.” BC<br />
Dr. Dibb is President of PPI, located at Norcross,<br />
Georgia.<br />
Soil Fertility Manual Revised Edition Available<br />
A<br />
revised edition of the popular<br />
Soil Fertility Manual is now available<br />
from PPI. The publication has<br />
been used effectively in countless agronomic<br />
education and training classes, short<br />
courses, and workshops. It continues to be<br />
a useful resource for general study<br />
by groups and/or individuals. The<br />
Manual was first introduced in<br />
1978 and has been revised and<br />
updated several times.<br />
The 2003 edition has 200<br />
pages and includes 11 chapters,<br />
plus a glossary and index. Two<br />
new appendix sections feature<br />
color photos of nutrient deficiency<br />
symptoms and tables of conversions<br />
and reference lists. The publication is 8 ½<br />
x 11 page size, with functional wiro-ring<br />
binding. Also available for 3-ring binders.<br />
Chapter titles in the revised edition include:<br />
Concepts of Soil Fertility and Productivity;<br />
Soil pH and Liming; Nitrogen;<br />
Phosphorus; Potassium; The Secondary<br />
Nutrients; The Micronutrients; Soil Sampling;<br />
Soil Testing, <strong>Plant</strong> Analysis, and Diagnostic<br />
Techniques; Fertilize for<br />
Profits; and <strong>Plant</strong> Nutrients and<br />
the Environment.<br />
The Soil Fertility Manual is<br />
available for purchase at $25.00<br />
each, with discounts for larger<br />
quantity orders. For more information<br />
or to order, contact: PPI,<br />
655 Engineering Drive, Suite<br />
110, Norcross, GA 30092-3837;<br />
phone (770) 825-8080; fax (770) 448-0439.<br />
E-mail: circulation@ppi-ppic.org. Check the<br />
PPI website at: >www<br />
www.ppi-ppic.or<br />
.ppi-ppic.org
O N T A R I O<br />
Phosphorus and Phytochemicals<br />
By T.W. Bruulsema, G. Paliyath, A. Schofield, and M. Oke<br />
Phosphorus (P) has long been recognized by fruit and vegetable growers as a nutrient<br />
important for improving quality. Even in highly fertile soils, P sometimes increases<br />
the levels of health-functional phytochemicals like anthocyanins, flavonoids, and<br />
lycopene.<br />
Phytochemicals<br />
hytochemicals—compounds made vacuoles. Vacuolar P keeps up a constant<br />
uniquely by plants—capture considerable<br />
media attention today, be-<br />
biosynthesis begins. Every molecule pro-<br />
and rich level in the chloroplast, where<br />
cause many are linked to health benefits.<br />
Sometimes these health-functional compounds<br />
go by names such as nutraceuticals,<br />
functional food ingredients, etc.<br />
Flavonoids—such as quercetin and<br />
catechin—and isoprenoids—such as lycopene<br />
and carotene—are strong antioxidants.<br />
These phytochemicals are believed<br />
duced comes out in a phosphorylated<br />
form—bonded to a phosphate molecule<br />
that gives it the energy it needs for further<br />
biosynthesis. It is well known that in a P<br />
deficient plant, biosynthesis is inhibited.<br />
What is less well known is whether higher<br />
levels of P stimulate higher or more specific<br />
biosynthesis of phytochemicals.<br />
to be the principal agents in fruits, vegetables,<br />
and their processed products that<br />
impart anti-cancer properties and cardiovascular<br />
protection to humans.<br />
Consumers are searching for foods rich<br />
in these compounds, and often look to organically<br />
produced foods or exotic herbal<br />
extracts. But the production practices that<br />
directly influence their levels in plants are<br />
not well known. We conducted research to<br />
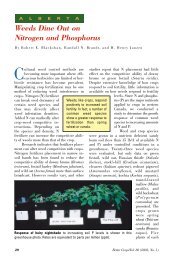
Apples<br />
We applied P treatments to apple trees<br />
in an orchard south of Georgian Bay. The<br />
soil in this orchard was rich in P, testing 50<br />
parts per million (ppm) Olsen-P. The<br />
grower did not normally apply P fertilizer.<br />
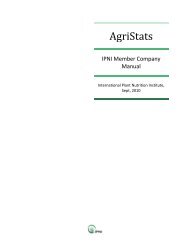
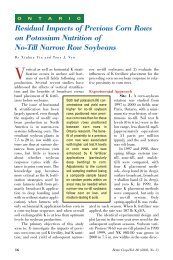
In 1999, red color in the apples increased<br />
in response to applied P, at rates supplying<br />
a total of 4 lb/A (foliar) and 40 to 120<br />
determine the influence of adding more P lb/A (soil-applied) of P 2<br />
O 5<br />
(see photo). The<br />
than usual on the levels of phytochemicals P treatments also increased sweetness<br />
in tomatoes and apples.<br />
In well-nourished plants, most of the<br />
P is inorganic, stored within the cell in<br />
(Brix) in both McIntosh and Red Delicious<br />
varieties, and farnesene (an aromatic flavor<br />
volatile) in Red Delicious only.<br />
However, in the<br />
McIntosh apples<br />
With P<br />
Without P<br />
grown in 2000, there<br />
was no response to applied<br />
P in terms of<br />
color, anthocyanins,<br />
farnesene, or any other<br />
flavor volatiles. The<br />
1999 season ended<br />
with warm sunny days<br />
and cool nights—<br />
conditions which can<br />
Red Delicious apples at harvest in 1999, with and without soil-applied P. stimulate anthocyanin<br />
6 <strong>Better</strong> <strong>Crops</strong>/Vol. 88 (<strong>2004</strong>, No. 2)
production. The 2000 season was more<br />
cloudy and not as cool in the nights.<br />
Weather conditions appear to influence the<br />
responses to added P.<br />
Increased color suggests the activation<br />
of the pentose phosphate pathway, from<br />
which the precursor for flavonoids (erythrose-4-P,<br />
a four-carbon sugar) is derived.<br />
Flavonoids have been shown to protect the<br />
cardiovascular system from damaging effects<br />
of lipid peroxidation. Thus, we concluded<br />
that applying high levels of P nutrition<br />
may increase the health functionality<br />
of apples in some, but not all, weather<br />
conditions.<br />
Tomatoes<br />
We grew tomatoes in soils testing rich<br />
in P (30 to 50 ppm Olsen-P) at Cambridge,<br />
Ontario, in three seasons from 2000 to<br />
2002. Treatments in all years included soilapplied<br />
P fertilizer at 45 and 150 lb P 2<br />
O 5<br />
/<br />
A, and foliar treatments supplying 16 lb<br />
P 2<br />
O 5<br />
/A in addition to the soil-applied rate<br />
of 45 lb P 2<br />
O 5<br />
/A. In two of the three years,<br />
two additional treatments included rates<br />
of zero and 260 lb P 2<br />
O 5<br />
/A.<br />
Lycopene levels responded differently<br />
to added P each year (Table 1). In 2000,<br />
the year with the highest stress and poorest<br />
tomatoes, lycopene increased as the<br />
P 2<br />
O 5<br />
rate increased to 150 lb/A but then<br />
declined at the highest rate. In 2001, the<br />
highest rate was omitted, but lycopene<br />
increased as applied P increased. In 2002,<br />
the highest yielding year, there was no<br />
response to applied P. In all years, foliar P<br />
produced intermediate levels of lycopene.<br />
Table 1. Applying P influenced lycopene levels in<br />
tomato juice.<br />
P applied,<br />
Lycopene, ppm<br />
lb P 2<br />
O 5<br />
/A 2000 2001 2002<br />
0 180 b 182 a<br />
45 61 b 197 ab 180 a<br />
150 77 a 221 a 173 a<br />
260 61 b 161 a<br />
16 (foliar) 69 ab 211 a 176 a<br />
Values followed by the same letter within a column<br />
do not differ significantly (p=0.05).<br />
We also measured other quality parameters<br />
in the juice and processed sauce, including<br />
Brix, acidity, vitamin C, viscosity,<br />
and flavor volatiles. Most of these were not<br />
affected significantly by applied P, but Brix<br />
followed a pattern similar to lycopene. We<br />
also found that applied P increased the levels<br />
of several anti-oxidant enzymes in<br />
2001. We are continuing research on these<br />
enzymes.<br />
Overall, results indicate that even in<br />
soils with high P fertility, optimum levels<br />
of P are important for tomato quality, but<br />
vary depending on the growing season.<br />
Further research may identify specific<br />
combinations of soil and foliar applications<br />
of nutrients that can optimize quality specific<br />
to the growing conditions of a particular<br />
year.<br />
Discussion<br />
Regulation of nutrient management<br />
appears likely to place limits on the use of<br />
P fertilizer in the near future. For many<br />
horticultural crops, growers apply considerably<br />
more P than is removed by the crop.<br />
Formal recommendations are often based<br />
on scant information and few field calibration<br />
trials. Our results and others indicate<br />
that, in general, high levels of P are necessary<br />
for good quality in fruits and vegetables,<br />
but also that excessive applications<br />
can potentially limit quality. Since both<br />
human health and risk of environmental<br />
contamination are at stake, strong research<br />
efforts to improve prediction of optimum rates<br />
of P application are justified.<br />
The soils in these studies on apples and<br />
tomatoes represented the typical high fertility<br />
levels that most of today’s growers<br />
use. If even on these soils P impacts the<br />
levels of phytochemicals, its role in soils<br />
of lower fertility is undoubtedly stronger.<br />
Growing interest in organic farming<br />
practices is driving some producers to manage<br />
with lower inputs of soluble mineral<br />
fertilizers. A recent study in California reported<br />
higher levels of phenolics in blackberries,<br />
strawberries, and sweet corn—and<br />
higher levels of vitamin C in the latter two<br />
(continued on page 11)<br />
<strong>Better</strong> <strong>Crops</strong>/Vol. 88 (<strong>2004</strong>, No. 2) 7
O K L A H O M A<br />
In-Season Fertilizer Nitrogen Rates<br />
Using Predicted Yield Potential<br />
and the Response Index<br />
By W.R. Raun, G.V. Johnson, J.B. Solie, M.L. Stone, K.L. Martin, and K.W. Freeman<br />
Refining in-season fertilizer nitrogen (N) rates through the use of optical sensor<br />
technology has been a major research priority at Oklahoma State University (OSU).<br />
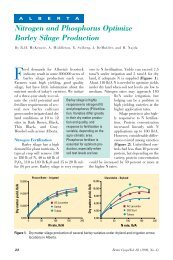
Basing mid-season N fertilizer rates on predicted yield potential and a response<br />
index have increased N use efficiency (NUE) by over 15% in winter wheat when compared<br />
to conventional methods.<br />
From the early 1950s to the early<br />
1970s, increased food production<br />
was a priority in agricultural areas<br />
around the world. During this time period,<br />
the largest increase in the use of agricultural<br />
inputs was N fertilizer, because it had<br />
the largest impact on yield. Since the early<br />
‘60s, the increase in fertilizer N consumption<br />
has continued, becoming somewhat<br />
stable over the past 10 years. Although fertilizer<br />
N consumption and cereal grain production<br />
have both increased over the last<br />
5 decades, contamination of surface water<br />
and groundwater supplies continues to be<br />
a concern in some areas. According to<br />
analysis by scientists at OSU, the efficiency<br />
at which fertilizer N is used has remained<br />
at 33% worldwide.<br />
Current strategies for winter wheat<br />
recommend that farmers apply about 2 lb<br />
N/A for every bushel of expected wheat<br />
grain yield, subtracting the amount of<br />
NO 3<br />
-N in the surface soil (0 to 6 in.). When<br />
grain yield goals are applied using this<br />
strategy, the risk of predicting the environment<br />
(good or bad year) is placed on<br />
the producer, especially when farmers take<br />
the risk of applying all N preplant.<br />
Why Should N Rates Be Based on<br />
Predicted Yield?<br />
In the last century, yield goals have<br />
provided methods for determining<br />
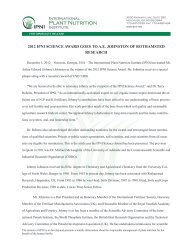
Optical sensor tec<br />
echnology<br />
is helping Oklahoma<br />
researchers refine in-season fertilizer N rates for winter<br />
wheat, based on projected N removal. The applicator<br />
shown here is a field scale machine, 60 ft. wide.<br />
pre-plant fertilizer N rates in cereal production.<br />
This makes sense, because at a given<br />
level of yield for a specific crop, nutrient<br />
removal can be estimated based on concentrations<br />
in the grain. Once expected removal<br />
amounts are known, mid-season application<br />
rates are determined by dividing removal by<br />
the projected use efficiency. Similarly, known<br />
quantities of phosphorus (P), potassium (K),<br />
sulfur (S), and other nutrients within particular<br />
cereal grain crops have been published.<br />
Based on these concentrations, midseason<br />
nutrient rates could be determined at<br />
specific foliar nutrient application efficiencies.<br />
The algorithm for refining mid-season<br />
fertilizer N rates has been divided into components<br />
that follow. Our approach is based<br />
on the ability to predict yield potential<br />
8 <strong>Better</strong> <strong>Crops</strong>/Vol. 88 (<strong>2004</strong>, No. 2)
since this will ultimately<br />
determine the total<br />
amount of a given nutrient<br />
that will be removed<br />
in each crop.<br />
1. Estimate of Yield<br />
Potential<br />
Work at OSU has<br />
shown that earlyseason<br />
Normalized Difference<br />
Vegetation Index<br />
(NDVI) optical sensor<br />
readings of winter<br />
wheat were highly correlated<br />
with total plant<br />
biomass. The effect of<br />
timing (i.e., the number<br />
of days of active plant growth prior to<br />
sensing) can be minimized by dividing<br />
NDVI readings by the number of days<br />
from planting to sensing for those days<br />
where growing degree days...<br />
(GDD=[(T min<br />
+T max<br />
)/2]-40°F) ...are more<br />
than 0. In essence, the index, or In-Season<br />
Estimated Yield (INSEY), was an estimate<br />
of biomass produced per day when growth<br />
was possible. We have shown that optical<br />
sensor readings can be collected once, anytime<br />
within Feekes growth stages 4 and 6,<br />
and that INSEY was an excellent predictor<br />
of yield (grain or forage). This work<br />
was recently updated to include 30 locations<br />
over a 6-year period from 1998 to 2003<br />
(Figure 1).<br />
What is striking from this research is<br />
that planting dates ranged from September<br />
24 to December 1, and sensing dates<br />
ranged from February 10 to April 23, yet<br />
yield prediction (solid line) remained reasonably<br />
good. The results indicate that for<br />
winter wheat, biomass produced per day<br />
is an excellent predictor of grain yield.<br />
Furthermore, over this 6-year period, five<br />
different varieties (Tonkawa, 2163, Custer,<br />
2137, and Jagger) were included. It is noteworthy<br />
to find such a good relationship<br />
with final grain yield simply because so<br />
many uncontrolled variables from planting<br />
to sensing have the potential to adversely<br />
affect this relationship.<br />
Figur<br />
igure e 1. Relationship between observed wheat<br />
grain yield and the In-Season Estimated<br />
Yield (INSEY) determined by dividing<br />
NDVI by the number of days from<br />
planting to sensing (days where growth<br />
was possible, or GDD>0) at 30 locations<br />
from 1998 to 2003.<br />
Because of the importance of yield potential<br />
for determining N application rates,<br />
we must expand on the concept. To correctly<br />
predict the potential yield, the model<br />
should be fitted to yields unaffected by<br />
adverse conditions from sensing to maturity.<br />
This curve more realistically represents<br />
the yield potential achievable in rainfed<br />
winter wheat, considering that post<br />
sensing stresses (moisture, disease, etc.)<br />
from February to July can lower “observed<br />
yields.” We currently add 1 standard deviation<br />
to the predicted yield equation in order<br />
to better reflect actual yield potential<br />
(Figure 1).<br />
Added work has shown that it is possible<br />
to establish reliable yield potential prediction<br />
from only 2 years of field data, provided<br />
that enough sites were evaluated within this<br />
time period.<br />
2. Estimating the Responsiveness to<br />
Applied N<br />
Identifying the specific yield potential<br />
does not necessarily translate directly to a<br />
recommendation for N. Determining the<br />
extent to which the crop will respond to<br />
<strong>Better</strong> <strong>Crops</strong>/Vol. 88 (<strong>2004</strong>, No. 2) 9
Figur<br />
igure e 2. Average winter wheat grain yield from 1971 to 2003 from treatments receiving 100 lb N/A<br />
annually and no fertilizer N (0 lb N/A), long-term experiment #502, Lahoma, Oklahoma. Both P<br />
and K were applied each year to both treatments at rates of 41 lb P 2<br />
O 5<br />
/A and 60 lb K 2<br />
O/A,<br />
respectively.<br />
additional N is equally important. The<br />
response index (RI NDVI<br />
) is computed by taking<br />
average NDVI from a strip within farmer<br />
fields where N has been applied at non-limiting,<br />
but not excessive amounts (N Rich<br />
Strip) and dividing by the NDVI in the farmer<br />
check plot (common farmer practice). This<br />
fertilizer index was developed following comprehensive<br />
work at demonstrating that the<br />
response to applied N in the same field is<br />
extremely variable from one year to the next,<br />
and independent of whether or not previous<br />
year yields were high or low. We studied grain<br />
yield response to applied N in a long-term<br />
replicated experiment where the same rates<br />
were applied to the same plots each year for<br />
over 30 years (Figure 2).<br />
Because the response to N fertilizer depends<br />
on the supply of non-fertilizer N<br />
(mineralized from soil organic matter, deposited<br />
in the rainfall, etc.) in any given<br />
year, N management strategies that include<br />
a reliable mid-season predictor of<br />
RI NDVI<br />
should dramatically improve NUE<br />
in cereal production. This same work noted<br />
that the RI values changed considerably<br />
when collected from the same plots that<br />
had been managed the same way for 30<br />
years. This is attributed to the striking differences<br />
in rainfall and temperature from<br />
one year to the next and associated crop need,<br />
which influenced how much non-fertilizer N<br />
was used by the crop. Furthermore, the inseason<br />
RI NDVI<br />
was found to be an excellent<br />
predictor of the actual responsiveness to applied<br />
fertilizer N when measured at harvest.<br />
3. Integrating Yield Potential and<br />
the Response Index<br />
For the Nitrogen Fertilization Optimization<br />
Algorithm (NFOA) currently being<br />
used, yield potential with no added N fertilization<br />
(YP 0<br />
) is predicted using NDVI<br />
readings divided by the number of days<br />
from planting to sensing. The yield obtainable<br />
with added N fertilization (YP N<br />
) is<br />
determined by multiplying YP 0<br />
by RI NDVI<br />
.<br />
The fertilizer rate to be applied is<br />
determined by computing N uptake in the<br />
grain at YP N<br />
minus N uptake in the grain<br />
at YP 0<br />
divided by an expected use efficiency<br />
factor (between 0.5 and 0.7).<br />
Grain N uptake for YP 0<br />
and YP N<br />
is determined<br />
by multiplying the respective<br />
predicted grain yield times a known percent<br />
N value in each grain or forage crop<br />
for each specific region. For winter wheat<br />
in the central Great Plains, the percent N<br />
in the grain averages 2.39% for winter<br />
wheat, 1.18% for corn grain, and 2.45% for<br />
10 <strong>Better</strong> <strong>Crops</strong>/Vol. 88 (<strong>2004</strong>, No. 2)
spring wheat. This same concept could apply<br />
for different nutrients and different crops.<br />
Although factors other than N can influence<br />
yield potential, the value of this approach is<br />
that N fertilizer will ultimately be applied<br />
based on the specific yield potential of each<br />
4.3 ft 2 area and the potential responsiveness<br />
to N for each particular field.<br />
The need to sense biological proper-<br />
ties on a small scale was established at<br />
OSU. Current work is focusing on the<br />
evaluation of statistical properties within<br />
each 4.3 ft 2 area, understanding that the<br />
nutrient variability within this area will<br />
likely be minimal. Fortunately, the sensors<br />
developed and used in all of the OSU sensor<br />
research are capable of collecting<br />
enough data within each 4.3 ft 2 to calculate<br />
meaningful statistical estimates. Now,<br />
more importantly, these statistical estimates<br />
combined with average NDVI have<br />
been shown to be useful for mid-season<br />
yield prediction and subsequent fertilizer<br />
N rate recommendations. Using the algorithm<br />
reported earlier, we showed that winter<br />
wheat NUE was improved by more<br />
than 15% when N fertilization was based on<br />
optically sensed INSEY and the RI NDVI<br />
compared<br />
to traditional practices at uniform N<br />
rates. We are not aware of any biological basis<br />
to suggest that this approach would not<br />
be suitable in other cereal crops.<br />
The sufficiency approach that is being<br />
evaluated in the Corn Belt today and that<br />
applies fertilizer to all plots when found to<br />
be below a theoretical maximum (
I O W A<br />
Detecting Phosphorus with Plasma<br />
Emission Spectroscopy May Require<br />
Unique Field Calibration Data<br />
By Antonio P. Mallarino and T. Scott Murrell<br />
Using inductively coupled plasma emission spectroscopy (ICP) to measure phosphorus<br />
(P) in the Mehlich 3 (M3) extractant produces higher test results than the traditional<br />
colorimetric procedure (COL), requiring the creation of new soil test interpretation<br />
categories. The M3-ICP procedure should be considered a different soil P test than M3-<br />
COL. Failing to do so could result in large recommendation errors and significant underestimation<br />
of supplemental P needs.<br />
In a soil testing laboratory, one of the<br />
first steps in generating a soil test P value<br />
is to get a portion of the total soil P into<br />
solution that is proportional to the soil P<br />
available to plants. To do this, a small measure<br />
of soil from a submitted sample is<br />
mixed with a solution of different chemicals,<br />
termed an extractant. In the Midwestern<br />
U.S., three extractants are commonly<br />
used for P: Bray P-1, Olsen, and M3.<br />
Mehlich 3 is gaining popularity among<br />
laboratories, because it can be used to extract<br />
more elements than just P and it produces<br />
reliable results across a wider range<br />
of pH levels than does Bray P-1.<br />
Once P is extracted, the amount dissolved<br />
must be measured. There are two<br />
commonly used techniques for doing this:<br />
1) COL, and 2) ICP. In the past, soil testing<br />
laboratories used only the molecular absorbance<br />
method. Recently, however, many laboratories<br />
have begun using ICP. This article<br />
briefly describes these detection methods<br />
and how they influence soil test interpretations<br />
appropriate for the M3 extractant.<br />
COL<br />
A standard P detection method for<br />
many soil P extractants is COL. After a soil<br />
test extractant has dissolved P from a soil<br />
sample, the solution is filtered to obtain a<br />
clear solution. More chemicals are then added<br />
that react with dissolved orthophosphate P<br />
–<br />
(H 2<br />
PO 4<br />
or HPO 2– 4<br />
) and turn the solution<br />
blue. The blue solution is then placed in a<br />
clear cell in a spectrophotometer. This instrument<br />
measures the absorption of energy<br />
by P molecules (Figure 1a). Light of a specific<br />
wavelength, coming from a radiation<br />
source, is directed at the sample. Some of the<br />
radiation is absorbed by the molecules in<br />
the sample. Radiation not absorbed passes<br />
through the sample and is captured by a detector.<br />
As P concentration in the sample<br />
increases, more radiation is absorbed, reducing<br />
the intensity of the radiation transmitted<br />
to the detector. Consequently, measuring the<br />
intensity of transmitted radiation allows P<br />
The blue solution is characteristic of the traditional<br />
colorimetric procedure for P detection.<br />
Note: In this article, the classic M3 colorimetric procedure is<br />
referred to as M3-COL, while a M3 procedure that uses ICP is<br />
referred to as M3-ICP.<br />
12 <strong>Better</strong> <strong>Crops</strong>/Vol. 88 (<strong>2004</strong>, No. 2)
Figur<br />
igure e 1. Simplified diagrams show how P is<br />
quantified in the Mehlich 3 extractant<br />
using a) the colorimetric procedure<br />
(M3-COL), and b) inductively coupled<br />
plasma emission spectroscopy (M3-ICP).<br />
concentration to be quantified.<br />
ICP<br />
Another means of measuring P in any<br />
extractant solution is ICP. In this method,<br />
the sample is heated to such an extreme<br />
temperature that all molecules decompose<br />
into atoms to form a gas. The source of<br />
extreme heat is an inductively coupled<br />
plasma (Figure 1b). The high energy plasma<br />
excites electrons in the P atom to a higher<br />
energy state. This excited state doesn’t last<br />
long, and soon the electrons return to their<br />
original energy states. During this return,<br />
energy is emitted from the sample and hits a<br />
detector. The more P that is in the sample,<br />
the greater the emitted energy detected. In<br />
this method, detected energy comes from all<br />
P compounds, not just orthophosphate P.<br />
What the Procedures Measure<br />
These two methods do not measure the<br />
same things. In M3-COL, only orthophosphate<br />
P is measured. Most of the P extracted<br />
by soil tests is in the orthophosphate form,<br />
but there are also other P compounds that<br />
may be present, such as simple organic P compounds<br />
and P associated with very small soil<br />
particles that sometimes pass filters. These<br />
additional compounds are not detected in<br />
M3-COL, but can be detected in M3-ICP.<br />
Consequently, , P measured ed using an M3-<br />
ICP tends to be greater than P measured<br />
by M3-COL, even using the same soil<br />
sample or extracted solution.<br />
Because the M3 extractant measures several<br />
other elements also, some laboratories<br />
use ICP for measuring P in a M3 extractant,<br />
but use COL when measuring P from Bray<br />
P-1 or Olsen extractants. As of 2003, more<br />
than 60% of the soil testing labs in the North<br />
American Proficiency Testing Program were<br />
requesting proficiency testing for M3-ICP,<br />
although fewer labs use M3-ICP for testing<br />
farmers’ samples.<br />
Need for Field Calibration Experiments<br />
For any soil test method to have meaning,<br />
values generated must be calibrated to<br />
crop yield response in the field. With M3-<br />
ICP and M3-COL methods measuring different<br />
things, many wondered if different<br />
field calibration data were needed for each<br />
procedure. To answer this question, field<br />
calibration research for corn was conducted<br />
across 78 site-years. These sites represented<br />
17 soil series in which row crop production<br />
predominates in Iowa. Thirty-one trials<br />
evaluated four P fertilization rates for corn<br />
managed with plow and/or disk tillage; 13<br />
trials evaluated three P fertilization rates<br />
applied either broadcast or banded for notill<br />
corn; and 15 trials evaluated three P<br />
rates applied either broadcast or banded<br />
for ridge-till corn. Corn grain yield and soil<br />
samples were collected in each site-year.<br />
Corn grain yield data were expressed<br />
as relative responses to P. Relative response<br />
was calculated for each site-year by dividing<br />
the average yield of the control plots<br />
(no P applied) by the average yield of the<br />
treatment with the highest P rate. This<br />
fraction was then multiplied by 100 to express<br />
relative response as a percentage.<br />
Two sub-samples were taken from each<br />
soil sample. Each sub-sample was mixed<br />
with the M3 extractant. One aliquot of each<br />
sub-sample was put through the M3-COL procedure<br />
and a second aliquot was subjected<br />
to M3-ICP analysis.<br />
The average soil P measured by<br />
M3-ICP and M3-COL across all sites was 31<br />
and 19 parts per million (ppm), respectively.<br />
These averages show that for the same samples,<br />
<strong>Better</strong> <strong>Crops</strong>/Vol. 88 (<strong>2004</strong>, No. 2) 13
M3-ICP measured more P than M3-COL.<br />
Figure 2 shows the relationship between P<br />
measured by M3-ICP and M3-COL for all siteyears.<br />
The high r 2 value indicates that both<br />
analyses are well correlated and highly significant.<br />
If both procedures measured the<br />
same amount of P, then most of the points<br />
would fall along the 1:1 line. However, most<br />
points fall above this line, demonstrating the<br />
higher quantity of P detected by M3-ICP<br />
across the range of soil test P levels.<br />
Figure 3 shows corn grain calibration<br />
data from the field experiments. Grain yields<br />
across all site-years ranged from 87 to 210<br />
bu/A. Figures 3a and 3b show the relationships<br />
between relative corn grain yield<br />
responses to applied P and P measured by<br />
either M3-COL or M3-ICP, respectively.<br />
In both graphs, the optimum ranges are<br />
defined as soil test levels most profitable to<br />
Figur<br />
igure e 3. Relationship between relative yield<br />
response of corn grain and M3 P<br />
measured by the colorimetric procedure<br />
(M3-COL) and inductively coupled<br />
plasma emission spectroscopy (M3-ICP).<br />
Figure 2.Correlation between M3 P measured by<br />
the colorimetric procedure (M3-COL) and<br />
inductively coupled plasma emission<br />
spectroscopy (M3-ICP).<br />
maintain over time with regular P applications.<br />
These results, combined with<br />
Table 1.Updated Iowa State University soil test P<br />
crop response and economic models,<br />
interpretation classes for P measured by<br />
M3-COL and M3-ICP.<br />
led to the formation of new soil test<br />
interpretation ranges for the M3-ICP<br />
Soil test category<br />
test, shown in Table 1. This table Soil test Very low Low Optimum High Very high<br />
shows that higher soil test P values<br />
- - - - - - - - - - - - - - - - - - ppm - - - - - - - - - - - - - - - - - -<br />
are used to define wider soil test categories<br />
when M3-ICP is used.<br />
Low subsoil P<br />
M3-COL 0-8 9-15 16-20 21-30 31+<br />
The categorization of high and<br />
M3-ICP 0-15 16-25 26-35 36-45 46+<br />
low subsoil P levels is based on previous<br />
research showing that lower P<br />
High subsoil P<br />
M3-COL 0-5 6-10 11-15 16-20 21+<br />
levels are needed at the surface when<br />
subsoil P levels are higher. Recom-<br />
M3-ICP 0-10 11-20 21-30 31-40 41+<br />
mendations in Table 1 are based on soil<br />
samples taken to a 6 in. depth.<br />
These new ranges took effect in 2002<br />
and were published in the Iowa State University<br />
Cooperative Extension Bulletin PM<br />
1688 entitled “A General Guide for Crop<br />
Nutrient and Limestone Recommendations<br />
in Iowa.” It may be downloaded at<br />
14 <strong>Better</strong> <strong>Crops</strong>/Vol. 88 (<strong>2004</strong>, No. 2)
New Publication Offers Insight about<br />
Food Quality/Safety Concerns<br />
While consumers today have<br />
ready access to perhaps the<br />
most nutritious, safe, and affordable<br />
food products in history, many<br />
continue to have doubts and<br />
questions about food safety,<br />
quality, and other issues.<br />
A new publication from<br />
PPI/PPIC and the Foundation<br />
for Agronomic Research<br />
(FAR) addresses this<br />
situation. The booklet is<br />
titled There’s WHAT in My<br />
Food? Presented primarily<br />
through a question/answer<br />
format, the 24-page publication<br />
includes colorful illustrations<br />
in a friendly<br />
style to appeal especially to non-farm<br />
audiences.<br />
For those involved in agriculture and<br />
fertilizer industry work, this publication<br />
can be another useful and effective tool in<br />
providing a fresh, positive message to<br />
consumers.<br />
The booklet is available<br />
for purchase at $2.00 per<br />
copy (plus shipping), with<br />
discounts for larger quantities.<br />
Some sample pages of<br />
the booklet may be viewed<br />
as PDF files on the<br />
<strong>Institute</strong>’s website through<br />
this link: www.ppi-ppic.org/<br />
food. An order form is also<br />
available there as a PDF file.<br />
For additional information<br />
or to order, contact:<br />
Circulation Department,<br />
PPI, 655 Engineering Drive, Suite 110,<br />
Norcross, GA 30092-2837. Phone: (770)<br />
825-8082; fax (770) 448-0439. BC<br />
>www.extension.iastate.edu/Publications/<br />
PM1688.pdf
N E W J E R S E Y<br />
Greensand as a Soil Amendment<br />
By J.R. Heckman and J.C.F. Tedrow<br />
The benefits in plant growth sometimes observed following greensand application<br />
are likely not due to nutritional benefits, but from changes in soil physical properties.<br />
Greensand is composed largely of<br />
glauconite, a unique mineral that<br />
occurs as a natural geologic deposit<br />
that stretches as a belt across New Jersey<br />
from Monmouth County to Salem County.<br />
Greensand also occurs in parts of Delaware,<br />
Maryland, and Virginia. Although<br />
there are several theories of origin, greensand<br />
is generally thought to have formed<br />
in shallow marine seas near the interface<br />
of water and land.<br />
Since the late 1800s, millions of tons<br />
of greensand have been spread over soils<br />
in New Jersey and other parts of the U.S.<br />
For this reason, greensand may occur<br />
today in many soils where it was not originally<br />
present. The presence of greensand<br />
may still be benefiting crops by improving<br />
the soil’s ability to hold water and store<br />
nutrients. In the early part of the 20 th century,<br />
there were about 80 open pit mines<br />
in New Jersey where greensand was mined.<br />
There are only<br />
a few of these<br />
mines operating<br />
today. The<br />
photo at left<br />
shows a view<br />
of a modern<br />
mine.<br />
The olive<br />
green-colored<br />
glauconite<br />
Modern greensand mining<br />
operation in Gloucester County,<br />
New Jersey.<br />
mineral in<br />
greensand is<br />
unusual. Unlike<br />
most types<br />
of clay, which<br />
are very fine,<br />
glauconite<br />
often exists as sand-sized pellets, as shown<br />
in the photo below. Glauconite does not<br />
behave like typical sand, since it is a micalike<br />
complex composed mostly of muscovite-<br />
and illite-like clay minerals, containing<br />
many micro-pores. Also, unlike a true<br />
sand, the micro-pores in greensand contribute<br />
to soil water-holding capacity. In this<br />
way, it differs from true sands, which are<br />
composed of minerals such as quartz and<br />
feldspars. Greensands typically have a high<br />
cation exchange capacity (ranging from 20<br />
to 30 cmol/kg). Addition of greensand to<br />
sandy soils enhances the ability of the soil<br />
to store exchangeable nutrients such as<br />
calcium (Ca), magnesium (Mg), potassium<br />
(K), and micronutrients. These desirable<br />
physical and chemical properties may explain<br />
how greensand can be useful as a soil<br />
amendment.<br />
Pure glauconite generally contains up<br />
to 8% K 2<br />
O and small amounts of phosphorus<br />
(P), Ca, and trace elements. However,<br />
since greensand contains other non-<br />
Glauconite pellets from the Hornerstown formation<br />
(photo by R. Holzer).<br />
16 <strong>Better</strong> <strong>Crops</strong>/Vol. 88 (<strong>2004</strong>, No. 2)
eneficial constituents as well as glauconite,<br />
the K content of commercial products<br />
generally falls well below this value<br />
(from 0.1 to 7% K 2<br />
O).<br />
The issue of K availability from greensand<br />
has been studied since the 19 th<br />
century, when positive crop responses were<br />
occasionally observed following application.<br />
Almost all investigators have concluded<br />
that greensand has very little value<br />
as a nutrient source. Greensand is sometimes<br />
recommended as a natural K source<br />
for organic agriculture. Recent research<br />
suggests that greensand benefits may be a<br />
result of changes in soil physical properties<br />
and not improved plant nutrition.<br />
A field trial near New Brunswick, New<br />
Jersey, evaluated the response of potatoes<br />
to various rates of greensand applied in the<br />
row at time of planting with the seed pieces<br />
(see see photo). The study was conducted on<br />
a Sassafras sandy loam soil that had relatively<br />
low organic matter content and poor<br />
physical condition as a result of many<br />
years of continuous cropping to vegetables.<br />
Thus, this field site afforded the opportunity<br />
for greensand to express soil-conditioning<br />
attributes. Potato tuber yields were<br />
on average 16% higher where the greensand<br />
treatments were applied (Table 1).<br />
The crop was uniformly fertilized with 108,<br />
7, and 134 lb/A of nitrogen (N), P 2<br />
O 5<br />
, and<br />
Greensand<br />
applied in the seed furrow before planting<br />
potatoes.<br />
Table 1. Yukon Gold potato tuber yield and<br />
specific gravity in response to greensand<br />
application in the seed furrow<br />
prior to planting in 2003.<br />
Greensand rate, Tuber yield, Tuber specific<br />
lb/A cwt/A gravity<br />
0 91 1.063<br />
125 105 1.061<br />
250 107 1.063<br />
500 105 1.063<br />
Significance*<br />
(check vs. others) 0.04 NS<br />
*The check was significantly different than the<br />
treatments @ p=0.04.<br />
K 2<br />
O, respectively. Tissue analysis revealed<br />
no differences in nutrient concentrations<br />
in the potato leaves. Thus, the positive<br />
yield response was not likely related to an<br />
influence of greensand on plant nutrition,<br />
but improved soil properties.<br />
Conclusion<br />
In general, greensand should be considered<br />
more valuable as a soil conditioner<br />
than as a fertilizer. Micro-pore spaces<br />
within glauconite can enable greensandamended<br />
soils to have improved waterholding<br />
capacity and increased ability to<br />
store and retain nutrients. These changes<br />
may or may not result in a positive plant<br />
response, depending on the specific soil.<br />
Although organic matter additions may<br />
also improve soil water holding capacity<br />
and nutrient retention, the changes resulting<br />
from adding greensand to soil are<br />
permanent. BC<br />
Dr. Heckman is Extension Soil Fertility<br />
Specialist with Rutgers University; e-mail:<br />
heckman@aesop.rutgers.edu. Dr. Tedrow is Professor<br />
Emeritus, Department of Ecology, Evolution,<br />
and natural Resources, Rutgers University.<br />
Additional information regarding greensand is<br />
available from: J.C.F. Tedrow, 2002. Greensand<br />
and Greensand Soils of New Jersey: A Review.<br />
Rutgers Cooperative Extension, Bulletin E279.<br />
Website: >www.rce.rutgers.edu/pubs/pdfs/e279
WESTERN CANADA<br />
Cropping System Impact on Phosphorus<br />
Management of Flax<br />
By C.A. Grant, M. Monreal, D.D. Derksen, R.B. Irvine, D. McLaren, R.M.<br />
Mohr, and J.J. Schoenau<br />
The phosphorus (P) nutrition of flax was found to be influenced most by preceding crop<br />
in rotation, while tillage system and P fertilizer management had only minor impact.<br />
Reduced tillage systems are becoming<br />
increasingly popular on the<br />
Canadian prairies. They have been<br />
shown to conserve soil moisture, increase<br />
crop yield potential, and improve soil quality,<br />
while reducing time, labor, and equipment<br />
costs in farming operations. Reducing<br />
tillage also has important implications<br />
for nutrient management. It impacts soil<br />
moisture relations, the distribution of nutrients<br />
in the profile, surface accumulation<br />
of crop residues, and changes the type and<br />
activity of soil micro-organisms compared<br />
to conventional tillage. Ultimately, this directly<br />
influences nutrient availability and<br />
fertilizer management decisions.<br />
Phosphorus fertilization of flax can be<br />
problematic because flax is very sensitive<br />
to seed-placed applications of<br />
monoammonium phosphate (MAP).<br />
Broadcast application has not been effective<br />
in correcting P deficiencies. Pre-plant<br />
or side band applications of P fertilizer to<br />
flax have low efficiency unless they are positioned<br />
within 1 to 2 in. of the seed-row.<br />
Therefore, unless a producer has access to<br />
seeding equipment capable of side-banding,<br />
P fertilization of flax is frequently ineffective.<br />
This has caused some producers<br />
to skip P application in flax and increase<br />
the P supply in the preceding crops, in an<br />
attempt to increase residual P for use by<br />
the subsequent flax crop in rotation.<br />
Flax is a highly mycorrhizal crop. It is<br />
possible mycorrhizal associations could be<br />
responsible for part of the positive<br />
response that flax shows in no-till systems,<br />
and for the limited fertilizer P response<br />
observed in field studies. If so, P fertility<br />
requirements in flax could be greatly affected<br />
by tillage system (no-till preserves<br />
mycorrhizae) and whether the preceding<br />
crop was mycorrhizal or not (wheat vs.<br />
canola, respectively).<br />
We asked the question: Could P fertilization<br />
be reduced or eliminated for flax by<br />
using no-till, adding extra P to the previous<br />
crop in rotation, and using a mycorrhizal<br />
crop before flax?<br />
This field study was established at two<br />
locations approximately 4 miles apart, on<br />
the same clay loam soil type (Udic Boroll)<br />
in southern Manitoba. The Research Centre<br />
location was in conventional<br />
tillage…average pH, 7.8; average organic<br />
matter, 5.0%; initial soil test P (Olsen), 10<br />
to 15 parts per million (ppm). The Zerotill<br />
Farm was an established (6 years) notill<br />
field…average pH, 7.7; average organic<br />
A strategy to maintain soil P levels through the<br />
rotation by targeting applications to more responsive<br />
crops may be more cost effective than application of P<br />
to flax, unless P supply is extremely depleted.<br />
18 <strong>Better</strong> <strong>Crops</strong>/Vol. 88 (<strong>2004</strong>, No. 2)
matter, 5.0%; initial soil test P (Olsen) 10-<br />
12 ppm. In year one of the study, canola<br />
and spring wheat were seeded using conventional<br />
tillage (CT) and no-till (NT), and<br />
fertilized with either 0, 22, or 44 lb P 2<br />
O 5<br />
/A<br />
side-banded at seeding. After harvest of<br />
the canola and wheat, the stubble in the<br />
CT plots was tilled. In year two, the flax<br />
was seeded into both stubble and tilled<br />
plots, with fertilizer P side banded at either<br />
0 or 44 lb P 2<br />
O 5<br />
/A (Table 1). This 2-<br />
year sequence was repeated three times at<br />
each location (1999-2000, 2000-2001 and<br />
2001-2002). <strong>Plant</strong> roots were evaluated for<br />
mycorrhizal association at five weeks of<br />
growth and seed yield was collected at crop<br />
maturity.<br />
Mycorrhizal incidence in 2001 was<br />
greater for flax following wheat than flax<br />
following canola at both locations, although<br />
the difference was larger at the<br />
Research Centre than the Zero-till Farm<br />
(Table 1). This supports previous research<br />
which identified canola as a nonmycorrhizal<br />
crop, reducing association<br />
with crops seeded after canola in rotation.<br />
Association was greater with NT than CT<br />
at the Zero-till Farm after both of the preceding<br />
crops and at the Research Centre<br />
after canola. There was no effect of tillage<br />
system at the Research Centre after wheat.<br />
The level of mycorrhizal association was<br />
very high after wheat at the Research Centre,<br />
so it is possible that the tillage system<br />
had no effect due to the high degree of<br />
association present in wheat stubble.<br />
Association was reduced at both locations<br />
by side-banded P fertilization in the flax,<br />
with an interesting tendency (p=0.06) for<br />
mycorrhizal association to increase with<br />
residual P at the Research Centre and decrease<br />
with residual P at the Zero-till Farm.<br />
These mycorrhizal incidence results, from<br />
a single year of sampling, indicate a high<br />
degree of variability associated with preceding<br />
crop, fertilizer rate, and tillage practice.<br />
Similar patterns in mycorrhizal responses<br />
occurred in 2002, although<br />
Table 1. Effect of P fertilizer application to current year flax, previous crop type and P fertilizer<br />
management, and tillage system on mycorrhiza incidence and flax seed yield.<br />
P P in Research Centre Zero-till Farm<br />
in previous Canola Wheat Canola Wheat<br />
flax crop CT NT CT NT CT NT CT NT<br />
lb P 2<br />
O 5<br />
/A - - - - - - - - - - Mycorrhiza incidence 1 , % of root area covered - - - - - - - - - -<br />
0 0 4.65 5.80 9.40 8.00 3.01 6.13 3.86 8.23<br />
0 22 4.00 6.85 9.31 9.68 3.19 5.47 3.42 4.01<br />
0 44 5.65 11.43 11.38 10.63 3.25 3.50 2.33 7.79<br />
22 0 3.83 4.52 11.04 6.33 5.14 4.30 2.12 5.64<br />
22 22 5.41 5.85 7.19 12.68 3.17 2.70 1.52 4.33<br />
22 44 6.40 4.84 8.10 8.46 1.90 4.42 2.18 3.69<br />
Tillage mean 4.99 6.55 9.40 9.30 3.28 4.42 2.57 5.62<br />
Preceding crop mean 5.77 9.35 3.85 4.09<br />
lb P 2<br />
O 5<br />
/A - - - - - - - - - - - - - - - - - - - - Seed yield 2 , bu/A - - - - - - - - - - - - - - - - - - - -<br />
0 0 24.9 25.1 25.1 28.4 25.5 22.1 30.1 27.8<br />
0 22 23.9 27.1 26.6 26.7 24.0 22.2 29.0 29.5<br />
0 44 24.4 24.6 26.8 27.9 26.4 22.2 27.4 28.3<br />
22 0 24.1 25.4 27.0 27.2 27.2 21.3 29.6 28.8<br />
22 22 25.3 25.8 29.1 28.7 23.8 23.9 30.8 25.7<br />
22 44 25.7 25.0 28.9 28.4 23.9 21.5 31.2 29.1<br />
Tillage mean 24.7 25.5 27.3 27.9 25.1 22.2 29.7 28.2<br />
Preceding crop mean 25.1 27.6 23.7 28.9<br />
1<br />
Mycorrhiza incidence for 2001 flax crop only.<br />
2<br />
Grain yield response an average of 3 years, 2000-2002.<br />
<strong>Better</strong> <strong>Crops</strong>/Vol. 88 (<strong>2004</strong>, No. 2) 19
mycorrhizal association was more consistently<br />
depressed with residual P than in<br />
2001.<br />
There were few significant influences<br />
of the management variables evaluated in<br />
this study on the seed yield of flax. Preceding<br />
crop was found to have the greatest<br />
influence on flax seed yield at both sites<br />
(p=0.0001), with mean seed yield averaging<br />
10% and 22% higher after wheat than<br />
canola at the Research Centre and Zerotill<br />
Farm sites, respectively (Table 1). The<br />
effect may be due to a number of factors,<br />
including some degree of allelopathy from<br />
canola residue, early season competition<br />
from volunteer canola plants, and restriction<br />
in mycorrhizal colonization after<br />
canola.<br />
There was a tendency (p=0.07) for seed<br />
yields at the Research Centre site to be<br />
higher when P fertilizer was applied to flax,<br />
although the difference was small. At the<br />
Zero-till Farm site P application had no<br />
effect on flax seed yield. Flax yield did not<br />
seem to be effected by tillage system in the<br />
study. At the Zero-till Farm site, flax seed<br />
yield tended (p=0.08) to be higher after CT<br />
than NT. These results support previous<br />
research on the Canadian prairies which<br />
found that flax is well adapted to no-till<br />
seeding systems.<br />
Based on the interim information<br />
from this study, it appears that P nutrition<br />
of flax can be influenced by tillage<br />
system, preceding crop, residual P from<br />
fertilization of preceding crops and by<br />
side-banded P application in the flax.<br />
Therefore, it may be possible to select<br />
different P management strategies to<br />
optimize flax P nutrition and seed yield,<br />
depending on the cropping system and crop<br />
rotation used and the equipment available.<br />
The overall benefit from either applying P<br />
fertilizer to the flax crop or increasing P<br />
application in the preceding crop to benefit<br />
the following flax crop was minimal.<br />
The P status of the soils in this study<br />
was low to moderate and P fertilizer<br />
responses occurred in other crops.<br />
Phosphorus fertilization of flax may be<br />
more beneficial on soils where P supply is<br />
extremely depleted. However, with moderate<br />
deficiencies, the benefit is likely to<br />
be low. A P management strategy to maintain<br />
P through the rotation by targeting<br />
applications to more responsive crops<br />
would possibly be more cost-effective than<br />
application of P to flax. If soil P levels are<br />
not depleted, increased applications of P<br />
to preceding crops will likely not improve<br />
the yield of the following flax crop. BC<br />
Drs. Grant (e-mail: cgrant@agr.gc.ca), Derksen,<br />
Irvine, McLaren, Mohr, and Monreal are with the<br />
Brandon Research Centre, Agriculture and Agri-<br />
Food Canada, Brandon, Manitoba. Dr. Schoenau<br />
is with the Department of Soil Science, University<br />
of Saskatchewan, Saskatoon, Saskatchewan.<br />
“Toolbox” is a feature on the<br />
PPI/PPIC website which holds<br />
free downloadable software tools<br />
for improved nutrient management. One<br />
useful tool is called PKalc (v.1.13), a<br />
simple balance calculator which helps<br />
PKalc Software Checks<br />
Nutrient Balance<br />
users determine if phosphorus and<br />
potassium nutrient additions are keeping<br />
up with removal by crops.<br />
PKalc and other programs can be accessed<br />
for free at:<br />
>www<br />
www.ppi-ppic.or<br />
.ppi-ppic.org/toolbox<br />
g/toolbox< BC<br />
20 <strong>Better</strong> <strong>Crops</strong>/Vol. 88 (<strong>2004</strong>, No. 2)
<strong>International</strong> Section<br />
Site-Specific Nutrient Management<br />
for Optimal Foodgrain Production<br />
in Haryana<br />
By K.S. Yadav and Hira Nand<br />
Cropping systems governed by either generalized state soil testing recommendation<br />
systems or common farmer practice are incapable of maximum<br />
economic yield. In this study, it is evident that inadequate nutrient<br />
use is severly limiting pearl millet and pigeonpea production in Haryana<br />
State.<br />
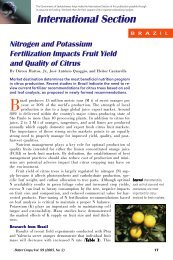
I N D I A<br />
Afive-fold increase in foodgrain production in Haryana State during<br />
the last 35 years combined with inadequate and unbalanced<br />
nutrient supply has led to continued and accelerated soil nutrient<br />
depletion of all essential plant nutrients. Farmers in Haryana apply generalized<br />
quantities of nitrogen (N), phosphorus (P), and zinc (Zn) in<br />
foodgrain crops, and as a consequence, deficiencies of P, potassium (K),<br />
sulfur (S), iron (Fe), manganese (Mn), and copper (Cu), and boron (B) are<br />
increasing. Deficiencies of S and Fe have become especially widespread<br />
during the last decade in fields growing pearl millet, sugarcane, wheat,<br />
and legumes. The desire for sustained productivity in these important<br />
soils places an urgent need to arrest this trend.<br />
Pearl millet and pigeonpea crops presently occupy<br />
586,000 ha and 16,000 ha, respectively, in<br />
Haryana, and corresponding productivity for these<br />
two crops is quite low at 1.42 t/ha and 0.81 t/ha.<br />
Opportunity for improvement exists through better<br />
nutrient management coupled with other best<br />
management practices. A research project was initiated<br />
to study the effect of site-specific nutrient<br />
management (SSNM) on crop yield and profit while<br />
demonstrating the drawbacks of relying on common<br />
farmer practice or even state fertilizer recommendations.<br />
Field experiments were conducted during 2001-<br />
02 in farmers’ fields in the village of Tikli in Gurgaon District. Soils were<br />
sandy loam, alkaline in reaction, low in organic matter, with cation<br />
exchange capacities varying between 10 to 12 cmol (+)<br />
/kg. Soils were<br />
generally deficient in available N, P, K, S, Zn, Fe, and Mn. Pigeonpea var.<br />
UPAS-120 was sown in the last week of June while pearl millet hybrid<br />
Site-specific nutrient<br />
management (SSNM) can<br />
increase productivity of<br />
pigeonpea.<br />
<strong>Better</strong> <strong>Crops</strong>/Vol. 88 (<strong>2004</strong>, No. 2) 21
Table 1.<br />
Effect of fertilizer treatments on pigeonpea grain and stover yield and<br />
net profits, Haryana.<br />
Grain yield Stover yield Net profits 2 ,<br />
Treatments - - - - - t/ha- - - - - US$/ha<br />
1. N 20<br />
P 90<br />
K 125<br />
plus S+Micros’ 1 2.03 4.08 354<br />
2. N 20<br />
P 60<br />
K 125<br />
plus S+Micros’ 2.01 3.90 355<br />
3. N 20<br />
P 30<br />
K 125<br />
plus S+Micros’ 1.89 3.85 338<br />
4. N 20<br />
P 0<br />
K 125<br />
plus S+Micros’ 1.84 3.55 325<br />
5. N 20<br />
P 60<br />
K 62.5<br />
plus S+Micros’ 1.81 3.80 310<br />
6. N 20<br />
P 60<br />
K 187<br />
plus S+Micros’ 2.02 4.10 271<br />
7. N 20<br />
P 60<br />
K 0<br />
plus S+Micros’ 1.77 3.35 300<br />
8. N 20<br />
P 60<br />
K 125<br />
1.86 3.70 331<br />
9. N 20<br />
P 40<br />
(State recommendation) 1.49 3.16 231<br />
10. N 20<br />
P 60<br />
(Farmers’ practice) 1.66 3.12 285<br />
Critical difference (CD) = 5% 0.18 0.29<br />
1<br />
Includes 30 kg S/ha, 5 kg Zn/ha, 3.8 kg Fe/ha, and 3 kg Mn/ha.<br />
Urea, diammonium phosphate, and potassium chloride were the N, P,<br />
and K sources, while Zn, Fe, Mn, and Cu were supplied via respective<br />
sulfate sources.<br />
2<br />
1 US$ = 45.28 Indian Rupees.<br />
var. HHB-67 was sown in first week of<br />
July. Ten nutrient treatments were applied<br />
as a randomized block design<br />
(RBD) with four replications (Table<br />
1 and 2). In pigeonpea, all nutrient<br />
quantities were applied as a basal<br />
dressing. In pearl millet, N was applied<br />
as two splits divided between<br />
sowing and a first mid-season irrigation.<br />
<strong>Crops</strong> were irrigated as required<br />
and weed growth was controlled.<br />
Pigeonpea was harvested in November<br />
and pearl millet in September.<br />
Data for grain and straw/stover yields<br />
were recorded on an air-dry basis.<br />
Economic analysis included treatment<br />
and general cultivation costs.<br />
Pigeonpea Response<br />
The complete treatment supplying 20-60-125 kg N-P 2<br />
O 5<br />
-K 2<br />
O/ha as<br />
well as a S+micronutrient package provided the best result by producing<br />
the highest profit of US$355/ha with a grain yield of 2.01 t/ha (Table 1).<br />
Treatments based on the state recommendation (SR) and common farmer<br />
practice (FP) both omitted K fertilizer and returned significantly less<br />
grain yields, i.e. 1.49 t/ha (-26%) and 1.66 t/ha (-17%), respectively. Corresponding<br />
net returns were US$231/ha (-35%) for SR and US$285/ha (-<br />
20%) for FP. Little change in grain yield resulted from applying P at<br />
rates beyond 60 kg P 2<br />
O 5<br />
/ha, but the introduction of K in combination<br />
with N and P returned a yield level<br />
Table 2. Effect of fertilizer treatments on pearl millet grain and stover yield and net<br />
profits, Haryana.<br />
Grain yield Stover yield Net profit 2<br />
Treatments - - - - - t/ha- - - - - US$/ha<br />
1. N 150<br />
P 90<br />
K 80<br />
plus S+Micros’ 1 3.18 7.61 154<br />
2. N 150<br />
P 60<br />
K 80<br />
plus S+Micros’ 3.28 7.70 156<br />
3. N 150<br />
P 30<br />
K 80<br />
plus S+Micros’ 2.95 6.85 159<br />
4. N 150<br />
P 0<br />
K 80<br />
plus S+Micros’ 2.89 5.95 145<br />
5. N 150<br />
P 60<br />
K 40<br />
plus S+Micros’ 2.99 6.75 146<br />
6. N 150<br />
P 60<br />
K 20<br />
plus S+Micros’ 3.21 7.11 156<br />
7. N 150<br />
P 60<br />
K 0<br />
plus S+Micros’ 2.91 5.74 136<br />
8. N 150<br />
P 60<br />
K 80<br />
3.06 6.30 161<br />
9. N 125<br />
P 62<br />
(State recommendation) 2.50 4.45 77<br />
10. N 150<br />
P 60<br />
(Farmers’ practice) 2.75 4.90 90<br />
CD = 5% 0.23 0.38<br />
1<br />
Includes 30 kg S/ha, 5 kg Zn/ha, 3.8 kg Fe/ha, and 3 kg Mn/ha. Urea,<br />
diammonium phosphate, and potassium chloride were the N, P, and K<br />
sources, while Zn, Fe, Mn, and Cu were supplied via respective sulfate<br />
sources.<br />
2<br />
1 US$ = 45.28 Indian Rupees.<br />
that was statistically equivalent<br />
to, yet less profitable than, the<br />
best complete treatment.<br />
Large improvements in stover<br />
biomass were achieved. The<br />
largest increases were seen at the<br />
highest levels of nutrient input,<br />
which included K plus the<br />
S+micronutrient package.<br />
Similar to the grain yield<br />
response, when K fertilizer was<br />
applied, a significant increase was<br />
measured relative to the FP and<br />
SR treatments. The same was not<br />
true if K was omitted and only the<br />
S+micronutrient package was<br />
applied.<br />
Leaf biomass from pigeonpea is<br />
commonly used as fodder, while plant<br />
22 <strong>Better</strong> <strong>Crops</strong>/Vol. 88 (<strong>2004</strong>, No. 2)
stems are often used for either fuel or mulching. After the rainy season, mulched<br />
stems become soft and decomposable…they in turn can be returned to the<br />
field to help improve organic matter, soil physical properties, and nutrient<br />
availability. Total biomass production from pigeonpea is estimated at 13 million<br />
metric tons (M t) using normal farmer practices. With adoption of SSNM in<br />
only 25% of Haryana’s planted area, it could increase to 15 M t.<br />
Pearl Millet Response<br />
Highest grain yields were achieved with treatments supplying at least<br />
60 kg P 2<br />
O 5<br />
/ha and 80 kg K 2<br />
O/ha. However, lower rates of K seemed able<br />
to produce statistically equivalent grain yields if co-applied with a<br />
S+micronutrient package (Table 2). Although both the SR and FP yields<br />
were inferior to the improved treatments, FP yielded more than the SR,<br />
which highlights the inadequate N recommendations being promoted by<br />
the state. Net return from grain was highest (US$161/ha) with the NPK<br />
combination, which was 109% and 79% higher than the SR and FP, respectively.<br />
As in pigeonpea, enhanced nutrient availability produced large improvements<br />
in stover biomass. Although K alone had a large effect on<br />
pearl millet stover production (42% more than the SR and 28% more<br />
than FP), much higher biomass production was possible while still maintaining<br />
high grain yield and profitability, under the complete treatments—the<br />
best at this site being 150-60-80 kg N-P 2<br />
O 5<br />
-K 2<br />
O/ha plus the<br />
S+micronutrient package.<br />
Pearl millet stover is also used as animal fodder, but the potential is<br />
great for recycling this biomass back into the field for the purposes of<br />
improving soil qualities such as organic carbon content, soil physical<br />
properties, and particularly K, secondary nutrients, and micronutrients.<br />
At current levels of productivity, total pearl millet stover production is<br />
estimated 15 M t. However, with adoption of SSNM practice on 25% of<br />
Haryana’s planted area, an additional 3 M t could become available.<br />
These results provide a clear example of the value of SSNM re-<br />
search in narrowing the gap between actual farmers’ yield and true<br />
yield potential. BC<br />
Dr. Yadav is Technical Officer (agronomy) and Dr. Hira Nand (deceased) was Chief<br />
Training Organizer, Krishi Vigyan Kendra (IARI), Shikohpur, Gurgaon 122 001, Haryana,<br />
India.<br />
Pearl millet is an<br />
important foodgrain crop.<br />
<strong>Better</strong> <strong>Crops</strong>/Vol. 88 (<strong>2004</strong>, No. 2) 23
ARGENTINA<br />
Alfalfa Production as a Function of<br />
Soil Extractable Phosphorus in the<br />
Semi-arid Pampas<br />
By Martín Díaz-Zorita and Daniel E. Buschiazzo<br />
This research provides insight into soil nutrient limitations for the main<br />
alfalfa producing soils of the semi-arid Pampas. Comparisons of critical<br />
extractable soil phosphorus (P) values were made among four common<br />
soil testing procedures.<br />
T<br />
he semi-arid Pampas region of Argentina is commonly characterized<br />
as having nitrogen (N), P, and sulfur (S) deficiency as a result of low<br />
native soil fertility and wind erosion. In reality, information on annual<br />
and pasture crop responses to nutrients is scarce, variable, and sometimes<br />
contradictory. Variability in crop response to P fertilization might be explained<br />
by differences in total and/or available soil P. Results from a<br />
climosequence analysis describe similar total P levels among agricultural<br />
soils in the region (Prüeß et al., 1992). Thus, variations in crop response must<br />
at least be partially explained by differences in available soil P.<br />
Several factors can modify soil P availability. These include: phosphate<br />
sorption by amorphous iron (Fe) and aluminum (Al) oxides, as well as precipitation<br />
of calcium phosphate in the presence of excess carbonate. Variability<br />
in crop response to P could also be attributed to other nutrient deficiencies.<br />
For example, in the eastern part of La Pampa Province, S deficiency is<br />
known to reduce alfalfa dry matter responses to P and N fertilization (Bariggi<br />
et al., 1975; Díaz-Zorita and Fernández-Canigia, 1998). Zinc (Zn) and copper<br />
(Cu) are also known yield-limiting factors for this region of Argentina (González<br />
and Buschiazzo, 1996).<br />
The Bray Kurtz 1 procedure is commonly used for the evaluation of<br />
available P for annual and pasture crops, but is less effective for soils<br />
with free calcium carbonate contents. The Olsen extraction procedure is<br />
thought to be more reliable for high pH soils, while the Mehlich 3 procedure<br />
is widely promoted for its multi-nutrient extraction capability and reduced<br />
soil analysis costs. The objective of this study<br />
was to determine the relationship between four different<br />
P extraction procedures and alfalfa dry matter<br />
production under greenhouse conditions.<br />
Surface horizons from 10 Entic Haplustoll soils<br />
were selected to obtain a range of available P levels.<br />
Main soil properties are presented in Table 1. Available<br />
soil P was determined using the Bray Kurtz 1<br />
(Beech and Leach, 1989), Olsen (Olsen and Sommers,<br />
1982), Kelowna (Buschiazzo et al., 1999), and Mehlich<br />
3 (Mehlich, 1984) procedures (Table 2). Four fertilization<br />
treatments (Table 3) were added to 1,400 cm 3<br />
pots arranged in a randomized complete block (RCB)<br />
24 <strong>Better</strong> <strong>Crops</strong>/Vol. 88 (<strong>2004</strong>, No. 2)
design with three replicates.<br />
Pots were planted to<br />
rhizobium-inoculated alfalfa.<br />
Aerial dry matter<br />
(DM) was measured at 108<br />
and 166 days after seeding.<br />
Total P, S, potassium (K),<br />
Ca, magnesium (Mg), Fe,<br />
Cu, and Zn were determined<br />
in composite<br />
samples from each treatment,<br />
sampling date, and<br />
test soil. Results of DM production were analyzed by<br />
analysis of variance (ANOVA) procedures and the Tukey<br />
mean comparison test. The mean crop response in each<br />
soil was related to soil test P as determined by each of<br />
the four extraction procedures using a linear-segmented<br />
model.<br />
Results<br />
Alfalfa dry matter production varied between<br />
1.17 and 7.05 g/pot per sampling date, showing significant<br />
interactions between soil-type and fertilization<br />
treatment. The effect of sampling date was independent<br />
of soil-type and fertilization treatment.<br />
Thus, treatment effects were analyzed separately for<br />
each soil using the average of the two sampling dates.<br />
Treatments produced significant differences<br />
(p=0.05) in dry matter production in soils A, B, C, E,<br />
H, and J compared to the control (Table 4). Soils A and H had a significant<br />
dry matter response to P fertilization alone. The complete minus P treatment<br />
(CF - P) increased dry matter production relative to the control in soils<br />
A, C, E, and H. Only soils A and B produced less dry matter than the<br />
complete treatment (CF) under the CF - P treatment. Together, these results<br />
suggest that most soils showed relevant changes in dry matter production<br />
after fertilization with nutrients other than P.<br />
The absence of a response to P and other nutrients in the soils D, F, G,<br />
and I is explained by high extractable P and soil organic matter contents, and<br />
low sand contents (Table 1). Thus, under the experimental conditions, these<br />
soils were able to provide higher<br />
nutrient supplies through mineralization.<br />
Differences in DM production<br />
were partially explained<br />
by differences in tissue P levels<br />
[DM (g/pot) = 0.95 + 4.45 P tv<br />
+ 3.22 P tv2<br />
, r 2 = 0.575, p=0.05].<br />
Tissue analysis of the non-fertilized<br />
control treatments showed<br />
Table 1. Mean physicochemical properties of the test soils from the semi-arid Pampas, Argentina.<br />
Clay Silt Sand SOM Nt Alo Feo<br />
Soil - - - - - - - - - - - - - % - - - - - - - - - - - - - Water pH - - - mg/kg - - -<br />
A 5.8 7.0 87.2 1.5 0.08 6.6 1,105 565<br />
B 11.5 18.0 70.5 1.1 0.06 8.1 1,360 557<br />
C 11.8 29.2 59.0 2.8 0.14 6.5 930 1,032<br />
D 10.7 35.6 53.7 2.2 0.10 8.0 1,540 560<br />
E 9.3 43.5 47.2 5.2 0.27 7.2 1,535 597<br />
F 18.5 34.4 47.1 2.7 0.12 6.2 1,255 1,187<br />
G 30.5 45.8 24.3 5.2 0.27 5.7 1,705 1,372<br />
H 10.0 9.3 80.7 1.2 0.06 5.8 1,155 607<br />
I 10.0 13.3 76.7 2.5 0.11 5.8 1,135 675<br />
J 12.2 19.1 68.7 2.1 0.10 5.9 730 900<br />
SOM = soil organic matter, Nt = total nitrogen, Alo = aluminum amorphous oxides;<br />
Feo = iron amorphous oxides<br />
Table able 2. Soil extractable P levels for four different<br />
procedures on 10 soils from the semi-arid<br />
Pampas, Argentina.<br />
Bray Kurtz 1 Olsen Kelowna Mehlich 3<br />
Soil - - - - - - - - - - - - mg/kg - - - - - - - - - - - -<br />
A 9.5 – – 16.9<br />
B 3.6 – 11.5 –<br />
C 24.2 8.6 26.9 26.5<br />
D 9.3 2.6 10.8 13.5<br />
E 10.6 3.7 14.2 15.9<br />
F 37.3 18.6 37.6 35.2<br />
G 67.2 61.5 86.1 56.8<br />
H 9.2 3.1 10.2 14.7<br />
I 29.0 11.6 40.2 28.0<br />
J 5.9 6.2 13.7 11.3<br />
Table 3. Fertilization treatments and levels of applied nutrients.<br />
Nutrients<br />
P 2<br />
O 5<br />
K 2<br />
O S N B Cu<br />
Treatment - - - - - - - - - - - - - - - kg/ha- - - - - - - - - - - - - - -<br />
Control – – – – – –<br />
Complete fertilization (CF) 79 52.4 26.2 22.5 0.6 1.5<br />
Complete without P (CF - P) – 52.4 26.2 24.0 0.6 1.5<br />
P fertilization (PF) 79 52.4 – – – –<br />
<strong>Better</strong> <strong>Crops</strong>/Vol. 88 (<strong>2004</strong>, No. 2) 25
Table 4. Effects of four fertilizer treatments on alfalfa dry<br />
matter production (average of two sampling dates)<br />
using 10 semi-arid Pampas soils.<br />
Treatment<br />
Soil Control PF CF - P CF<br />
- - - - - - - - - - - - g/pot - - - - - - - - - - - -<br />
A 1.54 c 2.57 b 2.40 b 3.56 a<br />
B 2.04 b 2.36 b 2.32 b 4.09 a<br />
C 3.06 b 3.31 b 4.30 a 4.49 a<br />
D 2.22 2.94 2.69 3.82<br />
E 3.99 c 4.82 ab 4.43 bc 5.71 a<br />
F 3.53 3.89 4.47 4.16<br />
G 4.78 4.90 4.71 4.76<br />
H 2.74 b 3.96 a 3.50 a 4.50 a<br />
I 3.22 3.23 4.01 4.68<br />
J 2.53 c 3.25 bc 3.33 ab 4.23 a<br />
Different letters indicate significant differences<br />
between treatments (p=0.05).<br />
Figur<br />
igure e 1. Relationship<br />
between relative alfalfa<br />
dry matter production,<br />
as the ratio CF -P/CF,<br />
and soil P levels<br />
extracted according<br />
to (a) Bray Kurtz 1, (b)<br />
Olsen, (c) Kelowna, and<br />
(d) Mehlich 3 procedures.<br />
S contents below the critical level of 0.22% in most<br />
soils, which suggests that S, and not P, could be the<br />
limiting nutrient for optimal alfalfa production. Several<br />
authors have obtained similar results after fertilizing<br />
alfalfa and pastures in field studies in the area<br />
(Díaz-Zorita and Fernández-Canigia, 1998). In soils<br />
A, B, E, F, and H, the tissue Zn contents in control<br />
pots were higher than those in treatments fertilized<br />
with P alone, suggesting that P fertilization under<br />
low Zn availability could induce Zn deficiency and<br />
lower crop yield. Tissue Mg contents were also below<br />
the critical level for optimum alfalfa dry matter production,<br />
which may be due to cation competition<br />
between K and Mg in soils with high native K levels.<br />
Phosphorus concentration in alfalfa tissues were<br />
significantly correlated with extractable soil P levels no matter which extraction<br />
procedure was used.<br />
Relative DM production was related to extractable soil P contents<br />
when expressed either as the ratio between the control and PF treatment,<br />
or the ratio between the CF - P and CF treatments (Figure 1).<br />
Despite large variation in the measured values, strong linear relationships<br />
existed between the four extracting procedures (Table 5). Since<br />
no differences existed between the duration, intensity, or soil:extractant<br />
solution ratio used in the extraction procedures, the lower extractable<br />
soil P values obtained with the Olsen procedure is explained by the lower<br />
reactivity of the extraction solution, NaHCO 3<br />
, compared to the extraction<br />
solutions used in the Bray Kurtz 1 or Mehlich 3 procedures.<br />
The critical extractable soil P content, based on the Bray Kurtz 1 procedure,<br />
was greater than those values suggested in field studies (Peaslee, 1978;<br />
Culot, 1986). This is likely an artifact<br />
common to pot studies wherein small soil<br />
volumes allow full exploration by plant<br />
roots and complete exhaustion of available<br />
soil nutrients. As a result, the critical<br />
levels for alfalfa dry matter response<br />
to P fertilization should not be considered<br />
conclusive.<br />
Conclusions<br />
Alfalfa dry matter production in soils<br />
of the semi-arid Pampas region, under<br />
greenhouse growing conditions, depends<br />
on extractable soil P and the availability<br />
of other nutrients such as S, Mg, and<br />
Zn. The response of alfalfa to P fertilization<br />
could be partially explained by the<br />
extractable soil P contents determined<br />
by the Bray Kurtz 1, Olsen, Kelowna, or<br />
Mehlich 3 procedures. The critical<br />
26 <strong>Better</strong> <strong>Crops</strong>/Vol. 88 (<strong>2004</strong>, No. 2)
Table 5. Linear relationship between soil extractable P levels extracted by four different procedures.<br />
P Olsen<br />
= - 7.2 + 0.90 P Bray Kurtz 1<br />
P Bray Kurtz 1<br />
= 9.7 + 0.99 P Olsen<br />
r 2 = 0.89<br />
P Kelowna<br />
= 2.2 + 1.18 P Bray Kurtz 1<br />
P Bray Kurtz 1<br />
= -0.9 + 0.81 P Kelowna<br />
r 2 = 0.96<br />
P Mehlich III<br />
= 8.0 + 0.73 P Bray Kurtz 1<br />
P Bray Kurtz 1<br />
= -10.5 + 1.35 P Mehlich III<br />
r 2 = 0.98<br />
extractable soil P content<br />
for maximum alfalfa P Mehlich III<br />
P Kelowna<br />
= 11.8 + 1.25 P Olsen<br />
P Olsen<br />
= -7.8 + 0.74 P Kelowna<br />
r 2 = 0.93<br />
= 9.6 + 1.44 P Olsen<br />
P Olsen<br />
= -4.3 + 0.58 P Mehlich III<br />
r 2 = 0.84<br />
dry matter production P Mehlich III<br />
= 6.27 + 0.66 P Kelowna<br />
P Kelowna<br />
= -5.4 + 1.32 P Mehlich III<br />
r 2 = 0.87<br />
depended upon the<br />
extraction procedure. Further field study is required to estimate critical P<br />
levels for fertilization recommendations in this region. In such studies, it is<br />
suggested to apply adequate levels of S, Mg, and Zn, since these nutrients<br />
were observed to be limiting factors for optimal alfalfa growth. BC<br />
Dr. Díaz-Zorita is with the Department of <strong>Plant</strong> Production, Agronomy, University of<br />
Buenos Aires and Nitragin Argentina S.A., Calle 10 y 11, Parque Industrial Pilar, (1629)<br />
Pilar, Buenos Aires (Argentina). Phone: +54 322 496100. E-mail:<br />
mdzorita@speedy.com.ar. Dr. Buschiazzo is with EEA INTA Anguil, CONICET and<br />
Agronomy, University of La Pampa, CC 300, (6300) Santa Rosa, La Pampa (Argentina).<br />
E-mail: buschiazzo@agro.unlpam.edu.ar.<br />
References<br />
Bariggi, C., N. Romero, and G. Schenkel. 1975.. EEA INTA Anguil. Proyecto Alfalfa-FAO-<br />
INTA 71/584.<br />
Beech, D.F. and G.J. Leach. 1989. Australian Journal of Experimental Agriculture 29: 655-<br />
662.<br />
Buschiazzo, D.E., S. Aimar, and T. Zobeck. 1999. Soil Sci. 164: 133-138.<br />
Culot, J.P. 1986. p. 81-117. In INTA (ed.), Investigación, Tecnología y Producción de Alfalfa.<br />
INTA, Buenos Aires. Argentina.<br />
Díaz-Zorita, M. and M.V. Fernández-Canigia. 1998. Ciencia del Suelo 16: 103-106.<br />
González, G.P. and D.E. Buschiazzo. 1996. In Actas XV Congreso Argentino de Ciencia del<br />
Suelo. Asociación Argentina de la Ciencia del Suelo (ed.), AACS. p. 179-180. Santa<br />
Rosa, LP. Argentina.<br />
Mehlich, A. 1984. Commun. Soil Sci. <strong>Plant</strong> Anal. 15: 1409-1416.<br />
Olsen, S.R. and L.E. Sommers. 1982. Phosphorus, p. 403-429. In A.L. Page, R.H. Miller, and<br />
D.R. Keeney (eds.), Methods of Soil Analysis, Part 2. Chemical and Microbiological<br />
Properties. ASA-SSAA, Madison, WI. USA.<br />
Peaslee, D.E. 1978. Commun. Soil Sci. <strong>Plant</strong> Anal. 9:429-442.<br />
Prüeß, A., D.E. Buschiazzo, E. Schlichting, and K. Stahr. 1992. Catena 19: 135-145.<br />
<strong>Better</strong> <strong>Crops</strong>/Vol. 88 (<strong>2004</strong>, No. 2) 27
COSTA RICA<br />
Sugarcane Production and<br />
Changes in Soil Phosphorus Forms<br />
after Organic and Inorganic<br />
Fertilization<br />
By Carlos Henríquez, Floria Bertsch, and Randy Killorn<br />
Where adequate organic sources exist, high yield sugarcane production<br />
systems should integrate their use with inorganic fertilizers. Both have a<br />
role in providing nutrients to crops and improving the physical microbiological<br />
properties of soil. An integrated strategy promotes agro-ecosystem<br />
diversity and maximum economic yield (MEY) agriculture.<br />
Sugarcane production<br />
without added fertilizer can<br />
seriously deplete all forms<br />
of soil P on soils derived<br />
from volcanic ash.<br />
Adopting appropriate soil and crop management practices positively<br />
affects chemical, physical, and biological conditions of soil. Addition<br />
of phosphorus (P) may impact soil P forms and thus the timing and<br />
intensity of P availability. Both organic and inorganic sources enhance soil P<br />
availability and crop yields. In tropical soils, the effectiveness of either is<br />
often site-specific (Ball-Coelho et al., 1993; Reddy et al., 1999; Sui et<br />
al., 1999). Overall, research results suggest the need for more investigation<br />
regarding the impact of fertilization on P cycling in tropical agroecosystems.<br />
Sugarcane production in Costa Rica is mainly located on high organic<br />
matter soils derived from volcanic ash (Andisols). Andisols are<br />
strongly P-fixing due to adsorption at the active surfaces of allophane<br />
and imogolite minerals and also by aluminum (Al)-humus complexes<br />
through ligand-exchange reactions (Sanchez and Uehara,<br />
1980; Molina et al., 1991; Espinosa, 1992). High organic matter<br />
contents imply that the organic P fraction plays an important<br />
role in satisfying the crop’s demand. Conditions typical<br />
of the soil and region combine to complicate the estimation<br />
of soil P status and challenge the ability of soil testing<br />
to adequately predict soil P availability (Beck and Sanchez,<br />
1994; Espinosa, 1992).<br />
This experiment studied soil P forms resulting from application<br />
of organic and inorganic fertilizers on an Andisol.<br />
Yield response data for the nutrient sources applied to sugar<br />
cane was also evaluated. A sugarcane (Sacharum sp. var H-<br />
611721) field experiment conducted from 1997 to 2002 on a<br />
Typic Hapludand at Juan Viñas, Costa Rica (1,000 meters<br />
above sea level and 2,000 mm of rain per year) was harvested<br />
twice during this period. Yield of cane and sugar were measured<br />
along with total P uptake. Treatments consisted of 0,<br />
50, and 100% of the inorganic fertilizer recommendation in<br />
combination with compost at either 0 or 8 t/ha (Table 1).<br />
28 <strong>Better</strong> <strong>Crops</strong>/Vol. 88 (<strong>2004</strong>, No. 2)
Table 1. Estimated amounts of nutrients (N, P, and K) applied as fertilizer on sugarcane over 4 years on a Typic Hapludand at Juan Viñas,<br />
Costa Rica.<br />
Nitrogen Phosphorus Potassium<br />
Treatments Organic Mineral Total Organic Mineral Total Organic Mineral Total<br />
Compost Fertilization - - - - - - - - - - - - - - - - - - - - - - - - - - - - - - - - - - - - - - kg/ha - - - - - - - - - - - - - - - - - - - - - - - - - - - - - - - - - - - - - -<br />
0 0 0 0 0 0 0 0 0 0 0<br />
0 50% 0 245 245 0 59 59 0 162 162<br />
0 100% 0 490 490 0 118 118 0 323 323<br />
8 t/ha 50% 46 245 291 10 59 69 26 162 188<br />
8 t/ha 100% 46 490 536 10 118 128 26 323 359<br />
Nutrients were applied at the beginning of each growing cycle.<br />
Soil samples were collected, ground (
Table 3. Sugarcane yields obtained after two growth cycles during 4 years on a<br />
Typic Hapludand, Juan Viñas, Costa Rica.<br />
Treatments 1999 yield 2001 yield Accumulated<br />
Compost Fertilizer kg sugar/t t/ha kg sugar/t t/ha yield, t/ha<br />
0 0 112 106 b 101 163 b 269 b<br />
0 50% 111 134 a 98 218 a 352 a<br />
0 100% 113 142 a 103 239 a 381 a<br />
8 t/ha 50% 115 139 a 108 224 a 363 a<br />
8 t/ha 100% 119 145 a 96 258 a 403 a<br />
Significance ns ** ns * **<br />
ns Not significant at p=0.05<br />
* Significance at p=0.01 to 0.05<br />
** Significance at p=0.01<br />
Means within the same column followed by the same letter are not<br />
significantly different (p=0.05) by LSD test.<br />
Figur<br />
igure e 1. Total P<br />
uptake of sugarcane on<br />
a Typic Hapu-land, Juan<br />
Viñas, Costa Rica.<br />
Phosphorus uptake by sugar<br />
cane is shown (Figure 1). Total<br />
uptake by sugar cane yielding 180<br />
t/ha in 700 days (2-year growth<br />
cycle) was approximately 60 kg/<br />
ha.<br />
Soil P Forms<br />
According to the fractionation<br />
scheme applied, the proportions<br />
of soil P forms in the fertilizer<br />
plus compost treatments averaged:<br />
0.4% labile-P, 6.4% NaOH extractable-Pi,<br />
9.2% HCl extractable-Pi,<br />
32.5% extractable-Po, and 51.4% residual-P.<br />
Soil P forms that were most<br />
correlated with yield and applied P were<br />
labile-P and NaOH-Pi (Figure 2). The<br />
NaOH-Pi fraction represents P held by<br />
chemisorption to Fe and Al components<br />
of soil surfaces. This fraction is thought<br />
to act as a sink for inorganic fertilizer<br />
applied and labile-Pi. Little relation was<br />
found between cane yield and organic-,<br />
residual-, or total-P.<br />
Summary<br />
Applied P was mainly correlated with labile-Pi and NaOH-Pi, but<br />
results suggest active participation from nearly all soil P fractions in<br />
maintaining labile-Pi levels in this soil. Adsorption-desorption processes<br />
act intensively in this soil and it was possible to see the effect of fertilizer<br />
in desorbing P for a long time after its application. Crop production without<br />
added fertilizer will seriously deplete all forms of soil P. BC<br />
Figur<br />
igure e 2. Relation between accumulated sugarcane yields and labile-Pi and NaOH-Pi on an Andisol. Juan Viñas,<br />
Costa Rica.<br />
30 <strong>Better</strong> <strong>Crops</strong>/Vol. 88 (<strong>2004</strong>, No. 2)
More study is needed regarding impact of<br />
P fertilization on P cycling in tropical agroecosystems.<br />
Dr. Henríquez and M.Sc. Bertsch are Professors at the University of Costa Rica.<br />
Dr. Killorn is Professor, Department of Agronomy, Iowa State University, Ames,<br />
Iowa. E-mail: carlosh@cariari.ucr.ac.cr.<br />
Acknowledgments<br />
The authors acknowledge Dr. José Espinosa and the PPI/PPIC Northern Latin<br />
America Program (INPOFOS), as well as the valuable cooperation of the staff<br />
and workers from Hacienda Juan Viñas and the Laboratory of Soil and <strong>Plant</strong><br />
Analysis in Centro de Investigaciones Agronomicas at the Universidad de Costa<br />
Rica. Special thanks to Gloria Melendez, Luis Garcia, Pablo Lopez, and Ivania<br />
Cartin.<br />
Literature<br />
Cited<br />
Ball-Coello, B., I.H. Salcedo, H. Tiessen, and J.W.B. Stewart. 1993. Soil Sci. Soc. Am. J.<br />
57:1027-1034.<br />
Beck, M.A. and P.A. Sanchez, 1994. Soil Sci. Soc. Am. J. 58:1424-1431.<br />
Espinosa, J. 1992. In Proceedings of the tropsoil phosphorus decision support system<br />
workshop. p. 109-114<br />
Hedley, M.J., J.W.B. Stewart, and B.S. Chauhan, 1982. Soil Sci. Soc. Am. J. 46:970-976.<br />
Molina, E., E. Bornemisza, F. Sancho, and D.L. Kass. 1991. Commun. Soil Sci. <strong>Plant</strong><br />
Anal. 22(13-14):1459-1476.<br />
Reddy, D.D., A.S. Rao, and P.N. Takkar. 1999. Biol. Fertil. Soils 28:150-155.<br />
Sanchez, P. and G. Uehara. 1980. In F.E. Khasawneh, E.C. Sample, and E.J. Kamprath (ed.)<br />
The role of phosphorus in agriculture. ASA, CSSA and SSSA. Madison, WI. p 471-514.<br />
Sui, Y., M.L. Thompson, and C. Shang. 1999. Soil Sci. Soc. Am. J. 63:1174-1180.<br />
PPI/PPIC on the Web:<br />
www.ppi-ppic.org<br />
Learn more about PPI/PPIC programs,<br />
research support, publications, and links by<br />
visiting the website at www.ppi-ppic.org. From the central<br />
website, visitors may reach the various individual regional sites<br />
where PPI/PPIC programs are at work. Also be sure to register<br />
for customized announcements of new information while at the<br />
website.<br />
<strong>Better</strong> <strong>Crops</strong>/Vol. 88 (<strong>2004</strong>, No. 2) 31
LIMITATIONS<br />
OF THE MIND<br />
I count as great fortune the opportunity my work has provided in meeting people<br />
who tenaciously harness intellect with logic and compassion, and who view the inhabitants<br />
of this world with understanding and tolerance. Limitations of the mind is<br />
a phrase I borrow from a friend in Pakistan, Dr. Zafar Altaf. In one of his books, he<br />
cites Banham’s ‘The Anatomy of Change’. He offers what I consider to be a key principle<br />
and ingredient for progress: “What cannot be readily bought are the teams of<br />
skilled, committed and experienced people.” Together, teams of people can challenge<br />
limitations of the mind.<br />
Over the past decade and more, the truth of Banham’s statement repeatedly proves<br />
itself in what I see and hear as I visit with PPI/PPIC staff and their cooperators and<br />
colleagues. Regarding the <strong>Institute</strong>, its construct as originally devised and as it evolves<br />
in each and every one of its programs, is centered on building teams … of researchers,<br />
extension agronomists, farmers, decision makers and industry … all focused on improving<br />
soil productivity to overcome limitations of the soil … and the minds of those<br />
who tend them. These teams of skilled, committed and experienced people from different<br />
disciplines and diverse backgrounds are fundamentally important to the tasks of<br />
increasing prosperity for farmers, food sufficiency for nations, and environmental security<br />
for our global village. They are also fundamentally critical in meeting the challenges<br />
still before us, to the challenges that limit our minds.<br />
I offer my sincere thanks to all who labor with us. It’s a great experience and it<br />
provides great satisfaction as we view the tremendous progress made. But, we haven’t<br />
crossed the finish line. There is still much left to do.<br />
Agronomists and soil scientists are literally, people of the earth … people with<br />
their feet on the ground and their hands in the soil. They are my kind of people<br />
because where we work and what we do is uniquely basic to social development and<br />
progress. What’s slowing our progress; what’s holding us back? Is it limitations of<br />
the mind?<br />
Dr. Mark D. Stauffer,<br />
Senior Vice President,<br />
<strong>International</strong> Programs, PPI<br />
and President, PPIC<br />
Printed on recycled<br />
paper with soy ink.<br />
Periodicals<br />
Postage<br />
Potash & Phosphate <strong>Institute</strong><br />
Suite 110, 655 Engineering Drive<br />
Norcross, Georgia 30092-2837