

Alma Mater Studiorum Universit`a degli Studi di Bologna ... - Inaf
Alma Mater Studiorum Universit`a degli Studi di Bologna ... - Inaf
Alma Mater Studiorum Universit`a degli Studi di Bologna ... - Inaf

Create successful ePaper yourself
Turn your PDF publications into a flip-book with our unique Google optimized e-Paper software.
<strong>Alma</strong> <strong>Mater</strong> <strong><strong>Stu<strong>di</strong></strong>orum</strong><br />
Università <strong>degli</strong> <strong>Stu<strong>di</strong></strong> <strong>di</strong> <strong>Bologna</strong><br />
Facoltá <strong>di</strong> Scienze Matematiche, Fisiche e Naturali<br />
Dipartimento <strong>di</strong> Astronomia<br />
DOTTORATO DI RICERCA IN ASTRONOMIA<br />
Ciclo XXIII<br />
MAGNETIC FIELDS AROUND RADIO GALAXIES<br />
FROM FARADAY ROTATION MEASURE ANALYSIS<br />
Dottoranda:<br />
DARIA GUIDETTI<br />
Coor<strong>di</strong>natore:<br />
Chiar.mo Prof.<br />
Lauro MOSCARDINI<br />
Relatrice:<br />
Chiar.ma Prof.ssa<br />
Loretta GREGORINI<br />
Co-relatori:<br />
Chiar.mo Prof. Robert A. LAING<br />
Dott.ssa Paola PARMA<br />
Settore Scientifico Disciplinare: Area 02 - Scienze Fisiche<br />
FIS/05 Astronomia e Astrofisica<br />
Esame Finale Anno 2011
This thesis has been carried out at:<br />
European Southern Observatory (ESO, Garching)<br />
and<br />
Istituto <strong>di</strong> Ra<strong>di</strong>oastronomia (IRA-INAF, <strong>Bologna</strong>)<br />
as part of the Institute research activity
To Hypatia from Alexandria in Egypt, mother of the observational method<br />
To all Warriors of the Light<br />
And to Lorenzo, which will arrive soon and be met with lots of love
“There are two possible outcomes: if the result confirms the hypothesis, then you’ve made a<br />
<strong>di</strong>scovery. If the result is contrary to the hypothesis, then you’ve made a <strong>di</strong>scovery.”<br />
(Enrico Fermi)<br />
Let Light and Love and Power restore the Plan on Earth.
Contents<br />
Abstract<br />
i<br />
1 Physics of ra<strong>di</strong>o galaxies 1<br />
1.1 Active galaxies . . . . . . . . . . . . . . . . . . . . . . . . . . . . . . . . . . . 1<br />
1.2 Non-thermal emission mechanisms of active galaxies . . . . . . . . . . . . . . . 2<br />
1.2.1 Synchrotron ra<strong>di</strong>ation . . . . . . . . . . . . . . . . . . . . . . . . . . . . 2<br />
1.2.2 Polarization of synchrotron ra<strong>di</strong>ation . . . . . . . . . . . . . . . . . . . . 3<br />
1.2.3 Inverse Compton emission . . . . . . . . . . . . . . . . . . . . . . . . . 5<br />
1.3 Ra<strong>di</strong>o galaxies . . . . . . . . . . . . . . . . . . . . . . . . . . . . . . . . . . . . 6<br />
1.3.1 Ra<strong>di</strong>o-galaxy morphologies . . . . . . . . . . . . . . . . . . . . . . . . 6<br />
1.3.2 Morphology and expansion of lobes and tails . . . . . . . . . . . . . . . 7<br />
1.3.3 Internal physical con<strong>di</strong>tions of ra<strong>di</strong>o galaxies . . . . . . . . . . . . . . . 8<br />
1.3.4 Equipartition parameters . . . . . . . . . . . . . . . . . . . . . . . . . . 8<br />
1.3.5 Field and particle content of ra<strong>di</strong>o lobes and tails . . . . . . . . . . . . . 10<br />
2 The X-ray environment of ra<strong>di</strong>o galaxies 13<br />
2.1 Introduction . . . . . . . . . . . . . . . . . . . . . . . . . . . . . . . . . . . . . 13<br />
2.2 The thermal component . . . . . . . . . . . . . . . . . . . . . . . . . . . . . . . 14<br />
2.2.1 The continuum spectrum . . . . . . . . . . . . . . . . . . . . . . . . . . 14<br />
2.2.2 Morphology of the X-ray emitting gas . . . . . . . . . . . . . . . . . . . 15<br />
2.3 Ra<strong>di</strong>o source – environment interactions . . . . . . . . . . . . . . . . . . . . . . 17<br />
2.3.1 X-ray cavities and their content . . . . . . . . . . . . . . . . . . . . . . 17<br />
2.3.2 Gas compression and heating by ra<strong>di</strong>o galaxies . . . . . . . . . . . . . . 18<br />
i
3 Magnetic fields in the hot phase of the intergalactic me<strong>di</strong>um 21<br />
3.1 Introduction . . . . . . . . . . . . . . . . . . . . . . . . . . . . . . . . . . . . . 21<br />
3.1.1 Diffuse synchrotron sources in galaxy clusters . . . . . . . . . . . . . . . 22<br />
3.1.2 Magnetic fields from <strong>di</strong>ffuse ra<strong>di</strong>o sources . . . . . . . . . . . . . . . . . 24<br />
3.1.3 Diffuse inverse Compton emission . . . . . . . . . . . . . . . . . . . . . 25<br />
3.2 Faraday Rotation . . . . . . . . . . . . . . . . . . . . . . . . . . . . . . . . . . 26<br />
3.2.1 Internal Faraday Rotation . . . . . . . . . . . . . . . . . . . . . . . . . 27<br />
3.2.2 Foreground RM contributions . . . . . . . . . . . . . . . . . . . . . . . 28<br />
3.2.3 Galactic Faraday rotation . . . . . . . . . . . . . . . . . . . . . . . . . . 30<br />
3.3 Depolarization . . . . . . . . . . . . . . . . . . . . . . . . . . . . . . . . . . . . 31<br />
3.4 RM analysis . . . . . . . . . . . . . . . . . . . . . . . . . . . . . . . . . . . . . 32<br />
3.5 The magnetic field profile . . . . . . . . . . . . . . . . . . . . . . . . . . . . . . 33<br />
3.6 Tangled magnetic field . . . . . . . . . . . . . . . . . . . . . . . . . . . . . . . 34<br />
3.7 The magnetic field power spectrum . . . . . . . . . . . . . . . . . . . . . . . . . 36<br />
3.7.1 Magnetic field power spectrum from two-<strong>di</strong>mensional analysis . . . . . . 38<br />
4 Structure of the magneto-ionic me<strong>di</strong>um around the Fanaroff-Riley Class I ra<strong>di</strong>o<br />
galaxy 3C 449 43<br />
4.1 The ra<strong>di</strong>o source 3C 449: general properties . . . . . . . . . . . . . . . . . . . . 43<br />
4.2 Total intensity and polarization properties . . . . . . . . . . . . . . . . . . . . . 46<br />
4.3 The Faraday rotation in 3C 449 . . . . . . . . . . . . . . . . . . . . . . . . . . . 47<br />
4.3.1 Rotation measure images . . . . . . . . . . . . . . . . . . . . . . . . . . 47<br />
4.3.2 The Galactic Faraday rotation . . . . . . . . . . . . . . . . . . . . . . . 50<br />
4.4 Depolarization . . . . . . . . . . . . . . . . . . . . . . . . . . . . . . . . . . . . 51<br />
4.5 Two <strong>di</strong>mensional analysis . . . . . . . . . . . . . . . . . . . . . . . . . . . . . . 54<br />
4.5.1 General considerations . . . . . . . . . . . . . . . . . . . . . . . . . . . 54<br />
4.5.2 Structure functions . . . . . . . . . . . . . . . . . . . . . . . . . . . . . 54<br />
4.6 Three-<strong>di</strong>mensional analysis . . . . . . . . . . . . . . . . . . . . . . . . . . . . . 59<br />
4.6.1 Models . . . . . . . . . . . . . . . . . . . . . . . . . . . . . . . . . . . 59<br />
4.6.2 Magnetic field strength and ra<strong>di</strong>al profile . . . . . . . . . . . . . . . . . 60
4.6.3 The outer scale of the magnetic-field fluctuations . . . . . . . . . . . . . 64<br />
4.7 Summary and comparison with other sources . . . . . . . . . . . . . . . . . . . 67<br />
4.7.1 Summary . . . . . . . . . . . . . . . . . . . . . . . . . . . . . . . . . . 67<br />
4.7.2 Comparison with other sources . . . . . . . . . . . . . . . . . . . . . . . 70<br />
5 Ordered magnetic fields around ra<strong>di</strong>o galaxies: evidence for interaction with the<br />
environment 73<br />
5.1 The Sample . . . . . . . . . . . . . . . . . . . . . . . . . . . . . . . . . . . . . 74<br />
5.1.1 0206+35 . . . . . . . . . . . . . . . . . . . . . . . . . . . . . . . . . . 77<br />
5.1.2 3C 270 . . . . . . . . . . . . . . . . . . . . . . . . . . . . . . . . . . . 77<br />
5.1.3 3C 353 . . . . . . . . . . . . . . . . . . . . . . . . . . . . . . . . . . . 78<br />
5.1.4 M 84 . . . . . . . . . . . . . . . . . . . . . . . . . . . . . . . . . . . . 78<br />
5.2 Analysis of RM and depolarization images . . . . . . . . . . . . . . . . . . . . . 79<br />
5.3 Rotation measure images . . . . . . . . . . . . . . . . . . . . . . . . . . . . . . 79<br />
5.4 Depolarization . . . . . . . . . . . . . . . . . . . . . . . . . . . . . . . . . . . . 84<br />
5.5 Rotation measure structure functions . . . . . . . . . . . . . . . . . . . . . . . . 86<br />
5.6 Rotation-measure bands from compression . . . . . . . . . . . . . . . . . . . . . 88<br />
5.7 Rotation-measure bands from a draped magnetic field . . . . . . . . . . . . . . . 95<br />
5.7.1 General considerations . . . . . . . . . . . . . . . . . . . . . . . . . . . 95<br />
5.7.2 Axisymmetric draped magnetic fields . . . . . . . . . . . . . . . . . . . 96<br />
5.7.3 A two-<strong>di</strong>mensional draped magnetic field . . . . . . . . . . . . . . . . . 97<br />
5.7.4 RM reversals . . . . . . . . . . . . . . . . . . . . . . . . . . . . . . . . 97<br />
5.8 Discussion . . . . . . . . . . . . . . . . . . . . . . . . . . . . . . . . . . . . . . 99<br />
5.8.1 Where do bands occur? . . . . . . . . . . . . . . . . . . . . . . . . . . . 99<br />
5.8.2 RM bands in other sources . . . . . . . . . . . . . . . . . . . . . . . . . 99<br />
5.8.3 Foreground isotropic field fluctuations . . . . . . . . . . . . . . . . . . . 100<br />
5.8.4 Asymmetries in RM bands . . . . . . . . . . . . . . . . . . . . . . . . . 103<br />
5.8.5 Enhanced depolarization and mixing layers . . . . . . . . . . . . . . . . 104<br />
5.9 Conclusions and outstan<strong>di</strong>ng questions . . . . . . . . . . . . . . . . . . . . . . . 104
6 Faraday rotation in two extreme environments 109<br />
6.1 The sources . . . . . . . . . . . . . . . . . . . . . . . . . . . . . . . . . . . . . 109<br />
6.1.1 B2 0755+37 . . . . . . . . . . . . . . . . . . . . . . . . . . . . . . . . . 109<br />
6.1.2 M 87 . . . . . . . . . . . . . . . . . . . . . . . . . . . . . . . . . . . . 110<br />
6.2 Two-<strong>di</strong>mensional analysis: rotation measure and depolarization . . . . . . . . . . 111<br />
6.2.1 0755+37: images . . . . . . . . . . . . . . . . . . . . . . . . . . . . . . 113<br />
6.2.2 M 87: images . . . . . . . . . . . . . . . . . . . . . . . . . . . . . . . . 116<br />
6.3 Two-<strong>di</strong>mensional analysis: structure functions . . . . . . . . . . . . . . . . . . . 118<br />
6.4 Preliminary conclusions . . . . . . . . . . . . . . . . . . . . . . . . . . . . . . . 121<br />
Summary and conclusions 125<br />
6.5 Summary . . . . . . . . . . . . . . . . . . . . . . . . . . . . . . . . . . . . . . 125<br />
6.5.1 The tailed source 3C 449 . . . . . . . . . . . . . . . . . . . . . . . . . . 125<br />
6.5.2 The lobed ra<strong>di</strong>o galaxies 0206+35, 3C 270, M 84 and 3C 353 . . . . . . . 126<br />
6.5.3 The ra<strong>di</strong>o galaxies 0755+37 and M 87 . . . . . . . . . . . . . . . . . . . 127<br />
6.6 General conclusions . . . . . . . . . . . . . . . . . . . . . . . . . . . . . . . . . 128<br />
6.7 Future prospects . . . . . . . . . . . . . . . . . . . . . . . . . . . . . . . . . . . 131<br />
Appen<strong>di</strong>x 133<br />
Data reduction and imaging of lobed ra<strong>di</strong>o galaxies 135<br />
.1 Observations and VLA data reduction . . . . . . . . . . . . . . . . . . . . . . . 135<br />
.2 Images . . . . . . . . . . . . . . . . . . . . . . . . . . . . . . . . . . . . . . . . 138<br />
.2.1 0206+35 . . . . . . . . . . . . . . . . . . . . . . . . . . . . . . . . . . 140<br />
.2.2 0755+37 . . . . . . . . . . . . . . . . . . . . . . . . . . . . . . . . . . 140<br />
.2.3 M 84 . . . . . . . . . . . . . . . . . . . . . . . . . . . . . . . . . . . . 141<br />
Bibliography 143<br />
Acknowledgments 153
Abstract<br />
The existence of <strong>di</strong>ffuse magnetic fields ofµG strength in the hot intergalactic me<strong>di</strong>um is now well<br />
established. Our knowledge about them has greatly improved over the last few decades, mainly<br />
thanks to ra<strong>di</strong>o continuum observations, which have detected synchrotron emission from cluster<br />
<strong>di</strong>ffuse sources (halos and relics) and Faraday rotation of polarized emission from embedded<br />
and/or background ra<strong>di</strong>o galaxies. Such fields are not thought to be dynamically significant, since<br />
they provide typical magnetic pressures one or two orders of magnitude below thermal values.<br />
However, they are believed to strongly influence the heat conductivity in the intergalactic me<strong>di</strong>um<br />
and to inhibit the spatial mixing of gas and propagation of cosmic rays. Therefore, in order to<br />
improve our knowledge of the physical processes in the gaseous environment of galaxies, accurate<br />
measurements of quantities such as magnetic field strength, spatial variation, topology and power<br />
spectrum are crucial. While most work until recently has been devoted to rich clusters of galaxies,<br />
little attention has been given to sparser environments, such as groups of galaxies, although similar<br />
physical processes are likely to be at work.<br />
The purpose of this thesis is to investigate the strength and structure of the magnetized me<strong>di</strong>um<br />
surroun<strong>di</strong>ng ra<strong>di</strong>o galaxies via observations of the Faraday effect. This study is based on an<br />
analysis of the polarization properties of ra<strong>di</strong>o galaxies selected to have a range of morphologies<br />
(elongated tails, or lobes with small axial ratios) and to be located in a variety of environments<br />
(from rich cluster core to small group). The targets include famous objects like M 84 and M 87. A<br />
key aspect of this work is the combination of accurate ra<strong>di</strong>o imaging with high-quality X-ray data<br />
for the gas surroun<strong>di</strong>ng the sources.<br />
Although the focus of this thesis is primarily observational, I developed analytical models and<br />
performed two- and three-<strong>di</strong>mensional numerical simulations of magnetic fields.<br />
The steps of the thesis are: (a) to analyze new and archival observations of Faraday rotation<br />
measure (RM) across ra<strong>di</strong>o galaxies and (b) to interpret these and existing RM images using<br />
sophisticated two and three-<strong>di</strong>mensional Monte Carlo simulations.<br />
i
This thesis aims to pose and answer the following basic questions.<br />
1. What is the origin of the bulk of the Faraday effect observed across ra<strong>di</strong>o galaxies? Two<br />
possible contributors have been <strong>di</strong>scussed in the literature: the intergalactic me<strong>di</strong>um as a<br />
whole and a local sheath formed through mixing layer surroun<strong>di</strong>ng the ra<strong>di</strong>o lobes.<br />
2. How does the intergalactic magnetic field strength scale with the thermal density? Is there<br />
a connection with the richness of the environment? Is the magnetic field ever energetically<br />
important?<br />
3. Can the intergalactic magnetic field always be described as an isotropic, Gaussian random<br />
variable? If so, what is its power spectrum? Is there evidence for Kolmogorov turbulence?<br />
What are the maximum and minimum scales? Is there evidence for a preferred <strong>di</strong>rection or<br />
two-<strong>di</strong>mensionality?<br />
4. How do embedded ra<strong>di</strong>o galaxies affect the surroun<strong>di</strong>ng plasma and the structure and<br />
strength of the field within it? What can be ascribed to the source morphology? Recent X-<br />
ray observations have detected regions of low emissivity (“cavities”) in the X-ray emitting<br />
gas at the position of the ra<strong>di</strong>o lobes. It appears that the ra<strong>di</strong>o sources have <strong>di</strong>splaced the<br />
surroun<strong>di</strong>ng thermal me<strong>di</strong>um rather than mixing with it. What might be the consequences<br />
for the magnetic field structure?<br />
5. What is the content of the ra<strong>di</strong>o lobes and hence of cavities? In some cases, the relativistic<br />
plasma in the ra<strong>di</strong>o lobes can provide enough pressure to support them, but others require<br />
an ad<strong>di</strong>tional pressure component – most likely from entrained and heated (kT> 10 keV)<br />
intergalactic me<strong>di</strong>um. This heated component should be detected through polarization<br />
stu<strong>di</strong>es since it may cause internal Faraday rotation.<br />
The approach has been to select a few bright, very extended and highly polarized ra<strong>di</strong>o galaxies.<br />
This is essential to have high signal-to-noise in polarization over large enough areas to allow<br />
computation of spatial statistics such as the structure function (and hence the power spectrum) of<br />
rotation measure, which requires a large number of independent measurements. New and archival<br />
Very Large Array (VLA 1 ) observations of the target sources have been analyzed in combination<br />
with high-quality X-ray data from the Chandra, XMM-Newton and ROSAT satellites. The work<br />
has been carried out by making use of:<br />
1. Analytical pre<strong>di</strong>ctions of the RM structure functions to quantify the RM statistics and to<br />
constrain the power spectra of the RM and magnetic field.<br />
1 The Very Large Array is a facility of the National Science Foundation, operated under cooperative agreement by<br />
Associated Universities, Inc.
2. Two-<strong>di</strong>mensional Monte Carlo simulations to address the effect of an incomplete sampling<br />
of RM <strong>di</strong>stribution and so to determine errors for the power spectra.<br />
3. Methods to combine measurements of RM and depolarization in order to constrain the<br />
magnetic-field power spectrum on small scales.<br />
4. Three-<strong>di</strong>mensional models of the group/cluster environments, inclu<strong>di</strong>ng <strong>di</strong>fferent magnetic<br />
field power spectra and gas density <strong>di</strong>stributions.<br />
The thesis is organized as follows: Chapters 1–3 are introductory, while 4–6 contain the original<br />
work developed in the thesis.<br />
Chapter 1 briefly outlines the essential physics required to understand the polarized emission and<br />
energetic of ra<strong>di</strong>o galaxies.<br />
The gaseous environment of ra<strong>di</strong>o galaxies and implications for their interaction are described in<br />
Chapter 2.<br />
Chapter 3 reviews the known properties of intergalactic magnetic fields and outlines <strong>di</strong>fferent<br />
methods of analysis.<br />
Chapter 4 presents a study of the magnetic field in the hot me<strong>di</strong>um surroun<strong>di</strong>ng the ra<strong>di</strong>o galaxy<br />
3C 449, located in the centre of a nearby galaxy group. High quality RM and depolarization images<br />
have been produced by making use of archival VLA data at seven frequencies in the range 1365<br />
– 8385 MHz. Structure-function and simulation techniques have been used to model the magnetic<br />
field power spectrum over a wide range of spatial scales and to estimate both the minimum and<br />
maximum scale of the magnetic field variations. The central field strength and its dependence on<br />
density have been constrained. The work of this Chapter has been published in Guidetti et al.<br />
(2010), reported in the section Highlighted papers of the journal Astronomy & Astrophysics.<br />
Chapter 5 concerns the analysis of the RM of the nearby ra<strong>di</strong>o galaxies 0206+35, 3C 270, 3C 353,<br />
and M 84. This represents the most innovative part of the thesis. The sources are embedded in<br />
<strong>di</strong>fferent environments, but show the same double-lobed ra<strong>di</strong>o morphology. They all show highly<br />
anisotropic RM structures (RM bands) which are clearly <strong>di</strong>fferent from the isotropic variations<br />
seen in previously-published RM images. This is a new RM phenomenon and a first attempt to<br />
interpret it as a consequence of source-environment interaction is presented. Analytical models for<br />
the magnetic field and simulations of the RM expected from expan<strong>di</strong>ng sources in the magnetized<br />
intergalactic me<strong>di</strong>um are developed. This approach is entirely new and the main results are that a<br />
simple compression mechanism cannot produce all the observed properties of the RM bands, and<br />
a two-<strong>di</strong>mensional draped magnetic field provides a much better description of the data. The work<br />
of this Chapter will be published in Guidetti et al. (2011, in press).
Chapter 6 presents preliminary results from two-<strong>di</strong>mensional analyses of the polarization of two<br />
ra<strong>di</strong>o galaxies embedded in extremely <strong>di</strong>fferent environments: 0755+37 in a very poor group and<br />
M 87 at the centre of the cool core Virgo cluster. The work of this Chapter will be published in<br />
two forecoming papers: Guidetti et al. (in preparation), Guidetti et al. (in preparation).<br />
Chapter 6.4 summarizes all the results presented and briefly lists some topics for further work.<br />
It is pointed out that this thesis has shown that the magnetized me<strong>di</strong>um surroun<strong>di</strong>ng ra<strong>di</strong>o<br />
galaxies appears more complicated than was apparent from earlier work. Three <strong>di</strong>stinct types<br />
of magnetic-field structure are identified: an isotropic component with large-scale fluctuations,<br />
plausibly associated with the intergalactic me<strong>di</strong>um not affected by the presence of a ra<strong>di</strong>o source;<br />
a well-ordered field draped around the front ends of the ra<strong>di</strong>o lobes and a field with small-scale<br />
fluctuations in rims of compressed gas surroun<strong>di</strong>ng the inner lobes, perhaps associated with a<br />
mixing layer.<br />
In the Appen<strong>di</strong>x new VLA polarization data for the nearby ra<strong>di</strong>o galaxies 0206+35, 0755+37 and<br />
M 84 are presented. This work will be published in the paper Laing, Guidetti et al. (2011, in prep).<br />
Throughout the thesis I assume a cosmology with H 0 = 71 km s −1 Mpc −1 ,Ω m = 0.3, andΩ Λ = 0.7.
Chapter 1<br />
Physics of ra<strong>di</strong>o galaxies<br />
In this Chapter I will outline the essential physics required to understand the polarized<br />
emission of ra<strong>di</strong>o galaxies and their interactions with the local environment. Sec. 1.1<br />
introduces ra<strong>di</strong>o sources in the context of active galaxies in general, and Sec. 1.2 <strong>di</strong>scusses<br />
their principal emission mechanisms. The morphologies of ra<strong>di</strong>o galaxies, the physical parameters<br />
of their emitting regions and the implications for their interaction with the environment are<br />
described in Sec. 1.3.<br />
1.1 Active galaxies<br />
Active galactic nuclei (AGN) are the most powerful, persistent sources of luminosity in the<br />
Universe. Their luminosities range from about 10 40 up to 10 47 ergs s −1 and their emission is spread<br />
widely across the whole electromagnetic spectrum. AGN are so called because of the current<br />
accepted model explaining their nature. They are believed to be powered by accretion onto supermassive<br />
black holes (∼ 10 7 − 10 10 M ⊙ ) located at the nuclei of so-called “active galaxies”. Indeed,<br />
the ra<strong>di</strong>ation emitted by such nuclei cannot be explained just by starlight or normal supernova<br />
activity and can exceed the total emission of the rest of the galaxy by many order of magnitude.<br />
Moreover, the AGN emission is often variable on time-scales ranging from years down to hours<br />
or even minutes. Causality arguments imply that an object varying in a time t must be smaller<br />
than the light-crossing time ct (where c is the speed of light in the vacuum) and therefore must be<br />
spatially small. Accretion mechanisms onto a such small object with mass≃ 10 8 M ⊙ can efficiently<br />
convert potential and kinetic energy to ra<strong>di</strong>ation and bulk outflow, and therefore account for high<br />
luminosities and their rapid variations.<br />
Since luminosity excesses have been observed across the entire electromagnetic waveband,<br />
there is no single observational signature of active galaxies, which can be classified in many<br />
1
2 1. Physics of ra<strong>di</strong>o galaxies<br />
ways. This has often lead to a confusing terminology. The <strong>di</strong>stinctions between <strong>di</strong>fferent types of<br />
AGN reflect historical <strong>di</strong>fferences in how objects were <strong>di</strong>scovered or initially classified, rather<br />
than real physical <strong>di</strong>fferences. Although the spectrum of these objects can extend across the<br />
whole electromagnetic spectrum, the relative intensity between <strong>di</strong>fferent wavebands and spectral<br />
lines features are extremely <strong>di</strong>fferent and provide a basic classification for the AGN (e.g. ra<strong>di</strong>o<br />
galaxies, quasars, Seyfert galaxies, blazars). AGN are conventionally classified as either “ra<strong>di</strong>oloud”<br />
or “ra<strong>di</strong>o-quiet”, depen<strong>di</strong>ng on the ratio of their luminosities in the ra<strong>di</strong>o and optical bands.<br />
Physically, this <strong>di</strong>stinction reflects the relative importance of relativistic jets and their associated<br />
non-thermal emission compared with ra<strong>di</strong>ation <strong>di</strong>rectly related to the accretion process. Jets are<br />
an important, and often dominant, energy loss channel for ra<strong>di</strong>o-loud AGN. The cause of the<br />
<strong>di</strong>fference between ra<strong>di</strong>o-loud and ra<strong>di</strong>o-quiet AGN is a complicated and unresolved issue, which<br />
may involve the spin of the central black hole (e.g. Meier 2002) or the details of the accretion<br />
process.<br />
A major simplification for ra<strong>di</strong>o-loud and ra<strong>di</strong>o-quiet objects is the “unified model”, which<br />
suggests that <strong>di</strong>fferent classes of AGN are in fact the same objects seen at <strong>di</strong>fferent angles to the<br />
line of sight. There are two physical mechanisms: beaming of ra<strong>di</strong>ation from relativistic jets<br />
(ra<strong>di</strong>o-loud only) and obscuration of the central regions of the AGN by a dusty torus (e.g. Barthel<br />
1989; Antonucci 1993; Urry & Padovani 1995).<br />
Since this thesis is based on the analysis of the polarization properties of extended ra<strong>di</strong>o<br />
galaxies, in the next sections I will concentrate on the main non-thermal emission mechanisms<br />
observed from ra<strong>di</strong>o-loud active galaxies and their implication about the energy content of ra<strong>di</strong>o<br />
galaxies.<br />
1.2 Non-thermal emission mechanisms of active galaxies<br />
The two main non-thermal ra<strong>di</strong>ation processes in ra<strong>di</strong>o-loud active galaxies are synchrotron<br />
ra<strong>di</strong>ation and Inverse-Compton (IC) scattering. Their relative importance depends on the<br />
observing frequency: IC emission from a given population of relativistic electrons is emitted at<br />
higher frequencies than the correspon<strong>di</strong>ng synchrotron component. For example, in the extended<br />
lobes of ra<strong>di</strong>o galaxies, synchrotron emission dominates at ra<strong>di</strong>o frequencies and IC in the X-ray<br />
band.<br />
1.2.1 Synchrotron ra<strong>di</strong>ation<br />
Synchrotron emission is generated by the acceleration of relativistic charged particles in a<br />
magnetic field B. When detected, it provides therefore the more <strong>di</strong>rect way to detect magnetic<br />
2
1.2. Non-thermal emission mechanisms of active galaxies 3<br />
fields in astrophysical sources.<br />
Lorentz factorγ(electron energyǫ=γm e c 2 ) is:<br />
dǫ<br />
dt<br />
The synchrotron power emitted by a relativistic electron with<br />
[ erg<br />
]<br />
≃ 1.6×10 −3 (B [µG] sinθ) 2 γ 2 (1.1)<br />
s<br />
where θ is the pitch angle between the electron velocity and the magnetic field <strong>di</strong>rection.<br />
This equation illustrates the degeneracy between particle energy and magnetic field: a given<br />
synchrotron power can be produced by a highly energetic particle in a low magnetic field or vice<br />
versa.<br />
The spectral <strong>di</strong>stribution for a single electron can be assumed to be approximately<br />
monochromatic since it peaks sharply at a frequency:<br />
ν c [GHz]≃4.2×10 −9 γ 2 (B [µG] sinθ). (1.2)<br />
From Eq. 1.2, it is derived that electrons ofγ≃10 4 in magnetic fields of B≃10µG produce<br />
synchrotron ra<strong>di</strong>ation in the ra<strong>di</strong>o band (ν c ∼ 4 GHz), whereas electrons ofγ ≃ 10 7−8 in the<br />
same magnetic field ra<strong>di</strong>ate in the X-rays. A representative example is given by the nearby active<br />
galaxy Pictor A, where the spectrum of the jet from ra<strong>di</strong>o to X-ray wavelengths can be described<br />
as synchrotron emission from a population highly energetic particles with a <strong>di</strong>stribution of Lorentz<br />
factors (Wilson, Young & Shopbell 2001).<br />
For a homogeneous population of electrons with an isotropic pitch-angle <strong>di</strong>stribution and a<br />
power-law energy spectrum with the particle density between energiesǫ andǫ+dǫ given by<br />
N(ǫ)dǫ= N 0 ǫ −δ dǫ, (1.3)<br />
the total intensity spectrum, in optically-thin regions has the functional form:<br />
S (ν)∝ν −α , (1.4)<br />
where the spectral indexα=(δ−1)/2. This spectrum of Eq. 1.4 is described as non-thermal,<br />
since the energy spectrum of the emitting particles is not Maxwellian - i.e. it does not have a<br />
single temperature.<br />
1.2.2 Polarization of synchrotron ra<strong>di</strong>ation<br />
In the optically-thin case, for a homogeneous and isotropic <strong>di</strong>stribution of relativistic particles<br />
whose energy <strong>di</strong>stribution follows the power law of Eq. 1.3 and in a uniform magnetic field, the<br />
3
4 1. Physics of ra<strong>di</strong>o galaxies<br />
intrinsic degree of polarization has the value (Longair 1994):<br />
P Int = δ+1<br />
δ+ 7 , (1.5)<br />
3<br />
and the electric vector is perpen<strong>di</strong>cular to the projection of the magnetic field onto the plane<br />
of the sky.<br />
For typical values of the index of the energy spectrumδ = 2.5, the intrinsic<br />
polarization degree in an uniform field is expected to be≈70%, which represents the maximum<br />
allowed value.<br />
they exceed 0.3-0.4.<br />
Degrees of polarization≥ 0.1 are often observed at 1.4 GHz; less commonly<br />
A reduction of the expected degree of polarization might stem from an<br />
intrinsically complex magnetic field structure within the source and/or depolarization effects, as<br />
<strong>di</strong>scussed in Secs. 3.2.1 and 3.3. If the magnetic field can be expressed as the superposition of<br />
two components, one uniform B u , the other isotropic and random B r , the observed degree of<br />
polarization is approximately given by (Burn 1966):<br />
B 2 u<br />
P Obs = P Int<br />
B 2 u+B 2 . (1.6)<br />
r<br />
which gives the ratio of the energy in the uniform field over the energy in the total field, and is an<br />
in<strong>di</strong>cator of the field uniformity and structure. However, random magnetic fields are likely to be<br />
anisotropic, in which case Eq. 1.6 does not hold.<br />
A mathematically convenient way to describe the linear polarization state is given by the<br />
Stokes parameters I, Q and U (Stokes, 1852).<br />
The polarized intensity and the polarization angle of linearly polarized ra<strong>di</strong>ation can be<br />
described by:<br />
P λ = (Q 2 λ + U2 λ )1/2 (1.7)<br />
and<br />
Ψ λ = 1 2 arctan (<br />
Uλ<br />
Q λ<br />
)<br />
, (1.8)<br />
Images of polarized intensity P, degree of polarization P/I and position angleΨ(and in turn<br />
magnetic field) can be derived across ra<strong>di</strong>o galaxies from the I, Q, and U images through ra<strong>di</strong>o<br />
observations in full polarization mode.<br />
Once corrected for the Faraday rotation (Sec. 3.2) the projected magnetic field in the plane<br />
of the sky appears to be tangential to the edges of the lobes in both low- and high-power ra<strong>di</strong>o<br />
sources. The field orientation in the jets <strong>di</strong>ffers between the two classes. Low-power jets usually<br />
show magnetic field parallel to the jet axis close to the core with a transition to perpen<strong>di</strong>cular field<br />
as the jet expands. In contrast, in powerful sources the magnetic field is usually parallel to the jet<br />
axis for the whole length of the jets.<br />
4
1.2. Non-thermal emission mechanisms of active galaxies 5<br />
Therefore, the measurement of synchrotron emission from ra<strong>di</strong>o galaxies provides<br />
information about the index of the energy <strong>di</strong>stribution of particles and the strength of magnetic<br />
fields inside the source, while the degree of polarization is an important in<strong>di</strong>cator of the field<br />
uniformity and structure. The high degrees of linear polarization observed from ra<strong>di</strong>o-galaxy jets<br />
and lobes make them ideal probes of the foreground magnetised me<strong>di</strong>um (Sec. 3.2).<br />
1.2.3 Inverse Compton emission<br />
Relativistic electrons in a ra<strong>di</strong>ation field can scatter low-energy photons to high energy through<br />
the inverse-Compton (IC) effect. The reason for the adjective “inverse” is that the electrons lose<br />
energy rather than the photons as in the usual Compton scattering. IC scattering increases the<br />
frequency of the scattered photonsν ph by a factor 4 3 γ2 , whereγis the Lorentz factor of the<br />
relativistic electrons (e.g. Rybicki & Lightman 1986). The low-energy scattered photons are<br />
often dominated by the ubiquitous 3K cosmic microwave background (CMB). In the presence<br />
of relativistic particles withγ∼10 3−4 , CMB photons are scattered from the original frequency<br />
around 10 11 Hz to about 10 17−18 Hz, correspon<strong>di</strong>ng to the X-ray andγ-ray domains (0.8- 20 keV).<br />
Since the power ra<strong>di</strong>ated via the IC process by an electron has the same functional dependence<br />
on the electron energy as in Eq. 1.1, if the synchrotron and IC emission originate from the same<br />
relativistic electron population their fluxes are related. For the electron energy <strong>di</strong>stribution of Eq.<br />
1.3, the two spectra share the same spectral indexα. The spectral index relates to the photon index<br />
of the IC emission asΓ X =α+1.<br />
Given that the synchrotron emissivity is proportional to the magnetic energy density U B , while<br />
the IC emissivity is proportional to the energy density in the photon field U ph , it follows that:<br />
S syn<br />
S IC<br />
∝ U B<br />
U ph<br />
, (1.9)<br />
where S syn and S IC are the synchrotron and IC fluxes, respectively.<br />
From the ratio between the IC and synchrotron fluxes, in principle one can derive an<br />
estimate of the total magnetic field, averaged over the emitting volume. In terms of observational<br />
parameters this is:<br />
B[µG] 1+α S syn (ν r )[Jy]<br />
= h(α)<br />
S IC(E1 −E 2 )[ergs −1 cm −2 ] (1+z)3+α (0.0545ν r [MHz]) α × (1.10)<br />
× (E 2 [keV] 1−α − E 1 [keV] 1−α ,<br />
where S syn(νr ) is the synchrotron flux at the ra<strong>di</strong>o frequencyν r and the flux S IC(E1 −E 2 ) is<br />
integrated over the energy interval E 1 − E 2 .<br />
5
6 1. Physics of ra<strong>di</strong>o galaxies<br />
1.3 Ra<strong>di</strong>o galaxies<br />
Ra<strong>di</strong>o galaxies are ra<strong>di</strong>o-loud AGN hosted by massive early type galaxies (visual magnitude<br />
M v < -20), with ra<strong>di</strong>o powers at 408 MHz spanning the range 10 23−28 WHz −1 . Their ra<strong>di</strong>o spectra<br />
have approximately power-law forms with typical spectral in<strong>di</strong>cesα=0.8±0.2, consistent with<br />
synchrotron emission from relativistic particles with power-law energy spectra (Sec. 1.2.1). The<br />
electron Lorentz factors areγ≥100 and magnetic field strengths are∼µG. The synchrotron origin<br />
of the ra<strong>di</strong>o emission is confirmed by the smooth broad-band nature of the emission (10 MHz-<br />
10 GHz) and the high degree of linear polarization (commonly≥0.1 averaged across the source,<br />
but reaching values of 0.7 in sub-regions).<br />
The energy source for the relativistic particles and magnetic fields is thought to be the central<br />
black hole at the nucleus of the ra<strong>di</strong>o galaxy. The energy is transferred from this engine outwards<br />
by more or less collimated, initially relativistic, flows or beams, whose visible manifestations are<br />
the ra<strong>di</strong>o jets.<br />
1.3.1 Ra<strong>di</strong>o-galaxy morphologies<br />
Ra<strong>di</strong>o galaxies show a wide range of structures and linear sizes, going from a few ten of pc<br />
up to Mpc (Bridle & Perley 1984; Laing 1993), and hence they can be more extended than the<br />
parent galaxy. The main morphological classification of extended ra<strong>di</strong>o galaxies is that made by<br />
(Fanaroff & Riley 1974). This was based on the sharp change in morphology of the sources in<br />
the 3C catalogue around the ra<strong>di</strong>o power 10 24.5 WHz −1 at 1.4 GHz, close to the break in the ra<strong>di</strong>o<br />
luminosity function. Fanaroff & Riley pointed out that low-power sources tend to be brightest close<br />
to their nuclei (“edge-darkened”) whereas high-power ones are brightest at their outer extremities<br />
(“edge-brightened”). These are respectively classified as Fanaroff-Riley I and Fanaroff-Riley II<br />
sources, (or FR I and FR II sources). The prototypes of FR I and FR II sources are respectively<br />
3C 31 and Cygnus A (Fig. 1.1). The sources <strong>di</strong>scussed in detail in this thesis are mostly members<br />
of the FR I class.<br />
The main morphological components of FR I and FR II ra<strong>di</strong>o galaxies observed with<br />
arcsecond resolution (e.g Bridle & Perley 1984) are as follows.<br />
• The “core” is an unresolved component coincident to within the observational errors with<br />
the optical nucleus. It represents the partially optically thick base of the jets (see below).<br />
Cores are relatively stronger in FR I sources.<br />
• The “jets” are long narrow features, which emerge from the core and propagate generally in<br />
opposite <strong>di</strong>rections. FR I jets are typically bright, with wide opening angles, while those of<br />
6
1.3. Ra<strong>di</strong>o galaxies 7<br />
FR II sources appear weak and well collimated, suggesting a more efficient energy transport<br />
than in FR Is. FR I jets are thought to decelerate to sub-relativistic speeds on kpc scales,<br />
while FR II jets remain relativistic over their whole lengths.<br />
• The “hot-spots” are bright and compact regions observed only in FR II sources, close<br />
to the extremities of the ra<strong>di</strong>o structures. They are interpreted as the termination or<br />
major <strong>di</strong>sruption of the jets at strong shocks (which requires that FR II jets are internally<br />
supersonic).<br />
• The “lobes” are wide structures with small axial ratios which lie on either side of the<br />
parent galaxy and are often aligned across the nucleus on scales up to Mpc. Most of the<br />
ra<strong>di</strong>o emission is therefore seen between the end of the jets and the core. Synchrotron<br />
spectra of lobes show steepening towards the nucleus and it is therefore likely that lobes are<br />
formed from relativistic particles left behind at or back-flowing from the region where the<br />
jet impacts the external me<strong>di</strong>um. Lobes are found in both FR I and FR II sources.<br />
• The “tails” are elongated and sometimes irregular structures, mostly farther from the nucleus<br />
than the end of a jet. Their synchrotron spectra steepen away from the nucleus, suggesting<br />
that they are flowing outwards. They are found almost exclusively in FR I sources.<br />
1.3.2 Morphology and expansion of lobes and tails<br />
The physics of the interaction between a ra<strong>di</strong>o source and the surroun<strong>di</strong>ng IGM appears to be<br />
significantly <strong>di</strong>fferent for lobes and tails. Also, as will become apparent in later Chapters, the<br />
magnetization of the IGM around a ra<strong>di</strong>o source appears to depend on the morphology of the<br />
extended emission. For these reasons, I briefly <strong>di</strong>scuss the <strong>di</strong>fferences between lobes and tails.<br />
The richness of the environment may play a role in the formation of tails rather than lobes.<br />
Most of the tailed sources are observed in galaxy clusters or rich groups and often show <strong>di</strong>storted<br />
morphologies which are likely to be caused by gas sloshing in the potential well of the cluster or<br />
by the high ram pressure exerted by the thermal gas on fast-moving galaxies (respectively Wideangle<br />
tails, e.g. 3C 465, Eilek et al. 1984 and Narrow-angle tails, e.g. NGC 1265, O’Dea & Owen<br />
1986). There is therefore clear evidence for jet/environment interaction in tailed sources. Indeed,<br />
tails are likely to be formed if the jet entrains enough material to slow it to below the external<br />
sound speed and/or if buoyancy causes the synchrotron plasma to be pushed outwards. For both<br />
these reasons, FR I tails are thought to be expan<strong>di</strong>ng sub-sonically, basically buoyantly, and in<br />
pressure equilibrium with their surroun<strong>di</strong>ngs.<br />
Lobes or bridges, on the other hand, do sometimes show evidence for shocks in the<br />
surroun<strong>di</strong>ng X-ray emitting gas, suggesting that they are expan<strong>di</strong>ng supersonically (Sec. 2.3.2).<br />
7
8 1. Physics of ra<strong>di</strong>o galaxies<br />
So far, the best examples of strong shocks surroun<strong>di</strong>ng bridges are found only in two FR I sources<br />
(Centaurus A, Kraft et al. 2003; NGC 3801, Croston et al. 2007). Instead, weak shocks appear to<br />
occur more frequently and they are seen in both FR I (e.g. Perseus, Fabian et al. 2003; Hydra A,<br />
Nulsen et al. 2005a; M87, Forman et al. 2005) and FR II sources (e.g. Cygnus A, Wilson, Smith &<br />
Young 2006; Hercules A, Nulsen et al. 2005b; 3C 444, Croston et al. 2010). Therefore, standard<br />
models of supersonic ra<strong>di</strong>o-lobe expansion, which were originally thought to apply only to FR II<br />
sources (e.g. Scheuer 1974; Kaiser & Alexander 1997), are also likely to describe lobes in FR I’s.<br />
It may be that the expansion of FR I lobes is supersonic only in the forward <strong>di</strong>rection (driven<br />
by the ram pressure of the jets) and that the lobes are in static pressure equilibrium with their<br />
surroun<strong>di</strong>ngs closer to the galaxy.<br />
To conclude, the factors which determine the large-scale morphology of ra<strong>di</strong>o galaxies have<br />
not been <strong>di</strong>sentangled yet, although the initial speeds of the jets and their density contrast with the<br />
external me<strong>di</strong>um both seem to be important. Whether a lobe or a tail is formed clearly makes a<br />
substantial <strong>di</strong>fference to the interaction between a source and its surroun<strong>di</strong>ngs.<br />
1.3.3 Internal physical con<strong>di</strong>tions of ra<strong>di</strong>o galaxies<br />
In order to understand the interaction of ra<strong>di</strong>o galaxies with their environments, we need to<br />
quantify the internal con<strong>di</strong>tions in the extended emitting regions (lobes and tails). From the<br />
synchrotron emissivity alone, it is not possible to derive unambiguously the energy of the<br />
relativistic particles and magnetic field, because of the degeneracy between them (Eq. 1.1).<br />
Constraints on the energy density in relativistic electrons and magnetic field can be derived from<br />
synchrotron emission if IC emission from the same electron population is observed, in which<br />
case the degeneracy between particles and fields can be resolved (Eq. 1.10). The sum of particle<br />
and field energy densities can then be compared with the thermal pressure in the surroun<strong>di</strong>ngs.<br />
If IC emission is lacking, in order to separate the magnetic and relativistic particles densities,<br />
one must make some assumptions about the relation between electrons and magnetic field. One<br />
commonly used approach is to assume energy equipartition between them: this is described in the<br />
next section.<br />
1.3.4 Equipartition parameters<br />
In the context of ra<strong>di</strong>o sources, the term “energy equipartition” is commonly used to mean that the<br />
energy densities in relativistic particles and magnetic field are equal. This is an assumption, with<br />
no rigorous justification, but has some empirical support from observations of FR II lobes. It is<br />
also close to the con<strong>di</strong>tion that the total energy density in particles and field is a minimum.<br />
8
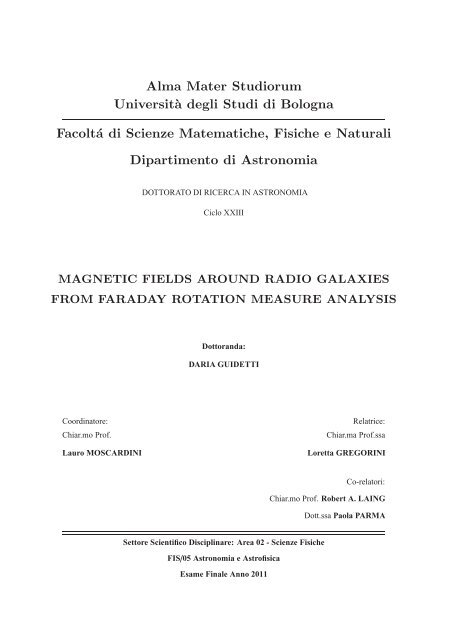
1.3. Ra<strong>di</strong>o galaxies 9<br />
(a)<br />
(b)<br />
Figure 1.1: Examples of extended ra<strong>di</strong>o galaxies with lobes or plumes. Top panel: bridged ra<strong>di</strong>o<br />
galaxy Cygnus A (FR II) in a cluster of galaxy at z=0.056. This is the brightest extragalactic<br />
ra<strong>di</strong>o source in the sky. Bottom panels: montage by A.H. Bridle showing the tailed ra<strong>di</strong>o source<br />
3C 31 (FR I, in red) at the center of a galaxy group at z=0.0169, superimposed on Hubble Space<br />
Telescope WFPC2 image (a) and on DSS image (b).<br />
The field strength and pressure correspon<strong>di</strong>ng to the equipartition con<strong>di</strong>tion (e.g. Longair<br />
1994) are:<br />
B eq [µ G] ≃ 0.9·L 2/7<br />
[ergs −1 ] V−2/7 [kpc 3 ] ζ2/7 Φ −2/7 (1.11)<br />
P eq [dyne/cm 2 ]∝L 4/7<br />
[ergs −1 ] V−4/7 [kpc 3 ] ζ4/7 Φ −4/7 , (1.12)<br />
where L and V are the ra<strong>di</strong>o luminosity and the volume of the source,ζ is the ratio of the total<br />
energy in particles to the energy in electrons alone, andΦis the so called “filling factor”, which<br />
is the fraction of the total source volume occupied by emitting material. For a relativistic plasma<br />
Γ=4/3, so the total minimum energy density of the source is u min ≈ 3× P eq . Since P eq represents<br />
the pressure exerted by the synchrotron-emitting plasma, throughout the thesis it will be reported<br />
as P syn .<br />
The comparison of the pressure P eq with the external one provided by the surroun<strong>di</strong>ng<br />
9
10 1. Physics of ra<strong>di</strong>o galaxies<br />
me<strong>di</strong>um (Chapter 2) is useful to understand the equilibrium con<strong>di</strong>tions of ra<strong>di</strong>o galaxies. In both<br />
FR I and FR II ra<strong>di</strong>o sources, B eq and P syn are found to be a fewµG and 10 −12 −10 −13 dyne/cm 2 ,<br />
respectively.<br />
However, all the equipartition estimates must be taken with caution, because each of the<br />
variables in Eqs. 1.11 and 1.12 is potentially a source of uncertainty. Indeed, the filling factor<br />
Φ is unknown and often assumed to be 1 although in some ra<strong>di</strong>o galaxies there is evidence for<br />
filamentary structure. Some assumptions on the geometry of the source must also be made in<br />
order to compute the source volume V. The ratioζ is also subject to major uncertainties, since<br />
the energy density in relativistic protons is unconstrained. Moreover, the equipartition parameters<br />
are strongly related to the functional form of the particle energy spectrum and therefore to the<br />
synchrotron emission spectrum. Good constraints on the energy spectrum require wide frequency<br />
coverage. Indeed, even small changes in the lower limit of the relativistic particle energy can<br />
have a huge impact on the determination of B eq and P min . This is particularly true for steep ra<strong>di</strong>o<br />
spectra, where low energy particles contribute most of the total energy.<br />
My personal conclusion is that minimum energy arguments are of limited usefulness. The best<br />
use of these estimates lies in making the most conservative assumptions and treating the resulting<br />
pressures as lower limits.<br />
1.3.5 Field and particle content of ra<strong>di</strong>o lobes and tails<br />
FR I ra<strong>di</strong>o galaxies with tails are believed to expand sub-sonically in pressure equilibrium with<br />
the surroun<strong>di</strong>ngs, and to rise buoyantly in the intergalactic me<strong>di</strong>um. On the other hand, some<br />
FR I sources with bridges appear to be surrounded by shocked X-ray emitting gas, which suggests<br />
supersonic expansion.<br />
As already pointed out, when IC emission is detected from the ra<strong>di</strong>o sources, then the total<br />
energy density in relativistic electrons and fields can be estimated and compared with the external<br />
pressure, also derived from X-ray observations. For some FR II sources, this has been done<br />
(e.g. Kataoka & Stawarz 2005; Croston et al. 2004; Laskar et al. 2009; Isobe et al. 2011) The<br />
conclusion is that most FR II lobes are close to the minimum energy con<strong>di</strong>tion, in the sense that<br />
relativistic electron and field energy densities are comparable, and that their sum is in turn close<br />
to the external pressure, as expected for static thermal confinement (e.g. Hardcastle et al. 2002;<br />
Croston et al. 2004; Konar 2009). So far, there are no unambiguously detections of IC emission<br />
from FR I lobes. Instead, several stu<strong>di</strong>es have shown that the synchrotron equipartition pressure<br />
P syn within the FR I ra<strong>di</strong>o lobes is often an order of magnitude smaller than the external pressure<br />
exerted by the hot surroun<strong>di</strong>ng gas (e.g. Morganti et al. 1988; Worrall & Birkinshaw 2000; Blanton<br />
et al. 2001; de Young 2006; Croston et al. 2003, 2008). Without a further source of internal<br />
10
1.3. Ra<strong>di</strong>o galaxies 11<br />
pressure, the ra<strong>di</strong>o sources would then collapse.<br />
To solve the pressure balance problem for FR I sources we need to consider:<br />
1. deviations from equipartition or<br />
2. an ad<strong>di</strong>tional source of pressure which is not detectable by current ra<strong>di</strong>o or X-ray<br />
observations.<br />
Deviations from equipartition in the sense of electron dominance could be given by a large excess<br />
of low-energy electrons. These would be detectable via their IC ra<strong>di</strong>ation in at least some cases<br />
(e.g. Croston, Hardcastle & Birkinshaw 2005). Therefore deviations from equipartition would<br />
have to be in the <strong>di</strong>rection of magnetic dominance.<br />
An ad<strong>di</strong>tional source of pressure could be provided by relativistic protons. These would have<br />
to be accelerated in the lobes, since a relativistic proton population in the jets would exert too<br />
high a pressure to allow collimation. Even cold protons cannot be transported by the jets in large<br />
enough numbers without violating constraints on the mass flux (Laing & Bridle 2002a). The best<br />
can<strong>di</strong>date to solve the pressure balance is therefore heated and entrained thermal material. This<br />
would have to be hot (kT≥10 keV, e.g. Nulsen et al. 2002) but tenuous, to provide enough pressure<br />
without ra<strong>di</strong>ating sufficiently to erase the soft X-ray depressions (“cavities”), often observed at the<br />
position of ra<strong>di</strong>o lobes (Sec. 2.3.1).<br />
11
12 1. Physics of ra<strong>di</strong>o galaxies<br />
12
Chapter 2<br />
The X-ray environment of ra<strong>di</strong>o<br />
galaxies<br />
2.1 Introduction<br />
E<br />
arly Einstein X-ray observations <strong>di</strong>scovered that early-type galaxies, groups and<br />
clusters of galaxies are spatially-extended X-ray sources with luminosities in the range<br />
10 39−43 erg s −1 (e.g. Forman et al. 1979; Kriss et al. 1980; Biermann, Kronberg &<br />
Madore 1982). Subsequent more sensitive and detailed X-ray images provided by the ROSAT,<br />
Asca, XMM-Netwton and Chandra satellites have led to the detection of components on several<br />
scales from several <strong>di</strong>stinct emission mechanisms. These are:<br />
• the end products of stellar evolution (point-like sources);<br />
• emission spatially coincident with the bases of ra<strong>di</strong>o jets;<br />
• the hot phase of the interstellar me<strong>di</strong>um (ISM) of the galaxies and<br />
• the hot and <strong>di</strong>ffuse intergalactic me<strong>di</strong>um (IGM) in groups and clusters of galaxies.<br />
It is now well-established that the <strong>di</strong>ffuse X-ray emission arises from hot and <strong>di</strong>lute plasma<br />
emitting via thermal bremsstrahlung (Sec. 2.2.2).<br />
Ra<strong>di</strong>o emission from active galaxies therefore coexists with a complex, hot me<strong>di</strong>um, with<br />
which it interacts in several ways.<br />
• Ra<strong>di</strong>o jets can entrain the external me<strong>di</strong>um, which is thought to be able to decelerate the<br />
initially relativistic flows in FR I sources on typical scales of a few kpc (e.g. Laing & Bridle<br />
2002a).<br />
13
14 2. The X-ray environment of ra<strong>di</strong>o galaxies<br />
• Both the lateral expansion of a ra<strong>di</strong>o source and the propagation of ra<strong>di</strong>o jets can do work<br />
against the external hot gas, <strong>di</strong>splacing and compressing it. Energy can also be transferred,<br />
for example by shock heating or <strong>di</strong>ssipation of sound waves.<br />
• This transferred energy can prevent the cooling of hot gas and therefore suppress cooling<br />
flows and star formation in massive galaxies (e.g. Sarazin 1988; Binney & Tabor 1995;<br />
Mathews & Brighenti 2003).<br />
• Conversely, hot gaseous atmospheres confine the ra<strong>di</strong>o emission, influencing its<br />
morphology.<br />
Therefore, X-ray observations of the hot gas are crucial to an understan<strong>di</strong>ng of the dynamics<br />
and energetics of ra<strong>di</strong>o galaxies as well their impact on their environment. X-ray imaging can<br />
show signatures of interactions between the ra<strong>di</strong>o galaxies and hot gas, while X-ray spectroscopy<br />
can shed light on the mechanisms by which energy is transferred from the ra<strong>di</strong>o galaxy to the<br />
surroun<strong>di</strong>ng plasma.<br />
2.2 The thermal component<br />
2.2.1 The continuum spectrum<br />
Any hot, fully-ionized plasma with a temperature above 10 4 K emits via thermal bremsstrahlung,<br />
which results from the acceleration of free electrons deflected in the Coulomb field of a ion.<br />
The thermal bremsstrahlung emissivity at frequencyνfor an optically-thin plasma in collisional<br />
equilibrium 1 can be expressed as :<br />
J X (ν)∝n e n ions g(ν, T)T 1/2 exp −hν/K BT ergs −1 cm −3 Hz −1 sr −1 (2.1)<br />
where n e and n ions are the electron and ion number densities and T is the gas temperature. 2<br />
g(ν, T) ∝ ln(k B T/hν ≈ 1) is the Gaunt factor, which corrects for quantum mechanical effects<br />
and for the effects of <strong>di</strong>stant collisions. The square-law density behavior in Eq. 2.1 reflects the<br />
collisional nature of the process. The emission of X-rays from ISM and IGM is well-described by<br />
Eq. 2.1.<br />
X-ray data can therefore be used to derive the physical properties of the X-ray emitting gas<br />
such as central density, temperature profile and total mass. Fits to the X-ray spectra give average<br />
1 Collisional equilibrium takes place when processes of electron ionization are exactly balanced by recombination<br />
processes.<br />
2 The electrons and ions are thought to have a Maxwellian <strong>di</strong>stribution with a common temperature T .<br />
14
2.2. The thermal component 15<br />
Figure 2.1: Panel (a): Chandra observation of the massive (regular) cluster of galaxies A 1689<br />
(blue) superimposed on the optical image (yellow, Hubble Space Telescope). Panel (b): fitting of<br />
the surface brightness profile with a doubleβ model described in the inset. Taken from Xue & Wu<br />
(2002).<br />
gas temperatures increasing with the size and the mass of the environment. Typical temperatures<br />
for clusters, groups and in<strong>di</strong>vidual galaxies are given in Table 2.1.<br />
2.2.2 Morphology of the X-ray emitting gas<br />
Imaging of the X-ray emission from massive ellipticals, groups and clusters of galaxies has shown<br />
that the morphologies of the emitting gas are quite heterogeneous, but that they can be related to<br />
the dynamical state of the systems. Much of work has been carried out for galaxy clusters, but the<br />
conclusions can be extended to sparser environments such as groups of galaxies and field galaxies,<br />
which can be regarded as scaled-down version of rich clusters.<br />
Forman & Jones (1982) first proposed a classification into “regular” and “irregular” X-ray cluster<br />
morphologies, with a connection to the evolutionary state.<br />
Essentially, regular clusters are those which show approximately round, centrally condensed<br />
X-ray brightness <strong>di</strong>stributions, decreasing smoothly outwards. Their temperatures and X-ray<br />
luminosities are usually high and they often host a central dominant galaxy. Galaxy clusters<br />
belonging to this class are thought to be evolved systems which have undergone dynamical<br />
relaxation.<br />
When the X-ray emission can be approximated as regular, its surface brightness profile is well<br />
parametrized by the function:<br />
] −3β+1/2<br />
S (r)=S (0)<br />
[1+ r2<br />
(2.2)<br />
15<br />
r 2 c
16 2. The X-ray environment of ra<strong>di</strong>o galaxies<br />
where r is the projected ra<strong>di</strong>al <strong>di</strong>stance from the centroid of the X-ray surface brightness<br />
<strong>di</strong>stribution, S (0) is the central surface brightness, r c is the X-ray core ra<strong>di</strong>us andβ= µm pσ 2 r<br />
k B T<br />
. Here,<br />
µ is the mean molecular weight, m p is the proton mass, andσ r is the ra<strong>di</strong>al velocity <strong>di</strong>spersion of<br />
the galaxies.<br />
The model of Eq. 2.2 has the advantage that its shape is uniquely described by only two<br />
parameters: the core ra<strong>di</strong>us and the slopeβ. The latter determines the sharpness of the turnover<br />
beyond the core ra<strong>di</strong>us and the asymptotic slope of the scaling. Physically,β represents the ratio<br />
between the specific kinetic energy of the gravitationally bound galaxies and the specific thermal<br />
energy of the hot gas. Fits to the X-ray surface brightness profiles generally giveβ∼0.4-0.7,<br />
in<strong>di</strong>cating that the energy per unit mass is higher in the hot gas than in the galaxies. The core<br />
ra<strong>di</strong>us r c is highly correlated with the parameterβ, in the sense that larger r c corresponds to higher<br />
β: indeed, a given X-ray surface brightness can be reproduced by a concentrated <strong>di</strong>stribution with<br />
a rapid decline (small r c and highβ), or by a more <strong>di</strong>ffuse one with a flatter decline (large r c and<br />
lowβ). Typical ranges for the fitted X-ray parameters are summarized in Table 2.1.<br />
Assuming that the gas-density <strong>di</strong>stribution is isothermal and hydrostatic, the surface<br />
brightness profile of Eq. 2.2 corresponds to the density profile called aβmodel and given by<br />
(Cavaliere & Fusco-Femiano 1976):<br />
where n e (0) is the central electron density.<br />
] − 3<br />
n e (r)=n e (0)<br />
[1+ r2 2 β<br />
. (2.3)<br />
Theβmodel adequately describes the surface brightness profiles of regular X-ray emission<br />
over a wide range of ra<strong>di</strong>i. However, it fails in reproducing the strongly peaked X-ray surface<br />
brightness <strong>di</strong>stributions observed in some systems. This peak might be interpreted as emission due<br />
to the ISM of the central elliptical galaxy, superimposed on that from the intergalactic me<strong>di</strong>um, or<br />
as an in<strong>di</strong>cation of the presence of a cooling flow (e.g. Trinchieri, Fabbiano & Kim 1997; Helsdon<br />
& Ponman 2000; Croston et al. 2008). In both cases, the fit to the X-ray surface brightness is<br />
significantly improved by using two <strong>di</strong>stinctβmodels, one for each component (e.g. Croston et al.<br />
2008). Analogously, fits to the temperature profile often require two-temperature models. Fig. 2.1<br />
shows an example of X-ray emission from a relaxed galaxy cluster and the best fitting doubleβ<br />
model describing the surface brightness profile.<br />
Models of this type are used later in the thesis (Chapters 4 and 5) to parametrize the density<br />
<strong>di</strong>stributions of hot gas around ra<strong>di</strong>o galaxies.<br />
r 2 c<br />
16
2.3. Ra<strong>di</strong>o source – environment interactions 17<br />
Table 2.1: Typical parameters describing the X-ray 1 emitting atmospheres in clusters, groups and<br />
massive ellipticals.<br />
environment L X n e (0) r c β kT<br />
[erg s −1 ] [cm −3 ] [kpc] [keV]<br />
cluster 10 43−45 10 −3 100-300 0.4-0.8 2-6<br />
group 10 41−44 10 −3 − 10 −4 20-200 0.3-0.9 0.3-2<br />
elliptical 10 39−41 0.1 5-20 ” 0.5-1.5<br />
1 in the soft X-ray energy band≃0.2-10 keV.<br />
Figure 2.2: Composite image of the galaxy cluster MS0735.6 7421 Hubble Space Telescope<br />
(optical) superimposed on Chandra X-ray (blue) and Very Large Array at 330 MHz (red). The<br />
X-ray data show the emission of hot gas at∼ 5× 10 7 K and two cavities, each roughly 200 kpc in<br />
<strong>di</strong>ameter coincident with ra<strong>di</strong>o lobes. Taken from McNamara et al. (2005).<br />
2.3 Ra<strong>di</strong>o source – environment interactions<br />
2.3.1 X-ray cavities and their content<br />
An increasing number of clusters, groups and giant ellipticals show regions of X-ray surface<br />
brightness depressions which appear as holes embedded in a brighter emission (see McNamara<br />
& Nulsen 2007 for a review).<br />
The surface brightness of such holes is around 20-40% below that of the surroun<strong>di</strong>ngs. They<br />
are commonly observed coincident with ra<strong>di</strong>o lobes and generally referred to as “cavities”. An<br />
example is given in Fig. 2.2: the Chandra image <strong>di</strong>splays the soft X-ray emission of the cluster<br />
17
18 2. The X-ray environment of ra<strong>di</strong>o galaxies<br />
MS0735.6 7421 with two large cavities, each roughly 20 kpc in <strong>di</strong>ameter (McNamara et al. 2005).<br />
Other spectacular examples of cavities associated with cluster sources are Hydra A (McNamara<br />
et al. 2000), Centaurus A (Fabian et al. 2000) and Cygnus A (Carilli et al. 1994). Cavities are<br />
observed also in group environments of FR I sources (e.g. Croston et al. 2008; Giacintucci et al.<br />
2011; Gitti et al. 2010). The cavities observed so far have an average ra<strong>di</strong>us of 10 kpc (e.g. Bîrzan<br />
et al. 2004), but there are examples with ra<strong>di</strong>i up to 100 kpc (Hydra A, Nulsen et al. 2005a).<br />
The absence of soft X-ray emission from cavities shows that they cannot contain much thermal<br />
plasma, unless it is much hotter than the surroun<strong>di</strong>ngs (kT ≥ 10 keV). One possibility is that<br />
cavities are filled entirely with synchrotron-emitting plasma associated with ra<strong>di</strong>o lobes (Nulsen<br />
et al. 2002; Bîrzan et al. 2008 and reference therein), but the inference of an apparent pressure<br />
deficit in the lobes of FR I ra<strong>di</strong>o galaxies (Sec. 1.3.5) suggests that there may also be a significant<br />
amount of heated and entrained thermal plasma.<br />
The energy required to inflate a cavity E cav a<strong>di</strong>abatically can be estimated roughly using only<br />
X-ray observations. For cavities containing only relativistic mono-atomic gas, E cav = 4PV, where<br />
P is the pressure internal to the lobe and V is the volume of gas <strong>di</strong>splaced by the ra<strong>di</strong>o lobe. A<br />
power-law relation is found between E cav and the ra<strong>di</strong>o-source luminosity. However, this relation<br />
shows a large scatter (Bîrzan et al. 2004, 2008; Cavagnolo et al. 2010). E cav is a lower limit to<br />
the energy supplied by the ra<strong>di</strong>o source, some of which may be <strong>di</strong>ssipated (e.g. in shocks) or used<br />
to inflate further undetected cavities (e.g. McNamara & Nulsen 2007). E cav estimates based only<br />
on enthalpy range from 10 55 up to 10 61 erg s −1 , reaching the highest values in rich clusters. The<br />
energy deposition rates are high enough to prevent gas cooling below 2 keV in several systems<br />
(e.g. Bîrzan et al. 2008).<br />
2.3.2 Gas compression and heating by ra<strong>di</strong>o galaxies<br />
If ra<strong>di</strong>o lobes are expan<strong>di</strong>ng supersonically 3 , at least in the forward <strong>di</strong>rection of the jets, then a<br />
bow shock is expected to form ahead of them (Fig. 2.3). The shock velocity is essentially the<br />
expansion velocity of the lobe. Shock waves are characterized by a <strong>di</strong>scontinuous and very sharp<br />
change in the characteristics of the gas. Density and temperature jumps across the shock surface<br />
(Rankine-Hugoniot con<strong>di</strong>tions) can be derived from conservation of mass, momentum and energy<br />
across the shock. In a perfect gas and for an a<strong>di</strong>abatic shock traveling normal to the gas flow the<br />
jump con<strong>di</strong>tions for the densityρand temperature T (Landau & Lifshitz 1987) are:<br />
ρ 2<br />
ρ 1<br />
=<br />
γ+1<br />
γ−1+ 2 M 2 (2.4)<br />
3 with respect to the sound speed of the X-ray emitting <strong>di</strong>ffuse gas.<br />
18
2.3. Ra<strong>di</strong>o source – environment interactions 19<br />
Bow Shock<br />
Rlobe<br />
1<br />
2<br />
3<br />
4<br />
Rshell<br />
Ra<strong>di</strong>o Lobe<br />
ISM<br />
Shell<br />
Figure 2.3: Schematic <strong>di</strong>agram of the regions around a supersonically expan<strong>di</strong>ng lobe in the<br />
ISM. Region 1 is the ra<strong>di</strong>o lobe, region 2 the observed X-ray enhancement region, region 3 is<br />
a physically thin layer where the Rankine-Hugoniot shock con<strong>di</strong>tions are met, and region 4 is the<br />
ambient ISM. The figure is taken from Kraft et al. (2003).<br />
ρ 1<br />
T 2<br />
= 2γM2 −γ+1<br />
(2.5)<br />
T 1 γ+1 ρ 2<br />
where the subscripts 1 and 2 stand for the unshocked and shocked gas, andMis the Mach<br />
number of the shock wave.M is defined as the ratio between the shock velocity v and the sound<br />
speed in the un-shocked gas:M=v/c 1 .<br />
In the limit of a very strong shock (M≫1), the two ratios become:<br />
ρ 2<br />
= γ+1<br />
ρ 1 γ−1<br />
(2.6)<br />
T 2<br />
M 2<br />
= 2γ(γ− 1)<br />
T 1 (2γ+ 1) 2.<br />
(2.7)<br />
These show that for a very supersonic lobe expansion, T can be arbitrarily large, whereas the<br />
density jump attains a finite maximum value, which is 4 for a thermal mono-atomic plasma (a<br />
reasonable approximation for the hot IGM). The gas compression and heating take place over the<br />
mean free path of the gas and hence the shock front is expected to be narrow.<br />
The presence of shocks surroun<strong>di</strong>ng ra<strong>di</strong>o lobes can be confirmed using deep X-ray<br />
observations by extracting surface brightness and spectra profiles. These allow the detection of<br />
density and temperature jumps, respectively, (Eqs.2.3 and 2.2) and from these the shock Mach<br />
numberMcan be estimated. So far the two known cases of strong shocks associated with<br />
expan<strong>di</strong>ng ra<strong>di</strong>o-galaxy lobes are found in the FR I sources Cen A and NGC 3801. In these sources<br />
the shocked hot gas is 10 and 4-5 times hotter than the surroun<strong>di</strong>ngs, correspon<strong>di</strong>ng respectively<br />
19
20 2. The X-ray environment of ra<strong>di</strong>o galaxies<br />
-17 00 00<br />
2 4 6 8<br />
-17 00 00<br />
30<br />
30<br />
DECLINATION (J2000)<br />
01 00<br />
30<br />
02 00<br />
DECLINATION (J2000)<br />
01 00<br />
30<br />
02 00<br />
3<br />
2<br />
1<br />
Outer<br />
30<br />
30<br />
03 00<br />
22 14 32 30 28 26 24 22 20<br />
RIGHT ASCENSION (J2000)<br />
03 00<br />
22 14 32 30 28 26 24 22 20 18<br />
RIGHT ASCENSION (J2000)<br />
Figure 2.4: (Left): Overlay of a 5 GHz VLA map (red) of 3C 444 on 0.5 - 5.0 keV Chandra<br />
data (blue) in<strong>di</strong>cating the relationship between the ra<strong>di</strong>o and X-ray structures, inclu<strong>di</strong>ng cavities<br />
coincident with the ra<strong>di</strong>o lobes, and a sharp elliptical surface brightness drop surroun<strong>di</strong>ng the<br />
source. (right): temperature map in keV with 5 GHz contours overlaid. The spectral extraction<br />
regions are numbered. The figure is taken from (Croston et al. 2010).<br />
to shock Mach numbersMof about 8 and 4 respectively (Kraft et al. 2003; Croston et al. 2007).<br />
In both the cases, the total energies stored in the cavities are several times larger than the estimated<br />
PV work.<br />
Weak shocks withM≈1.2−1.7 surroun<strong>di</strong>ng cavities associated with FR I and FR II sources are<br />
observed more frequently (e.g. McNamara et al. 2005; Nulsen et al. 2005a; Croston et al. 2008,<br />
2010). Fig. 2.4 shows the case of the FR II ra<strong>di</strong>o galaxy 3C 444 where the surroun<strong>di</strong>ng intra-cluster<br />
me<strong>di</strong>um is characterized by cavities and a temperature jump of a factor∼1.7, probably caused by<br />
a spheroidal shock (Croston et al. 2010).<br />
The effects of these ra<strong>di</strong>o-galaxy shocks on the magnetic field in the IGM are analysed in<br />
detail in Chapter 5.<br />
20
Chapter 3<br />
Magnetic fields in the hot phase of the<br />
intergalactic me<strong>di</strong>um<br />
In this Chapter I will briefly review the state of our knowledge of intergalactic magnetic<br />
fields. Most attention is given to the results of the analysis of Faraday effect across ra<strong>di</strong>o<br />
galaxies, on which this thesis is based, while those from other techniques are summarized<br />
more briefly. In particular I will show that detailed ra<strong>di</strong>o observations of polarized ra<strong>di</strong>o galaxies<br />
in<strong>di</strong>cate the presence of turbulent magnetic fields fluctuating over a wide range of spatial scales<br />
and provide a means of measuring their power spectra.<br />
3.1 Introduction<br />
The existence of magnetic fields in the extragalactic universe is now well established. Our<br />
knowledge about them has greatly improved over the last few decades, mainly thanks to ra<strong>di</strong>o<br />
continuum observations, which have detected magnetic fields atµG levels in objects such as galaxy<br />
<strong>di</strong>sks and halos and intergalactic me<strong>di</strong>a in both groups and clusters of galaxies. It is also possible<br />
that intergalactic voids are permeated by a widespread magnetic field.<br />
Despite their ubiquity, the role of extragalactic magnetic fields has often remained an ignored<br />
aspect of astrophysics, because of their low energy densities. µG-strength magnetic fields are<br />
now thought to be important for multiple reasons. Fields associated with the thermal IGM<br />
are not thought to be dynamically significant, since they provide typical magnetic pressures<br />
one or two orders of magnitude below thermal values. However, they are believed to strongly<br />
influence the IGM heat conductivity, inhibiting the spatial mixing of gas and propagation of<br />
cosmic rays(e.g. Balbus 2000; Bogdanović et al. 2009). Indeed, the IGM is so extremely <strong>di</strong>lute<br />
that is characterized by huge collisional mean free paths (∼20 kpc). In this con<strong>di</strong>tion, even for<br />
21
22 3. Intergalactic magnetic fields<br />
a weak magnetic field, the expected Larmor ra<strong>di</strong>us (∼ 10 8 cm for T=10 8 K and B=1µG) is much<br />
smaller than the mean free path. It follows that the charged particles are channeled only around<br />
the magnetic field lines, so thermal conduction becomes anisotropic.<br />
A detailed knowledge of the strength and structure (coherence lengths, fluctuations scales)<br />
of intergalactic magnetic fields is therefore important to a better understan<strong>di</strong>ng of the physical<br />
processes in the gaseous environment of galaxies.<br />
Magnetic-field analysis has until recently been restricted to rich clusters of galaxies, while<br />
little attention has been given in the literature to sparser environments, such as groups of galaxies,<br />
although similar physical processes are likely to be at work. Intra-cluster magnetic fields have<br />
been measured using <strong>di</strong>fferent techniques (e.g. Carilli & Taylor 2002) based mainly on the study<br />
of:<br />
• <strong>di</strong>ffuse ra<strong>di</strong>o synchrotron sources within clusters;<br />
• inverse Compton emission and<br />
• Faraday rotation of polarised ra<strong>di</strong>o sources both within and behind clusters.<br />
These analyses have led to slightly <strong>di</strong>screpant estimates for the field strength, which is some<br />
cases could be reconciled taking into account the several and <strong>di</strong>fferent assumptions on which are<br />
the methods are based.<br />
3.1.1 Diffuse synchrotron sources in galaxy clusters<br />
The most <strong>di</strong>rect proof of presence of magnetic fields mixed with the ICM is provided by the<br />
detection of <strong>di</strong>ffuse ra<strong>di</strong>o synchrotron emission on scales up to Mpc in an increasing number of<br />
galaxy clusters (see e.g. Ferrari et al. 2008 for a review). Since this emission appears not to be<br />
associated with single active galaxies but to arise from the ICM itself, it in<strong>di</strong>cates the presence<br />
of both relativistic particles and large-scale magnetic fields in such plasma. These are globally<br />
called the “non-thermal” component of galaxy clusters. Their ra<strong>di</strong>o spectra are well explained as<br />
synchrotron emission from ultra-relativistic electrons (Lorentz factor> ∼ 1000) moving in magnetic<br />
fields of 0.1-1µG strength.<br />
Diffuse cluster ra<strong>di</strong>o emission shows two types of morphology: ra<strong>di</strong>o relics and halos. While<br />
relics are irregular and polarized structures observed at the periphery of clusters, with size ranging<br />
from few tens of kpc up to 10 3 kpc (e.g. Harris et al. 1993; Clarke & Enßlin 2006; Bagchi et<br />
al. 2006; Bonafede et al. 2009a; van Weeren et al. 2010), ra<strong>di</strong>o halos are regular, <strong>di</strong>stributed<br />
as the thermal X-ray emission of the ICM and typically showing low fractional polarization<br />
22
3.1. Introduction 23<br />
Figure 3.1: Example of a relic. Left: Westerbork Synthesis Ra<strong>di</strong>o Telescope (WSRT) image at<br />
1.4 GHz overlaid on the X-ray emission from ROSAT showing the hot ICM (red contours). Right:<br />
Polarization electric field vectors at 4.9 GHz (corrected for the effects of Faraday rotation) and<br />
with lengths proportional to the fractional polarization at the same frequency. A reference vector<br />
for 100% polarization is drawn in the top left corner. Both figures are taken from van Weeren et<br />
al. (2010).<br />
(e.g. Giovannini & Feretti 2002; Clarke & Enßlin 2006; Giacintucci et al. 2009. Both ra<strong>di</strong>o halos<br />
and relics show steep ra<strong>di</strong>o spectra (α≥1) and low surface brightness (∼ 10 −6 Jy arcsec −2 at<br />
1.4 GHz).<br />
The most widely accepted scenario for the origin of ra<strong>di</strong>o relics is that (primary) relativistic<br />
electrons are injected into the ICM from AGN activity and/or from star formation in galaxies. They<br />
are then accelerated by shocks or mergers (Enßlin et al. 1998; Röttiger, Burns & Stone 1999) or<br />
by a<strong>di</strong>abatic compression of fossil ra<strong>di</strong>o plasma (Ensslin & Gopal-Krishna 2001). This picture is<br />
supported by the typical high degree of polarization and the orientation of magnetic field vectors,<br />
which appear to be oriented along the major axis of elongated relics with coherence scales of<br />
several hundreds of kpc (Right panel of Fig. 3.1). Indeed, compression and/or shocks can locally<br />
amplify and align the field with their surfaces.<br />
In contrast, the formation of ra<strong>di</strong>o halos is still debated. Since primary relativistic electrons<br />
lose energy on short timescales (∼ 10 7−8 yrs), they cannot <strong>di</strong>ffuse any significant <strong>di</strong>stance in<br />
the cluster before ceasing to ra<strong>di</strong>ate. To explain the large extension, up to Mpc scales, of ra<strong>di</strong>o<br />
halos, continuous injection processes and/or particle re-acceleration are required. These might<br />
be due to gas turbulence, efficient in energetic mergers (primary models). Another possibility<br />
is that secondary electrons are continuously injected in the ICM by hadronic collisions between<br />
relativistic protons and ICM thermal protons (secondary models). Because of their higher mass,<br />
23
24 3. Intergalactic magnetic fields<br />
18:00.0<br />
-23:20:00.0<br />
Declination<br />
22:00.0<br />
24:00.0<br />
26:00.0<br />
28:00.0<br />
500 kpc<br />
50.0 40.0 20:03:30.0 20.0 10.0<br />
Right ascension<br />
Figure 3.2: Example of a ra<strong>di</strong>o halo. Chandra image of the hot ICM in the cluster RXCJ 2003.5–<br />
2323 overlaid on contours of 235 MHz ra<strong>di</strong>o emission from the Giant Metrewave Ra<strong>di</strong>o Telescope<br />
(GMRT). Taken from Giacintucci et al. (2009).<br />
relativistic protons have loss timescales of the order of the Hubble time, thus they are able to travel<br />
a large <strong>di</strong>stance through the cluster.<br />
The observed link between ra<strong>di</strong>o halos and relics and the unrelaxed state of clusters supports<br />
the scenario of re-acceleration in situ of particles by turbulence produced during cluster mergers<br />
e.g. Schlickeise, Sievers & Thiemann 1987; Brunetti et al. 2001; Petrosian 2001; Fujita, Takizawa<br />
& Sarazin 2003).<br />
Cluster mergers are indeed able to drive turbulence, shocks and compression in the intracluster<br />
me<strong>di</strong>um. The energy <strong>di</strong>ssipated in cluster mergers can be channeled into the amplification<br />
of magnetic fields and particle acceleration (e.g. Carilli & Taylor 2002; Dolag et al. 2002; Brüggen<br />
et al. 2005; Brunetti & Lazarian 2007; Pfrommer, Enßlin & Springel 2008).<br />
However, not all dynamically <strong>di</strong>sturbed clusters possess ra<strong>di</strong>o halos. One of the reasons is<br />
that they are <strong>di</strong>fficult to observe, due to their low surface brightness and steep spectrum. Cassano<br />
& Brunetti (2005) have shown that only the most massive clusters, where the energy density of the<br />
turbulence is high enough, should possess ra<strong>di</strong>o halos produced by primary models.<br />
3.1.2 Magnetic fields from <strong>di</strong>ffuse ra<strong>di</strong>o sources<br />
Secondary models pre<strong>di</strong>ct gamma-ray emission from neutral pion decay from the same hadronic<br />
collisions that create relativistic electrons. So far, such <strong>di</strong>ffuse emission, which would corroborate<br />
the secondary models for the origin of ra<strong>di</strong>o halos, has not been detected from clusters, and only<br />
upper limits can be inferred (e.g. Ackermann et al. 2010). The expected gamma-ray flux is related<br />
24
3.1. Introduction 25<br />
to the relativistic electron energy spectrum, which together with the magnetic field strength also<br />
determines the observed ra<strong>di</strong>o emission. Consequently, an upper limit to the gamma-ray flux<br />
corresponds to a lower limit on the intra-cluster field strength. To reproduce the observed ra<strong>di</strong>o<br />
halo emissivity, current gamma-ray upper limits give average field strength of the order of several<br />
µG (e.g. Jeltema & Profumo 2011).<br />
When halos or relics are observed, minimum energy assumptions offer an alternative approach<br />
to estimate the magnetic field strength B eq averaged over the whole halo/relic volume. This<br />
is the only estimate available for the preferred primary models. Multiple uncertainties affect<br />
this approach (Sec. 1.3.4). In particular, equipartition calculations can grossly underestimate the<br />
field strength as they are based on the assumption of a homogeneous magnetic field throughout<br />
the halo/relic volume, in contrast with evidence for its ra<strong>di</strong>al decline (Sec. 3.5). With standard<br />
assumptions (ζ= 1,Φ=1, emitting frequency range=10 MHz÷10 GHz) B eq ranges from 0.1 to<br />
2µG in cluster halos and from 0.5 up to 6µG in relics (Ferrari et al. 2008 and reference therein,<br />
van Weeren et al. 2010).<br />
3.1.3 Diffuse inverse Compton emission<br />
As in ra<strong>di</strong>o galaxies, the observation of <strong>di</strong>ffuse IC flux from ra<strong>di</strong>o halos and relics would allow<br />
a straightforward determination of both magnetic field strength and relativistic particle density<br />
(Sec. 1.2.3). IC emission from ra<strong>di</strong>o halos and relics, should be observable at hard X-ray energies<br />
(the “HXR excess”) where the exponential decline of the thermal bremsstrahlung, dominating at<br />
soft keV energies, is steeper than the expected non-thermal spectrum (Rephaeli 1977).<br />
So far, highly significant IC emission has been detected only in the Ophiuchus cluster<br />
(e.g. Eckert et al. 2008), which possesses a mini-halo and the implied averaged magnetic field<br />
is≈0.3µG (Murgia et al. 2010). Earlier, less significant, detections gave pre<strong>di</strong>cted magnetic fields<br />
strength in the range 0.1-0.7µG, reaching the higher values in relics (e.g. Slee et al. 2001; Rephaeli,<br />
Gruber & Arieli 2006; Eckert et al. 2008). Similar or slightly higher fields are derived as lower<br />
limits from non-detections of IC emission (e.g. Lutovinov et al. 2008; Wik et al. 2011).<br />
Estimates of magnetic fields from IC emission in clusters are problematic for a number of<br />
reasons.<br />
• It is <strong>di</strong>fficult to <strong>di</strong>stinguish the HXR excess from thermal emission. In some clusters, the<br />
observed spectrum can instead be reproduced by thermal model with a single or multiple<br />
gas temperatures (e.g. Lutovinov et al. 2008; Wik et al. 2011).<br />
• An HXR excess might also be interpreted as synchrotron emission from highly relativistic<br />
electrons (≈PeV, Timokhin et al. 2004) or non-thermal bremsstrahlung from supra-thermal<br />
25
26 3. Intergalactic magnetic fields<br />
electrons (Blasi 2000; Ensslin & Gopal-Krishna 2001). However, the latter scenario<br />
is problematic because of the inefficiency of such process which converts most of the<br />
collisional energy into heat (Petrosian 2001, 2003).<br />
• They assume the coincidence of IC and synchrotron emitting particles, which is poorly<br />
constrained if not unknown.<br />
Taken at face value, IC detections pre<strong>di</strong>ct slightly lower average field strengths than those<br />
which assume equipartition between relativistic electrons and field in halos and relics. These<br />
in turn are of about one order of magnitude below those derived from current upper limits on<br />
gamma-ray emission for secondary models (any improvement in the sensitivity of gamma-ray<br />
observations, will give even higher magnetic fields in this case). On the other hand, changes in<br />
assumptions about the relative number densities of relativistic protons and electrons can lead to<br />
increases in B eq by factors of 2–3 (e.g. Beck & Krause 2005). Because of the various uncertainties<br />
and assumptions of all the methods outlined above, a detailed comparison of their results is not<br />
sensible. We can just say that all of them agree thatµG average magnetic field strengths are<br />
present in clusters.<br />
The Faraday effect across ra<strong>di</strong>o galaxies <strong>di</strong>scussed in the next sections provides a much more<br />
detailed, and I would say surprising, picture of magnetic fields in the hot phase of the IGM.<br />
3.2 Faraday Rotation<br />
The Faraday effect (Faraday 1846) describes the rotation suffered by the plane of polarization<br />
of linearly polarized ra<strong>di</strong>ation traveling through a magnetized thermal plasma. The presence<br />
of magnetic fields induces <strong>di</strong>fferent in<strong>di</strong>ces of refraction (circular birefringence) for the two<br />
circularly polarized components (left versus right) into which linearly polarized ra<strong>di</strong>ation can be<br />
decomposed. The <strong>di</strong>fferent propagation speeds of the two components cause a shift between them<br />
and consequently a rotation of the plane of polarization. Such a situation occurs for example when<br />
polarized ra<strong>di</strong>o galaxies are located behind or embedded in magnetized intergalactic me<strong>di</strong>a.<br />
The rotation∆Ψ of the E-vector position angle of linearly polarized ra<strong>di</strong>ation by a magnetized<br />
thermal plasma is given by:<br />
∆Ψ [rad] =Ψ(λ) [rad] −Ψ 0 [rad] =λ 2 [m 2 ] RM [rad m −2 ] , (3.1)<br />
whereΨ(λ) andΨ 0 are the E-vector position angle of linearly polarized ra<strong>di</strong>ation observed at<br />
wavelengthλ and the intrinsic angle, respectively. RM is the rotation measure. For a fully resolved<br />
foreground Faraday screen, theλ 2 relation of Eq. 3.1 holds exactly at any observingλ.<br />
26
3.2. Faraday Rotation 27<br />
The RM can be expressed as:<br />
∫ L[kpc]<br />
RM [rad m −2 ] = 812 n e [cm −3 ]B z [µG] dz [kpc] , (3.2)<br />
0<br />
where n e is the electron gas density in the thermal plasma, B z is the magnetic field along the lineof-sight<br />
and L is the integration path. Therefore the study of the Faraday effect across polarized<br />
ra<strong>di</strong>o sources allows us to probe the magnetic field strength along the line-of-sight. As already<br />
mentioned in Sec. 1.2.2, the polarization angle can be described by using the observables Stokes<br />
parameters Q and U (Stokes 1852):<br />
Ψ λ = 1 2 arctan (<br />
Uλ<br />
Q λ<br />
)<br />
, (3.3)<br />
and it can be measured at several wavelengths by multi-frequency polarimetric ra<strong>di</strong>o observations.<br />
Then, RM across ra<strong>di</strong>o sources can be derived through a linear fit of the observed polarization<br />
angles as a function ofλ 2 (Eq. 3.1). As is well known, the determination of RM is complicated<br />
because of the nπ ambiguities in the observedΨ obs .<br />
Removal of these ambiguities requires<br />
observations at least at three <strong>di</strong>fferent wavelengths, well-spaced inλ 2 . An alternative is the method<br />
of RM synthesis using simultaneous polarization observations over a contiguous frequency range,<br />
which will be available with the new generation of wideband correlators (Brentjens & Bruyn<br />
2005).<br />
3.2.1 Internal Faraday Rotation<br />
Internal RM occurs if thermal plasma and synchrotron emitting particles are mixed.<br />
In this<br />
case, together with the rotation of the polarization plane we observe a decrease of the degree of<br />
polarization with increasing wavelength. Indeed, emission arising from <strong>di</strong>fferent depths within a<br />
source suffers <strong>di</strong>fferential Faraday rotation reducing the degree of polarization. The functional<br />
form of the expected depolarization is in general related to the geometry of the source.<br />
simplest modeling for such phenomenon is the optically-thin slab with uniform density and<br />
magnetic field located entirely within the source. In this case, the degree of polarization is given<br />
by (Burn 1966):<br />
The<br />
P Obs (λ)=P Int | sin(RM′ λ 2 )<br />
RM ′ λ 2 |, (3.4)<br />
where RM ′ is the internal Faraday RM and is equal to 1 2<br />
of that expected for a foreground slab<br />
screen of the same thermal density and field strength.<br />
Even in the case of internal RM,λ 2 rotation holds at sufficiently short wavelengths.<br />
particular, in the case of the slab model theλ 2 rotation is observed over 90 degrees then shows<br />
27<br />
In
450<br />
400<br />
350<br />
300<br />
300<br />
250<br />
200<br />
150<br />
350<br />
300<br />
250<br />
200<br />
300<br />
250<br />
200<br />
150<br />
350<br />
300<br />
250<br />
200<br />
250<br />
200<br />
150<br />
100<br />
28 3. Intergalactic magnetic fields<br />
01<br />
01<br />
01<br />
1100<br />
01<br />
01<br />
01<br />
0<br />
01 00 1 1 0<br />
01 0 0 1 1<br />
01<br />
01<br />
1100<br />
01<br />
01<br />
01<br />
Figure 3.3: Examples of 01<br />
plots of the E-vector position angleΨ<br />
01<br />
obs againstλ 2 at <strong>di</strong>fferent locations<br />
1100<br />
in PKS 2149-158 The01<br />
exact position of the points in the sources is shown in the insets of the<br />
01<br />
01<br />
in<strong>di</strong>vidual panels. The solid line represent the best fit of theλ 2 -law to the data. Taken from<br />
Guidetti et al. (2008).<br />
an abrupt 90 ◦ change. In more realistic geometries, it is the lack of significant deviations fromλ 2<br />
1100<br />
00 1 11 0<br />
0<br />
01<br />
0 00 1 11 0<br />
1100<br />
1<br />
1<br />
01<br />
01<br />
rotation over≥45 ◦ which allows us to exclude the presence of internal RM. So far, there is little<br />
evidence for RM occurring within the ra<strong>di</strong>o sources. This suggests that either that there is little<br />
thermal plasma in ra<strong>di</strong>o galaxies or that the internal fields are tangled on small scales.<br />
Fig. 3.3 shows some examples ofλ 2 rotation of polarization positions angle for the extended<br />
ra<strong>di</strong>o galaxy PKS 2149-158 in A 2382 (Guidetti et al. 2008). This in<strong>di</strong>cate a foreground origin for<br />
most of the RM across the source. The results from Faraday rotation and depolarization analyses<br />
presented in this thesis (Chapters 4, 5 and 6) are consistent with this scenario.<br />
3.2.2 Foreground RM contributions<br />
The RM occurring in front of ra<strong>di</strong>o galaxies can be thought of as the combined effect of multiple<br />
intervening magneto-ionic me<strong>di</strong>a along the line-of-sight:<br />
1. thermal gas in a skin local to the source;<br />
2. the interstellar and intergalactic me<strong>di</strong>a surroun<strong>di</strong>ng the ra<strong>di</strong>o source;<br />
3. the same components associated with other galaxies located along the line-of-sight;<br />
4. the ISM of our Galaxy and<br />
5. the Earth’s ionosphere.<br />
A process able to form a magnetized local skin around the sources is the growth of Kevin-<br />
Helmholtz instabilities at the surface of the ra<strong>di</strong>o lobes in contact with the surroun<strong>di</strong>ng me<strong>di</strong>um<br />
(Bicknell, Cameron & Gingold 1990). These surface waves are expected to cause advection of the<br />
28
3.2. Faraday Rotation 29<br />
Figure 3.4: RM (corrected for the Galactic contribution) plotted as a function of source impact<br />
parameter in kpc for a sample of Abell clusters. The ra<strong>di</strong>o galaxies are split into clusters members<br />
(red), background (blue) sources and sources whose line-of-sight does not intercept the clusters<br />
X-ray emission (black). Taken from Clarke (2004).<br />
magnetic field internal to the ra<strong>di</strong>o galaxies into the surroun<strong>di</strong>ng thermal gas with the consequent<br />
creation of a local Faraday screen. This model pre<strong>di</strong>cts magnetic field reversals and depolarization<br />
of emission from the surface layer.<br />
Arguments in favour of an origin of the observed RM in the IGM of the ra<strong>di</strong>o source (item 2)<br />
are as follows.<br />
• The detection of <strong>di</strong>ffuse synchrotron emission in galaxy clusters (Sec. 3.1.1), implies that<br />
the IGM must be magnetized, so Faraday rotation is inevitable.<br />
• The more <strong>di</strong>stant ra<strong>di</strong>o lobe of a source shows higher depolarization than the approaching<br />
one (the Laing-Garrington effect; Laing 1988; Garrington et al. 1988). This is interpreted<br />
as resulting from a <strong>di</strong>fference in the path length, and hence the Faraday depth, for the two<br />
lobes. Such an effect is not expected for a skin model (item 1) since in this case there is no<br />
reason for <strong>di</strong>fferent path lengths between the two lobes.<br />
• A statistical comparison of the RM’s of point sources behind, embedded in and away from<br />
foreground galaxy clusters (Clarke 2004) has shown that those located behind clusters have<br />
a large RM <strong>di</strong>spersion (Fig. 3.4).<br />
• Very large RM values are observed in cool core clusters.<br />
• The <strong>di</strong>spersion in RM observed across in<strong>di</strong>vidual sources is not correlated with Galactic<br />
coor<strong>di</strong>nates, implying that the Galactic contribution is not dominant on small scales<br />
(although it will influence the mean).<br />
29
30 3. Intergalactic magnetic fields<br />
• The presence of RM fluctuations on small angular scales also argues against a Galactic<br />
origin.<br />
The latter two points suggest a generally small Galactic contribution, which nonetheless can<br />
become significant for ra<strong>di</strong>o sources located at low Galactic latitudes and when the Galactic<br />
magnetic field is almost aligned along the line-of-sight. To derive the properties of the RM local<br />
to the source, the Galactic contribution must be estimated and then properly removed; this is<br />
<strong>di</strong>scussed more in detail in the next section. Finally, the RM due to the Earth’s ionosphere at cm<br />
wavelengths is expected to be at most a few degrees (less at solar minimum) and is generally small<br />
compared with the fitting errors.<br />
3.2.3 Galactic Faraday rotation<br />
Our Galaxy has a magnetic field which can be thought as sum of an ordered component on kpc<br />
scale and a random one fluctuating on smaller scales. Both the two fields have mean strength of<br />
about 2µG e.g. (Beck 1996).<br />
Most extragalactic ra<strong>di</strong>o sources show Faraday rotation measures of the order of 10 rad m −2<br />
due to propagation of the emission through the magnetized interstellar me<strong>di</strong>um of our Galaxy<br />
(Simard-Norman<strong>di</strong>n et al. 1981). Diffuse and ionized Galactic feature in front of the sources,<br />
often associated with HII regions, represent another source of RM. At Galactic latitudes|b|≤5 ◦ ,<br />
ra<strong>di</strong>o sources can show Galactic RM’s up to±300 rad m −2 . The Galactic RM can be estimated<br />
by comparing the mean RM values of sources near the target, and assuming a smooth spatial<br />
variation of the Galactic field. Dineen & Coles (2005) have derived spherical harmonic models<br />
for the Galactic RM, by fitting to the RM values of large numbers of extragalactic sources.<br />
There is evidence for linear gra<strong>di</strong>ents in Galactic RM on arcminute scales: Laing et al.<br />
(2006) found a gra<strong>di</strong>ent of 0.025 rad m −2 arcsec −1 along the jets of the ra<strong>di</strong>o galaxy NGC 315<br />
(l=124.6 ◦ , b=−32.5 ◦ ). They argued that this gra<strong>di</strong>ent is almost certainly Galactic in origin,<br />
since the amplitude of the linear variation exceeds that of the small-scale fluctuations associated<br />
with NGC 315 (see also the case of 3C 449 presented in Chapter 4). Although the estimate of<br />
the Galactic RM might be highly uncertain in some cases, the angular size of ra<strong>di</strong>o galaxies are<br />
usually small enough so that it can be reasonably approximated as constant across them. In this<br />
case, the study of the RM local to the source is provided by statistical analysis techniques based<br />
on the use of the structure function (Sec. 3.7.1) which is a powerful tool independent of the mean<br />
level and (to first order) of structure on scales larger than the measurement area.<br />
30
3.3. Depolarization 31<br />
3.3 Depolarization<br />
Faraday rotation generally leads to a decrease of the degree of polarization with increasing<br />
wavelength, or depolarization (DP) in <strong>di</strong>fferent circumstances. We define DP λ 1<br />
λ 2<br />
= p(λ 1 )/p(λ 2 ),<br />
where p(λ) is the degree of polarization at a given wavelengthλ. We adopt the conventional<br />
usage, in which higher depolarization corresponds to a lower value of DP.<br />
Laing (1984) summarized the interpretation of polarization data. Faraday depolarization of<br />
ra<strong>di</strong>o emission from ra<strong>di</strong>o sources can occur in three principal ways:<br />
1. thermal plasma is mixed with the synchrotron emitting material (internal depolarization,<br />
Sec. 3.2.1);<br />
2. there are fluctuations of the foreground Faraday rotation across the beam (beam<br />
depolarization) and<br />
3. the polarization angle varies across the finite band of the receiving system (bandwidth<br />
depolarization).<br />
The last two terms are globally named as external depolarization and are due only to<br />
limitations of the instrumental capabilities.<br />
The beam depolarization is due to the presence of unresolved inhomogeneities of thermal<br />
density and/or magnetic field which cause <strong>di</strong>fferential Faraday rotation of the polarization angle<br />
within the observing beam, and in turn a decrease of the observed degree of polarization with<br />
increasing wavelength. From a foreground Faraday screen with a small gra<strong>di</strong>ent of RM across the<br />
beam, it is still possible to observeλ 2 rotation over a wide range of polarization angle. In this case,<br />
the wavelength dependence of the depolarization is expected to follow the Burn law (Burn 1966)<br />
p(λ)= p(0) exp(−kλ 4 ), (3.5)<br />
where p(0) is the intrinsic value of the degree of polarization and k=2|∇RM| 2 σ 2 , with FWHM=<br />
2σ(2 ln 2) 1/2 . Since k ∝ |∇RM| 2 , Eq. 3.5 clearly illustrates that higher RM gra<strong>di</strong>ents across<br />
the beam generate higher k values and hence higher depolarization. The variation of p with<br />
wavelength can potentially be used to estimate fluctuations of RM across the beam, which are<br />
below the resolution limit. We can determine the intrinsic polarization p(0) and the proportionality<br />
constant k by a linear fit to the logarithm of the observed fractional polarization as a function of<br />
λ 4 .<br />
To <strong>di</strong>stinguish between the external and internal depolarization, sensitive polarization data at<br />
multiple frequencies and resolutions are needed. A decrease in depolarization with increasing<br />
31
32 3. Intergalactic magnetic fields<br />
resolution, is expected from beam depolarization (Eq. 3.5). The external depolarization is<br />
correlated with the amount of the RM gra<strong>di</strong>ent, while that occurring internally is expected to<br />
be correlated with the geometry of the source and the RM values, in the sense that regions of small<br />
RM correspond to low depolarization.<br />
Finally, bandwidth depolarization occurs when a significant rotation of the polarization angle<br />
of the ra<strong>di</strong>ation is produced across the finite bandwidth of the receiving system. The rotation of<br />
the polarization angle across the observing band is:<br />
∆Ψ=−2RMλ 2∆ν<br />
ν<br />
(3.6)<br />
where∆ν is the bandwidth and ν is the central frequency. This will reduce the observed<br />
polarization level by a quantity sin(∆Ψ)/∆Ψ below that for monochromatic ra<strong>di</strong>ation. None of<br />
the observations used in this work are affected by significant bandwidth depolarization.<br />
3.4 RM analysis<br />
Observations of Faraday rotation variations across extended ra<strong>di</strong>o galaxies, once corrected for<br />
the contribution from our Galaxy (Sec 3.2.3), allow us to derive information about the integral<br />
of the density-weighted line-of-sight field component. The hot (T≃10 7 − 10 8 K) plasma emits<br />
in the X-ray energy band via thermal bremsstrahlung (Sec. 2.2.1). When high quality X-ray data<br />
for a ra<strong>di</strong>o-source environment are available, it is possible to infer the gas density <strong>di</strong>stribution and<br />
therefore to separate it from that of the magnetic field (Eq. 3.2), subject to some assumptions about<br />
the relation of field strength and density. Consequently, uncertainties on these field estimates come<br />
from the assumed magnetic field topology and gas density profile.<br />
Faraday rotation measure analysis has a number of advantages over other methods for<br />
estimating the magnetic field. RM stu<strong>di</strong>es can be carried out across ra<strong>di</strong>o galaxies hosted in<br />
less dense environments, allowing the study of magnetic fields in systems too sparse for ra<strong>di</strong>o<br />
halos to be detected. Moreover, the analysis of <strong>di</strong>ffuse ra<strong>di</strong>o emission requires low-resolution and<br />
low-frequency observations, making it <strong>di</strong>fficult to derive detailed information on the structure of<br />
the intergalactic magnetic field. These limitations do not affect RM maps, which can be produced<br />
even at sub-arcsec angular resolution at high frequencies (≥5 GHz) as long as the ra<strong>di</strong>o galaxies<br />
are bright enough in polarized intensity.<br />
A detailed study of intergalactic magnetic fields through the analysis of <strong>di</strong>ffuse ra<strong>di</strong>o sources<br />
is also limited by the fact that these are affected by strong internal depolarization, intrinsically<br />
related to the nature of the <strong>di</strong>ffuse synchrotron emission itself. In contrast, so far there is little<br />
evidence for internal depolarization in ra<strong>di</strong>o galaxies.<br />
32
3.5. The magnetic field profile 33<br />
Faraday rotation stu<strong>di</strong>es also provide information about the <strong>di</strong>rection of the magnetic field,<br />
being the positive (negative) when the magnetic field <strong>di</strong>rection points towards (away from) the<br />
observer. One potential problem is that there could be numerous field reversals along the line of<br />
sight, which would be averaged out. The minimum field strength can be derived by assuming a<br />
constant magnetic field along the line-of-sight. Such estimates generally give fields of about 1µG.<br />
Finally, through an extrapolation of Eq. 3.1 to zero wavelength, RM stu<strong>di</strong>es allow us to<br />
determine the intrinsic <strong>di</strong>stribution of the projected magnetic field of ra<strong>di</strong>o galaxies, and its relation<br />
to the environment.<br />
3.5 The magnetic field profile<br />
In order to estimate the magnetic field strength, the equipartition and IC analyses assume a constant<br />
magnetic field through the whole halo or relic volume.<br />
This assumption is an oversimplified<br />
picture as is clear from a simple energy-balance argument: if the field was uniform on Mpc scales,<br />
the magnetic pressure would exceed the thermal pressure in the outskirts of the clusters. Jaffe<br />
(1980) first suggested that the magnetic field <strong>di</strong>stribution in a cluster might be similar to those of<br />
the thermal gas density and the volume density of massive galaxies and therefore would decline<br />
with the cluster ra<strong>di</strong>us. Observations, analytical models and MHD simulations of galaxy clusters<br />
all suggest that the magnetic field intensity should scale with the thermal gas density (e.g. Brunetti<br />
et al. 2001; Dolag 2006; Dolag, Bykov & Diaferio 2008; Guidetti et al. 2008). Govoni et al.<br />
(2001a) found a two-point spatial correlation between the X-ray and ra<strong>di</strong>o halo surface brightness<br />
in the galaxy clusters of their sample suggesting that the thermal and non-thermal components<br />
might have similar ra<strong>di</strong>al scalings. Another in<strong>di</strong>cation of a ra<strong>di</strong>al decrease of the magnetic field<br />
strength comes from the ra<strong>di</strong>al steepening observed in a few ra<strong>di</strong>o halos (Coma, A665, A2163,<br />
Giovannini et al. 1993; Feretti et al. 2004a) which are expected in the modeling of ra<strong>di</strong>o halos<br />
formation inclu<strong>di</strong>ng such a ra<strong>di</strong>al decrease.<br />
Multiple works based on RM simulations (e.g. Murgia et al. 2004; Govoni et al. 2006; Guidetti<br />
et al. 2008; Laing et al. 2008; Kuchar & Enßlin 2009; Bonafede et al. 2010) have considered a<br />
ra<strong>di</strong>al field-strength variation of the form:<br />
〈B 2 (r)〉 1/2 = B 0<br />
[<br />
ne (r)<br />
n 0<br />
] η<br />
(3.7)<br />
Here, B 0 is the rms magnetic field strength at the group/cluster centre and n e (r) is the thermal<br />
electron gas density. The results from the simulations are in favour ofηin the range 0.5-1. This<br />
functional form is consistent with other observations, analytical models and numerical simulations.<br />
In particular,η=2/3 corresponds to flux-freezing andη=1/2 to equipartition between thermal<br />
33
34 3. Intergalactic magnetic fields<br />
and magnetic energy. Dolag et al. (2001, 2006) foundη≈1 from the correlation between the<br />
observed rms RM and X-ray surface brightness in galaxy groups and clusters and showed that this<br />
is consistent with the results of MHD simulations.<br />
3.6 Tangled magnetic field<br />
Most of the published RM images of ra<strong>di</strong>o galaxies located in <strong>di</strong>fferent environments show random<br />
structures with patches of <strong>di</strong>fferent size, ranging from a few kpc up to tens of kpc (Fig. 3.5). From<br />
these RM <strong>di</strong>stributions it is clear that the magnetic fields are not regularly ordered on cluster (Mpc)<br />
scales, but highly turbulent. It is indeed likely that anisotropies in the magnetic field would reflect<br />
themselves in the RM images, since the projection connecting field and RM conserves anisotropy.<br />
Faraday rotation by tangled intergalactic magnetic fields was considered in several early<br />
theoretical papers (e.g. Lawler & Dennison 1982; Tribble 1991; Felten 1996). The simplest RM<br />
modeling invokes a Faraday screen in which the magnetic field fluctuates on a single scaleΛ c . The<br />
screen can be thought as made of cells of constant size and magnetic field strength, but random<br />
magnetic field <strong>di</strong>rection. The RM from such a screen will be produced by a random walk along the<br />
line-of-sight. Because of the large number of cells, the RM <strong>di</strong>stribution is expected to be described<br />
by a Gaussian function with zero mean and <strong>di</strong>spersionσ RM given by:<br />
∫<br />
σ 2 RM =〈RM2 〉=812 2 Λ c (n e B z ) 2 dz. (3.8)<br />
Considering a thermal density <strong>di</strong>stribution which follows aβ-profile (Eq. 2.3), and an isotropic<br />
field (so that B= √ 3B z ), Eq. 3.8 can be integrated analytically and gives (Felten 1996)<br />
σ RM (r ⊥ )= KBn 0rc 1/2 Λ 1/2 √<br />
c<br />
(1+ r ⊥ Γ(3β−0.5)Γ(3β) (3.9)<br />
rc<br />
) (6β−1)/4<br />
whereΛ c is the cell size, r ⊥ is the projected <strong>di</strong>stance of from the cluster center,Γis the Gamma<br />
function, and K is a factor which depends on the location of the ra<strong>di</strong>o source along the line-of-sight<br />
(e.g. Carilli & Taylor 2002). The central field strength can be estimated by using Eq. 3.9:σ RM (r ⊥ )<br />
can be measured from spatially resolved RM images and at a first level of approximationΛ c can<br />
be assumed to be equal to the coherence length, deduced by-eye, of the RM map. It must however<br />
borne in mind that the magnetic fields in this model are not <strong>di</strong>vergence-free (Enßlin & Vogt 2003).<br />
This method has been applied to both statistical samples (Clarke 2004) and to single objects,<br />
e.g. Hydra A (Taylor & Perley 1993) 1993), A 119 (Feretti et al. 1999b), 3C 295 (Allen et al.<br />
2001), A 514 (Govoni et al. 2001a), 3C 129 Taylor2001, A 400 and A 2634 (Eilek & Owen 2002).<br />
The magnetic field strengths deduced from these analyses are in the range 4-20µG, assumingΛ c<br />
34
3.6. Tangled magnetic field 35<br />
rad m −2<br />
RAD/M/M rad m −2 -150 -100 -50 0<br />
-100 -50 0 50 100<br />
-15 36 00<br />
100 kpc<br />
-15 38 00<br />
-15 40 00<br />
(a) (b) (c)<br />
Figure 3.5: RM images of ra<strong>di</strong>o galaxies with tails: PKS 2149-158 and PKS 2149-158b (a), 3C 31<br />
(b), and 3C 75 (c). Figures respectively taken from: Guidetti et al. (2008), Laing et al. (2008),<br />
Eilek & Owen (2002).<br />
of about 10 kpc, with the highest values found for ra<strong>di</strong>o galaxies in cooling-core clusters. None<br />
of these magnetic fields are thought to be dynamically important, since they provide negligible<br />
pressure compared with that of the thermal component.<br />
Although RM images in general are not expected to show perfectly Gaussian <strong>di</strong>stributions<br />
because of the partial sampling of large spatial scales, the Gaussian function is found to be a<br />
good representation for many RM <strong>di</strong>stributions, supporting the scenario of a tangled and isotropic<br />
magnetic field component along the line-of-sight.<br />
However, in contrast with this scenario the<br />
majority of the RM <strong>di</strong>stributions show non-zero means〈RM〉 if averaged over areas of size<br />
comparable with that of the ra<strong>di</strong>o source, even after removing the Galactic contribution. These<br />
〈RM〉’s are thought to be due to large-scale magnetic field structure, whose fluctuations occur<br />
on scales larger than those producing the RM <strong>di</strong>spersion. Therefore, the magnetic field cannot<br />
be tangled only on a single scale, but it must have fluctuations over a wide range of spatial<br />
scales: small-scale components are necessary to produce the smallest structures observed in the<br />
RM images (Fig. 3.5) and structures on larger scales are needed to account for the non-zero RM<br />
mean. For this reason, the investigation of the magnetic field power spectrum has been object<br />
of many recent papers. Several stu<strong>di</strong>es (Enßlin & Vogt 2003; Enßlin & Vogt 2005; Murgia et al.<br />
2004; Govoni et al. 2006; Guidetti et al. 2008; Laing et al. 2008; Kuchar & Enßlin 2009) have<br />
shown that detailed RM images of ra<strong>di</strong>o galaxies can be used to infer not only the strength of the<br />
cluster magnetic field, but also its power spectrum. All of these stu<strong>di</strong>es agree that random RM<br />
structures can be accurately reproduced if the magnetic field is isotropic and randomly variable<br />
with fluctuations on a wide range of spatial scales.<br />
35
36 3. Intergalactic magnetic fields<br />
3.7 The magnetic field power spectrum<br />
In order to derive the three-<strong>di</strong>mensional magnetic field power spectrum from the analysis of the<br />
RM images, it is necessary to assume statistical isotropy for the field, since only the component<br />
of the magnetic field along the line-of-sight contributes to the observed RM. It is important<br />
to underline that the turbulence in the intergalactic me<strong>di</strong>um can be locally inhomogeneous, as<br />
expected in the MHD regime, particularly regar<strong>di</strong>ng small scales fluctuations. However, it is<br />
likely that the local anisotropies are isotropically <strong>di</strong>stributed, so that whenever the volume sampled<br />
is large enough these anisotropies tend to average out along any line-of-sight. Therefore, the<br />
assumption of magnetic-field isotropy must be taken in the sense that the field has no preferred<br />
<strong>di</strong>rection when averaged over a sufficiently large volume.<br />
If the intergalactic magnetic field can be approximated as Gaussian random variable, then<br />
its spatial <strong>di</strong>stribution can be described by the power spectrum of the component along the lineof-sight,<br />
or its Fourier transform (the autocorrelation function, Wiener-Khinchin Theorem). For<br />
intergalactic magnetic fields, these assumptions are justified by:<br />
• the patchiness of most of the RM images across ra<strong>di</strong>o galaxies, consistent with isotropic<br />
random magnetic fields<br />
• the fact that a sum of a large number of independent and identically-<strong>di</strong>stributed random<br />
variables (i.e., the field components) approaches a Gaussian <strong>di</strong>stribution (Central Limit<br />
Theorem,Rice et al. 1955).<br />
Following Laing et al. (2008), the three-<strong>di</strong>mensional magnetic field power spectrum can be<br />
expressed as ŵ( f ) such that ŵ( f )d f x d f y d f z is the power in a volume d f x d f y d f z of frequency space,<br />
with f (magnitude f ) representing a vector in the frequency space with the f z coor<strong>di</strong>nate along the<br />
line-of-sight. The other interesting property of the magnetic field is its auto-correlation length<br />
which in term of ŵ( f ) is given by:<br />
Λ B = 1 4<br />
∫ ∞<br />
0<br />
∫ ∞<br />
0<br />
ŵ( f ) f d f<br />
ŵ( f ) f 2 d f<br />
(3.10)<br />
The constant 1 4<br />
<strong>di</strong>ffers by a factor of 4π from that in the equivalent expressions in Enßlin & Vogt<br />
(2003, equation 39): a factor of 2π is due to the use of spatial frequency f rather than wave-number<br />
k (k=2π f ) and a factor of 2 is due to the <strong>di</strong>fferent integration limits. 1<br />
Enßlin & Vogt (2003, 2005) have shown that typicallyΛ RM >Λ B since the former gives<br />
more weight to the largest spatial scales. In the literature, these scales have often been assumed to<br />
1 Enßlin & Vogt (2003) integrate from−∞ to+∞ in r and r ⊥ .<br />
36
3.7. The magnetic field power spectrum 37<br />
Figure 3.6: Comparison of theσ RM profiles obtained from simulations of a Gaussian and random<br />
magnetic field (solid line) and the expectations from the analytical model of Eq. 3.9 by assuming<br />
three <strong>di</strong>fferentΛ c :Λ min =6 kpc,Λ B =Λ Bz = 16 kpc,Λ RM =69 kpc (dashed and dotted lines). The<br />
best agreement is given byΛ c =Λ B . The simulated magnetic field power spectrum has slope n=2.<br />
The source is assumed to be halfway through the cluster and the magnetic field strength and gas<br />
density have the same ra<strong>di</strong>al profiles in both the simulations and the analytical formulation. Taken<br />
from Murgia et al. (2004).<br />
be identical and the approximationΛ c =Λ RM has been used in the single-scale model (Eq. 3.9),<br />
lea<strong>di</strong>ng to underestimates of the magnetic field strength. Murgia et al. (2004) have shown thatΛ B<br />
is a good approximation forΛ c in Eq. 3.9 and therefore that this length must be used to compare<br />
the analytical pre<strong>di</strong>ctions from the single-scale model with RM analyses assuming a multi-scale<br />
field (Fig. 3.6). SinceΛ B depends on the underlying magnetic field power spectrum (Eq. 3.10), the<br />
latter must be estimated first.<br />
Multiple <strong>di</strong>fferent estimators of spatial statistics of the RM <strong>di</strong>stributions such as structure and<br />
auto-correlation functions or a multi-scale statistic have been used to derive the field strength, its<br />
relation to the gas density and its power spectrum (Murgia et al. 2004; Govoni et al. 2006; Guidetti<br />
et al. 2008; Laing et al. 2008). The technique of Bayesian maximum likelihood has also been used<br />
for this purpose (Enßlin & Vogt 2005; Kuchar & Enßlin 2009). These stu<strong>di</strong>es have shown that the<br />
magnetic field power spectrum is well approximated by a power-law<br />
ŵ( f )∝ f −q (3.11)<br />
over a range of spatial frequencies, correspon<strong>di</strong>ng respectively to the outer and inner fluctuation<br />
scales of the magnetic field 2 . Although the theory of intergalactic magnetic field fluctuations is<br />
still debated, a power-law functional form is expected if the turbulence is mostly hydrodynamic,<br />
2 Spatial frequency and scale are related in the sense: f= 1/Λ<br />
37
38 3. Intergalactic magnetic fields<br />
or in the MHD cascade investigated by Goldreich & Sridhar 1997.<br />
The analysis of Vogt & Enßlin (2003, 2005) suggests that the magnetic field power spectrum<br />
has a power law form with the slope appropriate for Kolmogorov turbulence and that the autocorrelation<br />
length of the magnetic field fluctuations is a few kpc. Also Adaptive Mesh Refinement<br />
(AMR) simulations by Brüggen et al. (2005) are consistent with the Kolmogorov slope. However,<br />
the Kolmogorov theory (1941), which assumes homogeneous and incompressible turbulence,<br />
cannot be rigorously applied because of the evidence in the intergalactic me<strong>di</strong>um of gas ra<strong>di</strong>al<br />
scaling and in some cases of shells of compressed gas. Moreover, the deduction of a Kolmogorov<br />
slope could be premature: there is a degeneracy between the slope and the outer scale, which is<br />
<strong>di</strong>fficult to resolve with current Faraday rotation data (Murgia et al. 2004; Guidetti et al. 2008;<br />
Laing et al. 2008). Indeed, Murgia et al. (2004) pointed out that shallower magnetic field power<br />
spectra are possible if the magnetic field fluctuations have structure on scales of several tens of<br />
kpc. Guidetti et al. (2008) showed that a power-law power spectrum with a Kolmogorov slope,<br />
and an abrupt long-wavelength cut-off at 35 kpc gave a very good fit to their Faraday rotation<br />
and depolarization data for the ra<strong>di</strong>o galaxies in A 2382, although a shallower slope exten<strong>di</strong>ng to<br />
longer wavelengths was not ruled out.<br />
In the next section I will describe the method used in this thesis to derive the magnetic power<br />
spectrum from our RM maps.<br />
3.7.1 Magnetic field power spectrum from two-<strong>di</strong>mensional analysis<br />
The relation between the magnetic field power spectrum and the observed RM <strong>di</strong>stribution is in<br />
general quite complicated, depen<strong>di</strong>ng on the fluctuations in the thermal gas density, the geometry<br />
of the source and the surroun<strong>di</strong>ng me<strong>di</strong>um, and the effects of incomplete sampling. In order to<br />
derive the magnetic field power spectrum, one must make the following assumptions (e.g. Guidetti<br />
et al. 2008; Laing et al. 2008):<br />
1. The observed Faraday rotation is due entirely to a foreground ionized me<strong>di</strong>um. This can be<br />
addressed by lack of deviation fromλ 2 rotation over a wide range of polarization position<br />
angle and the lack of associated depolarization (Sec 3.2.1)<br />
2. The magnetic field is an isotropic, Gaussian random variable<br />
3. The form of the magnetic field power spectrum is independent of position<br />
4. The magnetic field is <strong>di</strong>stributed throughout the Faraday-rotating me<strong>di</strong>um, whose density is<br />
a smooth, spherically symmetric function<br />
38
3.7. The magnetic field power spectrum 39<br />
5. The amplitude of ŵ( f ) is spatially variable, but is a function only of the thermal electron<br />
density.<br />
These assumptions guarantee that the spatial <strong>di</strong>stribution of the magnetic field can be described<br />
entirely by its power spectrum ŵ( f ) and that for a me<strong>di</strong>um of constant depth and density, the power<br />
spectra of magnetic field and RM are proportional (Enßlin & Vogt 2003).<br />
If the RM fluctuations are isotropic, the RM power spectrum Ĉ( f ⊥ ) is the Hankel transform<br />
of the auto-correlation function C(r ⊥ ), defined as<br />
C(r ⊥ )=〈RM(r ⊥ + r ′ ⊥)RM(r ′ ⊥)〉, (3.12)<br />
where r ⊥ and r ′ ⊥ are vectors in the plane of the sky and〈〉 is an average over r′ ⊥ . One could<br />
think of obtaining the magnetic field power spectrum <strong>di</strong>rectly by Fourier transforming Eq. 3.12.<br />
In reality, the observations are affected first by the effects of convolution with the beam, which<br />
mo<strong>di</strong>fy the spatial statistics of RM, and secondly, by the limited size and irregular shape of the<br />
sampling region (the region of the source over which the RM has been derived), which results in<br />
a complicated window function (Enßlin & Vogt 2003) for computational work in the frequency<br />
space. Finally, most of the useful properties of the auto-correlation function are related to the<br />
outer scale at C(r ⊥ ) approaches the zero-level, which in most cases is uncertain in the presence of<br />
large-scale fluctuations.<br />
The alternative strategy proposed by Laing et al. (2008), and applied in the work of this<br />
thesis, first estimates the power spectrum of the RM, Ĉ(f ⊥ ), where Ĉ(f ⊥ )d f x d f y is the power in<br />
the area d f x d f y , and derives that of the three-<strong>di</strong>mensional magnetic-field ŵ(f). Laing et al. (2008)<br />
demonstrated a procedure that takes into account the convolution effects and minimises the effects<br />
of uncertainties in the zero-level. In particular, they showed that<br />
1. in the short-wavelength limit (meaning that changes in Faraday rotation across the beam<br />
are adequately represented as a linear gra<strong>di</strong>ent), the measured RM <strong>di</strong>stribution is closely<br />
approximated by the convolution of the true RM <strong>di</strong>stribution with the observing beam<br />
2. the structure function is a powerful and reliable statistical tool to quantify the two<br />
<strong>di</strong>mensional fluctuations of RM, given that it is independent of the zero-level and structure<br />
on scales larger than the area under investigation.<br />
The structure function is defined by<br />
S (r ⊥ )= (3.13)<br />
39
40 3. Intergalactic magnetic fields<br />
(Simonetti, Cordes & Spangler 1984; Minter & Spangler 1996). It is related to the autocorrelation<br />
function C(r ⊥ ) for a sufficiently large averaging region by S (r ⊥ )=2[C(r ⊥ )−C(0)].<br />
Laing et al. (2008) also derived the effects of convolution with the observing beam on the<br />
observed structure function. For the special case of a power-law power spectrum (their Eq.<br />
B2), they showed that the observed structure function after convolution can be heavily mo<strong>di</strong>fied<br />
even at separations up to a few times the FWHM of the observing beam. Fig. 3.7 illustrates the<br />
effects of the convolution in two <strong>di</strong>fferent power-law power spectra and correspon<strong>di</strong>ng structure<br />
function. After convolution the two power spectra are in<strong>di</strong>stinguishable. This effect must<br />
be taken into account when comparing observed and pre<strong>di</strong>cted structure functions. However,<br />
because the suppression of power on high spatial frequencies due to the convolution, this analysis<br />
only constrains the power spectrum of the fluctuations on scales larger than the beam-width.<br />
Complementary information can be derived from numerical simulations of depolarization with<br />
fine spatial sampling (Laing et al. 2008; Guidetti et al. 2008) which constrain fluctuations of RM<br />
below the resolution limit. indeed, the use of the structure function together with the Burn law k<br />
represents a powerful technique to investigate the RM power spectrum over a wide range of spatial<br />
scales (Laing et al. 2008).<br />
In this thesis we have derived very detailed images of Faraday rotation and depolarization<br />
across ra<strong>di</strong>o galaxies. The next Chapters will show that all of our observations are consistent with<br />
pure foreground Faraday rotation. Where the RM structures can be reasonably approximated<br />
as isotropic, the statistics of the magnetic-field fluctuations have been quantified by deriving<br />
rotation measure structure functions, fitted using models derived from theoretical power spectra.<br />
The minimum scale of the magnetic field variations have been derived from depolarization<br />
measurements. However, I will also show that not all Faraday rotation maps are consistent with<br />
an isotropic magnetic field. This forms the most important part of my thesis and describes an<br />
unexpected phenomenon in the RM world.<br />
40
3.7. The magnetic field power spectrum 41<br />
Figure 3.7: (a), (c), (e): the two model RM power spectra <strong>di</strong>scussed for the ra<strong>di</strong>o galaxy 3C 31 in<br />
Laing et al. (2008). Solid line, broken power-law power spectrum with in<strong>di</strong>ces q high = 11/3, q low<br />
= 2.32 and a break frequency of 0.062 arcsec −1 (their equation 8). Dashed line: power-law power<br />
spectrum with q=2.39 and a high-frequency cut-off at f max = 0.144 arcsec −1 (their equation 9).<br />
(b), (d), (f): structure functions computed for the power spectra in panels (a), (c) and (d), with the<br />
same line codes. (a) and (b) no convolution; (c) and (d) 1.5 arcsec FWHM convolving beam; (e)<br />
and (f) 5.5 arcsec FWHM convolving beam.<br />
41
42 3. Intergalactic magnetic fields<br />
42
Chapter 4<br />
Structure of the magneto-ionic me<strong>di</strong>um<br />
around the Fanaroff-Riley Class I ra<strong>di</strong>o<br />
galaxy 3C 449 ∗<br />
M<br />
agnetic fields associated with galaxy groups deserve to be investigated in more detail,<br />
since their environments are more representative than those of rich clusters. Moreover,<br />
observations, analytical models and MHD simulations of galaxy clusters all suggest that the<br />
magnetic-field intensity should scale with the thermal gas density (e.g. Brunetti et al. 2001;<br />
Dolag 2006; Guidetti et al. 2008; Bonafede et al. 2010). A key question is whether the relation<br />
between magnetic field strength and density in galaxy groups is a continuation of this trend.<br />
This Chapter presents a detailed analysis of Faraday rotation in 3C 449, a bright, extended ra<strong>di</strong>o<br />
source hosted by the central galaxy of a nearby group. With the aim of shed<strong>di</strong>ng new light on<br />
the environment around this source, I derive the statistical properties of the magnetic field from<br />
observations of Faraday rotation, following the method developed by Murgia et al. (2004). I use<br />
numerical simulations to pre<strong>di</strong>ct the Faraday rotation for <strong>di</strong>fferent strengths and power spectra of<br />
the magnetic field.<br />
With the assumed cosmology, at the <strong>di</strong>stance of 3C 449 1 arcsec corresponds to 0.342 kpc.<br />
4.1 The ra<strong>di</strong>o source 3C 449: general properties<br />
I image and model the Faraday rotation <strong>di</strong>stribution across the giant FR I ra<strong>di</strong>o source 3C 449,<br />
whose environment is very similar to that of 3C 31. The optical counterpart of 3C 449,<br />
UGC 12064, is a dumb-bell galaxy and is the most prominent member of the group of galaxies<br />
∗ Guidetti et al. 2010, A&A, 514, 50<br />
43
IMAGE: XMM_AS_1.3_OGEOM.FITS<br />
CNTRS: 1.3_5.5_I_2000_XMM.FITS<br />
0.5 1 1.5 2 2.5<br />
44 4. The magneto-ionic me<strong>di</strong>um around 3C 449<br />
39 30 00<br />
100 kpc<br />
DECLINATION (J2000)<br />
39 25 00<br />
39 20 00<br />
N Spur<br />
N Jet<br />
S Lobe<br />
S Jet<br />
N Lobe<br />
S Spur<br />
39 15 00<br />
22 32 00<br />
22 31 30 22 31 00<br />
RIGHT ASCENSION (J2000)<br />
22 30 30<br />
Figure 4.1: Ra<strong>di</strong>o contours of 3C 449 at 1.365 GHz superposed on the XMM-Newton X-ray image<br />
(courtesy of J. Croston, Croston et al. 2003). The ra<strong>di</strong>o contours start at 3σ I and increase by factors<br />
of 2. The restoring beam is 5.5 arcsec FWHM. The main regions of 3C 449 <strong>di</strong>scussed in the text<br />
are labelled.<br />
2231.2+3732 (Zwicky & Kowal 1968) The source is relatively nearby (z=0.017085, RC3.9, de<br />
Vaucouleurs et al. 1991) and quite extended, both in angular (30 arcmin) and linear size, so it is an<br />
ideal target for an analysis of the Faraday rotation <strong>di</strong>stribution: detailed images can be constructed<br />
that can serve as the basis of an accurate study of magnetic field power spectra.<br />
The source 3C 449 was one of the first ra<strong>di</strong>o galaxies stu<strong>di</strong>ed in detail with the VLA (Perley,<br />
Willis & Scott 1979). High- and low-resolution ra<strong>di</strong>o data already exist and the source has been<br />
mapped at many frequencies. The ra<strong>di</strong>o emission of 3C 449 (Fig. 4.1) is elongated in the N–S<br />
<strong>di</strong>rection and is characterized by long, two-sided jets with a striking mirror symmetry close to<br />
the nucleus. The jets terminate in well-defined inner lobes, which fade into well polarized tails<br />
(spurs), of which the southern one is more collimated. The spurs in turn expand to form <strong>di</strong>ffuse<br />
outer lobes.<br />
The brightness ratio of the ra<strong>di</strong>o jets is very nearly 1, implying that they are close to the plane<br />
of the sky if they are intrinsically symmetrical and have relativistic flow velocities similar to those<br />
44
4.1. The ra<strong>di</strong>o source 3C 449: general properties 45<br />
derived for other FR I jets (Perley, Willis & Scott 1979; Feretti et al. 1999a; Laing & Bridle 2002a).<br />
Therefore the jets are assumed to lie exactly in the plane of the sky, which simplifies the geometry<br />
of the Faraday-rotating me<strong>di</strong>um.<br />
Hot gas associated with the galaxy was detected on both the group and the galactic scales by<br />
X-ray imaging (Hardcastle, Worrall & Birkinshaw, 1998; Croston et al. 2003). These observations<br />
revealed deficits in the X-ray surface brightness at the positions of the outer ra<strong>di</strong>o lobes, suggesting<br />
interactions with the surroun<strong>di</strong>ng material. Figure 4.1 shows ra<strong>di</strong>o contours at 1.365 GHz overlaid<br />
on the X-ray emission as observed by the XMM-Newton satellite (Croston et al. 2003). The X-ray<br />
ra<strong>di</strong>al surface brightness profile of 3C 449 derived from these data can be fitted with the sum of a<br />
point-source convolved with the instrumental response and aβmodel (Cavaliere & Fusco-Femiano<br />
1976):<br />
n e (r)=n 0 (1+r 2 /rc) 2 − 3 2 β , (4.1)<br />
where r, r c and n 0 are the <strong>di</strong>stance from the group X-ray center, the group core ra<strong>di</strong>us, and<br />
the central electron density, respectively. Croston et al. (2008) found a best fitting model with<br />
β=0.42±0.05, r c = 57.1 arcsec and n 0 = 3.7×10 −3 cm −3 . In these calculations, I assumed that<br />
the group gas density is described by the model of Croston et al. (2008). The X-ray depressions<br />
noted by Croston et al. (2003) are at <strong>di</strong>stances larger than those at which it is possible to detect<br />
linear polarization, and there is no <strong>di</strong>rect evidence of smaller cavities close to the nucleus. I<br />
therefore neglect any departures from the spherically-symmetrical density model, noting that this<br />
approximation may become increasingly inaccurate where the source widens (i.e. in the inner<br />
lobes and spurs).<br />
The source 3C 449 resembles 3C 31 in environment and in ra<strong>di</strong>o morphology: both sources are<br />
associated with the central members of groups of galaxies, and their redshifts are very similar. The<br />
nearest neighbours are at a projected <strong>di</strong>stances of about 30 kpc in both cases. Both ra<strong>di</strong>o sources<br />
have large angular extents, ben<strong>di</strong>ng jets and long, narrow tails with low surface brightnesses and<br />
steep spectra, although 3C 31 appears much more <strong>di</strong>storted on large scales. There is one significant<br />
<strong>di</strong>fference: the inner jets of 3C 31 are thought to be inclined by≈50 ◦ to the line-of-sight (Laing<br />
& Bridle 2002a), whereas those in 3C 449 are likely to be close to the plane of the sky (Feretti et<br />
al. 1999a). It is therefore expected that the magnetized foreground me<strong>di</strong>um will be very similar<br />
in the two sources, but that the geometry will be significantly <strong>di</strong>fferent, lea<strong>di</strong>ng to a much more<br />
symmetrical <strong>di</strong>stribution of Faraday rotation in 3C 449 compared with that observed in 3C 31 by<br />
Laing et al. (2008).<br />
45
46 4. The magneto-ionic me<strong>di</strong>um around 3C 449<br />
4.2 Total intensity and polarization properties<br />
The VLA observations and their reduction were presented by Feretti et al. (1999a). The high<br />
quality of these data makes this source suited for a very detailed analysis of the statistics of the<br />
Faraday rotation.<br />
I produced total intensity (I) and polarization (Q and U) images at frequencies in the range<br />
1.365 – 8.385 GHz from the combined, self-calibrated u-v datasets described by Feretti et al.<br />
(1999a). The center frequencies and bandwidths are listed in Table 4.1. Each frequency channel<br />
was imaged separately, except for those at 8.245 and 8.445 GHz, which were averaged. The<br />
analysis below confirms that these frequency-bandwidth combinations lead to negligible Faraday<br />
rotation across the channels, as already noted by Feretti et al. (1999a). All of the datasets were<br />
imaged with Gaussian tapering in the u-v plane to give resolutions of 1.25 arcsec and 5.5 arcsec<br />
FWHM,CLEANed and restored with circular Gaussian beams. The first angular resolution is<br />
the highest possible at all frequencies and provides good signal-to-noise for the ra<strong>di</strong>o emission<br />
within 150 arcsec (≃50 kpc) of the ra<strong>di</strong>o core (the well defined ra<strong>di</strong>o jets and the inner lobes),<br />
while minimizing beam depolarization. The lower resolution of 5.5 arcsec allows imaging of the<br />
extended emission as far as 300 arcsec (≃100 kpc) from the core at frequencies from 1.365 –<br />
4.985 GHz (the 8.385-GHz dataset does not have adequate sensitivity to image the outer parts of<br />
the source). Therefore it is possible to study the structure of the magnetic field in the spur regions,<br />
which lie well outside the bulk of the X-ray emitting gas. Noise levels for both sets of images are<br />
given in Table 4.1. Note that the maximum scales of structure, which can be imaged reliably with<br />
the VLA at 8.4 and 5 GHz are≈180 and≈300 arcsec, respectively (Ulvestad, Perley & Chandler<br />
2009). For this reason, I only use the Stokes I images for quantitative analysis within half these<br />
<strong>di</strong>stances of the core. The Q and U images have much less structure on these large scales and are<br />
reliable to <strong>di</strong>stances of±150 arcsec at 8.4 GHz and±300 arcsec at 5 GHz, limited by sensitivity<br />
rather than systematic errors due to missing flux as in the case of the I image.<br />
Images of polarized intensity P=(Q 2 + U 2 ) 1/2 (corrected for Ricean bias, following Wardle<br />
& Kronberg (1974), fractional polarization p= P/I and polarization angleΨ=(1/2) arctan(U/Q)<br />
were derived from the I, Q, and U images.<br />
All of the polarization images (P, p,Ψ) at a given frequency were blanked where the rms<br />
error inΨ > 10 ◦ at any frequency. I then calculated the scalar mean degree of polarization<br />
〈p〉 for each frequency and resolution; the results are listed in Table 4.1. The values of〈p〉 are<br />
higher at 5.5 arcsec resolution than at 1.25 arcsec because of the contribution of the extended<br />
and highly polarized emission, which is not seen at the higher resolution. At 1.25 arcsec, where<br />
the beam depolarization is minimized, the mean fractional polarization shows a steady increase<br />
46
4.3. The Faraday rotation in 3C 449 47<br />
Table 4.1: Parameters of the total intensity and polarization images.<br />
ν Bandwidth 1.25 arcsec 5.5 arcsec<br />
σ I σ QU 〈p〉 σ I σ QU 〈p〉<br />
(GHz) (MHz) (mJy/beam) (mJy/beam) (mJy/beam) (mJy/beam)<br />
1.365 12.5 0.037 0.030 0.24 0.018 0.014 0.26<br />
1.445 12.5 0.021 0.020 0.25 0.020 0.011 0.27<br />
1.465 12.5 0.048 0.049 0.25 0.019 0.013 0.25<br />
1.485 12.5 0.035 0.027 0.21 0.014 0.010 0.26<br />
4.685 50.0 0.017 0.017 0.32 0.017 0.013 0.37<br />
4.985 50.0 0.018 0.017 0.33 0.017 0.016 0.39<br />
8.385 100.0 0.014 0.011 0.31 0.015 0.013 −<br />
Col. 1: Observation frequency. Col. 2: Bandwidth (note that the images at 8.385 GHz are derived from the average of two frequency<br />
channels, both with bandwidths of 50 MHz, centered on 8.285 and 8.485 GHz); Cols.3, 4 : rms noise levels in total intensity (σ I )<br />
and linear polarization (σ QU , the average ofσ Q andσ U ) at 1.25 arcsec FWHM resolution; Col. 5: mean degree of polarization at<br />
1.25 arcsec; Col. 6, 7: rms noise levels for the 5.5 arcsec images; Col. 8: mean degree of polarization at 5.5 arcsec. I estimate that<br />
the uncertainty in the degree of polarization, which is dominated by systematic deconvolution errors on the I images, is≈0.02<br />
at each frequency.<br />
from 1.365 to 4.685 GHz, where it reaches an average value of 0.32 and then remains roughly<br />
constant at higher frequencies, suggesting that the depolarization between 4.685 and 8.385 GHz is<br />
insignificant.<br />
4.3 The Faraday rotation in 3C 449<br />
4.3.1 Rotation measure images<br />
I produced images of RM and its associated rms error by weighted least-squares fitting to the<br />
polarization angle maps (Eq. 3.1) with resolutions of 1.25 arcsec and 5.5 arcsec (Fig. 4.2a and b)<br />
using a version of theAIPS taskRM mo<strong>di</strong>fied by G. B. Taylor. The 1.25 arcsec-RM map was made<br />
by combining the maps of the polarization E-vector (Ψ) at all the seven available frequencies, so<br />
that the sampling ofλ 2 is very good. The RM map was calculated with a weighted least-squares fit<br />
at pixels with polarization angle uncertainties
48 4. The magneto-ionic me<strong>di</strong>um around 3C 449<br />
IMAGE: SUBIM.FITS<br />
IMAGE: SUBIM.FITS<br />
;220 ;200 ;180 ;160 ;140 ;120 ;100<br />
RAD/M/M<br />
;200 ;150 ;100<br />
RAD/M/M<br />
39 24 00<br />
39 27 00<br />
10 kpc<br />
10 kpc<br />
39 23 00<br />
N Lobe<br />
N Spur<br />
39 24 00<br />
DECLINATION (J2000)<br />
39 22 00<br />
39 21 00<br />
N Jet<br />
S Jet<br />
DECLINATION (J2000)<br />
39 21 00<br />
(c)<br />
39 20 00<br />
S Lobe<br />
39 18 00<br />
S Spur<br />
39 19 00<br />
(a)<br />
22 31 24 22 31 21 22 31 18<br />
RIGHT ASCENSION (J2000)<br />
(b)<br />
22 31 30 22 31 24 22 31 18 22 31 12<br />
RIGHT ASCENSION (J2000)<br />
(d)<br />
Figure 4.2: (a): Image of the rotation measure of 3C 449 at a resolution of 1.25 arcsec FWHM,<br />
computed at the seven frequencies between 1.365 and 8.385 GHz. (b): Image of the rotation<br />
measure of 3C 449 at a resolution of 5.5 arcsec FWHM, computed at the six frequencies between<br />
1.365 and 4.985 GHz. In both of the RM images, the sub-regions used for the two-<strong>di</strong>mensional<br />
analysis of Sec. 4.5 are labelled. (c) and (d): profiles ofσ RM as a function of the projected<br />
<strong>di</strong>stance from the ra<strong>di</strong>o source center. The points represent the values ofσ RM evaluated in boxes<br />
as described in the text. The horizontal and vertical bars represent the bin widths and the rms on<br />
the mean expected from fitting errors, respectively. Positive <strong>di</strong>stances are in the <strong>di</strong>rection of the<br />
north jet and the vertical dashed lines show the position of the nucleus.<br />
dominated by the Galactic contribution (see Sec. 4.3.2). The RM <strong>di</strong>stribution peaks at<br />
−161.7 rad m −2 , with a rms <strong>di</strong>spersion σ RM =19.7 rad m −2 . Note that I have not corrected<br />
the values ofσ RM for the fitting errorσ RMfit . A first order correction would beσ RMtrue =<br />
(σ 2 RM −σ2 RM fit<br />
) 1/2 . Given the low value forσ RMfit , the effect of this correction would be very<br />
small.<br />
As was noted by Feretti et al. (1999a), the RM <strong>di</strong>stribution in the inner jets is highly symmetric<br />
about the core with RM≃ −197 rad m −2 at <strong>di</strong>stances< ∼ 15 arcsec. The symmetry of the RM<br />
<strong>di</strong>stribution in the jets is broken at larger <strong>di</strong>stances from the core: while the RM structure in<br />
the southern jet is homogeneous, with values around −130 rad m −2 , fluctuations on scales of<br />
≃10 arcsec (≃ 3 kpc) around a〈RM〉 of −160 rad m −2 are present in the northern jet. The lobes<br />
are characterized by similar patchy RM structures with mean values〈RM〉≃−164 rad m −2 and<br />
48
4.3. The Faraday rotation in 3C 449 49<br />
Figure 4.3: Plots of E-vector position<br />
angleΨagainstλ 2 at representative<br />
points of the 5.5-arcsec RM map. Fits<br />
to the relationΨ(λ)=Ψ 0 + RMλ 2 are<br />
shown. The values of RM are given<br />
in the in<strong>di</strong>vidual panels.<br />
σ RM ≃16 rad m −2 .<br />
At 5.5 arcsec resolution, more extended polarized regions of 3C 449 can be mapped with<br />
good sampling inλ 2 . The average fitting error is≃1.0 rad m −2 . Both spurs are characterized by<br />
〈RM〉≃−160 rad m −2 , withσ RM =15 and 10 rad m −2 in the north and south, respectively. The<br />
overall mean and rms for the 5.5 arcsec image,〈RM〉=−160.7 rad m −2 andσ RM =18.9 rad m −2 ,<br />
are very close to those determined at higher resolution and are consistent with the integrated value<br />
of−162±1 rad m −2 derived by Simard-Norman<strong>di</strong>n et al. (1981).<br />
It was demonstrated by Feretti et al. (1999a) that the polarization position angles at 1.25 arcsec<br />
resolution accurately follow the relation∆Ψ ∝ λ 2 over a wide range of rotation. I find the<br />
same effect at lower resolution: plots of E-vector position angleΨagainstλ 2 at representative<br />
points of the 5.5 arcsec-RM image are shown in Fig 4.3. As at the higher resolution, there are no<br />
significant deviations from the relation∆Ψ∝λ 2 over a range of rotation∆Ψ of 600 ◦ , confirming<br />
that a foreground magnetized me<strong>di</strong>um is responsible for the majority of the Faraday rotation and<br />
exten<strong>di</strong>ng this result to regions of lower surface brightness.<br />
49
50 4. The magneto-ionic me<strong>di</strong>um around 3C 449<br />
In Fig. 4.2(c) and (d), I show profiles ofσ RM for both low and high resolution RM images. The<br />
1.25 arcsec profile was obtained by averaging over boxes with lengths ranging from 9 to 13 kpc<br />
along the ra<strong>di</strong>o axis; for the 5.5 arcsec profile I used boxes with a fixed length of 9 kpc (these sizes<br />
were chosen to give an adequate number of independent points per box). The boxes extend far<br />
enough perpen<strong>di</strong>cular to the source axis to include all unblanked pixels. In both plots, there is<br />
clear evidence for a decrease in the observedσ RM towards the periphery of the source, the value<br />
dropping from≃30 rad m −2 close to the nucleus to≃10 rad m −2 at 50 kpc. This is qualitatively<br />
as expected for foreground Faraday rotation by a me<strong>di</strong>um whose density (and presumably also<br />
magnetic field strength) decreases with ra<strong>di</strong>us. The symmetry of theσ RM profiles is consistent<br />
with the assumption that the ra<strong>di</strong>o source lies in the plane of the sky.<br />
4.3.2 The Galactic Faraday rotation<br />
For the purpose of this work, 3C 449 has an unfortunate line-of-sight within our Galaxy. Firstly, the<br />
source is located at l=95.4 ◦ , b=−15.9 ◦ in Galactic coor<strong>di</strong>nates, where the Galactic magnetic<br />
field is known to be aligned almost along the line-of-sight. Secondly, there is evidence from ra<strong>di</strong>o<br />
and optical imaging for a <strong>di</strong>ffuse, ionized Galactic feature in front of 3C 449, perhaps associated<br />
with the nearby HII region S126 (Andernach et al. 1992). Estimates of the Galactic foreground<br />
RM at the position of 3C 449 from observations of other ra<strong>di</strong>o sources are uncertain: Andernach et<br />
al. (1992) found a mean value of−212 rad m −2 for six nearby sources, but the spherical harmonic<br />
models of Dineen & Coles (2005), which are derived by fitting to the RM values of large numbers<br />
of extragalactic sources, pre<strong>di</strong>ct−135 rad m −2 . Nevertheless, it is clear that the bulk of the mean<br />
RM of 3C 449 must be Galactic.<br />
In order to investigate the magnetized plasma local to 3C 449, the value and possible spatial<br />
variation of this Galactic contribution must be constrained. The profiles ofσ RM (Fig. 4.2) show<br />
that the small-scale fluctuations of RM drop rapidly with <strong>di</strong>stance from the nucleus. I might<br />
therefore expect the Galactic contribution to dominate on the largest scales. At low resolution, the<br />
RM can be accurately determined out to≈100 kpc from the core. This is roughly 5 core ra<strong>di</strong>i for<br />
the X-ray emission and therefore well outside the bulk of the intra-group gas.<br />
In order to estimate the Galactic RM contribution, I averaged the 5.5-arcsec RM image in<br />
boxes of length 20 kpc along the ra<strong>di</strong>o axis (the box size has been increased from that of Fig. 4.2<br />
to improve the <strong>di</strong>splay of large-scale variations). The profile of〈RM〉 against the <strong>di</strong>stance from<br />
the ra<strong>di</strong>o core is shown in Fig. 4.4. The large deviations from the mean in the innermost two bins<br />
are associated with the maximum inσ RM and are almost certainly due to the intra-group me<strong>di</strong>um.<br />
The <strong>di</strong>spersion in〈RM〉 is quite small in the south and the value of〈RM〉=−160.7 rad m −2 for the<br />
whole source is very close to that of the outer south jet. There are significant fluctuations in the<br />
50
4.4. Depolarization 51<br />
Figure 4.4: Profile of RM averaged over<br />
boxes of length 20 kpc along the ra<strong>di</strong>o axis<br />
for the 5.5 arcsec image. The horizontal bars<br />
represent the bin width. The vertical bars<br />
are the errors on the mean calculated from<br />
the <strong>di</strong>spersion in the boxes, the contribution<br />
from the fitting error is negligible and is not<br />
taken into account. Positive <strong>di</strong>stances are<br />
in the <strong>di</strong>rection of the north jet. The black<br />
vertical dashed line in<strong>di</strong>cates the position of<br />
the nucleus; the green dashed line shows the<br />
adopted mean value for the Galactic RM.<br />
north, however. Given their rather small scale (∼300 arcsec), it is most likely that these arise in the<br />
local environment of 3C 449, and I include them in the statistical analysis given below.<br />
There is some evidence for linear gra<strong>di</strong>ents in Galactic RM on arcminute scales (Laing et<br />
al. 2006a). In order to check the effect of a large-scale Galactic RM gra<strong>di</strong>ent on these results, I<br />
computed an unweighted least-squares fit of a function〈RM〉= RM 0 + ax, where a and RM 0 are<br />
constant and x is measured along the ra<strong>di</strong>o axis. The two innermost bins in Fig. 4.4 were excluded<br />
from the fit. The best estimate for the gra<strong>di</strong>ent is very small: a=0.0054 rad m −2 arcsec −1 . I have<br />
verified that subtraction of this gra<strong>di</strong>ent has a negligible effect on the structure-function analysis<br />
given in Sec. 4.6.3.<br />
I therefore adopt a constant value of−160.7 rad m −2 as the Galactic contribution.<br />
4.4 Depolarization<br />
I first estimated the bandwidth effects on the polarized emission of 3C 449 using the RM<br />
measurements from Sec. 4.3.1. In the worst case (the highest absolute RM value of−240 rad m −2 )<br />
at the lowest frequency of 1.365 GHz) the rotation across the band is≈10 ◦ . This results in a<br />
depolarization of 0.017, negligible compared with errors due to noise.<br />
The analysis of the depolarization of 3C 449 is based on the approach of Laing et al. (2008).<br />
I made images of k at both standard resolutions by weighted least-squares fitting to the<br />
fractional polarization maps (Eq. 3.5), using theFARADAY code by M. Murgia. The same frequencies<br />
were used as for the RM images: 8.385 – 1.365 GHz and 4.985 – 1.365 GHz at 1.25 and 5.5 arcsec<br />
resolution, respectively. By simulating the error <strong>di</strong>stributions for p, I established that the mean<br />
values of k were biased significantly at low signal-to-noise (cf. Laing et al. 2008), so only data<br />
51
52 4. The magneto-ionic me<strong>di</strong>um around 3C 449<br />
IMAGE: K;BURN_4P_2000.FITS<br />
IMAGE: K;BURN_5.5.FITS<br />
;400 ;200 0 200 400 600<br />
;400 ;200 0 200 400 600 800 1000<br />
39 24 00<br />
39 27 00<br />
39 23 00<br />
39 24 00<br />
DECLINATION (J2000)<br />
39 22 00<br />
39 21 00<br />
DECLINATION (J2000)<br />
39 21 00<br />
(c)<br />
39 20 00<br />
39 18 00<br />
39 19 00<br />
(a)<br />
22 31 24 22 31 21 22 31 18<br />
RIGHT ASCENSION (J2000)<br />
(b)<br />
22 31 30 22 31 24 22 31 18 22 31 12<br />
RIGHT ASCENSION (J2000)<br />
(d)<br />
Figure 4.5: (a): image of the Burn law k in rad 2 m −4 computed from a fit to the relation<br />
p(λ) = p(0) exp(−kλ 4 ) for seven frequencies between 1.365 and 8.385 GHz. (b): as (a), but<br />
the angular resolution is 5.5 arcsec FWHM, and the k image has been computed computed from<br />
the fit to the six frequencies between 1.365 and 4.985 GHz. (c) and (d): profiles for k as functions<br />
of the projected <strong>di</strong>stance from the ra<strong>di</strong>o source center (boxes as in Fig. 4.2). The horizontal and<br />
vertical bars represent the bin widths and the error on the mean, respectively. Positive <strong>di</strong>stances<br />
are in the <strong>di</strong>rection of the north jet, and the vertical dashed lines show the position of the nucleus.<br />
with p>4σ p at each frequency are included in the fits. I estimate that any bias is negligible<br />
compared with the fitting error. I also derived profiles of k with the same sets of boxes as for the<br />
σ RM profiles in Fig. 4.2.<br />
The 1.25 arcsec resolution k map is shown in Fig. 4.5(a), together with the profile of the k<br />
values (Fig. 4.5c). The fit to aλ 4 law is very good everywhere: examples of fits at selected pixels<br />
in the jets and lobes are shown in in Fig. 4.6. The symmetry observed in theσ RM profiles is<br />
also seen in the 1.25 arcsec k image (Fig. 4.5): the mean values of k are≃50 rad 2 m −4 for both<br />
lobes, 107 and 82 rad 2 m −4 for the northern and southern jet, respectively. The region with the<br />
highest depolarization is in the northern jet, very close to the core and along the west side. The<br />
integrated value of k at this resolution is≃56 rad 2 m −4 , correspon<strong>di</strong>ng to a mean depolarization<br />
DP 20cm<br />
3cm ≃ 0.87.<br />
The image and profile of k at 5.5-arcsec resolution are shown in Fig. 4.5(b) and (d). The fit<br />
52
4.4. Depolarization 53<br />
1.25 arcsec 5.5 arcsec<br />
Figure 4.6: Plots of degree of polarization, p (log scale) againstλ 4 for representative points at<br />
1.25-arcsec and 5.5-arcsec resolution. Burn law fits (Eq. 3.5) are also plotted. The values of k are<br />
quoted in the in<strong>di</strong>vidual panels.<br />
to aλ 4 law is in general good and examples are shown in in Figs. 4.6. As mentioned earlier, the<br />
maximum scale of structure imaged accurately in total intensity at 5 GHz is∼300 arcsec (100 kpc)<br />
and there are likely to be significant systematic errors in the degree of polarization on larger scales.<br />
I therefore show the profile only for the inner±50 kpc. Over this range, the k profiles are quite<br />
symmetrical, as at higher resolution. Note also that the small regions of very high k at the edge of<br />
the northern and southern spurs in the map shown in Fig. 4.5 are likely to be spurious.<br />
The mean values of k are≃184 rad 2 m −4 and 178 rad 2 m −4 for the northern and southern lobes,<br />
respectively; and≃238 and 174 rad 2 m −4 in the northern and in the southern spurs. The integrated<br />
value of k is≃194 rad 2 m −4 , correspon<strong>di</strong>ng to a depolarization DP 20cm<br />
6cm ≃ 0.64.<br />
To summarize, depolarization between 20 cm and 3 cm is observed. Since I measure lower<br />
values of k at 1.25 arcsec than 5.5 arcsec, there is less depolarization at high resolution, as expected<br />
for beam depolarization. The highest depolarization is observed in a region of the northern jet,<br />
close to the ra<strong>di</strong>o core and associated with a steep RM gra<strong>di</strong>ent. Depolarization is significantly<br />
higher close to the nucleus, which is consistent with the higher path length through the group gas<br />
observed in X-rays. Aside from this global variation, I found no evidence for a detailed correlation<br />
of depolarization with source structure. Depolarization and RM data are therefore both consistent<br />
with a foreground Faraday screen. In Sec. 4.5.2 I show that the residual depolarization at 1.25-<br />
arcsec resolution can be produced by RM fluctuations on scales smaller than the beam-width, but<br />
higher-resolution observations are needed to establish this conclusively.<br />
53
54 4. The magneto-ionic me<strong>di</strong>um around 3C 449<br />
4.5 Two <strong>di</strong>mensional analysis<br />
4.5.1 General considerations<br />
In order to interpret the fluctuations of the magnetic field responsible for the observed RM and<br />
depolarization of 3C 449, I first <strong>di</strong>scuss the statistics of the RM fluctuations in two <strong>di</strong>mensions. I<br />
use the notation of Laing et al. (2008) in which f= ( f x , f y , f z ) is a vector in the spatial frequency<br />
domain, correspon<strong>di</strong>ng to the position vector r=(x, y, z). The z-axis is taken to be along the<br />
line-of-sight, so that the vector r ⊥ = (x, y) is in the plane of the sky and f ⊥ = ( f x , f y ) is the<br />
correspon<strong>di</strong>ng spatial frequency vector. The goal is to estimate the RM power spectrum Ĉ(f ⊥ ),<br />
where Ĉ(f ⊥ )d f x d f y is the power in the area d f x d f y and in turn to derive the three-<strong>di</strong>mensional<br />
magnetic-field power spectrum ŵ(f), defined so that ŵ(f)d f x d f y d f z is the power in a volume<br />
d f x d f y d f z of frequency space.<br />
In order to derive the magnetic-field power spectrum, I make the simplifying assumptions<br />
<strong>di</strong>scussed in Sec. 3.7.1, which can be summarized as follows: the observed Faraday rotation occurs<br />
in a foreground screen (in agreement with the results in Secs. 4.3 and 4.4) whose density is a<br />
spherically symmetric function; the magnetic field is <strong>di</strong>stributed throughout the Faraday-rotating<br />
me<strong>di</strong>um and it is an isotropic, Gaussian random variable, whose power spectrum is independent of<br />
position; the power spectrum amplitude is a function only of the thermal electron density. These<br />
assumptions guarantee that the spatial <strong>di</strong>stribution of the magnetic field can be described entirely<br />
by its power spectrum ŵ( f ) and that for a me<strong>di</strong>um of constant depth and density, the power spectra<br />
of magnetic field and RM are proportional (Enßlin & Vogt 2003)<br />
In Sec. 4.3.2, I showed that the Galactic contribution to the 3C 449 RM is substantial and<br />
argued that a constant value of−160.7 rad m −2 is the best estimate for its value. Fluctuations<br />
in the Galactic magnetic field on scales comparable with the size of the ra<strong>di</strong>o sources could be<br />
present; conversely, the local environment of the source might make a significant contribution<br />
to the mean RM. Both of these possibilities lead to <strong>di</strong>fficulties in the use of the autocorrelation<br />
function. Therefore, following the approach of Laing et al. (2008), I initially used the RM<br />
structure function (Eq. 3.13) to determine the form of field power spectrum (Sec. 4.5.2), while<br />
for its normalization (determined by global variations of density and magnetic field strength), I<br />
made use of three-<strong>di</strong>mensional simulations (Sec. 4.6).<br />
4.5.2 Structure functions<br />
I calculated the structure function for <strong>di</strong>screte regions of 3C 449, over which the spatial variations<br />
of thermal gas density, rms magnetic field strength and path length are expected to be reasonably<br />
54
4.5. Two <strong>di</strong>mensional analysis 55<br />
small. For each of these regions, I first made unweighted fits of model structure functions derived<br />
from power spectra with simple, parametrized functional forms, accounting for convolution with<br />
the observing beam. I then generated multiple realizations of a Gaussian, isotropic, random RM<br />
field, with the best-fitting power spectrum on the observed grids, again taking into account the<br />
effects of the convolving beam. Finally, I made a weighted fit using the <strong>di</strong>spersion of the synthetic<br />
structure functions as estimates of the statistical errors for the observed structure functions, which<br />
are impossible to quantify analytically (Laing et al. 2008).<br />
These errors, which result from<br />
incomplete sampling, are much larger than those due to noise, but depend only weakly on the<br />
precise form of the underlying power spectrum. The measure of the goodness of fit isχ 2 , summed<br />
over a range of separations from r ⊥ = FWHM to roughly half of the size of the region: there is no<br />
information in the structure function for scales smaller than the beam, and the upper limit is set<br />
by sampling. The errors are, of course, much higher at the large spatial scales, which are less well<br />
sampled. Note, however, that estimates of the structure function from neighbouring bins are not<br />
statistically independent, so it is not straightforward to define the effective number of degrees of<br />
freedom.<br />
I selected six regions for the structure-function analysis, as shown in Fig. 4.2. These are<br />
symmetrically placed about the nucleus, consistent with the orientation of the ra<strong>di</strong>o jets close to<br />
the plane of the sky. For the north and south jets, I derived the structure functions only at 1.25-<br />
arcsec resolution, as the low-resolution RM image shows no ad<strong>di</strong>tional structure and has poorer<br />
sampling. For the north and south lobes, I computed the structure functions at both resolutions<br />
over identical areas and compared them. The agreement is very good, and the low-resolution RM<br />
images do not sample significantly larger spatial scales, so I show only the 1.25-arcsec results.<br />
Finally, I used the 5.5-arcsec RM images to compute the structure functions for the north and<br />
south spurs, which are not detected at the higher resolution.<br />
The structure function has a positive bias given by 2σ 2 noise , whereσ noise is the uncorrelated<br />
random noise in the RM image (Simonetti, Cordes & Spangler 1984). The mean noise of the<br />
1.25 and 5.5-arcsec RM maps is
56 4. The magneto-ionic me<strong>di</strong>um around 3C 449<br />
the structure function, inclu<strong>di</strong>ng convolution (Laing et al. 2008), and therefore to avoid numerical<br />
integration.<br />
The fits were quite good, but systematically gave slightly too much power on small spatial<br />
scales and over-pre<strong>di</strong>cted the depolarization. I therefore fit a cut-off power law (CPL) power<br />
spectrum of the form<br />
Ĉ( f ⊥ ) = 0 f ⊥ < f min<br />
= C 0 f −q<br />
⊥<br />
f ⊥ ≤ f max<br />
= 0 f ⊥ > f max . (4.3)<br />
Initially, I consider values of f min sufficiently small that their effects on the structure functions<br />
over the observed range of separations are negligible. The free parameters of the fit in this case<br />
are the slope, q, the cut-off spatial frequency f max and the normalization of the power spectrum,<br />
C 0 . In Table 4.2, I give the best-fitting parameters for CPL fits to all of the in<strong>di</strong>vidual regions. The<br />
fitted model structure functions are plotted in Fig. 4.7(a)–(f), together with error bars derived from<br />
multiple realizations of the power spectrum as in Laing et al. (2008).<br />
In order to constrain RM structure on spatial scales below the beam-width, I estimated the<br />
depolarization expected from the best power spectrum for each of the regions with 1.25-arcsec<br />
RM images, following the approach of Laing et al. (2008). To do this, multiple realizations of<br />
RM images have been made on an 8192 2 grid with fine spatial sampling. I then derived the Q<br />
and U images at our observing frequencies, convolved to the appropriate resolution and compared<br />
the pre<strong>di</strong>cted and observed mean degrees of polarization. These values are given in Table 4.4.<br />
The uncertainties in the expected< k > in Table 4.4 represent statistical errors determined<br />
from multiple realizations of RM images with the same set of power spectrum parameters. The<br />
pre<strong>di</strong>cted and observed values are in excellent agreement. A constant value of f max = 1.67 arcsec −1<br />
pre<strong>di</strong>cts very similar values, also listed in Table 4.4. I have not compared the depolarization data<br />
at 5.5-arcsec resolution in the spurs because of limited coverage of large spatial scales in the I<br />
images (Sec. 4.2), which is likely to introduce systematic errors at 4.6 and 5.0 GHz.<br />
I performed a joint fit of the CPL power spectra, minimizing theχ 2 summed over all six subregions,<br />
giving equal weight to each and allowing the normalizations to vary independently. In this<br />
case the free parameters of the fit are the six normalizations (one for each sub-region), the slope,<br />
and the maximum spatial frequency. The joint best-fitting single power-law power spectrum has<br />
q=2.68.<br />
A single power law slope does not give a good fit to all of the regions simultaneously, however.<br />
It is clear from Fig. 4.7 and Table 4.2 that there is a flattening in the slope of the observed structure<br />
56
4.5. Two <strong>di</strong>mensional analysis 57<br />
Figure 4.7: (a)-(f): Plots of the RM structure functions for the sub-regions showed in Fig.4.2.<br />
The horizontal bars represent the bin widths and the crosses the centroids for data included in the<br />
bins. The red lines are the pre<strong>di</strong>ctions for the CPL power spectra described in the text, inclu<strong>di</strong>ng<br />
the effects of the convolving beam. The vertical error bars are the rms variations for the structure<br />
functions derived using a CPL power spectrum with the quoted value of q on the observed grid of<br />
points for each sub-region. (g)-(l): as (a)-(f), but using a BPL power spectra with fixed slopes and<br />
break frequency, but variable normalization.<br />
functions on the largest scales (which are sampled primarily by the spurs). In order to fit all of the<br />
data accurately with a single functional form for the power spectrum, I adopt a broken power law<br />
form (BPL) for the RM power spectrum:<br />
Ĉ( f ⊥ ) = 0 f ⊥ < f min<br />
= D 0 f (q l−q h )<br />
b<br />
f −q l<br />
⊥<br />
= D 0 f −q h<br />
⊥<br />
f b ≥ f ⊥<br />
f max ≥ f ⊥ > f b<br />
= 0 f ⊥ > f max . (4.4)<br />
I performed a BPL joint fit in the same way as for the CPL power spectra.<br />
In this case<br />
57
58 4. The magneto-ionic me<strong>di</strong>um around 3C 449<br />
Table 4.2: CPL power spectrum parameters for the six in<strong>di</strong>vidual sub-regions of 3C 449.<br />
Region FWHM CPL<br />
(arcsec ) Best Fit Min Slope Max Slope<br />
q f max q − f max q + f max<br />
N SPUR 5.50 2.53 1.96 1.58 0.23 3.44 ∞<br />
N LOBE 1.25 2.87 1.60 2.31 0.55 3.35 ∞<br />
N JET 1.25 3.15 1.21 2.29 0.30 4.27 ∞<br />
S JET 1.25 2.76 1.95 2.02 0.3 3.69 ∞<br />
S LOBE 1.25 2.71 1.68 2.36 0.65 3.05 ∞<br />
S SPUR 5.50 2.17 1.53 0.20 0.12 3.95 0.12<br />
Lower and upper limits are quoted at∼90% confidence.<br />
Table 4.3: Best-fitting parameters for the joint CPL and BPL fits to all six sub-regions of 3C449.<br />
Best Fit Min Slope Max Slope<br />
q f max χ 2 q − f max q + f max<br />
joint CPL 2.68 1.67 33.5 2.55 1.30 2.81 2.00<br />
Best Fit Min Slope Max Slope<br />
q l f b q h χ 2 q − l<br />
f b q − h<br />
q + l<br />
f b q + l<br />
joint BPL 2.07 0.031 2.97 17.7 1.99 0.044 2.91 2.17 0.021 3.09<br />
Lower and upper limits are quoted at∼90% confidence. The values of q and f max for the joint CPL fit and<br />
q h , q l and f b for the joint BPL fit are the same for all sub-regions, while the normalizations are varied<br />
to minimize the overallχ 2 . In the joint BPL fit, the maximum frequency is fixed at f max = 1.67 arcsec −1 .<br />
the free parameters of the fit are the six normalizations, D 0 , one for each sub-region, the high<br />
and low-frequency slopes, q h and q l , and the break and maximum spatial frequencies f b and<br />
f max . I found best fitting parameters of q l = 2.07, q h =2.98, f b =0.031 arcsec −1 . As noted earlier, I<br />
also fixed f max = 1.67 arcsec −1 to ensure consistency with the observed depolarizations at 1.25-<br />
arcsec resolution. The correspon<strong>di</strong>ng structure functions are plotted in Fig. 4.7(g)–(l) and the<br />
normalizations for the in<strong>di</strong>vidual regions are given in Table 4.4. As for the CPL fits, the errors bars<br />
are derived from the rms scatter of the structure functions of multiple convolved RM realizations.<br />
It is evident from Fig. 4.7 that the structure functions correspon<strong>di</strong>ng to the BPL power<br />
spectrum, which gives less power on large spatial scales, agree much better with the data. The<br />
joint BPL fit has aχ 2 of 17.7, compared with 33.5 for the joint CPL fit (the former has only two<br />
extra parameters), which confirms this result.<br />
I have so far ignored the effects of any outer scale of the magnetic-field fluctuations. This<br />
is justified because the structure functions for the spurs continue to rise at the largest observed<br />
separations, in<strong>di</strong>cating that the outer scale must be> ∼ 10 arcsec (≃30 kpc). The model structure<br />
58
4.6. Three-<strong>di</strong>mensional analysis 59<br />
Table 4.4: Normalizations and expected depolarization for the in<strong>di</strong>vidual CPL, joint CPL and joint<br />
BPL fit parameters at 1.25 arcsec.<br />
Region Observed< k> CPL JOINT CPL JOINT BPL<br />
C 0 f max < k> C 0 < k> D 0 < k><br />
[rad 2 m −4 ] [arcsec −1 ] [rad 2 m −4 ] [rad 2 m −4 ] [rad 2 m −4 )]<br />
N LOBE 61±6 0.96 1.60 63±3 1.52 66±3 1.91 52±4<br />
N JET 106±12 1.34 1.21 106±5 4.76 110±5 0.5 109±5<br />
S JET 91±11 1.50 1.95 70±5 1.94 73±5 1.52 65±4<br />
S LOBE 50±5 1.18 1.68 53±2 1.28 50±2 2.20 45±3<br />
Col.1: region; Col. 2: observed Burn law< k>. Col. 3, 4 and 5: normalization constant C 0 , fitted maximum spatial<br />
frequency f max for the best CPL power spectrum of each region and the pre<strong>di</strong>cted for<br />
each power spectrum. Col. 6, 7 as Col. 3 and 5 but for the joint fit to each CPL power spectrum;<br />
Col. 8 and 9 as Col. 3, and 5 but for the joint BPL power spectrum. For both the joint CPL and BPL fits,<br />
the maximum frequency is fixed at f max = 1.67 arcsec −1 . In calculating each value of< k> only data with p>4σ p are included.<br />
functions fit to the observations assume that the outer scale is infinite and the realizations are<br />
generated on sufficiently large grids in Fourier space that the effects of the implicit outer scale<br />
are negligible over the range of scales here sampled. I used structure-function data for the entire<br />
source to determine an approximate value for the outer scale in Sec. 4.6.3.<br />
I now adopt the BPL power spectrum with these parameters and investigate the spatial<br />
variations of the RM fluctuation amplitude using three-<strong>di</strong>mensional simulations.<br />
4.6 Three-<strong>di</strong>mensional analysis<br />
4.6.1 Models<br />
I used the software packageFARADAY (Murgia et al. 2004) to compare the observed RM with<br />
simulated images derived from three-<strong>di</strong>mensional multi-scale magnetic-field models. Given a<br />
field model and the density <strong>di</strong>stribution of the thermal gas,FARADAY calculates an RM image by<br />
integrating Eq. 3.2 numerically. As in Sec. 4.5, the fluctuations of RM were modeled on the<br />
assumption that the magnetic field responsible for the foreground rotation is an isotropic, Gaussian<br />
random variable and therefore characterized entirely by its power spectrum. Each point in a cube<br />
in Fourier space was first assigned components of the magnetic vector potential. The amplitudes<br />
were selected from a Rayleigh <strong>di</strong>stribution of unit variance, and the phases were random in [0, 2π].<br />
The amplitudes were then multiplied by the square root of the power spectrum of the vector<br />
potential, which is simply related to that of the magnetic field. The correspon<strong>di</strong>ng components<br />
of the magnetic field along the line-of-sight were then calculated and transformed to real space.<br />
This procedure ensured that the magnetic field was <strong>di</strong>vergence-free. The field components in real<br />
59
60 4. The magneto-ionic me<strong>di</strong>um around 3C 449<br />
Table 4.5: Summary of magnetic field power spectrum and density scaling parameters.<br />
BPL power spectrum<br />
q l =2.07<br />
low-frequency slope<br />
q h =2.98<br />
high-frequency slope<br />
f b =0.031 arcsec −1<br />
break frequency (Λ b = 1/ f b =11 kpc)<br />
f max =1.67 arcsec −1<br />
maximum frequency (Λ min = 1/ f max =0.2 kpc)<br />
f min fitted minimum frequency (Λ max = 1/ f min )<br />
Scaling of the magnetic field<br />
B 0 fitted<br />
Average magnetic field at group center<br />
η fitted Magnetic field exponent of the ra<strong>di</strong>al profile:〈B〉(r)= B 1 1860 [ n e (r)<br />
n 0<br />
] η<br />
space were then multiplied by the model density <strong>di</strong>stribution and integrated along the line of sight<br />
to give a synthetic RM image at the full resolution of the simulation, which was then convolved to<br />
the observing resolution.<br />
For 3C 449, I assumed that the source is in a plane perpen<strong>di</strong>cular to the line- of-sight, which<br />
passes through the group center and simulated the field and density structure using a 2048 3 cube<br />
with a real-space pixel size of 0.1 kpc.<br />
I used the best-fitting BPL power spectrum found in<br />
Sec. 4.5.2, but with a spatially-variable normalization, as described below (Sec. 4.6.2), and a lowfrequency<br />
cut-off f min , correspon<strong>di</strong>ng to a maximum scale of the magnetic field fluctuations, 1 Λ max<br />
(= f −1<br />
min ). The power spectrum of Eq. 4.4 was then set to 0 for f
4.6. Three-<strong>di</strong>mensional analysis 61<br />
number of simulations for each combination of field strength and ra<strong>di</strong>al profile and to compare<br />
the pre<strong>di</strong>cted and observed values ofσ RM evaluated over the boxes used in Sec. 4.3.1 (Fig. 4.2). I<br />
usedχ 2 summed over the boxes as a measure of the goodness of fit. This procedure is independent<br />
of the precise value of the outer scale, provided that it is much larger than the averaging boxes. I<br />
express the results in terms ofχ 2 red , which is the value ofχ2 <strong>di</strong>vided by the number of degrees of<br />
freedom.<br />
I initially tried a ra<strong>di</strong>al field-strength variation of the form<br />
〈B 2 (r)〉 1/2 = B 0<br />
[<br />
ne (r)<br />
n 0<br />
] η<br />
(4.5)<br />
as used by Guidetti et al. (2008) and Laing et al. (2008). Here, B 0 is the rms magnetic field strength<br />
at the group center and n e (r) is the thermal electron gas density, assumed to follow theβ-model<br />
profile derived by Croston et al. (2008) (Sec. 4.1). As mentioned in Sec. 3.5, the field scaling<br />
of Eq. 4.5 is consistent with other observations, analytical models and numerical simulations. In<br />
particular,η=2/3 corresponds to flux-freezing andη=1/2 to equipartition between thermal and<br />
magnetic energy.<br />
I produced simulated RM images for each combination of B 0 andηin the ranges 0.5 – 10µG<br />
in steps of 0.1µG and 0 – 2 in steps of 0.01, respectively. I then derived the syntheticσ RM profiles<br />
and, by comparing them with the observed one, calculated the unweightedχ 2 . I repeated this<br />
procedure 35 times at each angular resolution, noting the (B 0 ,η) pair that gave the lowestχ 2 in<br />
each case. These values are plotted in Fig. 4.8. As in earlier work (Murgia et al. 2004; Guidetti<br />
et al. 2008; Laing et al. 2008), I found a degeneracy between the values of B 0 andηin the sense<br />
that the fitted values are positively correlated, but there are clear minima inχ 2 at both resolutions.<br />
I therefore adopted the mean values of B 0 andη, weighted by 1/χ 2 , as the best overall estimates.<br />
These are also plotted in Fig. 4.8 as blue crosses. Although the central magnetic field strengths<br />
derived for the two RM images are consistent at the 1σ level (B 0 =2.8±0.5µG and B 0 = 4.1±1.2µG<br />
at 5.5 and 1.25-arcsec resolution, respectively), the values ofηare not. The best-fitting values are<br />
η=0.0±0.1 at 5.5 arcsec FWHM andη=0.8±0.4 at 1.25 arcsec FWHM.<br />
I next produced 35 RM simulations at each angular resolution by fixing B 0 andηat their<br />
best values for that resolution. The weightedχ 2 ’s for theσ RM profiles were calculated evaluating<br />
the errors for each box by summing in quadrature the rms due to sampling (determined from the<br />
<strong>di</strong>spersion in the realizations) and the fitting-error of the observations. These values are listed in<br />
Table 4.6. The observed and best-fitting model profiles at both angular resolutions are shown in<br />
Fig. 4.9.<br />
A model withη ≃ 0 at all ra<strong>di</strong>i is a priori unlikely: previous work has found values of<br />
61
62 4. The magneto-ionic me<strong>di</strong>um around 3C 449<br />
0.5< ∼ η< ∼ 1 in other sources (Dolag 2006; Guidetti et al. 2008; Laing et al. 2008). The most<br />
likely explanation for the low value ofηinferred from the low-resolution image is that the electron<br />
density <strong>di</strong>stribution is not well represented by aβ-model (which describes a spherical and smooth<br />
<strong>di</strong>stribution) at large ra<strong>di</strong>i. In support of this idea, Fig. 4.1 shows that the morphology of the X-ray<br />
emission is not spherical at large ra<strong>di</strong>i, but quite irregular. Croston et al. (2003, 2008) pointed out<br />
that the quality of the fit of a singleβ-model to the X-ray surface brightness profile was poor in<br />
the outer regions, suggesting small-scale deviations in the gas <strong>di</strong>stribution. The singleβ-model<br />
gave a better fit to the inner region of the X-ray surface brightness profile, where the polarized<br />
emission of 3C 449 can be observed at 1.25-arcsec resolution. The aim is to fit theσ RM profiles<br />
at both resolutions with the same <strong>di</strong>stribution of n e (r)〈B(r) 2 〉 1/2 . In the rest of this subsection I<br />
assume that the density profile n e (r) is still represented by the singleβ-model, even though I have<br />
argued that it might not be appropriate in the outer regions of the hot gas <strong>di</strong>stribution. Although<br />
the resulting estimates of field strength at large ra<strong>di</strong>i may be unreliable, the fit is still necessary<br />
for the calculation of the outer scale described in Sec. 4.6.3, which depends only on the combined<br />
spatial variation of density and field strength.<br />
The best-fitting model at 1.25-arcsec resolution, which is characterized by a more physically<br />
reliableη, gives a very bad fit to the low resolution profile at almost all <strong>di</strong>stances from the core<br />
(Fig. 4.9a). Conversely, the model determined at 5.5-arcsec resolution gives a very poor fit to the<br />
sharp peak inσ RM observed within 20 kpc of the nucleus at 1.25-arcsec resolution, where the ra<strong>di</strong>o<br />
and X-ray data give the strongest constraints (Fig. 4.9b). I also verified that no single interme<strong>di</strong>ate<br />
value ofηgives an adequate fit to theσ RM profiles at all <strong>di</strong>stances from the nucleus.<br />
A better description of the observedσ RM profile is provided by the empirical function<br />
〈B 2 (r)〉 1/2 = B 0<br />
[<br />
ne (r)<br />
n 0<br />
] ηint<br />
r≤r m<br />
= B 0<br />
[<br />
ne (r)<br />
n 0<br />
] ηout<br />
r>r m ,<br />
(4.6)<br />
whereη int ,η out are the inner and outer scaling index of the magnetic field and r m is the break<br />
ra<strong>di</strong>us.<br />
I fixedη int =1.0 andη out =0.0, consistent with the initial results, in order to reproduce both the<br />
inner sharp peak and the outer flat decline of theσ RM observed at the two resolutions, keeping<br />
r m as a free parameter. I made three sets of three-<strong>di</strong>mensional simulations for values of the outer<br />
scaleΛ max = 205, 65 and 20 kpc. Anticipating the result of Sec. 4.6.3, I plotted the results only for<br />
Λ max = 65 kpc, but the derivedσ RM profiles are in any case almost independent of the value of the<br />
outer scale in this range. The new simulations were made only at a resolution of 5.5 arcsec, since<br />
62
4.6. Three-<strong>di</strong>mensional analysis 63<br />
(a)<br />
(b)<br />
Figure 4.8: (a) and (b): Distributions of the best-fitting values of B 0 andηfrom 35 sets of<br />
simulations, each covering ranges of 0.5 – 10µG in B 0 and 0 – 2 inη, at 5.5 and 1.25 arcsec<br />
respectively. The sizes of the circles are proportional toχ 2 for the fit and the blue crosses represent<br />
the means of the <strong>di</strong>stributions weighted by 1/χ 2 . The plot shows the expected degeneracy between<br />
B 0 andη.<br />
(a)<br />
(b)<br />
Figure 4.9: (a): Observed and synthetic ra<strong>di</strong>al profiles for rms Faradayσ RM at 5.5 arcsec as<br />
functions of the projected <strong>di</strong>stance from the ra<strong>di</strong>o source center. The outer scale isΛ max =205 kpc.<br />
The black points represent the data with vertical bars correspon<strong>di</strong>ng to the rms error of the RM fit.<br />
The magenta crosses represent the mean values from 35 simulated profiles and the vertical bars<br />
are the rms scatter in these profiles due to sampling. (b) as (a), but at 1.25 arcsec.<br />
the larger field of view at this resolution is essential to define the change in slope of the profile.<br />
In order to determine the best-fitting break ra<strong>di</strong>us, r m in Eq. 4.6, I produced 35 sets of synthetic<br />
RM images for a grid of values of B 0 and r m for each outer scale, noting the pair of values which<br />
gave the minimum unweightedχ 2 for theσ RM profile for each set of simulations. These values<br />
are plotted in Fig. 4.10, which shows that there is a degeneracy between the break ra<strong>di</strong>us r m and<br />
B 0 . As with the similar degeneracy between B 0 andηnoted earlier, there is a clear minimum in<br />
χ 2 , and I therefore adopted the mean values of B 0 and r m weighted by 1/χ 2 as the best estimates<br />
of the magnetic-field parameters.<br />
63
64 4. The magneto-ionic me<strong>di</strong>um around 3C 449<br />
Table 4.6: Results from the three-<strong>di</strong>mensional fits at both the angular resolutions of 1.25 and<br />
5.5 arcsec.<br />
FWHM Λ max singleη brokenη<br />
(arcsec) (kpc) B 0 (µG) η χ 2 red<br />
B 0 (µG) r m (kpc) χ 2 red<br />
1.25 205 4.1±1.1 0.8±0.4 0.48 - - -<br />
5.50 205 2.8±0.5 0.1±0.1 2.2 3.5±0.7 17±9 1.9<br />
5.50 65 - - - 3.5±1.2 16±11 1.8<br />
5.50 20 - - - 3.5±0.8 11±8 2.1<br />
I then made 35 simulations with the best-fitting values of B 0 andηfor each outer scale<br />
and evaluated the weightedχ 2 ’s for the resultingσ RM profiles. All three values ofΛ max under<br />
investigation give reasonable fits to the observedσ RM profile along the whole ra<strong>di</strong>o source. The fit<br />
forΛ max = 65 kpc is marginally better than for the other two values (χ 2 red<br />
= 1.8), consistent with<br />
the results of Sec. 4.6.3 below. In this case the central magnetic field strength is 3.5±1.2µG and<br />
the break ra<strong>di</strong>us is 16±11 kpc. For the power spectrum withΛ max = 65 kpc and these best-fitting<br />
parameters, I also produced three-<strong>di</strong>mensional simulations at a resolution of 1.25 arcsec. Even<br />
though the fitting procedure is based only on the low-resolution data, this model also reproduces<br />
the 1.25-arcsec profile very well (χ 2 red =0.7). Combining the values ofχ2 for the two resolutions,<br />
using the 1.25-arcsec profile close to the core and the 5.5-profile at larger <strong>di</strong>stances, I findχ 2 red =1.8.<br />
Figure 4.11 shows a comparison of the observed ra<strong>di</strong>al profiles for rms Faradayσ RM and<br />
〈RM〉 with the synthetic ones derived for this model. The syntheticσ RM profile plotted in Fig. 4.11<br />
is the mean over 35 simulations and may be compared <strong>di</strong>rectly with the observations. In contrast,<br />
the〈RM〉 profile is derived from a single example realization. It is important to emphasize that the<br />
latter is one example of a random process, and is not expected to fit the observations; rather, I aim<br />
to compare the fluctuation amplitude as a function of position.<br />
The values of B 0 andχ 2 red for all of the three-<strong>di</strong>mensional simulations, together withηand r m<br />
for the single and double power-law profiles, respectively, are summarized in Table 4.6.<br />
4.6.3 The outer scale of the magnetic-field fluctuations<br />
The theoretical RM structure function for uniform field strength, density and path length and a<br />
power spectrum with a low-frequency cut-off should asymptotically approach a constant value<br />
(2σ 2 RM for a large enough averaging region) at separations > ∼ Λ max . The observed RM structure<br />
function of the whole source is heavily mo<strong>di</strong>fied from this theoretical one by the scaling of the<br />
electron gas density and magnetic field at large separations, which acts to suppress power on large<br />
spatial scales. In Sec. 4.5 I therefore limited the study of the structure function to sub-regions of<br />
3C 449 where uniformity of field strength, density and path length (and therefore of the power-<br />
64
4.6. Three-<strong>di</strong>mensional analysis 65<br />
Figure 4.10: Distribution of the bestfitting<br />
values of B 0 and r m from 35 sets<br />
of simulations, each covering ranges of<br />
0.5 – 10µG in B 0 and 0 – 50 kpc in r m .<br />
The sizes of the circles are proportional<br />
toχ 2 and the blue cross represents the<br />
means of the <strong>di</strong>stribution weighted by<br />
1/χ 2 . The plot shows the degeneracy<br />
between B 0 and r m described in the text.<br />
spectrum amplitude) is a reasonable assumption, inevitably limiting our ability to constrain the<br />
power spectrum on the largest scales.<br />
Now that I have an adequate model for the variation of n e (r)〈B 2 (r)〉 1/2 with ra<strong>di</strong>us (Eq. 4.6), I<br />
can correct for it to derive what I call the pseudo-structure function – that is the structure function<br />
for a power-spectrum amplitude, which is constant over the source. This can be compared <strong>di</strong>rectly<br />
with the structure functions derived from the Hankel transform of the power spectrum. To evaluate<br />
the pseudo-structure function, I <strong>di</strong>vided the observed 5.5-arcsec RM image by the function<br />
[∫ L<br />
1/2<br />
n e (r) 2 B(r) dl] 2 (4.7)<br />
0<br />
(Enßlin & Vogt 2003), where the ra<strong>di</strong>al variations of n e and B are those of the best-fitting model<br />
(Sec. 4.6) and the upper integration limit L has a length of 10 times the core ra<strong>di</strong>us. The integral<br />
was normalized to unity at the position of the ra<strong>di</strong>o core: this is equivalent to fixing the field and<br />
gas density at their maximum values and hol<strong>di</strong>ng them constant everywhere in the group. The<br />
normalization of the pseudo-structure function should then be quite close to that of the two central<br />
jet regions.<br />
The pseudo-structure function is shown in Fig. 4.12(a) together with the pre<strong>di</strong>ctions for the<br />
BPL power spectra withΛ max =205, 65 and 20 kpc. As expected, the normalization of the pseudostructure<br />
function is consistent with that of the jets (Fig. 4.7a and b).<br />
The comparison between the synthetic and observed pseudo-structure functions in<strong>di</strong>cates<br />
firstly that they agree very well at small separations, independent of the value ofΛ max . This<br />
confirms that the best BPL power spectrum found from a combined fit to all six sub-regions<br />
is a very good fit over the entire source. Secondly, despite the poor sampling on very large<br />
scales, the asymptotic values of the pre<strong>di</strong>cted structure functions for the three values ofΛ max<br />
are sufficiently <strong>di</strong>fferent from each other that it is possible to determine an approximate outer<br />
65
66 4. The magneto-ionic me<strong>di</strong>um around 3C 449<br />
(a)<br />
(c)<br />
(b)<br />
(d)<br />
Figure 4.11: Comparison between observed and synthetic profiles of rms and mean Faraday<br />
rotation at resolutions of 5.5 arcsec (a and b) and 1.25 arcsec (c and d). The synthetic profiles<br />
are derived from the best-fitting model withΛ max = 65 kpc. The black points represent the data<br />
with vertical bars correspon<strong>di</strong>ng to the rms fitting error. (a) and (c): Profiles ofσ RM . The magenta<br />
crosses represent the mean values from 35 simulations at 5.5-arcsec resolution, and the vertical<br />
bars are the rms scatter in these profiles due to sampling. (b) and (d): Profiles of〈RM〉 derived<br />
from single example realizations at 5.5 and 1.25-arcsec resolutions.<br />
scale. The model withΛ max =65 kpc gives the best representation of the data. The fit is within<br />
the estimated errors except for a marginal <strong>di</strong>screpancy at the very largest (and therefore poorly<br />
sampled) separations. That withΛ max =20 kpc is inconsistent with the observed pseudo-structure<br />
function for any separation> ∼ 20 arcsec (≃6 kpc) where the sampling is still very good, and is firmly<br />
excluded. The model withΛ max =205 kpc has slightly, but significantly too much power on large<br />
scales.<br />
I emphasize that such estimate of the outer scale of the RM fluctuations is essentially<br />
independent of the functional form assumed for the variation of field strength with ra<strong>di</strong>us in the<br />
central region, which affects the structure function only for small separations. The results are<br />
almost identical if I fit the field-strength variation with either the profile of Eq. 4.5 (withη≈0) or<br />
that of Eq. 4.6.<br />
As for the structure functions of in<strong>di</strong>vidual regions, the pseudo-structure function at large<br />
66
4.7. Summary and comparison with other sources 67<br />
separations is clearly affected by poor sampling: this increases the errors, but does not produce<br />
any bias in the derived values. At large ra<strong>di</strong>i, however, the integral in Eq. 4.7 becomes small, so<br />
the noise on the RM image is amplified. This is a potential source of error, and I therefore checked<br />
the results using numerical simulations. I calculated the mean and rms structure functions for sets<br />
of realizations of RM images generated with theFARADAY code for <strong>di</strong>fferent values ofΛ max . These<br />
structure functions are plotted in Figs. 4.12(b) and (c).<br />
The main <strong>di</strong>fference between the model structure functions derived from simulations and the<br />
pseudo-structure functions described earlier is that the former show a steep decline in power on<br />
large scales in place of a plateau. This occurs because the smooth fall-off in density and magnetic<br />
field strength with <strong>di</strong>stance from the nucleus suppresses the fluctuations in RM on large scales.<br />
The results of the simulations confirm the analysis using the pseudo-structure function. The<br />
mean model structure function withΛ max = 65 kpc again fits the data very well, except for a<br />
marginal <strong>di</strong>screpancy at the largest scales. In view of the deviations from spherical symmetry on<br />
large scales evident in the X-ray emission surroun<strong>di</strong>ng 3C 449 (Fig. 4.1), I do not regard this as a<br />
significant effect.<br />
In order to check that the best-fitting density and field model also reproduces the data at<br />
small separations, I repeated the analysis at 1.25-arcsec resolution. The observed pseudo-structure<br />
function is shown in Fig. 4.12(d), together with the the pre<strong>di</strong>ctions for the BPL power spectrum<br />
withΛ max = 205, 65 and 20 kpc. The observed structure function is compared with the mean from<br />
35 simulations withΛ max = 65 kpc in Fig. 4.12(e). In both cases, the agreement forΛ max = 65 kpc<br />
is excellent.<br />
In Fig. 4.13, example realizations of this model with the best-fitting field variation are shown<br />
for resolutions of 1.25 and 5.5 arcsec alongside the observed RM images.<br />
4.7 Summary and comparison with other sources<br />
4.7.1 Summary<br />
In this work I have stu<strong>di</strong>ed the structure of the magnetic field associated with the ionized me<strong>di</strong>um<br />
around the ra<strong>di</strong>o galaxy 3C 449. I have analysed images of linearly polarized emission with<br />
resolutions of 1.25 arcsec and 5.5 arcsec FHWM at seven frequencies between 1.365 and 8.385<br />
GHz, and produced images of degree of polarization and rotation measure. The RM images at<br />
both the angular resolutions show patchy and random structures. In order to study the spatial<br />
statistics of the magnetic field, I used a structure-function analysis and performed two- and three<strong>di</strong>mensional<br />
RM simulations. I can summarize the results as follows.<br />
67
68 4. The magneto-ionic me<strong>di</strong>um around 3C 449<br />
(a)<br />
(b)<br />
(c)<br />
(d)<br />
(e)<br />
Figure 4.12: (a): Comparison of the observed pseudo-structure function of the 5.5-arcsec RM<br />
image as described in the text (points) with the pre<strong>di</strong>ctions of the BPL model (curves, derived<br />
using a Hankel transform). The pre<strong>di</strong>cted curves are forΛ max =205 (blue dotted), 65 (continuous<br />
magenta) and 20 kpc (green dashed). (b) and (c): structure functions of the observed (points)<br />
and synthetic 5.5-arcsec RM images produced with theΛ max =205,20 kpc andΛ max =65 kpc,<br />
respectively. (d) and (e) as (a) and (c) respectively, but at 1.25-arcsec resolution. The error bars<br />
are the rms from 35 structure functions at a givenΛ max , in (a) and (d) are representative error bars<br />
from the model withΛ max =65 kpc.<br />
68
4.7. Summary and comparison with other sources 69<br />
1. The absence of deviations fromλ 2 rotation over a wide range of polarization position angle<br />
implies that a pure foreground Faraday screen with no mixing of ra<strong>di</strong>o-emitting and thermal<br />
electrons is a good approximation for 3C 449 (Sec. 4.3).<br />
2. The best estimate for the Galactic contribution to the RM of 3C 449 is a constant value of<br />
−160.7 rad m −2 (Sec. 4.3.2).<br />
3. The dependence of the degree of polarization on wavelength is well fitted by a Burn<br />
law. This is also consistent with pure foreground rotation, with the residual depolarization<br />
observed at the higher resolution being due to unresolved RM fluctuations across the beam<br />
(Sec. 4.4). There is no evidence for a detailed correlation of ra<strong>di</strong>o-source structure with<br />
either RM or depolarization.<br />
4. There is no obvious anisotropy in the RM <strong>di</strong>stribution, consistent with the assumption that<br />
the magnetic field is an isotropic, Gaussian random variable.<br />
5. The RM structure functions for six <strong>di</strong>fferent regions of the source are consistent with the<br />
hypothesis that only the amplitude of the RM power spectrum varies across the source.<br />
6. A broken power-law spectrum of the form given in Eq. 4.4 with q l = 2.07, q h =2.98,<br />
f b =0.031 arcsec −1 and f max = 1.67 arcsec −1 (correspon<strong>di</strong>ng to a spatial scaleΛ min =0.2 kpc)<br />
is consistent with the observed structure functions and depolarizations for all six regions.<br />
No single power law provides a good fit to all of the structure functions.<br />
7. The high-frequency cut-off in the power spectrum is required to model the depolarization<br />
data.<br />
8. The profiles ofσ RM strongly suggest that most of the fluctuating component of RM is<br />
associated with the intra-group gas, whose core ra<strong>di</strong>us is comparable with the characteristic<br />
scale of the profile (Sec. 4.3.1). The symmetry of the profile is consistent with the idea that<br />
the ra<strong>di</strong>o source axis is close to the plane of the sky.<br />
9. I therefore simulated the RM <strong>di</strong>stributions expected for an isotropic, random magnetic field<br />
in the hot plasma surroun<strong>di</strong>ng 3C 449, assuming the density model derived by Croston et al.<br />
(2008).<br />
10. These three-<strong>di</strong>mensional simulations show that the dependence of magnetic field on density<br />
is best modeled by a broken power-law function with B(r)∝n e (r) close to the nucleus and<br />
B(r)≈ constant at larger <strong>di</strong>stances.<br />
11. With this density model, the best estimate of the central magnetic field strength is B 0 =<br />
3.5±1.2µG.<br />
69
70 4. The magneto-ionic me<strong>di</strong>um around 3C 449<br />
12. Assuming these variations of density and field strength with ra<strong>di</strong>us, a structure-function<br />
analysis can be used to estimate the outer scaleΛ max of the magnetic-field fluctuations. I<br />
find excellent agreement forΛ max ≈ 65 kpc ( f min = 0.0053 arcsec −1 ).<br />
4.7.2 Comparison with other sources<br />
These results are qualitatively similar to those of Laing et al. (2008) on 3C 31. The maximum RM<br />
fluctuation amplitudes are similar in the two sources, as are their environments. For sphericallysymmetric<br />
gas density models, the central magnetic fields are almost the same: B 0 ≈ 2.8µG for<br />
3C 31 and 3.5µG for 3C 449. Both results are consistent with the idea that the RM fluctuation<br />
amplitude in galaxy groups and clusters scales roughly linearly with density, ranging from a<br />
few rad m −2 in the much sparsest environments (e.g. NGC 315; Laing et al. 2006a), through<br />
interme<strong>di</strong>ate values≈30 – 100 rad m −2 in rich groups such as 3C 31 and 3C 449 to∼ 10 4 rad m −2<br />
in the centers of clusters with cool cores.<br />
The RM <strong>di</strong>stribution of 3C 31 is asymmetrical, the northern (approaching) side of the source<br />
showing a much lower fluctuation amplitude, consistent with the inclination of≈ 50 ◦ estimated by<br />
Laing & Bridle (2002a). Detailed modeling of the RM profile led Laing et al. (2008) to suggest that<br />
there is a cavity in the X-ray gas, but this would have to be significantly larger than the observed<br />
extent of the ra<strong>di</strong>o lobes and is, as yet, undetected in X-ray observations. A broken power-law<br />
scaling of magnetic field with density, similar to that found for 3C 449 in the present work, would<br />
also improve the fit to theσ RM profile for 3C 31; alternatively, the effects of cavities around the<br />
inner lobes and spurs of 3C 449 might be significant. Deeper X-ray observations of both sources<br />
are needed to resolve this issue. In neither case is the magnetic field dynamically important: for<br />
3C 449 the ratio of the thermal and magnetic-field pressures is≈30 at the nucleus and≈400 at<br />
the core ra<strong>di</strong>us of the group gas, r c = 19 kpc. The magnetic field is therefore not dynamically<br />
important, as in 3C 31.<br />
The magnetic-field power spectrum in both sources can be fit by a broken power-law form.<br />
The low-frequency slopes are 2.1 and 2.3 for 3C 449 and 3C 31 respectively. In both cases, the<br />
power spectrum steepens at higher spatial frequencies, but for 3C 31 a Kolmogorov index (11/3)<br />
provides a good fit, whereas I find that the depolarization data for 3C 449 require a cut-off below<br />
a scale of 0.2 kpc and a high-frequency slope of 3.0. The break scales are≈5 kpc for 3C 31<br />
and≈11 kpc for 3C 449. It is important to note that the simple parametrized form of the power<br />
spectrum is not unique, and that a smoothly curved function would fit the data equally well.<br />
The gas-density structure on large scales in the 3C 31 group is uncertain, so Laing et al. (2008)<br />
could only give a rough lower limit to the outer scale of magnetic-field fluctuations,Λ max<br />
> ∼ 70 kpc.<br />
For 3C 449, we findΛ max ≈ 65 kpc. The projected <strong>di</strong>stance between 3C 449 and its nearest<br />
70
4.7. Summary and comparison with other sources 71<br />
neighbour is≈33 kpc (Birkinshaw et al. 1981), similar to the scale on which the jets first bend<br />
through large angles (Fig. 4.1). As in 3C 31, it is plausible that the outer scale of magnetic-field<br />
fluctuations is set by interactions with companion galaxies in the group.<br />
71
72 4. The magneto-ionic me<strong>di</strong>um around 3C 449<br />
IMAGE: RM_1.25_2000_SUBIM.FITS<br />
IMAGE: SUBIM_1.25.FITS<br />
;200 ;150 ;100<br />
RAD/M/M<br />
;200 ;150 ;100<br />
RAD/M/M<br />
Obs<br />
Syn<br />
IMAGE: RM_5.5_2000_SUBIM.FITS<br />
IMAGE: SUBIM_5.5.FITS<br />
;200 ;150 ;100<br />
RAD/M/M<br />
;200 ;150 ;100<br />
RAD/M/M<br />
Obs<br />
Syn<br />
Figure 4.13: Comparison of observed and representative synthetic <strong>di</strong>stribution of Faraday RM at<br />
1.25 arcsec and 5.5 arcsec. The synthetic images have been produced for the best-fitting model<br />
withΛ max =65 kpc. The colour scale is the same for all <strong>di</strong>splays.<br />
72
Chapter 5<br />
Ordered magnetic fields around ra<strong>di</strong>o<br />
galaxies: evidence for interaction with<br />
the environment †<br />
M<br />
ost of the RM images of ra<strong>di</strong>o galaxies published so far show patchy structures with no<br />
clear preferred <strong>di</strong>rection, consistent with isotropic foreground fluctuations over a range<br />
of linear scales ranging from tens of kpc to< ∼ 100 pc (e.g. 3C 449, Chapter 4; see also Govoni et<br />
al. 2006; Guidetti et al. 2008; Laing et al. 2008; Kuchar & Enßlin 2009; Bonafede et al. 2010),<br />
Numerical modelling has demonstrated that this type of complex RM structure can be accurately<br />
reproduced if the magnetic field is randomly variable with fluctuations on a wide range of spatial<br />
scales, and is spread throughout the whole group or cluster environment (Chapter 4; see also<br />
Murgia et al. 2004; Govoni et al. 2006; Guidetti et al. 2008; Laing et al. 2008; Bonafede et al.<br />
2010). These authors used forward modelling, together with estimators of the spatial statistics of<br />
the RM <strong>di</strong>stributions (structure and autocorrelation functions or a multi-scale statistic) to estimate<br />
the field strength, its relation to the gas density and its power spectrum. The technique of Bayesian<br />
maximum likelihood has also been used for this purpose (Enßlin & Vogt 2005; Kuchar & Enßlin<br />
2009).<br />
In order to derive the three-<strong>di</strong>mensional magnetic field power spectrum, all of these authors<br />
had to assume statistical isotropy for the field, since only the component of the magnetic field<br />
along the line-of-sight contributes to the observed RM. This assumption is consistent with the<br />
absence of a preferred <strong>di</strong>rection in most of the RM images.<br />
In contrast, the present Chapter reports on anisotropic RM structures, observed in lobed ra<strong>di</strong>o<br />
galaxies located in <strong>di</strong>fferent environments, ranging from a small group to one of the richest clusters<br />
† Guidetti et al. 2011, MNRAS, in press<br />
73
74 5. Ordered magnetic fields around ra<strong>di</strong>o galaxies<br />
of galaxies. The RM images of ra<strong>di</strong>o galaxies presented in this Chapter show clearly anisotropic<br />
“banded” patterns over part or all of their areas. In some sources, these banded patterns coexist<br />
with regions of isotropic random variations. The magnetic field responsible for these RM patterns<br />
must, therefore, have a preferred <strong>di</strong>rection.<br />
One source whose RM structure is dominated by bands is already known: M 84 (Laing &<br />
Bridle 1987). In ad<strong>di</strong>tion, there is some evidence for RM bands in sources which also show strong<br />
irregular fluctuations, such as Cygnus A (Carilli & Taylor 2002). It is possible, however, that some<br />
of the claimed bands could be due to imperfect sampling of an isotropic RM <strong>di</strong>stribution with<br />
large-scale power, and I return to this question in Section 5.8.1.<br />
In this Chapter I present new RM images of three sources which show spectacular banded<br />
structures, together with improved data for M 84. The environments of all four sources are<br />
well characterized by modern X-ray observations, and I give the first comprehensive description<br />
of the banded RM phenomenon. I present an initial attempt to interpret the phenomenon as a<br />
consequence of source-environment interactions and to understand the <strong>di</strong>fference between it and<br />
the more usual irregular RM structure.<br />
The RM images reported are derived from new or previously unpublished archive Very Large<br />
Array data for the nearby ra<strong>di</strong>o galaxies 0206+35, M 84 (Laing et al. in preparation), 3C 270<br />
(Laing, Guidetti & Bridle in preparation) and 3C 353 (Swain, private communication; see Swain<br />
1996).<br />
5.1 The Sample<br />
High quality ra<strong>di</strong>o and X-ray data are available for all of the sources. In this Section I summarize<br />
those of their observational properties which are relevant to this RM study. A list of the sources and<br />
their general parameters is given in Table 5.1, while Table 5.2 shows the X-ray parameters taken<br />
from the literature and equipartition parameters derived from ra<strong>di</strong>o observations in this work.<br />
The sources were observed with the VLA at several frequencies, in full polarization mode and<br />
with multiple configurations so that the ra<strong>di</strong>o structure is well sampled. The VLA observations,<br />
data reduction and detailed descriptions of the ra<strong>di</strong>o structures are given for 0206+35 and M 84<br />
by Laing, Guidetti et al. (in preparation), for 3C 270 by Laing, Guidetti & Bridle (in preparation),<br />
and for 3C 353 by Swain (1996). All of the ra<strong>di</strong>o maps show a core, two sided jets and a doublelobed<br />
structure with sharp brightness gra<strong>di</strong>ents at the lea<strong>di</strong>ng edges of both lobes. The synchrotron<br />
minimum pressures are all significantly lower than the thermal pressures of the external me<strong>di</strong>um<br />
(Table 5.2).<br />
All of the sources have been observed in the soft X-ray band by more than one satellite,<br />
74
5.1. The Sample 75<br />
35 49 00<br />
ROSAT PSPC<br />
12 38 00<br />
Chandra<br />
35 48 30<br />
DECLINATION (J2000)<br />
35 48 00<br />
35 47 30<br />
DECLINATION (J2000)<br />
12 37 00<br />
12 36 00<br />
35 47 00<br />
(a)<br />
12 35 00<br />
(b)<br />
02 09 44<br />
02 09 40 02 09 36<br />
RIGHT ASCENSION (J2000)<br />
02 09 32<br />
12 27 45<br />
12 27 40 12 27 35<br />
RIGHT ASCENSION (J2000)<br />
12 27 30<br />
05 52 00<br />
XMM−Newton<br />
;00 56 00<br />
XMM−Newton<br />
DECLINATION (J2000)<br />
05 50 00<br />
05 48 00<br />
DECLINATION (J2000)<br />
;00 57 00<br />
;00 58 00<br />
;00 59 00<br />
05 46 00<br />
12 19 40<br />
12 19 30 12 19 20<br />
RIGHT ASCENSION (J2000)<br />
12 19 10<br />
(c)<br />
;01 00 00<br />
;01 01 00<br />
17 20 40<br />
17 20 30<br />
RIGHT ASCENSION (J2000)<br />
17 20 20<br />
(d)<br />
Figure 5.1: X-ray images overlaid with ra<strong>di</strong>o contours for all sources: (a) 0206+35: 1385.1 MHz<br />
VLA ra<strong>di</strong>o map with 1.2 arcsec FWHM; the contours are spaced by factor of 2 between 0.06 and<br />
15 mJy beam −1 . The ROSAT PSPC image (Worrall & Birkinshaw 2000), is smoothed with a<br />
Gaussian ofσ=30 arcsec. (b) M 84: 1413.0 MHz VLA ra<strong>di</strong>o map with 4.5 arcsec FWHM; the<br />
contours are spaced by factor of 2 between 1 and 128 mJy beam −1 . The Chandra (Finoguenov<br />
& Jones 2001) image is a wavelet reconstruction on angular scales from 4 up to 32 arcsec. (c)<br />
3C 270: 1365.0 MHz VLA ra<strong>di</strong>o map with 5.0 arcsec FWHM; the contours are spaced by factor of<br />
2 between 0.45 and 58 mJy beam −1 . The XMM-Newton image (Croston, Hardcastle & Birkinshaw<br />
2005) is smoothed with a Gaussian ofσ=26 arcsec. (d) 3C 353: 1385.0 MHz VLA ra<strong>di</strong>o map<br />
with 1.3 arcsec FWHM; the contours are spaced by factor of 2 between 0.35 and 22 mJy beam −1 .<br />
The XMM-Newton image (Goodger et al. 2008) is smoothed with a Gaussian ofσ=30 arcsec.<br />
The Chandra image of 3C 270 is <strong>di</strong>splayed in logarithmic scale.<br />
75
76 5. Ordered magnetic fields around ra<strong>di</strong>o galaxies<br />
Table 5.1: General optical and ra<strong>di</strong>o properties: Col. 1: source name; Cols. 2&3: position; Col.<br />
4: redshift; Col. 5: conversion from angular to spatial scale with the adopted cosmology; Col. 6:<br />
Fanaroff-Riley class; Col. 7: the largest angular size of the ra<strong>di</strong>o source; Col. 8: ra<strong>di</strong>o power at<br />
1.4 GHz; Col. 9: angle to the line of sight of the jet axis; Col. 10: environment of the galaxy; Col.<br />
11: reference.<br />
source RA DEC z kpc/arcsec FR class LAS log P 1.4 θ env. ref.<br />
[J2000] [J2000] [arcsec] [W Hz −1 ] [degree]<br />
0206+35 02 09 38.6+35 47 50 0.0377 0.739 I 90 24.8 40 group 1<br />
3C 353 17 20 29.1 -00 58 47 0.0304 0.601 II 186 26.3 90 poor cluster 2<br />
3C 270 12 19 23.2+05 49 31 0.0075 0.151 I 580 24.4 90 group 3<br />
M 84 12 25 03.7+12 53 13 0.0036 0.072 I 150 23.2 60 rich cluster 3<br />
References for the environmental classification: (1) Miller et al. (2002); (2) de Vaucouleurs et al. (1991); (3) Trager et al. (2000).<br />
Table 5.2: X-ray and ra<strong>di</strong>o equipartition parameters for all the sources. Col. 1: source name; Col.<br />
2: X-ray energy band; Col. 3: average thermal temperature; Cols. 4,5,6 and 7,8,9 best-fitting core<br />
ra<strong>di</strong>i, central densities andβparameters for the outer and innerβmodels, respectively; Col. 10:<br />
average thermal pressure at the midpoint of the ra<strong>di</strong>o lobes; Cols. 11&12: minimum synchrotron<br />
pressure and correspon<strong>di</strong>ng magnetic field; Col.13: references for the X-ray models.<br />
source band kT r cxout n 0out β out r cxin n 0in β in P 0 P min B Pmin ref.<br />
[keV] [keV] [kpc] [cm −3 ] [kpc] [cm −3 ] [dyne cm −2 ] [dyne cm −2 ] µG<br />
0206+35 0.2-2.5 1.30 +1.30<br />
−0.30 22.2 2.4×10⁻³ 0.35 0.85 0.42 0.70 9.6×10 −12 4.31× 10 −13 5.70 1, 2<br />
3C 353 ” 4.33 +0.25<br />
−0.24<br />
1.66× 10 −12 11.2 3<br />
3C 270 0.3-7.0 1.45 +0.23<br />
−0.01 36.8 7.7×10⁻³ 0.30 1.1 0.34 0.64 5.75× 10 −12 1.64× 10 −13 3.71 4<br />
M 84 0.6-7.0 0.60 +0.05<br />
−0.05<br />
5.28±0.08 0.42 1.40±0.03 1.70× 10 −11 1.07× 10 −12 9.00 5<br />
References: (1) Worrall & Birkinshaw (2000); (2)Worrall, Birkinshaw & Hardcastle (2001); (3) Iwasawa et al. (2000); (4) Croston et al. (2008);<br />
(5) Finoguenov & Jones (2001).<br />
allowing the detection of multiple components on cluster/group and sub-galactic scales. The X-<br />
ray morphologies are characterized by a compact source surrounded by extended emission with<br />
low surface brightness. The former includes a non-thermal contribution, from the core and the<br />
inner regions of the ra<strong>di</strong>o jets and, in the case of 0206+35 and 3C 270, a thermal component<br />
which is well fitted by a small core ra<strong>di</strong>usβmodel. The latter component is associated with the<br />
<strong>di</strong>ffuse intra-group or intra-cluster me<strong>di</strong>um. Parameters for all of the thermal components, derived<br />
from X-ray observations, are listed in Table 5.2. Because of the irregular morphology of the hot<br />
gas surroun<strong>di</strong>ng 3C 353 and M 84, it has not been possible to fitβmodels to their X-ray ra<strong>di</strong>al<br />
surface brightness profiles.<br />
76
5.1. The Sample 77<br />
5.1.1 0206+35<br />
0206+35 is an extended Fanaroff-Riley Class I (FR I; Fanaroff & Riley 1974) ra<strong>di</strong>o source whose<br />
optical counterpart, UGC 1651, is a D-galaxy, a member of a dumb-bell system at the centre of<br />
a group of galaxies. At a resolution of 1.2 arcsec the ra<strong>di</strong>o emission shows a core, with smooth<br />
two-sided jets aligned in the NW-SE <strong>di</strong>rection and surrounded by a <strong>di</strong>ffuse and symmetric halo.<br />
Laing & Bridle (in preparation) have estimated that the jets are inclined by≈40 ◦ with respect to<br />
the line of sight, with the main (approaching) jet in the NW <strong>di</strong>rection.<br />
0206+35 has been observed with both the ROSAT PSPC and HRI instruments (Worrall &<br />
Birkinshaw 1994, 2000; Trussoni et al. 1997) and with Chandra (Worrall, Birkinshaw & Hardcastle<br />
2001). The X-ray emission consists of a compact source surrounded by a galactic atmosphere<br />
which merges into the much more extended intra-group gas. The ra<strong>di</strong>us of the extended halo<br />
observed by the ROSAT PSPC is≈2.5 arcmin (Fig. 5.1a). The ROSAT and Chandra X-ray surface<br />
brightness profiles are well fit by the combination ofβmodels with two <strong>di</strong>fferent core ra<strong>di</strong>i and a<br />
power-law component (Hardcastle, private communication; Table 5.2).<br />
5.1.2 3C 270<br />
3C 270 is a ra<strong>di</strong>o source classified as FR I in most of the literature, although in fact, the two lobes<br />
have <strong>di</strong>fferent FR classifications at low resolution (Laing, Guidetti & Bridle in preparation). The<br />
optical counterpart is the giant elliptical galaxy NGC 4261, located at the centre of a nearby group.<br />
The ra<strong>di</strong>o source has a symmetrical structure with a bright core and twin jets, exten<strong>di</strong>ng E-W and<br />
completely surrounded by lobes. The low jet/counter-jet ratio in<strong>di</strong>cates that the jets are close to<br />
the plane of the sky, with the Western side approaching (Laing, Guidetti & Bridle in preparation).<br />
The XMM-Newton image (Fig. 5.1c) shows a <strong>di</strong>sturbed <strong>di</strong>stribution with regions of low<br />
surface-brightness (cavities) at the positions of both ra<strong>di</strong>o lobes. A recent Chandra observation<br />
(Worrall et al. 2010) shows “wedges” of low X-ray surface brightness surroun<strong>di</strong>ng the inner jets<br />
(see also Croston, Hardcastle & Birkinshaw 2005, Finoguenov et al. 2006, Jetha et al. 2007,<br />
Croston et al. 2008). The overall surface brightness profile is accurately reproduced by a point<br />
source convolved with the Chandra point spread function plus a doubleβmodel (Croston et al.<br />
2008, projb model). Croston et al. 2008 found no evidence for a temperature gra<strong>di</strong>ent in the hot<br />
gas. The group is characterized by high temperature and low luminosity (Finoguenov et al. 2006),<br />
which taken together provide a very high level of entropy. This might be a further sign of a large<br />
degree of impact of the AGN on the environment.<br />
77
78 5. Ordered magnetic fields around ra<strong>di</strong>o galaxies<br />
5.1.3 3C 353<br />
3C 353 is an extended FR II ra<strong>di</strong>o source identified with a D-galaxy embedded at the periphery<br />
of a cluster of galaxies. The best estimate for the inclination of the jets is≈90 ◦ (Swain, Bridle &<br />
Baum 1998). The eastern jet is slightly brighter and ends in a well-defined hot spot. The ra<strong>di</strong>o<br />
lobes have markedly <strong>di</strong>fferent morphologies: the eastern lobe is round with sharp edges, while the<br />
western lobe is elongated with an irregular shape. The location of the source within the cluster is of<br />
particular interest for this work and might account for the <strong>di</strong>fferent shapes of the lobes. Fig. 5.1(d)<br />
shows the XMM-Newton image overlaid on the ra<strong>di</strong>o contours. The image shows only the NW<br />
part of the cluster, but it is clear that the ra<strong>di</strong>o source lies on the edge of the X-ray emitting<br />
gas <strong>di</strong>stribution. so that the round eastern lobe is encountering a higher external density and is<br />
probably also behind a larger column of Faraday-rotating material (Iwasawa et al. 2000, Goodger<br />
et al. 2008). In particular, the image published by Goodger et al. (2008) shows that the gas density<br />
gra<strong>di</strong>ent persists on larger scales.<br />
5.1.4 M 84<br />
M 84 is a giant elliptical galaxy located in the Virgo Cluster at about 400 kpc from the core. Optical<br />
emission-line imaging shows a <strong>di</strong>sk of ionized gas around the nucleus, with a maximum detected<br />
extent of 20×7 arcsec 2 (Hansen, Norgaard-Nielsen & Jorgensen 1985; Baum et al. 1988; Bower et<br />
al. 1997, 2000). The ra<strong>di</strong>o emission of M 84 (3C 272.1) has an angular extension of about 3 arcmin<br />
(≃ 11 kpc) and shows an unresolved core in the nucleus of the galaxy, two resolved jets and a pair<br />
of wide lobes (Laing & Bridle 1987; Laing et al. in preparation). The inclination to the line-ofsight<br />
of the inner jet axis is∼60 ◦ , with the northern jet approaching, but there is a noticeable<br />
bend in the counter-jet very close to the nucleus, which complicates modelling (Laing & Bridle<br />
in preparation). After this bend, the jets remain straight for≈40 arcsec, then both of them bend<br />
eastwards by∼90 ◦ and fade into the ra<strong>di</strong>o emission of the lobes.<br />
The morphology of the X-ray emission has a H-shape made up of shells of compressed gas<br />
surroun<strong>di</strong>ng cavities coincident with both the ra<strong>di</strong>o lobes (Finoguenov et al. 2008; Finoguenov et<br />
al. 2006; Finoguenov & Jones 2001). This shape, together with the fact that the initial ben<strong>di</strong>ng of<br />
the ra<strong>di</strong>o jets has the same <strong>di</strong>rection and is quite symmetrical, suggests a combination of interaction<br />
with the ra<strong>di</strong>o plasma and motion of the galaxy within the cluster (Finoguenov & Jones 2001).<br />
The ratio between the X-ray surface brightness of the shells of the compressed gas and their<br />
surroun<strong>di</strong>ngs is≈3 and is almost constant around the source. The shells are regions of enhanced<br />
pressure and density and low entropy: the amplitude of the density enhancements (a factor of≈3)<br />
suggests that they are produced by weak shock waves (Mach numberM∼1.3) driven by the<br />
78
5.2. Analysis of RM and depolarization images 79<br />
expan<strong>di</strong>ng lobes (Finoguenov et al. 2006).<br />
5.2 Analysis of RM and depolarization images<br />
The observational analysis is based on the following procedure. I first produced RM and Burn<br />
law k images at two <strong>di</strong>fferent angular resolutions for each source and searched for regions with<br />
high k or correlated RM and k values, which could in<strong>di</strong>cate the presence of internal Faraday<br />
rotation and/or strong RM gra<strong>di</strong>ents across the beam (Secs. 3.2 and 3.3). In regions with low k<br />
where the variations of RM are plausibly isotropic and random, I then used the structure function<br />
(defined in Eq. 3.13) to derive the power spectrum of the RM fluctuations. Finally, to investigate<br />
the depolarization in the areas of isotropic RM, and hence the magnetic field power on small scales,<br />
I made numerical simulations of the Burn law k using the model power spectrum with <strong>di</strong>fferent<br />
minimum scales and compared the results with the data.<br />
I assumed RM power spectra of the form:<br />
Ĉ( f ⊥ ) = C 0 f −q<br />
⊥ f ⊥ ≤ f max<br />
= 0 f ⊥ > f max (5.1)<br />
where f ⊥ is a scalar spatial frequency and fit the observed structure function (inclu<strong>di</strong>ng the effect<br />
of the observing beam) using the Hankel-transform method described by Laing et al. (2008) to<br />
derive the amplitude, C 0 and the slope, q. To constrain the RM structure on scales smaller than the<br />
beamwidth, I estimated the minimum scale of the best fitted field power spectrum,Λ min = 1/ f max ,<br />
which pre<strong>di</strong>cts a mean value of k consistent with the observed one.<br />
In this work, I am primarily interested in estimating the RM power spectrum over limited<br />
areas, and I made no attempt to determine the outer scale of fluctuations.<br />
5.3 Rotation measure images<br />
The RM images and associated rms errors were produced by weighted least-squares fitting to<br />
the observed polarization anglesΨ(λ) as a function ofλ 2 (Eq. 3.1) at three or four frequencies<br />
(Table 5.3, see also the Appen<strong>di</strong>x) using theRM task in theAIPS package.<br />
Each RM map was calculated only at pixels with rms polarization-angle uncertainties
80 5. Ordered magnetic fields around ra<strong>di</strong>o galaxies<br />
IMAGE: 02_RM_L_C_BLANK.FITS<br />
0206+35<br />
IMAGE: BLANK.FITS<br />
M 84<br />
;140 ;120 ;100 ;80 ;60 ;40 ;20<br />
RAD/M/M −2<br />
rad m<br />
;20 0 20<br />
RAD/M/M rad m −2<br />
36 02 40<br />
10 kpc<br />
1.2 arcsec 4.5 arcsec<br />
1 kpc<br />
36 02 20<br />
12 54 00<br />
DECLINATION (J2000)<br />
36 02 00<br />
36 01 40<br />
DECLINATION (J2000)<br />
12 53 00<br />
36 01 20<br />
12 52 00<br />
(a)<br />
02 12 42<br />
02 12 40 02 12 38<br />
RIGHT ASCENSION (J2000)<br />
02 12 36<br />
(b)<br />
12 25 08 12 25 04<br />
RIGHT ASCENSION (J2000)<br />
12 25 00<br />
IMAGE: 3C270.RM.5.0_BLANKED.FITS<br />
IMAGE: 3C353_RM_1.3_BLANK_BLANK_2000.FITS<br />
3C 270 3C 353<br />
05 52 00<br />
;20 0 20 40<br />
RAD/M/M −2<br />
rad m<br />
10 kpc<br />
;50 0 50 100 150<br />
RAD/M/M −2<br />
rad m<br />
;00 57 00<br />
5 arcsec 1.3 arcsec<br />
10 kpc<br />
DECLINATION (J2000)<br />
05 51 00<br />
05 50 00<br />
05 49 00<br />
DECLINATION (J2000)<br />
;00 58 00<br />
;00 59 00<br />
05 48 00<br />
(c)<br />
12 19 40<br />
12 19 30 12 19 20<br />
RIGHT ASCENSION (J2000)<br />
12 19 10<br />
;01 00 00<br />
(d)<br />
17 20 35<br />
17 20 30 17 20 25<br />
RIGHT ASCENSION (J2000)<br />
17 20 20<br />
Figure 5.2: RM images for all sources: (a) 0206+35; (b) M 84; (c) 3C 270; (d) 3C 353. The<br />
angular resolution and the linear scale of each map are shown in the in<strong>di</strong>vidual panels.<br />
80
5.3. Rotation measure images 81<br />
IMAGE: K;BURN_4p_BLANK.FITS<br />
0206+35<br />
IMAGE: K;BURN_3p_4.5_BLANKED.FITS<br />
M 84<br />
DECLINATION (J2000)<br />
35 48 40<br />
35 48 20<br />
35 48 00<br />
35 47 40<br />
0 100 200 300 400 500 600<br />
0 100 200 300 400 500 600<br />
rad^2/m^4<br />
rad^2/m^4<br />
2<br />
m−4<br />
rad<br />
2<br />
m−4<br />
0.92 0.82<br />
DECLINATION (J2000)<br />
12 54 00<br />
12 53 30<br />
12 53 00<br />
12 52 30<br />
35 47 20<br />
(a)<br />
12 52 00<br />
(b)<br />
02 09 42<br />
02 09 40 02 09 38 02 09 36<br />
RIGHT ASCENSION (J2000)<br />
12 25 09<br />
12 25 06 12 25 03<br />
RIGHT ASCENSION (J2000)<br />
12 25 00<br />
IMAGE: K;BURN_4pBLANKED_0_5arcsec.FITS<br />
3C 270<br />
IMAGE: K;BURN_4p_BLANK.FITS<br />
3C 353<br />
DECLINATION (J2000)<br />
05 52 00<br />
05 51 00<br />
05 50 00<br />
05 49 00<br />
05 48 00<br />
0 100 200 300 400 500 600<br />
rad^2/m^4 2 −4<br />
m<br />
(c)<br />
DECLINATION (J2000)<br />
;00 57 00<br />
;00 58 00<br />
;00 59 00<br />
0 100 200 300 400 500 600<br />
rad^2/m^4<br />
2<br />
m−4<br />
0.83 (d)<br />
0.78<br />
12 19 40<br />
12 19 30 12 19 20<br />
RIGHT ASCENSION (J2000)<br />
12 19 10<br />
;01 00 00<br />
17 20 35<br />
17 20 30 17 20 25<br />
RIGHT ASCENSION (J2000)<br />
17 20 20<br />
Figure 5.3: Burn law k images for all sources at the same angular resolutions as for the RM images:<br />
(a) 0206+35 at 1.2 arcsec FWHM; (b) M 84 at 4.5 arcsec FWHM; (c) 3C 270 at 5 arcsec FWHM;<br />
(d) 3C 353 at 1.3 arcsec FWHM. The correspon<strong>di</strong>ng integrated depolarization (DP; Section 5.4) is<br />
in<strong>di</strong>cated on the top right angle of each panel. The colour scale is the same for all <strong>di</strong>splays.<br />
81
82 5. Ordered magnetic fields around ra<strong>di</strong>o galaxies<br />
Table 5.3: Frequencies, bandwidths and angular resolutions used in the RM and Burn law k images<br />
<strong>di</strong>scussed in Sects. 5.3 and 5.4, respectively.<br />
source ν ∆ν beam<br />
[MHz] [MHz] [arcsec]<br />
0206+35 1385.1 25 1.2<br />
1464.9 25<br />
4885.1 50<br />
3C 353 1385.0 12.5 1.3<br />
1665.0 12.5<br />
4866.3 12.5<br />
8439.9 12.5<br />
3C 270 1365.0 25 1.65<br />
1412.0 12.5<br />
4860.1 100<br />
1365.0 25 5.0<br />
1412.0 12.5<br />
1646.0 25<br />
4860.1 100<br />
M 84 1413.0 25 1.65<br />
4885.1 50<br />
1385.1 50 4.5<br />
1413.0 25<br />
1464.9 50<br />
4885.1 50<br />
shown by Laing & Bridle (1987), but is derived from four-frequency data and has a higher signalto-noise<br />
ratio.<br />
In the fainter regions of 0206+35 (for which only three frequencies are available and the<br />
signal-to-noise ratio is relatively low), the RM task occasionally failed to determine the nπ<br />
ambiguities in position angle correctly. In order to remove these anomalies, I first produced<br />
a lower-resolution, but high signal-to-noise RM image by convolving the 1.2 arcsec RM map<br />
to a beamwidth of 5 arcsec FWHM. From this map I derived the polarization-angle rotations at<br />
each of the three frequencies and subtracted them from the observed 1.2 arcsec polarization angle<br />
maps at the same frequency to derive the residuals at high resolution. Then, I fit the residuals<br />
without allowing any nπ ambiguities and added the resulting RM’s to the values determined at<br />
low resolution. This procedure allowed us to obtain an RM map of 0206+35 free of significant<br />
deviations fromλ 2 rotation and fully consistent with the 1.2-arcsec measurements.<br />
I have verified that the polarization angles accurately follow the relation∆Ψ∝λ 2 over the<br />
full range of position angle essentially everywhere except for small areas around the opticallythick<br />
cores: representative plots ofΨagainstλ 2 for 0206+35 are shown in Fig. 5.4. The lack of<br />
deviations fromλ 2 rotation in all of the ra<strong>di</strong>o galaxies is fully consistent with the assumption that<br />
the Faraday rotating me<strong>di</strong>um is mostly external to the sources.<br />
The RM maps are shown in Fig. 5.2. The typical rms error on the fit is≈2 rad m −2 . No<br />
82
5.3. Rotation measure images 83<br />
correction for the Galactic contribution has been applied.<br />
All of the RM maps show two-<strong>di</strong>mensional patterns, RM bands, across the lobes with<br />
characteristic widths ranging from 3 to 12 kpc. Multiple bands parallel to each other are observed<br />
in the western lobe of 0206+35, the eastern lobe of 3C 353 and the southern lobe of M 84.<br />
In all cases, the iso-RM contours are straight and perpen<strong>di</strong>cular to the major axes of the lobes<br />
to a very good approximation: the very straight and well-defined bands in the eastern lobes of<br />
both 0206+35 (Fig. 5.2a) and 3C 353 (Fig. 5.2d) are particularly striking. The entire area of M 84<br />
appears to be covered by a banded structure, while in the central parts of 0206+35 and 3C 270 and<br />
the western lobe of 3C 353, regions of isotropic and random RM fluctuations are also present.<br />
I also derived profiles of〈RM〉 along the ra<strong>di</strong>o axis of each source, averaging over boxes<br />
a few beamwidths long (parallel to the axes), but extended perpen<strong>di</strong>cular to them to cover the<br />
entire width of the source. The boxes are all large enough to contain many independent points.<br />
The profiles are shown in Fig. 5.5. For each ra<strong>di</strong>o galaxy, I also plot an estimate of the Galactic<br />
contribution to the RM derived from a weighted mean of the integrated RM’s for non-cluster ra<strong>di</strong>o<br />
sources within a surroun<strong>di</strong>ng area of 10 deg 2 (Simard-Norman<strong>di</strong>n et al. 1981). In all cases, both<br />
positive and negative fluctuations with respect to the Galactic value are present.<br />
In 0206+35 (Fig. 5.2a), the largest-amplitude bands are in the outer parts of the lobes, with<br />
a possible low-level band just to the NW of the core. The most prominent band (with the most<br />
negative RM values) is in the eastern (rece<strong>di</strong>ng) lobe, about 15 kpc from the core (Fig. 5.5a). Its<br />
amplitude with respect to the Galactic value is about 40 rad m −2 . This band must be associated with<br />
a strong ordered magnetic field component along the line of sight. If corrected for the Galactic<br />
contribution, the two adjacent bands in the eastern lobe would have RM with opposite signs and<br />
the field component along the line of sight must therefore reverse.<br />
M 84 (Fig. 5.2b) <strong>di</strong>splays an ordered RM pattern across the whole source, with two wide<br />
bands of opposite sign having the highest absolute RM values. There is also an abrupt change of<br />
sign across the ra<strong>di</strong>o core (see also Laing & Bridle 1987). The negative band in the northern lobe<br />
(associated with the approaching jet) has a larger amplitude with respect to the Galactic value than<br />
the correspon<strong>di</strong>ng (positive) feature in the southern lobe (Fig. 5.5c).<br />
3C 270 (Fig. 5.2c) shows two large bands: one on the front end of the eastern lobe, the other<br />
in the middle of the western lobe. The bands have opposite signs and contain the extreme positive<br />
and negative values of the observed RM. The peak positive value is within the eastern band at the<br />
extreme end of the lobe (Fig. 5.5e).<br />
The RM structure of 3C 353 (Fig. 5.2d) is highly asymmetric. The eastern lobe shows a<br />
strong pattern, made up of four bands, with very straight iso-RM contours which are almost<br />
83
84 5. Ordered magnetic fields around ra<strong>di</strong>o galaxies<br />
Table 5.4: Properties of the RM bands: Col. 1 source name; Cols. 2&3: overall〈RM〉 andσ RM ;<br />
Col. 4: Galactic〈RM〉 ; Col. 5: 〈RM〉 for each band; Col. 6: <strong>di</strong>stance of the band midpoint<br />
from the ra<strong>di</strong>o core (positive <strong>di</strong>stances are in the western <strong>di</strong>rection for all sources, except for M 84,<br />
where they are in the northern <strong>di</strong>rection); Col. 7: width of the band; Col. 8: maximum band<br />
amplitude.<br />
source 〈RM〉 σ RM RM G band〈RM〉 d c width A<br />
[rad m −2 ] [rad m −2 ] [kpc] [kpc] [rad m −2 ]<br />
0206+35 −77 23 −72<br />
−140 -15 10 40<br />
−60 -27 4<br />
34 22 6<br />
51 8 4<br />
3C 353 −56 24 −69<br />
122 -12 5 50<br />
102 -19 4<br />
-40 -23 4<br />
100 -26 4<br />
3C 270 14 10 12<br />
−8 20 12 10<br />
32 37 11<br />
M 84 −2 15 2<br />
−27 1 3 10<br />
22 -6 6<br />
exactly perpen<strong>di</strong>cular to the source axis. As in 0206+35, adjacent bands have RM with opposite<br />
signs once corrected for the Galactic contribution (Fig. 5.5g). In contrast, the RM <strong>di</strong>stribution<br />
in the western lobe shows no sign of any banded structure, and is consistent with random<br />
fluctuations superimposed on an almost linear profile. It seems very likely that the <strong>di</strong>fferences<br />
in RM morphology and axial ratio are both related to the external density gra<strong>di</strong>ent (Fig. 5.1d).<br />
In Table 5.4 the relevant geometrical features (size, <strong>di</strong>stance from the ra<strong>di</strong>o core,〈RM〉 ) for<br />
the RM bands are listed.<br />
5.4 Depolarization<br />
In this section, I use “depolarization” in its conventional sense to mean “decrease of degree of<br />
polarization with increasing wavelength” and define DP= p 1.4 GHz /p 4.9 GHz . Using theFARADAY<br />
code (Murgia et al. 2004), I produced images of Burn law k by weighted least-squares fitting to<br />
ln p(λ) as a function ofλ 4 (Eq. 3.5). Only data with signal-to-noise ratio>4 in P at each frequency<br />
were included in the fits. The Burn law k images were produced with the same angular resolutions<br />
as the RM images. The 1.65 arcsec resolution Burn law k maps for M 84 and 3C 270 are consistent<br />
with the low-resolution ones, but add no ad<strong>di</strong>tional detail and are quite noisy. This could lead<br />
to significantly biased estimates for the mean values of k over large areas (Laing et al. 2008).<br />
84
5.4. Depolarization 85<br />
Therefore, as for the RM maps, I used only the Burn law k images at low resolution for these two<br />
sources.<br />
The Burn law k maps are shown in Fig. 5.3. All of the sources show low average values of k<br />
(i.e. slight depolarization), suggesting little RM power on small scales. With the possible exception<br />
of the narrow filaments of high k in the eastern lobe of 3C 353 (which might result from partially<br />
resolved RM gra<strong>di</strong>ents at the band edges), none of the images show any obvious structure related<br />
to the RM bands. For each source, I have also compared the RM and Burn law k values derived by<br />
averaging over many small boxes covering the emission, and I find no correlation between them.<br />
I also derived profiles of k (Fig. 5.5b, d, f and h) with the same sets of boxes as for the RM<br />
profiles in the same Figure. These confirm that the values of k measured in the centres of the RM<br />
bands are always low, but that there is little evidence for any detailed correlation.<br />
The signal-to-noise ratio for 0206+35 is relatively low compared with that of the other three<br />
sources, particularly at 4.9 GHz (a small beam is necessary to resolve the bands), and this is<br />
reflected in the high proportion of blanked pixels on the k image. The most obvious feature of<br />
this image (Fig. 5.3a), an apparent <strong>di</strong>fference in mean k between the high-brightness jets (less<br />
depolarized) and the surroun<strong>di</strong>ng emission, is likely to be an artefact caused by the adopted<br />
blanking strategy: points where the polarized signal is low at 4.9 GHz are blanked preferentially,<br />
so the remainder show artificially high polarization at this frequency. For the same reason, the<br />
apparent minimum in k at the centre of the deep, negative RM band (Fig. 5.5a and b) is probably<br />
not significant. The averaged values of k for 0206+35 are already very low, however, and are<br />
likely to be slightly overestimated, so residual RM fluctuations on scales below the 1.2-arcsec<br />
beamwidth must be very small.<br />
M 84 shows one localised area of very strong depolarization (k∼500 rad 2 m −4 , correspon<strong>di</strong>ng<br />
to DP=0.38) at the base of the southern jet (Fig. 5.3b). There is no correspon<strong>di</strong>ng feature in<br />
the RM image (Fig. 5.2b). The depolarization is likely to be associated with one of the shells<br />
of compressed gas visible in the Chandra image (Fig. 5.1b), implying significant magnetization<br />
with inhomogeneous field and/or density structure on scales much smaller than the beamwidth,<br />
apparently independent of the larger-scale field responsible for the RM bands. This picture is<br />
supported by the good spatial coincidence of the high k region with a shell of compressed gas,<br />
as illustrated in the overlay of the 4.5 arcsec Burn law k image on the contours of the Chandra<br />
data (Fig. 5.6(a)). Cooler gas associated with the emission-line <strong>di</strong>sk might also be responsible, but<br />
there is no evidence for spatial coincidence between enhanced depolarization and Hα emission<br />
(Hansen, Norgaard-Nielsen & Jorgensen 1985). Despite the complex morphology of the X-ray<br />
emission around M 84, its k profile is very symmetrical, with the highest values at the centre<br />
(Fig. 5.5(d)).<br />
85
86 5. Ordered magnetic fields around ra<strong>di</strong>o galaxies<br />
3C 270 also shows areas of very strong depolarization (k∼550 rad 2 m −4 , correspon<strong>di</strong>ng to<br />
DP=0.35) close to the core and surroun<strong>di</strong>ng the inner and northern parts of both the ra<strong>di</strong>o<br />
lobes. As for M 84, the areas of high k are coincident with ridges in the X-ray emission which<br />
form the boundaries of the cavity surroun<strong>di</strong>ng the lobes (Fig. 5.6(b)). The inner parts of this X-<br />
ray structure are described in more detail by Worrall et al. (2010), whose recent high-resolution<br />
Chandra image clearly reveals “wedges” of low brightness surroun<strong>di</strong>ng the ra<strong>di</strong>o jets. As in M 84,<br />
the most likely explanation is that a shell of denser gas imme<strong>di</strong>ately surroun<strong>di</strong>ng the ra<strong>di</strong>o lobes<br />
is magnetized, with significant fluctuations of field strength and density on scales smaller than<br />
the 5-arcsec beam, uncorrelated with the RM bands. The k profile of 3C 270 (Fig. 5.5(f)) is very<br />
symmetrical, suggesting that the magnetic-field and density <strong>di</strong>stributions are also symmetrical and<br />
consistent with an orientation close to the plane of the sky. The largest values of k are observed in<br />
the centre, coincident with the features noted earlier and with the bulk of the X-ray emission (the<br />
high k values in the two outermost bins have low signal-to-noise and are not significant).<br />
In the Burn law k image of 3C 353, there is evidence for a straight and knotty region of high<br />
depolarization≈20 kpc long and exten<strong>di</strong>ng westwards from the core. This region does not appear<br />
to be related either to the jets or to any other ra<strong>di</strong>o feature. As in M 84 and 3C 270, the RM appears<br />
quite smooth over the area showing high depolarization, again suggesting that there are two scales<br />
of structure, one much smaller than the beam, but producing zero mean RM and the other very<br />
well resolved. In 3C 353, there is as yet no evidence for hot or cool ionized gas associated with<br />
the enhanced depolarization (contamination from the very bright nuclear X-ray emission affects<br />
an area of 1 arcmin ra<strong>di</strong>us around the core; Iwasawa et al. 2000, Goodger et al. 2008).<br />
The k profile of 3C 353 (Fig. 5.5(h)) shows a marked asymmetry, with much higher values in<br />
the East. This is in the same sense as the <strong>di</strong>fference of RM fluctuation amplitudes (Fig. 5.5(g))<br />
and is also consistent with the eastern lobe being embedded in higher-density gas. The relatively<br />
high values of k within 20 kpc of the nucleus in the Western lobe are due primarily to the <strong>di</strong>screte<br />
region identified earlier.<br />
5.5 Rotation measure structure functions<br />
I calculated RM structure function (Eq. 3.13) for <strong>di</strong>screte regions of the sources where the RM<br />
fluctuations appear to be isotropic and random and for which we expect the spatial variations of<br />
foreground thermal gas density, rms magnetic field strength and path length to be reasonably small.<br />
These are: the inner 26 arcsec of the rece<strong>di</strong>ng (Eastern) lobe of 0206+35, the inner 100 arcsec of<br />
3C 270 and the inner 40 arcsec of the western lobe of 3C 353. The selected areas of 0206+35<br />
and 3C 270 are both within the core ra<strong>di</strong>i of the larger-scale beta models that describe the group-<br />
86
5.5. Rotation measure structure functions 87<br />
Table 5.5: Power spectrum parameters for the in<strong>di</strong>vidual sub-regions. Col. 1: source name; Col.<br />
2: angular resolution; Col. 3: slope q: Col. 4: amplitude C 0 ; Col. 5: minimum scale; Col. 6:<br />
amplitude of the large scale isotropic component; Col. 7: observed mean k; Col. 8: pre<strong>di</strong>cted<br />
mean k. The power spectrum has not been computed for M 84 (see Section 5.5).<br />
source FWHM q log C 0 Λ min A iso k obs k syn<br />
[arcsec] [kpc] [rad m −2 ] [rad 2 m −4 ] [rad 2 m −4 ]<br />
0206+35 1.2 2.1 0.77 2 10 37 40<br />
3C 270 1.65 2.7 0.90 0.1 5 30 26<br />
5.0 2.7 0.90 0.1 5 71 64<br />
3C 353 1.3 3.1 0.99 0.1 10 38 33<br />
M 84 1.65
88 5. Ordered magnetic fields around ra<strong>di</strong>o galaxies<br />
0206+35<br />
Figure 5.4: Plots of E-vector position angleΨagainstλ 2 at representative points of the 1.2 arcsec<br />
RM map of 0206+35. Fits to the relationΨ(λ)=Ψ 0 + RMλ 2 are shown. The values of RM are<br />
given in the in<strong>di</strong>vidual panels.<br />
In order to constrain RM structure on spatial scales below the beamwidth, I estimated the<br />
depolarization as described in Section 5.2. The fitted k values are listed in Table 5.5. I stress that<br />
these values refer only to areas with isotropic fluctuations, and cannot usefully be compared with<br />
the integrated depolarizations quoted in in Fig. 5.2.<br />
For M 84, using the Burn law k analysis and assuming that variation of Faraday rotation<br />
across the 1.65-arcsec beam causes the residual depolarization, I find thatΛ min<br />
< ∼ 0.1 kpc for any<br />
reasonable RM power spectrum.<br />
5.6 Rotation-measure bands from compression<br />
It is clear from the fact that the observed RM bands are perpen<strong>di</strong>cular to the lobe axes that they<br />
must be associated with an interaction between an expan<strong>di</strong>ng ra<strong>di</strong>o source and the gas imme<strong>di</strong>ately<br />
surroun<strong>di</strong>ng it. One inevitable mechanism is enhancement of field and density by the shock or<br />
compression wave surroun<strong>di</strong>ng the source. 1<br />
The implication of the presence of cavities in the<br />
X-ray gas <strong>di</strong>stribution coincident with the ra<strong>di</strong>o lobes is that the sources are interacting strongly<br />
1 An alternative mechanism is the generation of non-linear surface waves (Bicknell, Cameron & Gingold 1990). It<br />
is unlikely that this can produce large-scale bands, for the reasons given in Section 5.8.5.<br />
88
5.6. Rotation-measure bands from compression 89<br />
0206+35<br />
M 84<br />
3C 270 3C 353<br />
Figure 5.5: Profiles of mean and rms RM and Burn law k along the ra<strong>di</strong>o axis. The profiles<br />
have been derived by averaging over boxes perpen<strong>di</strong>cular to the ra<strong>di</strong>o axis of length 5 kpc for all<br />
sources except M 84, for which the box length is 2 kpc. The orange (dashed) and violet (longdashed)<br />
lines represent the Galactic RM contribution and the〈RM〉 of the lobes, respectively. All<br />
unblanked pixels are included.<br />
89
90 5. Ordered magnetic fields around ra<strong>di</strong>o galaxies<br />
IMAGE: K;BURN_3p_4.5_BLANKED.FITS<br />
CNTRS: M84_CHANDRA_NOPTS_AS_1.3_4.5.FITS.3<br />
0 100 200 300 400 500 600<br />
IMAGE: 3C270_KBURN_5.0.FITS<br />
CNTRS: XMM_12_ARCSEC_AS_1.3_5.0.FITS<br />
rad^2/m^4<br />
m<br />
0 100 200 300 400 500 600<br />
rad^2/m^4<br />
rad m<br />
12 54 00<br />
05 52 00<br />
DECLINATION (J2000)<br />
12 53 00<br />
DECLINATION (J2000)<br />
05 50 00<br />
05 48 00<br />
12 52 00<br />
(a)<br />
12 25 09<br />
12 25 06 12 25 03<br />
RIGHT ASCENSION (J2000)<br />
12 25 00<br />
(b)<br />
12 19 40<br />
12 19 30 12 19 20<br />
RIGHT ASCENSION (J2000)<br />
12 19 10<br />
Figure 5.6: Burn law k images of M 84 (a) and 3C 270 (b) overlaid on X-ray contours derived<br />
from Chandra and XMM-Newton data, respectively.<br />
with the thermal gas, <strong>di</strong>splacing rather than mixing with it (see McNamara & Nulsen 2007 for<br />
a review). For the sources here presented, the X-ray observations of M 84 (Finoguenov et al.<br />
2008, Fig.5.1b) and 3C 270 (Croston et al. 2008, Fig.5.1c) show cavities and arcs of enhanced<br />
brightness, correspon<strong>di</strong>ng to shells of compressed gas bounded by weak shocks. The strength of<br />
any pre-existing field in the IGM, which will be frozen into the gas, will also be enhanced in the<br />
shells. Therefore a significant enhancement in RM is expected. A more extreme example of this<br />
effect will occur if the expansion of the ra<strong>di</strong>o source is highly supersonic, in which case there will<br />
be a strong bow-shock ahead of the lobe, behind which both the density and the field become much<br />
higher. Regardless of the strength of the shock, the field is mo<strong>di</strong>fied so that only the component in<br />
the plane of the shock is amplified and the post-shock field tends become ordered parallel to the<br />
shock surface.<br />
The evidence so far suggests that shocks around ra<strong>di</strong>o sources of both FR classes are generally<br />
weak (e.g. Forman et al. 2005, Wilson, Smith & Young 2006, Nulsen et al. 2005a). There are<br />
only two examples in which highly supersonic expansion has been inferred: the southern lobe of<br />
Centaurus A (M≈8; Kraft et al. 2003) and NGC 3801 (M≈4; Croston et al. 2007). There<br />
is no evidence that the sources here described are significantly over-pressured compared with<br />
the surroun<strong>di</strong>ng IGM (indeed, the synchrotron minimum pressure is systematically lower than the<br />
thermal pressure of the IGM; Table 5.2). The sideways expansion of the lobes is therefore unlikely<br />
to be highly supersonic. The shock Mach number estimated for all the sources from ram pressure<br />
balance in the forward <strong>di</strong>rection is also≈1.3. This estimate is consistent with that for M 84 made<br />
by Finoguenov et al. (2006) and also with the lack of detection of strong shocks in the X-ray data<br />
90
5.6. Rotation-measure bands from compression 91<br />
(a)<br />
(b)<br />
(c)<br />
(d)<br />
Figure 5.7: Plots of the RM structure functions for the isotropic sub-regions of 0206+35,3C 353<br />
and 3C 270 described in the text. The horizontal bars represent the bin width and the crosses<br />
the centroids for data included in the bins. The red lines are the pre<strong>di</strong>ctions for power law<br />
power spectra, inclu<strong>di</strong>ng the effects of the convolving beam. The vertical error bars are the<br />
rms variations for the structure functions derived for multiple realizations of the data. The fitted<br />
structure functions for 3C 270 are derived for the same power spectrum parameters.<br />
for the other sources.<br />
In this section, I investigate how the RM could be affected by compression. I consider a<br />
deliberately oversimplified picture in which the ra<strong>di</strong>o source expands into an IGM with an initially<br />
uniform magnetic field, B. This is the most favourable situation for the generation of large-scale,<br />
anisotropic RM structures: in reality, the pre-existing field is likely to be highly <strong>di</strong>sordered, or<br />
even isotropic, because of turbulence in the thermal gas. I stress that I have not tried to generate a<br />
self-consistent model for the magnetic field and thermal density, but rather to illustrate the generic<br />
effects of compression on the RM structure.<br />
In this model the ra<strong>di</strong>o lobe is an ellipsoid with its major axis along the jet and is surrounded<br />
by a spherical shell of compressed material. This shell is centred at the mid-point of the lobe<br />
(Fig. 5.8) and has a stand-off <strong>di</strong>stance equal to 1/3 of the lobe semi-major axis at the lea<strong>di</strong>ng<br />
91
92 5. Ordered magnetic fields around ra<strong>di</strong>o galaxies<br />
Figure 5.8: Amplification and sweeping up of the magnetic field lines inside the compression<br />
region defined by the projected circular green and dashed line. The driving expansion is along the<br />
Z-axis and the z-axis represents a generic line-of-sight.<br />
edge (the ra<strong>di</strong>us of the spherical compression is therefore equal to 4/3 of the lobe semi-major<br />
axis). In the compressed region, the thermal density and the magnetic field component in the<br />
plane of the spherical compression are amplified by the same factor, because of flux-freezing. I<br />
use a coor<strong>di</strong>nate system xyz centred at the lobe mid-point, with the z-axis along the line of sight,<br />
so x and y are in the plane of the sky. The ra<strong>di</strong>al unit vector is ˆr=(ˆx, ŷ, ẑ). B=(B x , B y , B z ) and<br />
B ′ =(B ′ x, B ′ y, B ′ z) are respectively the pre- and post-shock magnetic-field vectors. Then, I consider<br />
a coor<strong>di</strong>nate system XYZ still centred at the lobe mid-point, but rotated with respect to the xyz<br />
system by the angleθabout the y (Y) axis, so that Z is aligned with the major axis of the lobe.<br />
With this choice,θis the inclination of the source with respect to the line-of-sight (Fig. 5.8).<br />
After a spherical compression, the thermal density and field satisfy the equations:<br />
n ′ e<br />
= γn e<br />
B ′ ⊥ = B ⊥ = (B·r)ˆr<br />
B ′ ‖<br />
= γB ‖ =γ[B−(B·r)ˆr] (5.2)<br />
where n e , B ⊥ and B ‖ represent the initial thermal density and the components of the field<br />
perpen<strong>di</strong>cular and parallel to the compression surface. The same symbols with primes stand for<br />
post-shock quantities andγis the compression factor. The total compressed magnetic field is:<br />
B ′ = B ′ ‖ + B′ ⊥ =γB+(1−γ)(B·r)ˆr (5.3)<br />
92
5.6. Rotation-measure bands from compression 93<br />
The field strength after compression depends on the the angle between the compression surface and<br />
the initial field. Maximum amplification occurs for a field which is parallel to the surface, whereas<br />
a perpen<strong>di</strong>cular field remains unchanged. The post-shock field component along the line-of-sight<br />
becomes:<br />
B ′ z = B′· ẑ=γB·ẑ+(1−γ)(B·r)(r·ẑ) (5.4)<br />
I assumed that the compression factor,γ=γ(Z), is a function of <strong>di</strong>stance Z along the source<br />
axis from the centre of the ra<strong>di</strong>o lobe, decreasing monotonically from a maximum valueγ max at<br />
the lea<strong>di</strong>ng edge to a constant value from the centre of the lobe as far as the core. I investigated<br />
values ofγ max in the range 1.5 – 4 (γ=4 corresponds to the asymptotic value for a strong shock).<br />
Given that there is no evidence for strong shocks in the X-ray data for any of the sources under<br />
investigation, I have typically assumed that the compression factor isγ max = 3 at the front end of<br />
the lobe, decreasing to 1.2 at the lobe mid-point and thereafter remaining constant as far as the<br />
core. A maximum compression factor of 3 is consistent with the transonic Mach numbersM≃1.3<br />
estimated from ram-pressure balance for all of the sources and this choice is also motivated by the<br />
X-ray data of M 84, from which there is evidence for a compression ratio≈ 3 between the shells<br />
and their surroun<strong>di</strong>ngs (Section 5.1.4).<br />
I produced synthetic RM images for <strong>di</strong>fferent combinations of source inclination and <strong>di</strong>rection<br />
of the pre-existing uniform field, by integrating the expression<br />
RM syn =<br />
∫ R0<br />
lobe<br />
n ′ eB ′ zdz. (5.5)<br />
numerically. I assumed a constant value of n e = 2.4×10 −3 cm −3 for the density of the preshock<br />
material (the central value for the group gas associated with 0206+35; Table 5.2), a lobe<br />
semi-major axis of 21 kpc (also appropriate for 0206+35) and an initial field strength of 1µG.<br />
The integration limits were defined by the surface of the ra<strong>di</strong>o lobe and the compression surface.<br />
This is equivalent to assuming that there is no thermal gas within the ra<strong>di</strong>o lobe, consistent with<br />
the picture suggested by the inference of foreground Faraday rotation and the existence of X-ray<br />
cavities and that Faraday rotation from uncompressed gas is negligible.<br />
As an example, Fig. 5.9 shows the effects of compression on the RM for the rece<strong>di</strong>ng lobe<br />
of a source inclined by 40 ◦ to the line of sight. The initial field is pointing towards us with an<br />
inclination of 60 ◦ with respect to the line-of-sight; its projection on the plane of the sky makes<br />
an angle of 30 ◦ with the x-axis. Fig. 5.9(a) <strong>di</strong>splays the RM produced without compression<br />
(γ(Z)=1 everywhere): the RM structures are due only to <strong>di</strong>fferences in path length across the<br />
lobe. Fig. 5.9(b) shows the consequence of ad<strong>di</strong>ng a modest compression ofγ max = 1.5: structures<br />
similar to bands are generated at the front end of the lobe and the range of the RM values is<br />
93
94 5. Ordered magnetic fields around ra<strong>di</strong>o galaxies<br />
IMAGE: ICM.FITS<br />
IMAGE: ICM_WEAKSHOCK.FITS<br />
IMAGE: ICM_STRONGSHOCK.FITS<br />
34 36 38 40 42 44<br />
RAD/M/M<br />
rad m −2<br />
40 60 80 100 120 140 160<br />
RAD/M/M−2<br />
rad m<br />
100 200 300 400 500<br />
RAD/M/M−2<br />
rad m<br />
X X X<br />
(a) (b) (c)<br />
Figure 5.9: Panel (a): synthetic RM for a rece<strong>di</strong>ng lobe inclined by 40 ◦ to the line-of-sight and<br />
embedded in a uniform field inclined by 60 ◦ to the line-of-sight and by and 30 ◦ to the lobe axis on<br />
the plane of the sky. Panels (b) and (c): as (a) but with a weak compression (γ max = 1.5) and a<br />
strong compression (γ max = 4) of the density and field. The crosses and the arrows in<strong>di</strong>cate the<br />
position of the core and the lobe advance <strong>di</strong>rection, respectively.<br />
increased. Fig. 5.9(c) illustrates the RM produced in case of the strongest possible compression,<br />
γ max = 4: the RM structure is essentially the same as in Fig. 5.9(b), with a much larger range.<br />
This very simple example shows that RM bands with amplitudes consistent with those<br />
observed can plausibly be produced even by weak shocks in the IGM, but the iso-RM contours<br />
are neither straight, nor orthogonal to the lobe axis and there are no reversals. These constraints<br />
require specific initial con<strong>di</strong>tions, as illustrated in Fig. 5.10, where I show the RM for a lobe in the<br />
plane of the sky. I considered three initial field configurations: along the line-of-sight (Fig. 5.10a),<br />
in the plane of the sky and parallel to the lobe axis (Fig. 5.10b) and in the plane of the sky, but<br />
inclined by 45 ◦ to the lobe axis (Fig. 5.10c). The case closest to reproducing the observations is<br />
that <strong>di</strong>splayed in Fig. 5.10(b), in which reversals and well defined and straight bands perpen<strong>di</strong>cular<br />
to the jet axis are produced for both of the lobes. In Fig. 5.10(a), the structures are curved, while<br />
in Fig. 5.10(c) the bands are perpen<strong>di</strong>cular to the initial field <strong>di</strong>rection, and therefore inclined with<br />
respect to the lobe axis.<br />
For a source inclined by 40 ◦ to the line of sight, I found structures similar to the observed bands<br />
only with an initial field in the plane of the sky and parallel to the axis in projection (Figs 5.11a<br />
and b; note that the synthetic RM images in this example have been made for each lobe separately,<br />
neglecting superposition).<br />
I can summarize the results of the spherical pure compression model as follows.<br />
1. An initial field with a component along the line-of-sight does not generate straight bands.<br />
2. The bands are orthogonal to the <strong>di</strong>rection of the initial field projected on the plane of the<br />
sky, so bands perpen<strong>di</strong>cular to the lobe axis are only obtained with an initial field aligned<br />
with the ra<strong>di</strong>o jet in projection.<br />
94
5.7. Rotation-measure bands from a draped magnetic field 95<br />
IMAGE: BLANK.FITS<br />
IMAGE: BLANK.FITS<br />
IMAGE: BLANK.FITS<br />
100 200 300 400<br />
0 20 40 60 80 100 120<br />
0 20 40 60 80 100<br />
RAD/M/M−2<br />
rad m<br />
RAD/M/M−2<br />
rad m<br />
RAD/M/M−2<br />
rad m<br />
x<br />
x<br />
x<br />
(a)<br />
(b)<br />
(c)<br />
Figure 5.10: Synthetic RM images for a lobe in the plane of the sky with an ambient field which<br />
is uniform before compression. In panels (a) and (b), the field is along the axis of the lobe in<br />
projection and inclined to the line-of-sight by (a) 45 ◦ and (b) 90 ◦ . In panel (c), the field is in the<br />
plane of the sky and misaligned by 45 ◦ with respect to the lobe axis. The crosses and the arrows<br />
represent the ra<strong>di</strong>o core position and the lobe advance <strong>di</strong>rection, respectively.<br />
IMAGE: BLANK.FITS<br />
0 20 40 60 80<br />
RAD/M/M<br />
rad m −2<br />
IMAGE: BLANK.FITS<br />
;140 ;120 ;100 ;80 ;60 ;40 ;20 0<br />
RAD/M/M<br />
rad m −2<br />
x<br />
x<br />
(a)<br />
(b)<br />
Figure 5.11: Synthetic RM images of the rece<strong>di</strong>ng (a) and approaching lobe (b) of a source<br />
inclined by 40 ◦ with respect to the line-of-sight, in the case of a uniform ambient field. The<br />
field is aligned with the ra<strong>di</strong>o jets in projection and inclined with respect to the line-of-sight by<br />
90 ◦ . The crosses and the arrows represent the ra<strong>di</strong>o core position and the lobe advance <strong>di</strong>rection,<br />
respectively.<br />
3. The path length (determined by the precise shape of the ra<strong>di</strong>o lobes) has a second-order<br />
effect on the RM <strong>di</strong>stribution (compare Figs. 5.9a and b).<br />
Thus, a simple compression model can generate bands with amplitudes similar to those<br />
observed but reproducing their geometry requires implausibly special initial con<strong>di</strong>tions, as I<br />
<strong>di</strong>scuss in the next section.<br />
5.7 Rotation-measure bands from a draped magnetic field<br />
5.7.1 General considerations<br />
That the pre-existing field is uniform, close to the plane of the sky and aligned with the source axis<br />
in projection is implausible for obvious reasons:<br />
95
96 5. Ordered magnetic fields around ra<strong>di</strong>o galaxies<br />
1. the pre-existing field cannot know anything about either the ra<strong>di</strong>o-source geometry or our<br />
line-of-sight and<br />
2. observations of Faraday rotation in other sources and the theoretical inference of turbulence<br />
in the IGM both require <strong>di</strong>sordered initial fields.<br />
This suggests that the magnetic field must be aligned by rather than with the expansion of the ra<strong>di</strong>o<br />
source. Indeed, the field configurations which generate straight bands look qualitatively like the<br />
“draping” model proposed by Dursi & Pfrommer (2008), for some angles to the line-of-sight. The<br />
analysis of Sections 5.2, 5.4 and 5.5 suggests that the magnetic fields causing the RM bands are<br />
well-ordered, consistent with a stretching of the initial field that has erased much of the small-scale<br />
structure while amplifying the large-scale component. I next attempt to constrain the geometry of<br />
the resulting “draped” field.<br />
5.7.2 Axisymmetric draped magnetic fields<br />
A proper calculation of the RM from a draped magnetic-field configuration (Dursi & Pfrommer<br />
2008) is outside the scope of this work, but we can start to understand the field geometry using<br />
some simple approximations in which the field lines are stretched along the source axis. I assumed<br />
initially that the field around the lobe is axisymmetric, with components along and ra<strong>di</strong>ally<br />
outwards from the source axis, so that the RM pattern is independent of rotation about the axis. It<br />
is important to stress that such an axisymmetric field is not physical, as it requires a monopole and<br />
unnatural reversals, it is nevertheless a useful benchmark for features of the field geometry that are<br />
needed to account for the observed RM structure. I first considered field lines which are parabolae<br />
with a common vertex on the axis ahead of the lobe. For field strength and density both decreasing<br />
away from the vertex, I found that RM structures, with iso-contours similar to arcs, rather than<br />
bands, were generated only for the approaching lobe of an inclined source. Such anisotropic RM<br />
structures were not produced in the rece<strong>di</strong>ng lobes, nor for sources in the plane of the sky. Indeed,<br />
in order to generate any narrow, transverse RM structures such as arcs or bands, the line-of-sight<br />
must pass through a foreground region in which the field lines show significant curvature, which<br />
occurs only for an approaching lobe in case of a parabolic field geometry. This suggested to<br />
consider field lines which are families of ellipses centred on the lobe, again with field strength and<br />
density decreasing away from the lea<strong>di</strong>ng edge. This indeed produced RM structures in both lobes<br />
for any inclination, but the iso-RM contours were arcs, not straight lines. Because of the nonphysical<br />
nature of these axisymmetric field models, the resulting RM images are deliberately not<br />
shown. In order to quantify the departures from straightness of the iso-RM contours, I measured<br />
the ratio of the pre<strong>di</strong>cted RM values at the centre and edge of the lobe at constant Y, at <strong>di</strong>fferent<br />
96
5.7. Rotation-measure bands from a draped magnetic field 97<br />
<strong>di</strong>stances along the source axis, X, for both of the example axisymmetric field models. The ratio,<br />
which is 1 for perfectly straight bands, varies from 2 to 3 in both cases, depen<strong>di</strong>ng on <strong>di</strong>stance<br />
from the nucleus. This happens because the variations in line-of-sight field strength and density<br />
do not compensate accurately for changes in path length. I believe that this problem is generic to<br />
any axisymmetric field configuration.<br />
The results of this section suggest that the field configuration required to generate straight RM<br />
bands perpen<strong>di</strong>cular to the projected lobe advance <strong>di</strong>rection has systematic curvature in the field<br />
lines (in order to produce a modulation in RM) without a significant dependence on azimuthal<br />
angle around the source axis). I therefore investigated a structure in which elliptical field lines are<br />
wrapped around the front of the lobe, but in a two-<strong>di</strong>mensional rather than a three-<strong>di</strong>mensional<br />
configuration.<br />
5.7.3 A two-<strong>di</strong>mensional draped magnetic field<br />
I considered a field with a two-<strong>di</strong>mensional geometry, in which the field lines are families of<br />
ellipses in planes of constant Y, as sketched in Fig. 5.12. The field structure is then independent<br />
of Y. The limits of integration are given by the lobe surface and an ellipse whose major axis<br />
is 4/3 of that of the lobe. Three example RM images are shown in Fig. 5.13. The assumed<br />
density (2.4×10 −3 cm −3 ) and magnetic field (1µG) were the same as the pre-shock values for the<br />
compression model of Section 5.6 and the lobe semi-major axis was again 21 kpc. Since the effect<br />
of path length is very small (Section 5.6), the RM is also independent of Y to a good approximation.<br />
The combination of elliptical field lines and invariance with Y allows us to produce straight RM<br />
bands perpen<strong>di</strong>cular to the projected lobe axis for any source inclination. Furthermore, this model<br />
generates more significant reversals of the RM (e.g. Fig. 5.13c) than those obtainable with pure<br />
compression (e.g. Fig. 5.11b).<br />
I conclude that a field model of this generic type represents the simplest way to produce RM<br />
bands with the observed characteristics in a way that does not require improbable initial con<strong>di</strong>tions.<br />
The invariance of the field with the Y coor<strong>di</strong>nate is an essential point of this model, suggesting<br />
that the physical process responsible for the draping and stretching of the field lines must act on<br />
scales larger than the ra<strong>di</strong>o lobes in the Y <strong>di</strong>rection.<br />
5.7.4 RM reversals<br />
The two-<strong>di</strong>mensional draped field illustrated in the previous section reproduces the geometry of<br />
the observed RM bands very well, but can only generate a single reversal, which must be very<br />
close to the front end of the approaching lobe, where the elliptical field lines bend most rapidly. A<br />
97
98 5. Ordered magnetic fields around ra<strong>di</strong>o galaxies<br />
Figure 5.12: Geometry of the two-<strong>di</strong>mensional draped model for the magnetic field, described<br />
in Sec. 5.7.3. Panel (a): seen in the plane of the <strong>di</strong>rection of the ambient magnetic field. Panel<br />
(b): seen in the plane perpen<strong>di</strong>cular to the ambient field; only the innermost family of ellipses is<br />
plotted. For clarity, field lines behind the lobe are omitted. The colour of the curves in<strong>di</strong>cates the<br />
strength of the field, decreasing from red to yellow. The crosses represent the ra<strong>di</strong>o core position.<br />
The coor<strong>di</strong>nate system is the same as in Fig. 5.8 and the line of sight is in the X− Z plane.<br />
IMAGE: BLANK.FITS<br />
IMAGE: BLANK.FITS<br />
IMAGE: BLANK.FITS<br />
;100 ;50 0<br />
RAD/M/M<br />
rad m<br />
0 10 20 30 40<br />
RAD/M/M<br />
rad m −2<br />
;40 ;20 0 20<br />
RAD/M/M<br />
rad m<br />
−2<br />
x<br />
x<br />
x<br />
(a) (b) (c)<br />
Figure 5.13: Synthetic RM images produced for a two-<strong>di</strong>mensional draped model as described in<br />
Section 5.7.3. The field lines are a family of ellipses draped around the lobe as in Fig. 5.12. Panel<br />
(a): lobe inclined at 90 ◦ to the line-of-sight. (b) rece<strong>di</strong>ng and (c) approaching lobes of a source<br />
inclined by 40 ◦ to the line-of-sight. The crosses and the arrows represent the ra<strong>di</strong>o core position<br />
and the lobe advance <strong>di</strong>rection.<br />
prominent reversal is apparent in the rece<strong>di</strong>ng lobe of 0206+35 (Fig. 5.2a) and multiple reversals<br />
across the eastern lobe of 3C 353 and in M 84 (Fig. 5.2b and d). The simplest way to reproduce<br />
these is to assume that the draped field also has reversals, presumably originating from a more<br />
complex initial field in the IGM. One realization of such a field configuration would be in the<br />
form of multiple toroidal ed<strong>di</strong>es with ra<strong>di</strong>i smaller than the lobe size, as sketched in Fig. 5.14.<br />
Whatever the precise field geometry, I stress that the straightness of the observed multiple bands<br />
again requires a two-<strong>di</strong>mensional structure, with little dependence on Y.<br />
98
5.8. Discussion 99<br />
5.8 Discussion<br />
5.8.1 Where do bands occur?<br />
The majority of published RM images of ra<strong>di</strong>o galaxies do not show bands or other kind of<br />
anisotropic structure, but are characterized by isotropic and random RM <strong>di</strong>stributions (e.g. Laing<br />
et al. 2008, 3C 449, Chapter 4). On the other hand, I have presented observations of RM bands<br />
in four ra<strong>di</strong>o galaxies embedded in <strong>di</strong>fferent environments and with a range of jet inclinations<br />
with respect to the line-of-sight. These sources are not drawn from a complete sample, so any<br />
quantitative estimate of the incidence of bands is premature, but it is possible to draw some<br />
preliminary conclusions.<br />
The simple two-<strong>di</strong>mensional draped-field model developed in Section 5.7.3 only generates<br />
RM bands when the line-of-sight intercepts the volume containing elliptical field lines, which<br />
happens for a restricted range of rotation around the source axis. At other orientations, the RM<br />
from this field configuration will be small and the observed RM may well be dominated by<br />
material at larger <strong>di</strong>stances which has not been affected by the ra<strong>di</strong>o source. I therefore expect<br />
a minority of sources with this type of field structure to show RM bands and the remainder to have<br />
weaker, and probably isotropic, RM fluctuations. In contrast, the three-<strong>di</strong>mensional draped field<br />
model proposed by Dursi & Pfrommer (2008) pre<strong>di</strong>cts RM bands parallel to the source axis for a<br />
significant range of viewing <strong>di</strong>rections: these have not (yet) been observed.<br />
The prominent RM bands here described occur only in lobed ra<strong>di</strong>o galaxies. In contrast, wellobserved<br />
ra<strong>di</strong>o sources with tails and plumes seem to be free of bands or anisotropic RM structure<br />
(e.g. 3C 31, 3C 449; Laing et al. 2008, Chapter 4). Furthermore, the lobes which show bands are all<br />
quite round and show evidence for interaction with the surroun<strong>di</strong>ng IGM. It is particularly striking<br />
that the bands in 3C 353 occur only in its eastern, rounded, lobe. The implication is that RM bands<br />
occur when a lobe is being actively driven by a ra<strong>di</strong>o jet into a region of high IGM density. Plumes<br />
and tails, on the other hand, are likely to be rising buoyantly in the group or cluster and I do not<br />
expect significant compression, at least at large <strong>di</strong>stances from the nucleus.<br />
5.8.2 RM bands in other sources<br />
The fact that RM bands have so far been observed only in a few ra<strong>di</strong>o sources may be a selection<br />
effect: much RM analysis has been carried out for galaxy clusters, in which most of the sources<br />
are tailed (e.g. Blanton et al. 2003). With a few exceptions like Cyg A (see below, Section 5.8.2),<br />
lobed FR I and FR II sources have not been stu<strong>di</strong>ed in detail.<br />
99
100 5. Ordered magnetic fields around ra<strong>di</strong>o galaxies<br />
Cygnus A<br />
Cygnus A is a source in which we might expect to observed RM bands, by analogy with the<br />
sources <strong>di</strong>scussed in the present work: it has wide and round lobes and Chandra X-ray data have<br />
shown the presence of shock-heated gas and cavities (Wilson, Smith & Young 2006). RM bands,<br />
roughly perpen<strong>di</strong>cular to the source axis, are indeed seen in both lobes (Dreher et al. 1987; Carilli<br />
& Taylor 2002), but interpretation is complicated by the larger random RM fluctuations and the<br />
strong depolarization in the eastern lobe. A semi-circular RM feature around one of the hot-spots<br />
in the western lobe has been attributed to compression by the bow-shock (Carilli, Perley & Dreher<br />
1988).<br />
Hydra A<br />
Carilli & Taylor (2002) have claimed evidence for RM bands in the northern lobe of Hydra A. The<br />
Chandra image (McNamara et al. 2000) shows a clear cavity with sharp edges coincident with<br />
the ra<strong>di</strong>o lobes and an absence of shock-heated gas, just as in the sources analysed in this work.<br />
Despite the classification as a tailed source, it may well be that there is significant compression of<br />
the IGM. Note, however, that the RM image is not well sampled close to the nucleus.<br />
3C 465<br />
The RM image of the tailed source 3C 465 published by Eilek & Owen (2002) shows some<br />
evidence for bands, but the colour scale was deliberately chosen to highlight the <strong>di</strong>fference between<br />
positive and negative values, thus making it <strong>di</strong>fficult to see the large gra<strong>di</strong>ents in RM expected at<br />
band edges. The original RM image (Eilek, private communication) suggests that the band in<br />
the western tail of 3C 465 is similar to those I have identified. It is plausible that magnetic-field<br />
draping happens in wide-angle tail sources like 3C 465 as a result of bulk motion of the IGM<br />
within the cluster potential well, as required to bend the tails. It will be interesting to search for<br />
RM bands in other sources of this type and to find out whether there is any relation between the<br />
iso-RM contours and the flow <strong>di</strong>rection of the IGM.<br />
5.8.3 Foreground isotropic field fluctuations<br />
The coexistence in the RM images of the sources here analysed of anisotropic patterns with areas<br />
of isotropic fluctuations suggests that the Faraday-rotating me<strong>di</strong>um has at least two components:<br />
one local to the source, where its motion significantly affects the surroun<strong>di</strong>ng me<strong>di</strong>um, draping<br />
the field, and the other from material on group or cluster scales which has not felt the effects<br />
100
5.8. Discussion 101<br />
line−of−sight<br />
><br />
><br />
Figure 5.14: Geometry of a two<strong>di</strong>mensional<br />
toroidal magnetic field as<br />
described in Section 5.7.3, seen in the<br />
plane normal to its axis. The cross<br />
represents the ra<strong>di</strong>o core position.<br />
of the source.<br />
This raises the possibility that turbulence in the foreground Faraday rotating<br />
me<strong>di</strong>um might “wash out” RM bands, thereby making them impossible to detect. The isotropic<br />
RM fluctuations observed across the sources are all described by quite flat power spectra with<br />
low amplitude (Table 5.5). The random small-scale structure of the field along the line-of-sight<br />
essentially averages out, and there is very little power on scales comparable with the bands. If, on<br />
the other hand, the isotropic field had a steeper power spectrum with significant power on scales<br />
similar to the bands, then its contribution might become dominant.<br />
I first produced synthetic RM images for 0206+35 inclu<strong>di</strong>ng a random component derived<br />
from the best-fitting power spectrum (Table 5.5) in order to check that the bands remained visible.<br />
I assumed a minimum scale of 2 kpc from the depolarization analysis for 0206+35 (Sec. 5.4), and a<br />
maximum scale ofΛ max = 40 kpc, consistent with the continuing rise of the RM structure function<br />
at the largest sampled separations, which requiresΛ max<br />
> ∼ 30 arcsec (≃20 kpc). The final synthetic<br />
RM is given by:<br />
∫<br />
RM syn = RM drap + RM icm =<br />
n ′ e B′ z dz+ ∫<br />
n e B z dz (5.6)<br />
where RM drap and RM icm are the RM due to the draped and isotropic fields, respectively. The<br />
terms n ′ e and B ′ z are respectively the density and field component along the line-of-sight in the<br />
draped region. The integration limits of the term RM drap were defined by the surface of the lobe<br />
and the draped region, while that of the term RM icm starts at the surface of the draped region and<br />
extends to 3 times the core ra<strong>di</strong>us of the X-ray gas (Table 5.2). For the electron gas density n e<br />
outside the draped region I assumed the beta-model profile of 0206+35 (Table 5.2) and for the<br />
field strength a ra<strong>di</strong>al variation of the form (Laing et al. 2008, and references therein)<br />
〈B 2 (r)〉 1/2 = B 0<br />
[<br />
ne (r)<br />
n 0<br />
] η<br />
(5.7)<br />
where B 0 is the rms magnetic field strength at the group centre. I took a draped magnetic field<br />
strength of 1.8µG, in order to match the amplitudes for the RM bands in both lobes of 0206+35,<br />
101
102 5. Ordered magnetic fields around ra<strong>di</strong>o galaxies<br />
IMAGE: ELLISSOIDE_COUNTER_40_1.8_ISO.FITS<br />
IMAGE: ELLISSOIDE_MAIN_40_1.8_ISO.FITS<br />
;80 ;60 ;40 ;20 0 20 40 60<br />
RAD/M/M<br />
rad m −2<br />
(a)<br />
;80 ;60 ;40 ;20 0 20 40 60<br />
RAD/M/M<br />
rad m<br />
−2<br />
(b)<br />
x<br />
x<br />
Rece<strong>di</strong>ng<br />
IMAGE: COUNTER_40_2.2_KOLMO.FITS<br />
;50 0 50 100 150<br />
RAD/M/M rad m −2<br />
(c)<br />
Approaching<br />
IMAGE: FMATH.FITS<br />
;100 ;50 0 50<br />
RAD/M/M−2<br />
rad m<br />
(d)<br />
x<br />
x<br />
Rece<strong>di</strong>ng<br />
Approaching<br />
Figure 5.15: Synthetic RM images of the lobes of 0206+35, produced by the sum of a draped<br />
field local to the source and an isotropic, random field spread through the group volume with the<br />
best-fitting power spectrum found in Sec. 5.5 (panels (a) and (b)) and with a Kolmogorov power<br />
spectrum (panels (c) and (d)). Both power spectra have the same high and low-frequency cut offs<br />
and the central magnetic field strengths are also identical. The crosses and the arrows represent<br />
the ra<strong>di</strong>o core position and the lobe advance <strong>di</strong>rection.<br />
and assumed the same value for B 0 .<br />
Example RM images, shown in Figs. 5.15(a) and (b), should be compared with those for the<br />
draped field alone (Figs. 5.13b and c, scaled up by a factor of 1.8 to account for the <strong>di</strong>fference<br />
in field strength) and with the observations (Fig.5.2a) after correction for Galactic foreground<br />
(Table 5.4). The model is self-consistent: the flat power spectrum found for 0206+35 does not<br />
give coherent RM structure which could interfere with the RM bands, which are still visible.<br />
I then replaced the isotropic component with one having a Kolmogorov power spectrum<br />
(q=11/3). I assumed identical minimum and maximum scales (2 and 40 kpc) as for the previous<br />
power spectrum and took the same central field strength (B 0 =1.8µG) and ra<strong>di</strong>al variation (Eq. 5.7).<br />
Example realizations are shown in Fig. 5.15(c) and (d). The bands are essentially invisible in the<br />
presence of foreground RM fluctuations with a steep power spectrum out to scales larger than their<br />
widths.<br />
It may therefore be that the RM bands in the sources here presented are especially prominent<br />
because the power spectra for the isotropic RM fluctuations have unusually low amplitudes and<br />
102
5.8. Discussion 103<br />
flat slopes. I have established these parameters <strong>di</strong>rectly for 0206+35, 3C 270 and 3C 353; M 84 is<br />
only 14 kpc in size and is located far from the core of the Virgo cluster, so it is plausible that the<br />
cluster contribution to its RM is small and constant.<br />
I conclude that the detection of RM bands could be influenced by the relative amplitude and<br />
scale of the fluctuations of the isotropic and random RM component compared with that from any<br />
draped field, and that significant numbers of banded RM structures could be masked by isotropic<br />
components with steep power spectra.<br />
5.8.4 Asymmetries in RM bands<br />
The well-established correlation between RM variance and/or depolarization and jet sidedness<br />
observed in FR I and FR II ra<strong>di</strong>o sources is interpreted as an orientation effect: the lobe containing<br />
the brighter jet is on the near side, and is seen through less magneto-ionic material (e.g. Laing<br />
1988; Morganti et al. 1997). For sources showing RM bands, it is interesting to ask whether the<br />
asymmetry is due to the bands or just to the isotropic component.<br />
In 0206+35, whose jets are inclined by≈40 ◦ to the line-of-sight, the large negative band on<br />
the rece<strong>di</strong>ng side has the highest RM (Fig. 5.5). This might suggest that the RM asymmetry is due<br />
to the bands, and therefore to the local draped field. Unfortunately, 0206+35 is the only source<br />
<strong>di</strong>splaying this kind of asymmetry. The other “inclined” source, M 84, (θ≈ 60 ◦ ) does not show<br />
such asymmetry: on the contrary the RM amplitude is quite symmetrical. In this case, however,<br />
the relation between the (well-constrained) inclination of the inner jets, and that of the lobes could<br />
be complicated: both jets bend by≈90 ◦ at <strong>di</strong>stances of about 50 arcsec from the nucleus (Laing et<br />
al. in preparation), so that we cannot establish the real orientation of the lobes with respect to the<br />
plane of the sky. The low values of the jet/counter-jet ratios in 3C 270 and 3C 353 suggest that their<br />
axes are close to the plane of the sky, so that little orientation-dependent RM asymmetry would be<br />
expected. Indeed, the lobes of 3C 270 show similar RM amplitudes, while the large asymmetry of<br />
RM profile of 3C 353 is almost certainly due to a higher column density of thermal gas in front<br />
of the eastern lobe. Within this small sample, there is therefore no convincing evidence for higher<br />
RM amplitudes in the bands on the rece<strong>di</strong>ng side, but neither can such an effect be ruled out.<br />
In models in which an ordered field is draped around the ra<strong>di</strong>o lobes, the magnitude of any<br />
RM asymmetry depends on the field geometry as well as the path length (cf. Laing et al. 2008<br />
for the isotropic case). For instance, the case illustrated in Figs 5.13(b) and (c) shows very<br />
little asymmetry even forθ= 40 ◦ . The presence of a systematic asymmetry in the banded RM<br />
component could therefore be used to constrain the geometry.<br />
103
104 5. Ordered magnetic fields around ra<strong>di</strong>o galaxies<br />
5.8.5 Enhanced depolarization and mixing layers<br />
A <strong>di</strong>fferent mechanism for the generation of RM fluctuations was suggested by Bicknell, Cameron<br />
& Gingold (1990). They argued that large-scale nonlinear surface waves could form on the surface<br />
of a ra<strong>di</strong>o lobe through the merging of smaller waves generated by Kelvin-Helmholtz instabilities<br />
and showed that RM’s of roughly the observed magnitude would be produced if a uniform field<br />
inside the lobe was advected into the mixing layer. This mechanism is unlikely to be able to<br />
generate large-scale bands, however: the pre<strong>di</strong>cted iso-RM contours are only straight over parts<br />
of the lobe which are locally flat, even in the unlikely eventuality that a coherent surface wave<br />
extends around the entire lobe.<br />
The idea that a mixing layer generates high Faraday rotation may instead be relevant to the<br />
anomalously high depolarizations associated with regions of compressed gas around the inner<br />
ra<strong>di</strong>o lobes of M 84 and 3C 270 (Section 5.4 and Fig. 5.6). The fields responsible for the<br />
depolarization must be tangled on small scales, since they produce depolarization without any<br />
obvious effects on the large-scale Faraday rotation pattern. It is unclear whether the level of<br />
turbulence within the shells of compressed gas is sufficient to amplify and tangle a pre-existing<br />
field in the IGM to the level that it can produce the observed depolarization; a plausible alternative<br />
is that the field originates within the ra<strong>di</strong>o lobe and mixes with the surroun<strong>di</strong>ng thermal gas.<br />
5.9 Conclusions and outstan<strong>di</strong>ng questions<br />
In this work I have analysed and interpreted the Faraday rotation across the lobed ra<strong>di</strong>o galaxies<br />
0206+35, 3C 270, 3C 353 and M 84, located in environments ranging from a poor group to one<br />
of the richest clusters of galaxies (the Virgo cluster). The RM images have been produced<br />
at resolutions ranging from 1.2 to 5.5 arcsec FWHM using Very Large Array data at multiple<br />
frequencies. All of the RM images show peculiar banded patterns across the ra<strong>di</strong>o lobes, implying<br />
that the magnetic fields responsible for the Faraday rotation are anisotropic. The RM bands<br />
coexist and contrast with areas of patchy and random fluctuations, whose power spectra have<br />
been estimated using a structure-function technique. I have also analysed the variation of degree<br />
of polarization with wavelength and compared this with the pre<strong>di</strong>ctions for the best-fitting RM<br />
power spectra in order to constrain the minimum scale of magnetic turbulence. I have investigated<br />
the origin of the bands by making synthetic RM images using simple models of the interaction<br />
between ra<strong>di</strong>o galaxies and the surroun<strong>di</strong>ng me<strong>di</strong>um and have estimated the geometry and strength<br />
of the magnetic field.<br />
The results of this work can be summarized as follows.<br />
104
5.9. Conclusions and outstan<strong>di</strong>ng questions 105<br />
1. The lack of deviation fromλ 2 rotation over a wide range of polarization position angle and<br />
the lack of associated depolarization together suggest that a foreground Faraday screen with<br />
no mixing of ra<strong>di</strong>o-emitting and thermal electrons is responsible for the observed RM in the<br />
bands and elsewhere (Section 5.3).<br />
2. The dependence of the degree of polarization on wavelength is well fitted by a Burn law,<br />
which is also consistent with (mostly resolved) pure foreground rotation (Section 5.4).<br />
3. The RM bands are typically 3 – 10 kpc wide and have amplitudes of 10 – 50 rad m −2<br />
(Table 5.4). The maximum deviations of RM from the Galactic values are observed at the<br />
position of the bands. Iso-RM contours are orthogonal to the axes of the lobes. In several<br />
cases, neighbouring bands have opposite signs compared with the Galactic value and the<br />
line-of-sight field component must therefore reverse between them.<br />
4. An analysis of the profiles of〈RM〉 and depolarization along the source axes suggests that<br />
there is very little small-scale RM structure within the bands.<br />
5. The lobes against which bands are seen have unusually small axial ratios (i.e. they appear<br />
round in projection; Fig. 5.2). In one source (3C 353) the two lobes <strong>di</strong>ffer significantly in<br />
axial ratio, and only the rounder one shows RM bands. This lobe is on the side of the source<br />
for which the external gas density is higher.<br />
6. Structure function and depolarization analyses show that flat power-law power spectra with<br />
low amplitudes and high-frequency cut-offs are characteristic of the areas which show<br />
isotropic and random RM fluctuations, but no bands (Section 5.5).<br />
7. There is evidence for source-environment interactions, such as large-scale asymmetry<br />
(3C 353) cavities and shells of swept-up and compressed material (M 84, 3C 270) in all<br />
three sources for which high-resolution X-ray imaging is available.<br />
8. Areas of strong depolarization are found around the edges of the ra<strong>di</strong>o lobes close to the<br />
nuclei of 3C 270 and M 84. These are probably associated with shells of compressed hot<br />
gas. The absence of large-scale changes in Faraday rotation in these features suggests that<br />
the field must be tangled on small scales (Section 5.4).<br />
9. The comparison of the amplitude of〈RM〉 with that of the structure functions at the largest<br />
sampled separations is consistent with an amplification of the large scale magnetic field<br />
component at the position of the bands.<br />
10. I produced synthetic RM images from ra<strong>di</strong>o lobes expan<strong>di</strong>ng into an ambient me<strong>di</strong>um<br />
containing thermal material and magnetic field, first considering a pure compression of<br />
105
106 5. Ordered magnetic fields around ra<strong>di</strong>o galaxies<br />
both thermal density and field, and then inclu<strong>di</strong>ng three- and two-<strong>di</strong>mensional stretching<br />
(“draping”) of the field lines along the <strong>di</strong>rection of the ra<strong>di</strong>o jets (Sects. 5.6 and 5.7). Both<br />
of the mechanisms are able to generate anisotropic RM structure.<br />
11. To reproduce the straightness of the iso-RM contours, a two-<strong>di</strong>mensional field structure<br />
is needed. In particular, a two-<strong>di</strong>mensional draped field, whose lines are geometrically<br />
described by a family of ellipses, and associated with compression, reproduces the RM<br />
bands routinely for any inclination of the sources to the line-of-sight (Sec. 5.7.3). Moreover,<br />
it might explain the high RM amplitude and low depolarization observed within the bands.<br />
12. The invariance of the magnetic field along the axis perpen<strong>di</strong>cular to the forward expansion<br />
of the lobe suggests that the physical process responsible for the draping and stretching of<br />
the magnetic field must act on scales larger than the lobe itself in this <strong>di</strong>rection. It is not<br />
possible to constrain yet the scale size along the line-of-sight.<br />
13. In order to create RM bands with multiple reversals, more complex field geometries such as<br />
two-<strong>di</strong>mensional ed<strong>di</strong>es are needed (Section 5.7.4).<br />
14. I have interpreted the observed RM’s as due to two magnetic field components: one draped<br />
around the ra<strong>di</strong>o lobes to produce the RM bands, the other turbulent, spread throughout<br />
the surroun<strong>di</strong>ng me<strong>di</strong>um, unaffected by the ra<strong>di</strong>o source and responsible for the isotropic<br />
and random RM fluctuations (Section 5.8.3). I tested this model for 0206+35, assuming<br />
a typical variation of field strength with ra<strong>di</strong>us in the group atmosphere, and found that a<br />
magnetic field with central strength of B 0 = 1.8µG reproduced the RM range quite well in<br />
both lobes.<br />
15. I have suggested two reasons for the low rate of detection of bands in published RM images:<br />
our line of sight will only intercept a draped field structure in a minority of cases and rotation<br />
by a foreground turbulent field with significant power on large scales may mask any banded<br />
RM structure.<br />
These results therefore suggest a more complex picture of the magneto-ionic environments<br />
of ra<strong>di</strong>o galaxies than was apparent from earlier work. I find three <strong>di</strong>stinct types of magneticfield<br />
structure: an isotropic component with large-scale fluctuations, plausibly associated with the<br />
un<strong>di</strong>sturbed intergalactic me<strong>di</strong>um; a well-ordered field draped around the lea<strong>di</strong>ng edges of the<br />
ra<strong>di</strong>o lobes and a field with small-scale fluctuations in the shells of compressed gas surroun<strong>di</strong>ng<br />
the inner lobes, perhaps associated with a mixing layer. In ad<strong>di</strong>tion, I have emphasised that simple<br />
compression by the bow shock should lead to enhanced RM’s around the lea<strong>di</strong>ng edges, but that<br />
the observed patterns depend on the pre-shock field.<br />
106
5.9. Conclusions and outstan<strong>di</strong>ng questions 107<br />
MHD simulations should be able to address the formation of anisotropic magnetic-field<br />
structures around ra<strong>di</strong>o lobes and to constrain the initial con<strong>di</strong>tions.<br />
107
108 5. Ordered magnetic fields around ra<strong>di</strong>o galaxies<br />
108
Chapter 6<br />
Faraday rotation in two extreme<br />
environments ‡<br />
In this Chapter I will present polarization analyses of two ra<strong>di</strong>o galaxies embedded in very<br />
<strong>di</strong>fferent environments. The sources are: B2 0755+37, located in a very sparse group, and<br />
M 87, located at the centre of the cool core Virgo cluster. I will described the results of two<strong>di</strong>mensional<br />
analyses of the RM and depolarization <strong>di</strong>stributions. In both sources, the geometry<br />
of the surroun<strong>di</strong>ng X-ray emitting gas appears to be complex than for the sources stu<strong>di</strong>ed in<br />
Chapters 4 and 5, so a three-<strong>di</strong>mensional analysis will be deferred to a later study.<br />
6.1 The sources<br />
The general parameters of the sources are listed in Table 6.1, while Table 6.2 shows the X-ray<br />
parameters taken from the literature and the equipartition parameters derived from ra<strong>di</strong>o data in<br />
this work. I refer to parts of the sources by the abbreviations N, S, E, W (for North, South, East,<br />
West).<br />
6.1.1 B2 0755+37<br />
B2 0755+37 (hereafter 0755+37) is an extended FR I ra<strong>di</strong>o source whose optical counterpart,<br />
NGC 2484, is a D-galaxy, classified as central member of a nearby and very poor group of galaxies<br />
(Mulchaey et al. 2003). The source is one of the most isolated ra<strong>di</strong>o galaxies in the B2 catalogue.<br />
Here I briefly summarize the ra<strong>di</strong>o properties of 0755+37, which are described in detail in the<br />
Appen<strong>di</strong>x of this thesis along with a description of the VLA observations. At a resolution of<br />
‡ Guidetti et al. in prep<br />
109
110 6. Faraday rotation in two extreme environments<br />
1.3 arcsec the source shows a very bright core and two-sided jets embedded in an <strong>di</strong>ffuse halo of<br />
low surface brightness. The jet E of the nucleus is the brighter one and the jets inclination to the<br />
line-of-sight is estimated to be about 30 ◦ (Bon<strong>di</strong> et al. 2000; Laing & Bridle in preparation) The<br />
ra<strong>di</strong>o source is highly polarized.<br />
0755+35 has been observed with both the PSPC and HRI instruments on ROSAT (Worrall &<br />
Birkinshaw 1994, 2000) and with Chandra (Worrall, Birkinshaw & Hardcastle 2001).<br />
The X-ray emission has extended thermal and partially resolved non-thermal components,<br />
respectively associated with the hot me<strong>di</strong>um on group and galactic scales, and with the core<br />
and jets (Canosa et al. 1999; Worrall & Birkinshaw 2000; Mulchaey et al. 2003; Wu, Feng &<br />
Xinwu 2007). However, the X-ray surface brightness profile (the sum of aβmodel and a point<br />
component) is very poorly constrained. The extent of the thermal X-ray emission is relatively<br />
small with respect to other poor groups, particularly along the EW axis of the large-scale source<br />
structure, and its luminosity is low (Worrall & Birkinshaw 2000). These arguments together with<br />
the “isolation” of 0755+37 suggest that the <strong>di</strong>ffuse emission, at least on the scale of the ra<strong>di</strong>o<br />
emission, is mainly due to the hot atmosphere surroun<strong>di</strong>ng the galaxy.<br />
6.1.2 M 87<br />
M 87 is one of the most famous ra<strong>di</strong>o galaxies and resides in the gas-rich Virgo cluster, which is the<br />
nearest, bright X-ray emitting cluster. This source provides the opportunity to study the magnetic<br />
field fluctuations with excellent spatial resolution. It is a popular target of multiwavelength stu<strong>di</strong>es,<br />
because of its one-sided jet observed at ra<strong>di</strong>o (e.g. Owen 1989 (VLA); Kovalev 2007 (VLBA),<br />
optical Biretta, Sparks & Macchetto 1999) and X-ray frequencies (e.g. Forman et al. 2005, 2007;<br />
Harris et al. 2006; Churazov 2008). The morphology of the jet is similar at all these wavelengths,<br />
suggesting a common synchrotron ra<strong>di</strong>ation mechanism.<br />
M 87 is classified as an FR I source. On scales larger than the ra<strong>di</strong>o jet (∼2 kpc), it has a<br />
complex ra<strong>di</strong>o structure mapped out to linear scales of about 40 kpc, showing inner and outer<br />
lobes, curved “ears”, and filaments (Fig. 6.2, Owen, Eilek & Kassim 2000). The jet inclination is<br />
estimated to be about 22 ◦ (Biretta, Zhou & Owen 1995).<br />
In this work, I used VLA datasets at 5 and 8 GHz (6 cm and 3 cm respectively), which were<br />
generously provided by F. N.Owen. The VLA observations in the 6 cm band and their reduction<br />
were presented by Owen, Eilek & Keel (1990) while the 3 cm data have not been published. At<br />
these frequencies and at 0.4 arcsec resolution the source is highly polarized. The images show the<br />
main jet, pointing to NW, and two “inner lobes” exten<strong>di</strong>ng about 4 kpc from the core (Owen, Eilek<br />
& Keel 1990).<br />
110
6.2. Two-<strong>di</strong>mensional analysis: rotation measure and depolarization 111<br />
Table 6.1: General optical and ra<strong>di</strong>o properties: Col. 1: source name; Cols. 2, 3: position; Col.<br />
4: redshift; Col. 5: conversion from angular to spatial scale with the adopted cosmology; Col. 6:<br />
Fanaroff-Riley class; Col. 7: the largest angular size of the ra<strong>di</strong>o source; Col. 8: ra<strong>di</strong>o power at<br />
1.4 GHz; Col. 9: angle to the line of sight of the jet axis.<br />
source RA DEC z kpc/arcsec FR class LAS θ<br />
[J2000] [J2000] [arcsec] [degree]<br />
0755+37 07 58 28.1 +37 47 12 0.0428 0.833 I 139 30<br />
M 87 12 30 49.4 +12 23 28 0.00436 0.089 I 489 22<br />
Table 6.2: X-ray and ra<strong>di</strong>o equipartition parameters for all the sources. Col. 1: source name; Col.<br />
2: X-ray energy band; Col. 3: average thermal temperature; Cols. 4,5,6 and 7,8,9 best-fitting core<br />
ra<strong>di</strong>i, central densities andβparameters for the outer and innerβmodels, respectively; Col. 10:<br />
average thermal pressure at the midpoint of the ra<strong>di</strong>o lobes; Cols. 11&12: minimum synchrotron<br />
pressure and correspon<strong>di</strong>ng magnetic field; Col.13: references for the X-ray models.<br />
source band kT r cxout n 0out β out r cxin n 0in β in P 0 P syn B Psyn ref.<br />
[keV] [keV] [kpc] [cm −3 ] [kpc] [cm −3 ] [dyne cm −2 ] [dyne cm −2 ] [µG]<br />
0755+37 0.2-2.5 0.73 +0.32<br />
−0.45<br />
159 6.4×10 −4 0.9 1.7×10 −12 3.14×10 −13 4.4 1<br />
M 87 0.7-2.7 1.68 0.04<br />
−0.05 23.4 0.011 0.47 1.86 0.13 0.42 2.7×10⁻¹⁰ 2.11×10 −10 55 2<br />
References: (1) Worrall & Birkinshaw (2000); (2) Matsushita et al. (2002).<br />
Fields in the Virgo cluster centred on M 87 have been observed by several X-ray satellites.<br />
The extent of the X-ray emission is larger than 2 ◦ , which is the field of view of the ROSAT PSPC,<br />
and is centrally peaked, implying that M 87 harbours a cool core.<br />
At the ROSAT and XMM-Newton resolutions, the morphology of the X-ray emission appears<br />
regular and smooth, but deep Chandra observations (e.g. Forman et al. 2007 and references therein)<br />
have revealed a very complex structure suggesting interaction between the ra<strong>di</strong>o source and the<br />
hot gas on several spatial scales (Fig. 6.3). In particular, Forman et al. (2007) detected multiple<br />
cavities, some of which coincide with the inner ra<strong>di</strong>o lobes, rims of enhanced X-ray emission,<br />
loops, rings, and filaments. The cavities resemble the outer large-scale ra<strong>di</strong>o structure and have<br />
been interpreted as a system of buoyant bubbles produced in AGN outbursts. At <strong>di</strong>stances of about<br />
10-20 kpc from the core, temperature and density jumps are apparent. These correspond to weak<br />
shocks with Mach numbersM≈1.4.<br />
6.2 Two-<strong>di</strong>mensional analysis: rotation measure and depolarization<br />
I produced RM images and related rms errors by weighted least-squares fitting to the polarization<br />
angle mapsΨ(λ) as a function ofλ 2 (Eq. 3.1) at respectively three and eight frequencies for<br />
0755+37 and M 87 (Table 6.3) by using a version of the RM task in the AIPS package mo<strong>di</strong>fied<br />
111
112 6. Faraday rotation in two extreme environments<br />
IMAGE: 07_PSPC_CONVL_AS_1.3_OGEOM.FITS<br />
CNTRS: 07_1.3_I_4.FITS<br />
0 0.0002 0.0004 0.0006 0.0008<br />
37 49 00<br />
50 kpc<br />
DECLINATION (J2000)<br />
37 48 00<br />
37 47 00<br />
37 46 00<br />
37 45 00<br />
07 58 40<br />
07 58 30<br />
RIGHT ASCENSION (J2000)<br />
07 58 20<br />
Figure 6.1: Overlay of the X-ray emission (ROSAT PSPC) around 0755+37 on ra<strong>di</strong>o contours at<br />
1.385 GHz at 4.0 arcsec resolution.<br />
Table 6.3: Frequencies, bandwidths and angular resolutions used in the RM and Burn law k<br />
images. Details of the 0755+37 dataset are given in the Appen<strong>di</strong>x.<br />
source ν ∆ν beam<br />
[MHz] [MHz] [arcsec]<br />
0755+37 1385.1 12.5 1.3-4.0<br />
1464.9<br />
4860.1 100<br />
M 87 4635.1 50 0.4<br />
4735.0<br />
4835.1<br />
4935.0<br />
8085.1<br />
8335.1<br />
8535.1<br />
8785.1<br />
by G.B. Taylor. The RM maps were calculated only at pixels with polarization angle uncertainties<br />
≤10 ◦ at all frequencies. The RM maps have not been corrected for the Galactic contribution. For<br />
0755+37, this is estimated to be negligible (-1±2 rad m −2 ; Simard-Norman<strong>di</strong>n et al. 1981). For<br />
M 87, the value is less well-determined, but the source is at very high Galactic latitude, and the<br />
associated RM must be very small compared with the measured values (see below). Values of<br />
σ RM integrated over the maps are not corrected for the fitting errorσ RMfit ,<br />
I produced Burn law k images at the same resolutions and using the same frequencies as the<br />
RM maps. Weighted least-squares fits were made to the fractional polarization maps ln p(λ) as a<br />
112
6.2. Two-<strong>di</strong>mensional analysis: rotation measure and depolarization 113<br />
Figure 6.2: Composite ra<strong>di</strong>o image of M87 showing the complex structure on multiple spatial<br />
scales and at several frequencies. In the present work, the RM from the central cone-like structure,<br />
shown in more detail in the top-left panel, has been analysed. Image courtesy of NRAO/AUI.<br />
ROSAT XMM−Newton Chandra<br />
Figure 6.3: X-ray images of the centre of the Virgo cluster showing <strong>di</strong>fferent scales: ROSAT<br />
(left) XMM-Newton (middle) Chandra (right). The increasing resolution has shown a complex<br />
structure in the hot gas. Courtesy of W. Forman.<br />
function ofλ 4 (Eq. 3.5), using a mo<strong>di</strong>fied version of AIPS RM task. Only data with p>4σ p at<br />
each frequency were included in the fits.<br />
6.2.1 0755+37: images<br />
Two RM images have been produced, at resolutions of 1.3 and 4.0 arcsec. Both of the fits are very<br />
good, showing no evidence for deviations fromλ 2 rotation, although the total range of rotation is<br />
quite small. The RM maps are both shown in Fig. 6.4.<br />
113
114 6. Faraday rotation in two extreme environments<br />
At 4.0 arcsec the RM <strong>di</strong>stribution has a mean of−5.4 rad m −2 withσ RM =5.1 rad m −2 and<br />
an average fitting errorσ RMfit<br />
σ RM =6.0 rad m −2 andσ RMfit = 2.0 rad m −2 .<br />
= 0.8 rad m −2 . At 1.3 arcsec the mean RM is−0.1 rad m −2 with<br />
The small amplitude of the RM fluctuations is consistent with an origin in the IGM of the<br />
isolated host galaxy, rather than the atmosphere of a more extended group.<br />
There is a clear asymmetry in RM structure between the E and W lobes at both resolutions.<br />
Firstly, most of the E (approaching) lobe is characterized by a fairly uniform, positive RM, and<br />
the largest RM fluctuations, of both signs, are seen in the W (rece<strong>di</strong>ng) lobe. Secondly, both lobes<br />
show anisotropic features, but with <strong>di</strong>fferent characteristics. In the E lobe there is a thin, straight<br />
structure elongated parallel to the source axis with almost zero〈RM〉 . This “stripe” is very striking<br />
on the 1.3 arcsec map and appears to be almost coincident with the main jet axis, exten<strong>di</strong>ng beyond<br />
the apparent termination of the jet as far as the boundary of the lobe. It is probably the clearest<br />
known example of kpc-scale, jet-related RM structure. It can be interpreted in at least two possible<br />
ways:<br />
1. the jet is mostly in front of the Faraday screen. This might happen if the jet has <strong>di</strong>splaced a<br />
relatively large amount of hot gas or if it is ben<strong>di</strong>ng along the line-of-sight.<br />
2. The jet lies behind a Faraday screen with an intrinsically low RM along the stripe, i.e., the<br />
magnetic field is feeble and/or preferentially aligned in the plane of the sky on the projected<br />
jet axis.<br />
The latter point requires that the Faraday screen somehow knows about the jet.<br />
The 4.0-arcsec RM map reveals arc-like features at the lea<strong>di</strong>ng edge of the W lobe. These have<br />
alternating signs and must therefore be associated with field reversals. They are confirmed by the<br />
higher resolution map, where the iso-RM contours appear to be fairly straight and perpen<strong>di</strong>cular<br />
to the jet axis. The resemblance to the RM bands <strong>di</strong>scussed in Chapter 5 is obvious. It is possible<br />
that these features are also caused by draping of the magnetic field around the lea<strong>di</strong>ng edge of the<br />
lobe.<br />
The Burn law k maps are shown in Fig. 6.5. At 4.0 arcsec resolution, the mean value of k is<br />
106 rad 2 m −4 , correspon<strong>di</strong>ng to a depolarization DP 21cm<br />
6cm<br />
= 0.79. The mean observed k values for<br />
sub-regions of 0755+37 at both the angular resolutions are listed in Table 6.4. From this table, but<br />
also by visual inspection of Fig. 6.5 (left), it is evident that at 4.0 arcsec the highest depolarization<br />
is observed in the W (rece<strong>di</strong>ng) lobe. This is consistent with a higher path length through the X-ray<br />
emitting gas (Laing-Garrington effect; Laing 1988; Garrington et al. 1988). In contrast, the Burn<br />
law k <strong>di</strong>stribution at 1.3 arcsec is very symmetrical and has a much lower overall mean, implying<br />
that the RM fluctuations are mostly resolved, consistent with a foreground screen.<br />
114
6.2. Two-<strong>di</strong>mensional analysis: rotation measure and depolarization 115<br />
IMAGE: 0755.RM.4.0_BLANK.FITS<br />
DECLINATION (J2000)<br />
37 48 00<br />
37 47 30<br />
37 47 00<br />
37 46 30<br />
;20 ;10 0 10 20<br />
RAD/M/M<br />
07 58 36<br />
07 58 32 07 58 28 07 58 24<br />
RIGHT ASCENSION (J2000)<br />
10 kpc<br />
DECLINATION (J2000)<br />
37 48 00<br />
37 47 30<br />
37 47 00<br />
37 46 30<br />
IMAGE: 0755.RM.1.3_BLANK.FITS<br />
;20 ;10 0 10 20<br />
RAD/M/M<br />
07 58 36<br />
07 58 32 07 58 28 07 58 24<br />
RIGHT ASCENSION (J2000)<br />
10 kpc<br />
07 58 20<br />
Figure 6.4: Images of the rotation measure for 0755+37, computed from weighted least-squares<br />
fits to the position angle –λ 2 relation at frequencies of 1385.1, 1469.1 and 4860.1 MHz. The<br />
angular resolutions are 4.0 arcsec FWHM (left) and 1.3 arcsec FWHM (right).<br />
IMAGE: 0755_K;BURN_4ARCSEC_4SIGMAP.FITS<br />
0 100 200 300 400<br />
rad^2/m^4<br />
IMAGE: 0755_K;BURN_1.3ARCSEC.FITS<br />
0 100 200 300 400<br />
rad^2/m^4<br />
37 48 00<br />
37 48 00<br />
DECLINATION (J2000)<br />
37 47 30<br />
37 47 00<br />
37 46 30<br />
DECLINATION (J2000)<br />
37 47 30<br />
37 47 00<br />
37 46 30<br />
07 58 36<br />
07 58 32 07 58 28 07 58 24<br />
RIGHT ASCENSION (J2000)<br />
07 58 36<br />
07 58 32 07 58 28 07 58 24<br />
RIGHT ASCENSION (J2000)<br />
07 58 20<br />
Figure 6.5: Images of Burn law k for 0755+37 computed from weighted least-squares fits to the<br />
relation p(λ)= p(0)exp(−kλ 4 ) at frequencies of 1385.1, 1469.1 and 4860.1 MHz. The angular<br />
resolutions are 4.0 arcsec FWHM (left) and 1.3 arcsec FWHM (right).<br />
This scenario is confirmed by the profiles of〈k〉 across the source (Fig. 6.6): at lower resolution<br />
the profile is asymmetrical, with less depolarization at a given <strong>di</strong>stance from the core in the E lobe<br />
and a peak which is <strong>di</strong>splaced slightly W of the nucleus. In contrast, the〈k〉 profile at 1.3 arcsec<br />
resolution is symmetrical and lies significantly below that at 4.0 arcsec.<br />
The high k values in the W lobe at the lower resolution are mostly seen in a cone-like structure<br />
(Fig. 6.5 left), as was already pointed out by Bon<strong>di</strong> et al. (2000). It is possible that the origin of<br />
such structure may be gas and field compression or the development of a mixing layer as <strong>di</strong>scussed<br />
for M 84 and 3C 270 (Sec. 5.8.5). To confirm this picture, higher resolution X-ray observations are<br />
needed. In contrast, a region with very low and almost constant depolarization is observed at the<br />
lea<strong>di</strong>ng edge of the W lobe, beyond the end of the approaching jet.<br />
115
116 6. Faraday rotation in two extreme environments<br />
0755+37<br />
Figure 6.6: Profiles of Burn law k for 0755+37 parallel to the jet <strong>di</strong>rection, plotted against <strong>di</strong>stance<br />
from the nucleus. The angular resolutions are 4.0 (left) and 1.3 arcsec FWHM (right).<br />
Apart from the cone-like structure in the E lobe no correlation of depolarization with source<br />
morphology is apparent. Together with the absence of significant deviations fromλ 2 rotation, this<br />
is again consistent with a Faraday rotating me<strong>di</strong>um mostly external to the source.<br />
6.2.2 M 87: images<br />
I made the RM image of M 87 at a resolution of 0.4 arcsec. TheRM task <strong>di</strong>d not solve correctly for<br />
the nπ ambiguities in position angle at some locations. In order to remove these ambiguities, the<br />
RM map was produced using the following steps:<br />
1. Fit to the four frequencies in the 3 cm band using the Greg Taylor version of theRM program<br />
inAIPS. This produced a noisy, but smooth RM image.<br />
2. RunMWFLT inAIPS on this RM image, to apply a me<strong>di</strong>an-weight filter with a 15-pixel<br />
(1.5 arcsec) smoothing kernel.<br />
3. Correct all of the polarization angle maps (in the 6 and 3 cm bands) using the filtered RM<br />
image.<br />
4. Run a mo<strong>di</strong>fied version ofRM task which minimises the absolute <strong>di</strong>fferences between<br />
the polarization angle maps at adjacent frequencies (i.e. assumes that there are no nπ<br />
ambiguities).<br />
5. Add the result back to the filtered RM image.<br />
The resulting RM map essentially confirms the results of the 4-frequency, C-band fit made by<br />
Owen, Eilek & Keel (1990), but is significant improved both in noise level and overall reliability.<br />
116
6.2. Two-<strong>di</strong>mensional analysis: rotation measure and depolarization 117<br />
IMAGE: M87.RMRAL_BLANK.FITS<br />
DECLINATION (J2000)<br />
12 23 45<br />
12 23 30<br />
12 23 15<br />
12 23 00<br />
;2000 0 2000 4000 6000<br />
RAD/M/M<br />
1 kpc<br />
12 22 45<br />
12 30 52<br />
12 30 51<br />
12 30 50 12 30 49 12 30 48<br />
RIGHT ASCENSION (J2000)<br />
12 30 47<br />
Figure 6.7: Rotation measure of M 87 computed from fits to the position angle –λ 2 rotation at<br />
eight frequencies as described in the text. The angular resolution is 0.4 arcsec FWHM.<br />
The new map, shown in Fig. 6.7, has an average fitting errorσ RMfit = 15 rad m −2 . The RM<br />
<strong>di</strong>stribution has a mean of roughly 650 rad m −2 withσ RM ≈900 rad m −2 .<br />
The main features of the RM image are as follows.<br />
• The RM values are large and almost always positive, requiring a magnetic field pointing<br />
towards us across most of the source. They range from≈−2000 up to≈6000 rad m −2 . This<br />
compares with the much larger range of−1000-8000 rad m −2 found by Owen, Eilek & Keel<br />
(1990). The most extreme positive values found by are Owen, Eilek & Keel (1990) not<br />
consistent with the X-band position angles.<br />
• The highest RM values (≈3500-6000 rad m −2 ) are seen only in a restricted patch in the E<br />
lobe.<br />
• The jet appears as a uniform RM structure characterized by low values (≈100 rad m −2 ), as<br />
already pointed out by Owen, Eilek & Keel (1990).<br />
• The RM <strong>di</strong>stribution is asymmetrical: positive and smoothly varying in the W lobe, patchier<br />
and associate with field reversals in the E lobe.<br />
As in 0755+37, the low RM seen across the jet is surprising. Similar explanations may hold<br />
for the two sources.<br />
117
118 6. Faraday rotation in two extreme environments<br />
0 20000 40000 60000<br />
12 24 00<br />
12 23 40<br />
DECLINATION (J2000)<br />
12 23 20<br />
12 23 00<br />
12 22 40<br />
12 30 51<br />
12 30 50<br />
12 30 49<br />
12 30 48<br />
12 30 47<br />
RIGHT ASCENSION (J2000)<br />
Figure 6.8: Left: Image of Burn law k for M 87 computed from weighted least-squares fits to the<br />
relation p(λ)= p(0)exp(−kλ 4 ) at the eight frequencies listed in Table 6.3. Right: Profiles of Burn<br />
law k along the jet <strong>di</strong>rection, plotted against <strong>di</strong>stance from the nucleus. The angular resolution is<br />
0.4 arcsec FWHM.<br />
The Burn law k map for M 87 is shown in Fig. 6.8. At 0.4 arcsec resolution the overall k<br />
<strong>di</strong>stribution has a mean of 9820 rad 2 m −4 , correspon<strong>di</strong>ng to a depolarization DP 6cm<br />
3cm<br />
= 0.85. The<br />
mean observed k values for the two lobes are listed in Table 6.4. The highest depolarization occurs<br />
in patchy structures in the E (rece<strong>di</strong>ng) lobe, consistent with the Laing-Garrington effect (Laing<br />
1988; Garrington et al. 1988). These structures appear filamentary and are likely to be caused by<br />
steep (and therefore unresolved) RM gra<strong>di</strong>ents. Indeed, they are in the same areas as the highest<br />
absolute values of RM and∇RM (Fig. 6.7).<br />
In ad<strong>di</strong>tion to low and constant RM, the jet also shows uniformly low k.<br />
The profile of<br />
〈k〉 across the source (Fig. 6.8, right) is qualitatively similar to that observed in 0755+37, but<br />
more extreme: it increases monotonically from W to E across the core, peaks in the E lobe<br />
and then decreases at larger <strong>di</strong>stances. Except in the region of the jet, no detailed correlation<br />
of depolarization with source morphology is apparent. Together with the absence of significant<br />
deviations fromλ 2 rotation, this again requires a Faraday rotating me<strong>di</strong>um mostly external to the<br />
source.<br />
6.3 Two-<strong>di</strong>mensional analysis: structure functions<br />
I used the RM structure function (Eq. 3.13) to quantify the two-<strong>di</strong>mensional fluctuations of Faraday<br />
rotation measure on scales larger than the observing beamwidth for 0755+37 and M 87.<br />
118
6.3. Two-<strong>di</strong>mensional analysis: structure functions 119<br />
0755+37<br />
Figure 6.9: RM structure functions for the sub-regions of 0755+37 in<strong>di</strong>cated in the panels at 4.0<br />
and 1.3 arcsec FWHM. The horizontal bars represent the bin widths and the crosses the mean<br />
separation for data included in the bins. The red curves are the best fits, inclu<strong>di</strong>ng the effects of<br />
the convolving beam. The error bars represent the rms variations for structure functions derived<br />
from multiple realizations of the in<strong>di</strong>cated power spectrum on the observed grid.<br />
119
120 6. Faraday rotation in two extreme environments<br />
Figure 6.10: RM structure functions for the sub-regions of M 87 in<strong>di</strong>cated in the panels at<br />
0.4 arcsec FWHM. The horizontal bars represent the bin widths and the crosses the mean<br />
separation for data included in the bins. The red curves are the best fits inclu<strong>di</strong>ng the effects<br />
of the convolving beam. The error bars represent the rms variations for structure functions derived<br />
for multiple realizations of the in<strong>di</strong>cated cut-off power-law power spectra on the observed grid for<br />
each region.<br />
Structure functions have been computed at the resolutions of the RM images and binned by<br />
separation over four areas of 0755+37 (the two jets and the two lobes), and in three areas of M 87<br />
(the inner and outer E lobe and the W lobe). The reason for splitting the E lobe of M 87 into two<br />
sub-regions was that the structure function derived for the whole lobe showed a decrease at large<br />
separation which probably in<strong>di</strong>cates the presence of significant spatial variations in the field and/or<br />
density (cf. 3C 449, Chapter 4). All of these sub-regions have enough data points to ensure that<br />
the structure functions are robustly determined. A first-order correction for uncorrelated random<br />
noise,σ fit , evaluated in each sub-region, has been applied to all of the structure functions. A<br />
cut-off power law (CPL) power spectrum (see also Eq. 4.3)<br />
Ĉ( f ⊥ ) = 0 f ⊥ < f min<br />
= C 0 f −q<br />
⊥<br />
f ⊥ ≤ f max<br />
= 0 f ⊥ > f max . (6.1)<br />
gives model structure functions in very good agreement with the data for both sources (Figs.6.9<br />
and 6.10). The values of f max have also been estimated by fitting the mean values of k for<br />
the sub-regions. I produced multiple RM realisations correspon<strong>di</strong>ng to the CPL model power<br />
spectrum on the observed grid, inclu<strong>di</strong>ng the effects of the convolving beam, to evaluate the rms<br />
deviations of their structure functions. These take into account the effects of undersampling and<br />
are plotted as error bars attached to the observed points. The best-fitting parameters are quoted<br />
for each sub-region separately in Table 6.4, together with the observed and pre<strong>di</strong>cted values of<br />
120
6.4. Preliminary conclusions 121<br />
Table 6.4: Best-fitting power spectrum parameters for the in<strong>di</strong>vidual sub-regions of 0755+37 and<br />
M 87.<br />
Source Region FWHM q f max f min k obs k syn<br />
[arcsec] [arcsec −1 ] [arcsec −1 ] [rad 2 m −4 ] [rad 2 m −4 ]<br />
0755+37 E LOBE 4.0 2.48 8.33 ∞ 64±3 69±3<br />
E JET 2.45 ” 0.017 112±5 119±4<br />
W JET 2.20 ” 0.052 156±7 164±5<br />
W LOBE 2.19 0.69 0.028 109±5 104±5<br />
E LOBE 1.3 2.52 8.33 ∞ 41±3 37±4<br />
E JET 2.51 4.16 0.017 63±4 57±5<br />
W JET 2.21 8.33 0.052 58±5 55±5<br />
W LOBE 2.19 0.69 0.028 38±6 40±4<br />
M 87 E out LOBE 0.4 3.05 2.6 ∞ 23470±600 34350±150<br />
E in LOBE ” 2.87 2.6 ” 35310±800 59540±200<br />
W LOBE ” 2.85 2.6 ” 15178±500 14491±100<br />
Burn law k. In M 87, the slopes and cut-off frequencies derived for the in<strong>di</strong>vidual sub-regions are<br />
mutually consistent. A combined fit, weighting all of the sub-regions equally and allowing their<br />
normalizations to vary, gives q=2.95 and f max = 2.75 arcsec −1 . The slopes for the <strong>di</strong>fferent parts<br />
of 0755+37 <strong>di</strong>ffer significantly from each other, and no combined fit has been attempted.<br />
The structure functions for the lobes of M 87 show little firm evidence for any levelling off at<br />
large separations (the points at> ∼ 15 arcsec in the East lobe have very large errors). In the W lobe,<br />
the field outer scale must be> ∼ 30 arcsec (≃2.7 kpc). The fits therefore assume f min =∞ for this<br />
source. In contrast, the structure functions for both of the jets and the W lobe of 0755+37 level<br />
off and clearly show the suppression of the RM fluctuations above some outer scale. Better fits<br />
to these structure functions are provided by setting a finite value for f min of 0.017-0.052 arcsec −1 ,<br />
correspon<strong>di</strong>ng to a maximum field fluctuations on scalesΛ max ≈ 15−50 kpc. The situation is<br />
more ambiguous in the E lobe of 0755+37, because of the large errors, and in this case the fit<br />
with f min =∞ is shown. Further work on the outer scale will require a three-<strong>di</strong>mensional analysis<br />
which takes into account the spatial variations of density and path length across the sources.<br />
6.4 Preliminary conclusions<br />
I have stu<strong>di</strong>ed in detail the images of linearly polarized emission from the FR I ra<strong>di</strong>o galaxies<br />
0755+37, in a sparse group, and M 87 at the centre of the cool-core Virgo cluster. I have produced<br />
images of RM and Burn law k with resolutions of 4.0 and 1.3 arcsec FWHM for 0755+37, and<br />
0.4 arcsec FWHM for M 87. The spatial variations of the RM <strong>di</strong>stributions in both sources have<br />
been investigated using a structure-function technique.<br />
121
122 6. Faraday rotation in two extreme environments<br />
The results of this analysis can be summarized as follows:<br />
• The polarization position angles accurately follow theλ 2 relation. Together with the<br />
observed low depolarization, this confirms yet again that the Faraday rotation is primarily<br />
in front of the ra<strong>di</strong>o emission. The residual depolarization is consistent with unresolved RM<br />
fluctuations.<br />
• The amplitude of the RM fluctuations in 0755+37 is smaller than for FR I sources embedded<br />
in groups of galaxies (Chapter 5) and comparable to that in NGC 315, which is also in a<br />
very sparse environment (Laing et al. 2006a). This reinforces the hypothesis the most of the<br />
Faraday rotating material is due to the hot atmosphere of the associated galaxy.<br />
• In M 87 the amplitude of the RM fluctuations is typical of that found in other cool-core<br />
clusters such as Cygnus A and Hydra A (e.g. Carilli & Taylor 2002; Laing et al. 2008).<br />
• The profiles ofσ RM (which are not shown) and〈k〉 for both sources have higher average<br />
values for the rece<strong>di</strong>ng lobes. Thus both resolved and sub-beam fluctuations of RM are<br />
higher on the rece<strong>di</strong>ng side (the Laing-Garrington effect; Laing 1988; Garrington et al.<br />
1988).<br />
• Both approaching jets show low and uniform rotation measures. In M 87, the associated<br />
depolarization is also anomalously low.<br />
• There is other evidence for anisotropic RM fluctuations in 0755+37: the lea<strong>di</strong>ng edge of<br />
the W lobe shows arc-like RM structures with sign reversals. These are reminiscent of the<br />
RM bands <strong>di</strong>scussed in Chapter 5. The RM structures of both 0755+37 and M 87 appear<br />
reasonably isotropic elsewhere.<br />
• Except in the restricted areas showing obvious anisotropic structure, it is reasonable to<br />
treat the RM as a Gaussian, random, isotropic variable and to estimate its power spectrum.<br />
The power spectra are well described by power laws with slopes ranging from 2.2 to 2.5<br />
in 0755+37 and slightly steeper (≈3.0) in M 87. These are comparable with the slopes<br />
deduced for 3C 449, 3C 31 (Laing et al. 2008) and the regions not dominated by RM bands<br />
in 0206+35, 3C 270 and 3C 353 (Chapter 5). They are all significantly flatter than the value<br />
of 11/3 expected for Kolmogorov turbulence.<br />
• These power spectra are consistent with the observed depolarization for minimum field<br />
scales of 0.1 kpc in 0755+37 and 0.06-0.25 kpc in M 87. The nearby location and high<br />
surface brightness of M 87 have allowed an accurate determination of its RM power<br />
spectrum on scales smaller than those accessible for other objects.<br />
122
6.4. Preliminary conclusions 123<br />
• The derived magnetic-field auto-correlation lengths λ B are 0.1-1.4 kpc in 0755+37<br />
(depen<strong>di</strong>ng on the sub-region), and 0.2 kpc in M 87.<br />
• The central magnetic field strength required to match the RM fluctuations, deduced from<br />
the single-scale approximation inclu<strong>di</strong>ng cavities and assuming these values ofλ B as scalelengths,<br />
is≈1.0µG in 0755+37 and≈35µG in M 87. This confirms the trend for stronger<br />
fields to be seen in richer environments (Carilli & Taylor 2002), although subject to<br />
confirmation by three-<strong>di</strong>mensional modelling.<br />
Significant imprecision is certainly introduced by the assumption of constant integration path<br />
required to interpret the RM structure functions over limited sub-regions. This can be corrected<br />
in future three-<strong>di</strong>mensional simulations, but better constraints on the source geometries and the<br />
<strong>di</strong>stributions of hot gas will be required. This will be particularly challenging for M 87, where the<br />
hot-gas structure is extremely complicated (Forman et al. 2007).<br />
123
124 6. Faraday rotation in two extreme environments<br />
124
Summary and conclusions<br />
The goal of this thesis was to constrain the strength and structure of the magnetic field associated<br />
with the extragalactic me<strong>di</strong>um surroun<strong>di</strong>ng ra<strong>di</strong>o galaxies located in a variety of environments by<br />
using observations of Faraday rotation and depolarization. To interpret the RM structure, I have<br />
derived analytical models and performed two- and three-<strong>di</strong>mensional Monte Carlo simulations.<br />
The picture that emerges is that the magneto-ionic environments of ra<strong>di</strong>o galaxies are<br />
significantly more complicated than was apparent from earlier work. The unique feature of this<br />
thesis is that the target ra<strong>di</strong>o galaxies are all large and highly polarized, enabling the determination<br />
of Faraday rotation and depolarization at a large number of independent points with high signalto-noise<br />
ratio. This in turn allows global variations across the sources to be determined, as well as<br />
accurate estimates of spatial statistics.<br />
In Section 6.5, I summarize the main results obtained in Chapters 4, 5 and 6. The general<br />
conclusions are given in Sec. 6.6 as a set of answers to the questions posed in the Abstract and<br />
finally Sec. 6.7 briefly lists some topics for further work.<br />
6.5 Summary<br />
6.5.1 The tailed source 3C 449<br />
The RM and depolarization across the source both appear to be consistent with a pure, mostly<br />
resolved foreground Faraday screen. The RM structure shows no preferred <strong>di</strong>rection anywhere<br />
in the ra<strong>di</strong>o source. This is consistent with an isotropic, turbulent magnetic field fluctuating over<br />
a wide range of spatial scales. I quantified the statistics of the magnetic-field fluctuations by<br />
deriving RM structure functions, which have been fitted using models derived from theoretical<br />
power spectra. The errors due to undersampling have been estimated by making multiple two<strong>di</strong>mensional<br />
realizations of the best-fitting power spectrum. Depolarization measurements have<br />
also been used to estimate the minimum scale of the magnetic field variations. I then developed<br />
three-<strong>di</strong>mensional models with a gas density <strong>di</strong>stribution derived from X-ray observations and<br />
125
126 6. Summary and conclusions<br />
a random magnetic field with the previously-determined power spectrum. By comparing the<br />
simulations with the observed Faraday rotation images, the strength of the magnetic field and<br />
its dependence on density could be estimated. The RM and depolarization data are consistent with<br />
a broken power-law magnetic-field power spectrum, with a break at about 11 kpc and slopes of<br />
2.98 and 2.07 at smaller and larger scales, respectively. The minimum scale of the fluctuations is<br />
≈0.2 kpc. A particularly interesting result is the determination of the outer scale,Λ max ≈65 kpc,<br />
which gives the driving scale of turbulence. This is the first time that this quantity has been<br />
estimated unambiguosly.<br />
The average magnetic field strength at the group centre is 3.5±1.2µG, decreasing linearly<br />
with the gas density within≈16 kpc of the nucleus. At larger <strong>di</strong>stances, the dependence of field<br />
on density appears to flatten, but this may be an effect of errors in the density model. The ratio of<br />
the thermal and magnetic-field pressures is≈30 at the nucleus and≈400 at the core ra<strong>di</strong>us of the<br />
group gas. Therefore, the intra-group magnetic field is not energetically important.<br />
These results in<strong>di</strong>cate a magnetized foreground me<strong>di</strong>um very similar to that in 3C 31 (Laing et<br />
al. 2008), as was expected from the close similarity between the environments, ra<strong>di</strong>o morphologies<br />
and redshifts of the two sources. The RM fluctuation amplitudes are comparable, as is the derived<br />
central magnetic field (B 0 ≈ 2.8µG for 3C 31) and the magnetic field power spectrum which<br />
in both sources can be fit by a broken power law steepening at higher spatial frequencies. The<br />
low-frequency slopes are similar (q=2.3 for 3C 31), but the high-frequency slope for 3C 31 is<br />
consistent with the value for Kolmogorov turbulence (q=11/3). Because of uncertainties in the<br />
density <strong>di</strong>stribution around 3C 31, Laing et al. (2008) could only estimate a lower limit to the outer<br />
scale of magnetic-field fluctuations,Λ max<br />
> ∼ 70 kpc, likely set as in 3C 449 by interactions with<br />
companion galaxies in the group.<br />
6.5.2 The lobed ra<strong>di</strong>o galaxies 0206+35, 3C 270, M 84 and 3C 353<br />
In contrast to 3C 449, all of the sources show highly anisotropic banded RM structures with<br />
contours of constant RM perpen<strong>di</strong>cular to the major axes of their ra<strong>di</strong>o lobes. The bands have<br />
widths of 3-10 kpc and amplitudes of 10-50 rad m −2 . In several cases, they are associated with<br />
field reversals. All of the sources except M 84 also have regions in which the RM fluctuations<br />
have lower amplitude and appear isotropic. Structure function and depolarization analyses for<br />
these areas have shown that flat power-law power spectra with low amplitudes and high-frequency<br />
cut-offs give good descriptions of the spatial statistics. The strength of the field which gives<br />
rise to the bands is significantly higher than that of the largest-scale component in the band-free<br />
regions. The wavelength behavior of the polarization position angles and the almost complete<br />
absence of depolarization imply, as usual, that a mostly resolved foreground Faraday screen is<br />
126
6.5. Summary 127<br />
responsible for the observed RM in the bands and elsewhere. I have presented an initial attempt to<br />
interpret the banded RM phenomenon as a consequence of interactions between the sources and<br />
their surroun<strong>di</strong>ngs. Synthetic RM images have been produced for the case of compression of a<br />
uniformly-magnetized external me<strong>di</strong>um. This simple model of the source-environment interaction<br />
pre<strong>di</strong>cts RM bands of approximately the right amplitude, but only under special initial con<strong>di</strong>tions.<br />
A much better description of the data is provided by a two-<strong>di</strong>mensional magnetic structure in<br />
which the field lines are a family of ellipses draped around the lea<strong>di</strong>ng edge of the lobe. This<br />
draped-field model can produce RM bands in the correct orientation for any source inclination.<br />
Moreover, it might explain the high RM amplitude and low depolarization observed within the<br />
bands. The two-<strong>di</strong>mensional draped-field model may also account for the low rate of detection of<br />
RM bands in published observations, since anisotropic RM structures will not be observed unless<br />
the line-of-sight intercepts the wrapped field lines. Furthermore, superposed RM fluctuations with<br />
significant power on scales comparable with the bands will make them <strong>di</strong>fficult to recognise.<br />
This work has demonstrated unequivocally for the first time that the interaction between ra<strong>di</strong>o<br />
galaxies and their imme<strong>di</strong>ate environments affects the magnetisation of the surroun<strong>di</strong>ng plasma.<br />
Finally, I have reported rims of high depolarization at the edges of the inner ra<strong>di</strong>o lobes of<br />
M 84 and 3C 270. Such highly depolarized structures had not been observed in earlier, less detailed<br />
work. The magnetic fields responsible for such depolarization must be tangled on small scales,<br />
since they produce depolarization without any obvious effects on the large-scale Faraday rotation<br />
pattern. The rims are spatially coincident with shells of enhanced X-ray surface brightness, in<br />
which both the field strength and the thermal gas density are likely to be increased by compression.<br />
6.5.3 The ra<strong>di</strong>o galaxies 0755+37 and M 87<br />
I have presented two-<strong>di</strong>mensional analyses of the RM and depolarization across the ra<strong>di</strong>o galaxy<br />
0755+37, in a very poor group, and the inner 5 kpc of the ra<strong>di</strong>o structure of M 87, located at the<br />
centre of the cool-core Virgo cluster. 0755+37 shows the clearest known example of jet-related<br />
RM structure. The amplitudes of the RM fluctuations across 0755+37 and M 87 are typical of their<br />
environments: in 0755+37 they are smaller than those detected in sources in groups of galaxies and<br />
much more than those in M 87, which are typical of a cool core cluster. The RM structure functions<br />
have been evaluated for both sources over sub-regions where the RM fluctuation amplitudes are<br />
approximately constant. The structure-function analysis has shown that the best-fitting power<br />
spectrum of the RM fluctuations (and thus the magnetic field) is a power law with a cut-off at high<br />
spatial frequencies. The best-fitting power spectra are <strong>di</strong>fferent for the two lobes of 0755+37: the<br />
slopes are q≃2.5 in the eastern lobe and q≃2.2 in the west. The minimum field scale derived<br />
from depolarization measurements is 0.1 kpc and the maximum field fluctuation scale is≈50 kpc.<br />
127
128 6. Summary and conclusions<br />
In M 87, a power spectrum with slope q≃3.0 fits well everywhere. The minimum scale ranges<br />
from 0.06 up to 0.25 kpc. An approximate lower limit to the outer scale is 2.7 kpc.<br />
6.6 General conclusions<br />
1. Origin of the bulk of the Faraday effect observed across ra<strong>di</strong>o galaxies<br />
It is possible to establish that most of the RM is due to material between us and the ra<strong>di</strong>o<br />
source by verifying that the polarization angles have aλ 2 dependence and that the detected<br />
depolarization, if any, is consistent with that expected from instrumental effects (beam and<br />
bandwidth depolarization). This is the case for all of the ra<strong>di</strong>o galaxies analysed in this<br />
thesis and in most earlier work.<br />
This is consistent with the idea that ra<strong>di</strong>o sources have evacuated cavities in the IGM during<br />
their expansion (as observed in X-rays) and that there has been relatively little mixing of<br />
thermal and relativistic plasma. The apparent under-pressure in FR I lobes and tails is most<br />
easily explained if a small amount of thermal plasma has been entrained and heated, but the<br />
densities required are quite small, and consistent with the non-detection of internal Faraday<br />
rotation and depolarization at GHz frequencies.<br />
Prior to the work described here, it was generally thought that the observed RM was<br />
produced almost exclusively by the <strong>di</strong>stributed hot component of the intra-group or intracluster<br />
me<strong>di</strong>um and that interactions with the ra<strong>di</strong>o source were unimportant. In the<br />
present study, three <strong>di</strong>stinct types of magnetic-field structure have been found: a component<br />
with large-scale fluctuations, indeed plausibly associated with the un<strong>di</strong>sturbed intergalactic<br />
me<strong>di</strong>um; a well-ordered field draped around the lea<strong>di</strong>ng edges of ra<strong>di</strong>o lobes and a field with<br />
small-scale fluctuations in the shells of compressed gas surroun<strong>di</strong>ng the inner lobes, perhaps<br />
associated with a mixing layer.<br />
Foreground Faraday rotation in a spherically symmetrical, un<strong>di</strong>sturbed IGM provides a<br />
natural explanation for the systematic asymmetry in RM variance and/or depolarization<br />
observed between the approaching and rece<strong>di</strong>ng lobes (Laing 1988; Garrington et al. 1988;<br />
Morganti et al. 1997; Laing et al. 2008). In contrast, some authors (e.g. Bicknell, Cameron<br />
& Gingold 1990) have suggested that the RM could be localized in a thin layer around<br />
the source, but simple shell models of this type find <strong>di</strong>fficulties in reproducing the observed<br />
asymmetries and are unlikely to be important on large scales. It is likely that the sphericallysymmetric<br />
group component dominates in large, tailed sources such as 3C 449.<br />
The results on banded RM structures presented in this thesis suggest that the magnetised<br />
me<strong>di</strong>um producing them must have a scale comparable to that of the lobe width. If the<br />
128
6.6. General conclusions 129<br />
ra<strong>di</strong>o source is expan<strong>di</strong>ng supersonically, there will also be a bow shock ahead of the lobe<br />
in the hot gas which will naturally produce higher densities and stronger fields in the postshock<br />
material imme<strong>di</strong>ately surroun<strong>di</strong>ng the lobes. All of the sources which show banded<br />
RM structure show evidence of strong interaction with the surroun<strong>di</strong>ng me<strong>di</strong>um, either from<br />
expansion driven by the jets (0206+35, 3C 270, 3C 353) or from X-ray observations (M 84).<br />
The best evidence for mixing between thermal and relativistic plasma comes from the<br />
observation of enhanced depolarization in the inner lobes of M 84, 3C 270 and 0755+37.<br />
It is in these regions that models like those of Bicknell, Cameron & Gingold (1990) are<br />
most likely to apply.<br />
2. The connection between magnetic field and thermal gas<br />
The results of this work are consistent with the idea that the RM fluctuation amplitude in<br />
galaxy groups and clusters scales roughly linearly with density, ranging from a few rad m −2<br />
in the sparsest environments (0755+37) through interme<strong>di</strong>ate values of≈30-100 rad m −2 in<br />
groups (0206+35, 3C 270 and 3C 449) to∼ 10 4 rad m −2 in the centres of clusters with cool<br />
cores (M 87).<br />
The spatial variation of RM fluctuation amplitude in galaxy groups is consistent with a<br />
<strong>di</strong>stribution for the magneto-ionic me<strong>di</strong>um which is spherically symmetric, together with<br />
cavities coincident with the ra<strong>di</strong>o emission. The ra<strong>di</strong>al dependence of the field strength can<br />
be approximated by B(r)=〈B 0 〉 ( )<br />
n e (r) η,<br />
n 0<br />
with 1 > ∼ η> ∼ 0.5. The central magnetic-field<br />
strength B 0 is typically a fewµG and the magnetic field is never dynamically dominant over<br />
the modeled volumes.<br />
Thus the relation between magnetic field strength and density in galaxy groups appears to<br />
be a continuation of the trend observed in galaxy clusters (e.g. Brunetti et al. 2001; Dolag<br />
et al. 2006; Guidetti et al. 2008; Bonafede et al. 2010): the ra<strong>di</strong>al variations have similar<br />
functional forms and the normalization scales with density.<br />
3. Magnetic-field structure<br />
In this thesis, two types of RM structures have been found:<br />
one with RM variations<br />
reasonably approximated as isotropic and random (3C 449, M 87, the western lobe of<br />
3C 353) and one with two-<strong>di</strong>mensional banded RM patterns (0206+35, 3C 270, M 84, the<br />
eastern lobe of 3C 353 and perhaps 0755+37). The first type of structure is well reproduced<br />
by a Gaussian isotropic random magnetic field, as shown by earlier numerical modelling as<br />
well as that performed in this thesis. The second type shows evidence for a two-<strong>di</strong>mensional,<br />
ordered magnetic field. One of the major results of this thesis has been to demonstrate<br />
that RM enhancements are expected from compression of the surroun<strong>di</strong>ng magneto-ionic<br />
me<strong>di</strong>um by expan<strong>di</strong>ng ra<strong>di</strong>o galaxies, but that such structures can have band-like shapes<br />
129
130 6. Summary and conclusions<br />
with the observed properties only when the field is wrapped around the ra<strong>di</strong>o lobes in a two<strong>di</strong>mensional<br />
geometry. In order to create RM bands with multiple reversals, more complex<br />
field geometries such as two-<strong>di</strong>mensional ed<strong>di</strong>es are needed.<br />
4. Magnetic field power spectrum: functional form and range of scales<br />
Recent observational work on galaxy clusters has led to claims that the intra-cluster<br />
magnetic field has a Kolmogorov-like power spectrum (i.e. a power law with slope q =<br />
11/3). Kolmogorov turbulence would be expected over some inertial range if the turbulence<br />
is primarily hydrodynamic (Kolmogorov 1941) or for the MHD cascade investigated<br />
by Goldreich & Sridhar (1997). However, the assumptions on which the Kolmogorov<br />
turbulence relies (homogeneity, isotropic and lack of magnetization) are not satisfied in the<br />
intergalactic me<strong>di</strong>um. Numerical simulations pre<strong>di</strong>ct a wide range of spectral slopes (albeit<br />
with some preference for the Kolmogorov value; Dolag 2006), and a comparison between<br />
theory and observation therefore seems premature.<br />
None of the RM <strong>di</strong>stributions stu<strong>di</strong>ed in this thesis show fluctuations compatible with a<br />
Kolmogorov power spectrum over the full range of observed scales. Instead, they are<br />
consistent with flatter power-law power spectra (q≤3). A Kolmogorov form on scales<br />
below the resolution limit cannot be excluded, although this is not the case on linear scales<br />
as low as 60 pc in M 87. Power spectra with slopes flatter than 11/3 have also been found<br />
by other authors (Murgia et al. 2004; Govoni et al. 2006; Laing et al. 2008). Similar results<br />
come from the analysis of magnetic turbulence in the Galaxy. For example, Regis (2011)<br />
found a flatter index (q=2.7) by analysing the fluctuations in the Galactic synchrotron<br />
emission (see also Minter & Spangler 1996).<br />
It is worth noting that the power spectra for sources in this thesis appear to be steeper in<br />
richer environments. The slopes range from q≈2 in groups (0755+37, 0206+35) up to<br />
q≈3 in clusters (3C 353, M 87). The flatter slopes are found in sources showing anisotropic<br />
RM’s, but this might be a selection effect. The idea of that the index of the power spectrum<br />
is determined by the richness of the environment is probably oversimplified.<br />
In 3C 449, the power spectrum cannot be a single power law, but rather steepens on smaller<br />
scales. A broken power law gives a good representation of the data, as found for 3C 31<br />
(Laing et al. 2008), but is not unique: a smoother function would fit just as well. The<br />
precise location of the break in the broken power law may not be physically significant, but<br />
a change in slope might occur at the typical field reversal scale if the field is produced by a<br />
fluctuation dynamo (Schekochihin & Cowley 2006; Eilek & Owen 2002).<br />
It is not clear what determines the minimum and the maximum scales of the magnetic field.<br />
Reconnection of field lines is expected to occur on much smaller scales than those sampled<br />
130
6.7. Future prospects 131<br />
and is therefore not relevant. Energy can be injected on large scales from the interactions<br />
between the ra<strong>di</strong>o source and the magnetized gas, gas motions (“sloshing”) within the<br />
group/cluster potential well (e.g. merger-related) and motion of the host galaxy. All of<br />
these provide energy input on roughly the outer scale estimated for 3C 449 and 0755+37<br />
(the latter subject to confirmation by three-<strong>di</strong>mensional modelling). In principle, the origin<br />
of the maximum scale could be constrained by observations of the same type of ra<strong>di</strong>o source<br />
in <strong>di</strong>fferent environments.<br />
5. RM structure and its connection with the ra<strong>di</strong>o source morphology<br />
I pointed out a potential correlation between ra<strong>di</strong>o source morphology and RM anisotropy.<br />
RM bands have so far been unambiguously detected only in lobed ra<strong>di</strong>o galaxies. This is<br />
what expected if the process producing bands is related to some form of compression or<br />
draping. Ra<strong>di</strong>o galaxies with lobes are indeed expected to be more effective than tailed<br />
sources in compressing the surroun<strong>di</strong>ng gas. Production of RM bands by draped fields in<br />
tailed sources is not excluded, provided that there is relative motion between the source and<br />
the surroun<strong>di</strong>ng gas. This might occur in narrow-angle tail sources (where the host galaxy<br />
is moving rapidly through the ICM) or in wide-angle tails if there are sloshing motions of<br />
gas in the cluster potential well.<br />
6.7 Future prospects<br />
The work described in this thesis raises a number of observational questions, inclu<strong>di</strong>ng the<br />
following.<br />
1. How common are anisotropic RM structures? Do they occur primarily in lobed ra<strong>di</strong>o<br />
galaxies with small axial ratios, consistent with jet-driven expansion into an unusually dense<br />
surroun<strong>di</strong>ng me<strong>di</strong>um? Is their frequency qualitatively consistent with the two-<strong>di</strong>mensional<br />
draped-field picture?<br />
2. Why do we see bands primarily in sources where the isotropic RM component has a flat<br />
power spectrum of low amplitude? Is this just because the bands can be obscured by largescale<br />
fluctuations, or is there a causal connection?<br />
3. Are the RM bands suggested in tailed sources such as 3C 465 and Hydra A caused by a<br />
similar phenomenon (e.g. bulk flow of the IGM around the tails)?<br />
4. Is an asymmetry between approaching and rece<strong>di</strong>ng lobes seen in the banded RM<br />
component? If so, what does that imply about the field structure?<br />
131
132 6. Summary and conclusions<br />
5. How common are the regions of enhanced depolarization at the edges of ra<strong>di</strong>o lobes? How<br />
strong is the field and what is its structure? Is there evidence for the presence of a mixing<br />
layer?<br />
It should be possible to address all of these questions using a combination of observations<br />
with the new generation of synthesis arrays (EVLA, e-MERLIN and LOFAR all have wide-band<br />
polarimetric capabilities) and high-resolution X-ray imaging. It will be possible to determine<br />
rotation measures within a single observing band at high spatial resolution, allowing at the same<br />
time a much quicker and more accurate RM determination and the buil<strong>di</strong>ng of larger samples.<br />
Higher resolution and improved image quality will allow sampling of a larger range of spatial<br />
scales and hence improve the constraints on the RM power spectrum. In particular, it should<br />
be possible to determine with certainty whether the power spectrum has the form expected for<br />
Kolmogorov turbulence. An alternative to fitting parametrized functions to the power spectrum is<br />
provided by Bayesian methods, which are non-parametric and should improved error estimates<br />
(Enßlin & Vogt 2005). RM modelling should be conducted in synergy with jet modelling,<br />
which provides constraints on the geometry of the sources and estimates of their jet powers, and<br />
with X-ray observations. Finally more detailed MHD simulations of ra<strong>di</strong>o-source evolution in a<br />
surroun<strong>di</strong>ng magnetised me<strong>di</strong>um are needed.<br />
132
Appen<strong>di</strong>x<br />
133
Appen<strong>di</strong>x<br />
Data reduction and imaging of the ra<strong>di</strong>o<br />
galaxies 0206+35, 0755+37 and M 84 ‡<br />
The aim of this appen<strong>di</strong>x is to present the VLA data reduction and high-quality ra<strong>di</strong>o<br />
imaging of the FR I sources 0206+35, 0755+37 and M 84, which have been performed<br />
in collaboration with R. A. Laing, A. H Bridle, P.Parma and M.Bon<strong>di</strong>.<br />
Here, we describe:<br />
1. details of the observations and data reduction<br />
2. the source morphologies in total intensity at a range of resolutions,<br />
3. images of the degree of polarization and the apparent magnetic field <strong>di</strong>rection, corrected for<br />
Faraday rotation.<br />
.1 Observations and VLA data reduction<br />
We made use of new and archive VLA observations. Deep images with angular resolution<br />
ranging from 4.5 down to 0.35 arcsec FWHM have been produced from multi-configuration VLA<br />
observations at 1.4 GHz (L-band) and 4.9 GHz (C-band). A journal of the observations is given in<br />
Table 5.<br />
The VLA data listed in Table 5 were calibrated and imaged using the AIPS software package,<br />
following standard procedures, with a few ad<strong>di</strong>tions. The flux-density scale was set using<br />
observations of 3C 286 or 3C 48 and the zero-point of E-vector position angle was determined<br />
‡ part of Laing, Guidetti et al. 2011, in prep.<br />
135
136 Data reduction and imaging of lobed ra<strong>di</strong>o galaxies<br />
Table 5: Journal of VLA observations. ν and∆ν are the centre frequencies and bandwidth,<br />
respectively, for the one or two frequency channels observed and t is the on-source integration<br />
time scaled to an array with all 27 antennas operational.<br />
Source Config. Date ν ∆ν t Proposal<br />
[GHz] [MHz] [min] code<br />
0206+35 A 2008 Oct 13 4885.1, 4835.1 50 486 AL797<br />
A 2008 Oct 18 4885.1, 4835.1 50 401 AL797<br />
B 2003 Nov 17 4885.1, 4835.1 50 254 AL604<br />
C 2004 Mar 20 4885.1, 4835.1 50 88 AL604<br />
A 2004 Oct 24 1385.1, 1464.9 25 189 AL604<br />
B 2003 Nov 17 1385.1, 1464.9 25 110 AL604<br />
0755+37 A 2008 Oct 05 4885.1, 4835.1 50 477 AL797<br />
A 2008 Oct 06 4885.1, 4835.1 50 383 AL797<br />
B 2003 Nov 15 4885.1, 4835.1 50 332 AL604<br />
B 2003 Nov 30 4885.1, 4835.1 50 169 AL604<br />
C 2004 Mar 20 4885.1, 4835.1 50 125 AL604<br />
D 1992 Aug 02 4885.1, 4835.1 50 55 AM364<br />
A 2004 Oct 25 1385.1, 1464.9 12.5 450 AL604<br />
B 2003 Nov 30 1385.1, 1464.9 12.5 160 AL604<br />
C 2004 Mar 20 1385.1, 1464.9 12.5 21 AL604<br />
M 84 A 1980 Nov 09 4885.1 50 223 AL020<br />
A 1988 Nov 23 4885.1, 4835.1 50 405 AW228<br />
A 2000 Nov 18 4885.1, 4835.1 50 565 AW530<br />
B 1981 Jun 25 4885.1 50 156 AL020<br />
C 1981 Nov 17 4885.1 50 286 AL020<br />
C 2000 Jun 04 4885.1, 4835.1 50 138 AW530<br />
A 1980 Nov 09 1413.0 25 86 AL020<br />
B 1981 Jun 25 1413.0 25 29 AL020<br />
B 2000 Feb 09 1385.1, 1464.9 50 30 AR402<br />
using 3C 286 or 3C 138, after calibration of the instrumental leakage terms. The main deviations<br />
from standard methods were as follows.<br />
Firstly, we used the routineBLCAL to compute closure corrections for the 4.9 GHz observations.<br />
This was required to correct for large closure errors on baselines between EVLA and VLA<br />
antennas in the most recent observations (VLA Staff 2010), but also improved a number of the<br />
earlier datasets. Whenever possible, we included observations of the bright, unresolved calibrator<br />
3C 84 for this purpose; if it was not accessible during a particular run, we used 3C 286. We found<br />
that it was not adequate to use the standard calibration (which averages over scans) to compute the<br />
baseline corrections, as phase jumps during a calibrator scan caused serious errors in the derived<br />
corrections. We therefore self-calibrated the observations in amplitude and phase with a solution<br />
interval of 10 s before runningBLCAL. We assumed a point-source model for 3C 84 and the well-<br />
136
.1. Observations and VLA data reduction 137<br />
determinedCLEAN model supplied with the AIPS <strong>di</strong>stribution for 3C 286.<br />
Secondly, we imaged in multiple facets to cover the inner part of the primary beam at L-band<br />
and to image confusing sources at large <strong>di</strong>stances from the phase centre in both bands. Before<br />
combining configurations, we subtracted in the (u, v) plane all sources outside a fixed central field.<br />
For 0755+37, this procedure failed to remove sidelobes at the centre of the field from a bright<br />
confusing source close to the half-power point of the primary beam. The reason for this is that the<br />
VLA primary beam is not azimuthally symmetric, so the effective complex gain for a <strong>di</strong>stant source<br />
is not the same as that at the pointing centre and varies with time in a <strong>di</strong>fferent way. We used the<br />
AIPS procedurePEELR to remove the offen<strong>di</strong>ng source from the (u, v) data for each configuration<br />
before combining them.<br />
Finally, we corrected for variations in core flux density and amplitude scale between<br />
observations as described in Laing et al. (2006b).<br />
J2000 coor<strong>di</strong>nates are used throughout this work. The astrometry for each of the sources was<br />
set using the A-configuration observations, referenced to a nearby phase calibrator in the usual<br />
manner. Thereafter, the position of the compact core was held constant during the process of array<br />
combination. If positions from archival data were originally in the B1950 system, then (u,v,w)<br />
coor<strong>di</strong>nates were recalculated for J2000 before imaging. The C-band data were usually taken in<br />
two adjacent 50 MHz frequency channels, which were imaged together. We also made I images at<br />
L-band using the data from both channels; these were used for spectral-index analysis which will<br />
be presented elsewhere.<br />
In order to avoid the well-known problems introduced by the conventionalCLEAN algorithm<br />
for well-resolved, <strong>di</strong>ffuse brightness <strong>di</strong>stributions, total-intensity images at the higher resolutions<br />
were produced using either a maximum-entropy algorithm (Leahy & Perley 1991) or the multiscaleCLEAN<br />
algorithm as implemented in the AIPS package (Greisen et al. 2009). In the former<br />
case, bright, compact core and jet components were firstCLEANed out. The maximum-entropy<br />
images were then convolved with a Gaussian beam and theCLEAN components restored. We found<br />
very few <strong>di</strong>fferences between the images produced by the two methods. The standard singleresolutionCLEAN<br />
was found to be adequate for the lowest-resolution I images. Stokes Q and U<br />
images wereCLEANed using one or more resolutions (we found few <strong>di</strong>fferences between single and<br />
multiple-resolutionCLEAN, for these images, which have little power on large spatial scales). All<br />
of the images were corrected for the effects of the antenna primary beam.<br />
In general, the 4.9 GHz images have off-source rms levels very close to those expected from<br />
thermal noise in the receivers alone. The integrations for the L-band images are shorter than at the<br />
higher frequency, and the noise levels are correspon<strong>di</strong>ngly higher. As a check on the amplitude<br />
calibration and imaging of the I images used in spectral-index analysis, we have integrated the<br />
137
138 Data reduction and imaging of lobed ra<strong>di</strong>o galaxies<br />
Table 6: Resolutions and noise levels for the images used in this work. Col.1 source name; Col.2<br />
angular resolution; Col.3 observing frequency; Col.4 VLA configurations; Col.5 imaging method;<br />
Col.6 off-source noise level on the I image (σ I ) and the average of the noise levels for Q and<br />
U (σ P ). Col.7 approximate maximum scale of structure imaged reliably (Ulvestad, Perley &<br />
Chandler 2009). Col.8 corrected single-<strong>di</strong>sh flux densities put in the standard scale of Baars et al.<br />
(1977), as used at the VLA. Col.9 references.<br />
Source FWHM Freq Config. Method rms noise level Max I int /Jy Ref.<br />
[arcsec] [GHz] I QU [µJy beam −1 ] scale Image SD<br />
σ I σ P [arcsec]<br />
0206+35 1.20 4860.1 BC MR MR 12 12 300 0.90±0.02 0.98±0.12 1<br />
1.20 1464.9 AB MR MR 21 22 300 2.12±0.04 2.13 3<br />
1.20 1385.1 AB MR MR 21 23 300 2.12±0.04 2.22 3<br />
1.20 1425.0 AB MR − 19 − 300 2.12±0.04 2.18 4<br />
4.50 4860.1 BC MR − 18 − 300 0.90±0.02 0.98±0.12 1<br />
4.50 1425.0 AB MR − 38 − 300 2.13±0.04 2.18 4<br />
0755+37 1.30 4860.1 BCD MR MR 7.8 7.9 300 1.26±0.03 1.27±0.02 2<br />
1.30 1464.9 ABC MR MR 28 28 300 2.60±0.05 2.53±0.09 2<br />
1.30 1385.1 ABC MR MR 27 26 300 2.74±0.05 2.62±0.09 2<br />
1.30 1425.0 ABC MR − 20 − 300 2.64±0.05 2.57±0.09 2<br />
4.00 4860.1 BCD MR MR 14 12 300 1.25±0.03 1.27±0.02 2<br />
4.00 1464.9 ABC MR MR 44 42 300 2.59±0.05 2.53±0.09 2<br />
4.00 1385.1 ABC MR MR 46 36 300 2.73±0.05 2.62±0.09 2<br />
4.00 1425.0 ABC MR MR 32 − 300 2.65±0.05 2.57±0.09 2<br />
M 84 1.65 4860.1 a ABC MR MR 15 11 300 2.94±0.06 2.88±0.08 3<br />
1.65 1413.0 AB MR MR 140 140 120 6.03±0.12 6.44±0.24 3<br />
4.5 4860.1 a C MR MR 23 20 300 2.98±0.06 2.88±0.08 3<br />
4.5 1464.9 B MR MR 120 70 120 6.14±0.12 6.32±0.24 3<br />
4.5 1413.0 AB MR MR 210 150 120 5.99±0.12 6.44±0.24 3<br />
4.5 1385.1 B MR MR 130 69 120 6.46±0.13 6.51±0.24 3<br />
References: 1 Gregory & Condon (1991); 2 Kühr et al. (1981); 3 Laing & Peacock (1981); 4 White & Becker (1992).<br />
a Although the 1980 and 1981 observations have a centre frequency of 4885.1 MHz, the weighted mean for the combined dataset is<br />
still close to 4860.1 MHz.<br />
flux densities using the AIPS verbTVSTAT. We estimate that the errors are dominated by a residual<br />
scale error of≈2%. All of the results are in excellent agreement with single-<strong>di</strong>sh measurements<br />
(Table 6).<br />
The configurations, resolutions, deconvolution algorithms and noise levels for the final images<br />
are listed in Table 6. The noise levels were measured before correction for the primary beam, and<br />
are appropriate for the centre of the field.<br />
.2 Images<br />
Our conventions are as follows:<br />
1. images of total intensity are show as grey-scales, over a range in<strong>di</strong>cated by the labelled<br />
wedges.<br />
138
.2. Images 139<br />
2 4 6<br />
2 4 6 8 10<br />
35 48 30<br />
(g)<br />
15<br />
DECLINATION (J2000)<br />
00<br />
47 45<br />
30<br />
15<br />
00<br />
02 09 43 42 41 40 39 38 37 36 35 34<br />
RIGHT ASCENSION (J2000)<br />
p = 1<br />
02 09 43 42 41 40 39 38 37 36 35 34<br />
RIGHT ASCENSION (J2000)<br />
Figure 11: 0206+35 at 4.9 GHz with angular resolution of 1.2 arcsec FWHM. Left: total intensity<br />
<strong>di</strong>stribution I in mJy (beam area) −1 . Right: apparent B a vectors with lengths proportional to p 4.9<br />
derived from the 3-frequency RM fit, superimposed on a false-colour <strong>di</strong>splay of I.<br />
2. We also show intensity gra<strong>di</strong>ent for 0755+37 and M 84,|∇I|, derived using a Sobel filter<br />
(Sobel & Feldman, 1968).<br />
3. Linear polarization is illustrated by plots in which vectors have lengths proportional to<br />
the degree of polarization at 4.9 GHz (p 4.9 ) and <strong>di</strong>rections along the apparent magnetic<br />
field (B a ). They are superposed on false-colour images of either I (again with a labelled<br />
wedge in<strong>di</strong>cating the range) or|∇I|. B a ) vectors are plotted where I ≥ 5σ I . A value of<br />
p = 1 is in<strong>di</strong>cated by the labelled bar. The apparent field <strong>di</strong>rection isχ 0 +π/2, where<br />
χ 0 is the E-vector position angle corrected to zero-wavelength by fitting to the relation<br />
χ(λ 2 )=χ 0 + RMλ 2 for foreground Faraday rotation. In some sources, we used the RM<br />
images at lower resolution to correct the position angles. This procedure is valid if the RM<br />
varies smoothly over the low-resolution image, and maximises the area over which we can<br />
determine the <strong>di</strong>rection of the apparent field.<br />
4. The restoring beam is shown in the bottom left-hand corner of each plot.<br />
5. We refer to parts of the sources by the abbreviations N, S, E, W (for North, South, East,<br />
West) etc.<br />
6. We refer to the main (brighter) and counter (fainter) jets.<br />
139
140 Data reduction and imaging of lobed ra<strong>di</strong>o galaxies<br />
.2.1 0206+35<br />
The left panel of Fig. 11 shows the total intensity <strong>di</strong>stribution over all of 0206+35 at 4.9 GHz,<br />
1.2 arcsec resolution.<br />
At this resolution, both lobes are circular in cross-section and show sharp outer boundaries,<br />
particularly to the NW and SE of the source, plus some fainter <strong>di</strong>ffuse emission to the N and S.<br />
If the orientation ofθ≈40 ◦ determined for the inner jets (Laing & Bridle, in preparation) also<br />
applies to the lobes, then they are presumably ellipsoidal with an axial ratio≈1. The figure also<br />
shows internal structure in both jets. NW jet has the brighter base, and both bends and brightens<br />
as it enters its lobe, after which its path meanders. The SE counter-jet appears to expand more<br />
rapidly initially, then also meanders as it enters its lobe. The right panel of Fig. 11 illustrates that<br />
the magnetic field configuration in both lobes is well ordered and basically circumferential, while<br />
near the central lines of the jets it is predominantly perpen<strong>di</strong>cular to their axis, with evidence for<br />
parallel field at the jet edges. The southern edge of the source is strongly polarized with magnetic<br />
field tangential to the source boundary.<br />
.2.2 0755+37<br />
Figs. 12(a) and (b) show the total intensity <strong>di</strong>stribution over all of 0755+37 at two resolutions<br />
and frequencies. Fig. 12(a) at 1.4 GHz, 4.0 arcsec resolution, shows that the large scale structure<br />
consists of two lobes, again roughly circular in projection, with well-defined but not particularly<br />
sharp outer edges to the W and E, plus fainter <strong>di</strong>ffuse emission to the N and S. The E lobe has a<br />
series of narrow rings and brightness steps in the region where the brighter jet appears to terminate.<br />
They are recessed from the eastern boundary of this lobe and some may be the edges of thin shells.<br />
The structure of the W lobe is unusual, containing some arc-like features. and other structure<br />
suggestive of a rapidly decollimating counter-jet W of the nucleus, as previously described by<br />
Bon<strong>di</strong> et al. (2000), with a “hole”, or deficit of emission in the region where the counter-jet<br />
might be expected to terminate. Although partially resolved out, all of these internal structures<br />
are confirmed by the higher resolution image at 4.9 GHz, 1.3-arcsec resolution (Fig. 12(b)).<br />
Figs. 12(c) and (d) show that the magnetic field in both lobes is exceptionally well organised, and<br />
mainly tangential to the lobe boundaries, at both the angular resolutions. At the lower resolution,<br />
the degree of linear polarization p≤0.6 over much of both lobes. Noteworthy is the excellent<br />
alignment between the field vectors and the ridges of high brightness gra<strong>di</strong>ent on both sides of the<br />
source.<br />
140
.2. Images 141<br />
0 2 4 6 8 10 12 14<br />
37 48 30<br />
15<br />
00<br />
(a)<br />
(c)<br />
DECLINATION (J2000)<br />
47 45<br />
30<br />
15<br />
00<br />
46 45<br />
30<br />
15<br />
00<br />
0.0 0.5 1.0 1.5 2.0 2.5<br />
p = 1<br />
0.5 1.0 1.5 2.0 2.5<br />
37 48 30<br />
15<br />
00<br />
(b)<br />
(d)<br />
DECLINATION (J2000)<br />
47 45<br />
30<br />
15<br />
00<br />
46 45<br />
30<br />
15<br />
00<br />
07 58 36 34 32 30 28 26 24 22 20<br />
RIGHT ASCENSION (J2000)<br />
p = 1<br />
07 58 36 34 32 30 28 26 24 22 20<br />
RIGHT ASCENSION (J2000)<br />
Figure 12: images of 0755+37 at 4.0 arcsec (panels a and c) and 1.3 arcsec (panels b and d). (a)<br />
Total intensity at 1.4 GHz in mJy beam −1 . (b) Total intensity at 4.9 GHz in mJy beam −1 . Apparent<br />
B a vectors with lengths proportional to p 4.9 from the 3-frequency RM fits, superimposed on a<br />
false-colour <strong>di</strong>splay at 4.9 GHz of the intensity gra<strong>di</strong>ent (c) and the total intensity (d). The panels<br />
show identical areas.<br />
.2.3 M 84<br />
The left panel of Fig. 13 shows the total intensity <strong>di</strong>stribution over M 84 at 1.65 arcsec FWHM<br />
resolution. The source appears to be an interme<strong>di</strong>ate case between lobed and tailed sources: the<br />
lobes, in particular the NE one, more closely resemble the inner plumes in FR I sources(3C 31,<br />
Laing et al. 2008), albeit on a much smaller linear scale (∼6 kpc) and somewhat rounder shape.<br />
On the other hand, the spectral gra<strong>di</strong>ents (Laing et al. in preparation) are more characteristic of<br />
lobed sources, with no hint of steepening outwards. Both jets expand rapidly and deflect within<br />
about 1 arcmin of the nucleus. They are surrounded by <strong>di</strong>ffuse emission, at least in projection,<br />
everywhere except perhaps within a few arcsec of the nucleus. The North jet is brighter at its base<br />
and forms a plume-like structure without well-defined edges after deflecting though approximately<br />
141
142 Data reduction and imaging of lobed ra<strong>di</strong>o galaxies<br />
0 2 4 6 8 10<br />
12 54 30<br />
00<br />
53 30<br />
DECLINATION (J2000)<br />
00<br />
52 30<br />
00<br />
51 30<br />
12 25 09 08 07 06 05 04 03 02 01<br />
RIGHT ASCENSION (J2000)<br />
p = 1<br />
12 25 09 08 07 06 05 04 03 02 01<br />
RIGHT ASCENSION (J2000)<br />
Figure 13: Images of M 84 at 1.65 arcsec resolution. Left: Total intensity at 4.9 GHz in mJy<br />
(beam area) −1 . Right: Apparent B a vectors with lengths proportional to p 4.9 derived from the<br />
4-frequency RM fits at 4.5 arcsec, superimposed on a false-colour <strong>di</strong>splay of the total intensity<br />
gra<strong>di</strong>ent at 4.9 GHz.<br />
90 ◦ in projection. Lower-resolution observations were previously shown by Laing & Bridle (1987)<br />
so are not repeated here.<br />
The right panel of Fig. 13 shows the apparent magnetic field structure. In the N lobe, the<br />
magnetic field is predominantly perpen<strong>di</strong>cular to the presumed path of the jet along its mid-line.<br />
The magnetic field in the S lobe is broadly circumferential and a sudden increase in the degree of<br />
polarization at the edge of the lobe is apparent.<br />
142
Bibliography<br />
Ackermann, M., Ajello, M., Allafort, A., Bal<strong>di</strong>ni, L., et al., 2010, ApJ, 717, 127<br />
Allen, S. W., Taylor, G. B., Nulsen, P. E. J., Johnstone, R. M., et al. 2001, MNRAS, 324, 842<br />
Andernach, H., Feretti, L., Giovannini, G. et al. 1992, A&A, 93, 331<br />
Antonucci, R., 1993, ARA&A, 31, 473<br />
Baars J.W.M., Genzel R., Pauliny-Toth I.I.K., Witzel, A., 1977, A&A, 61, 99<br />
Balbus, S. A. 2000, ApJ, 534, 420<br />
Barthel, P., 1989, SciAm, 260, 20<br />
Bagchi, J., Durret, F., Lima Neto, G.B., Paul, S. 2006, Science, 314, 791<br />
Baum, Stefi Alison, Heckman, Timothy M., Bridle, Alan, van Breugel, Wil J. M., Miley, George<br />
K, 1988, ApJS, 68, 643<br />
Beck R., 1996, ASPC, 97, 475<br />
Beck R. & Krause M., 2005, AN, 326, 414<br />
Bicknell, G.V., 1994, ApJ, 422, 542<br />
Bicknell, G.V., Cameron, R.A. & Gingold, R.A., 1990, ApJ, 357, 373<br />
Biermann, P., Kronberg, P. P. & Madore, B. F., 1982, ApJ, 256, 37<br />
Binney, J., Tabor, G., 1995, MNRAS, 276, 663<br />
Biretta J.A., Zhou F. & Owen F.N., 1995, ApJ, 447, 582<br />
Biretta, J.A., Sparks, W.B. & Macchetto, F., 1999, ApJ, 520, 621<br />
Birkinshaw, M., Laing, R. A. & Peacock, J. A. 1981, MNRAS, 197, 253<br />
143
144 BIBLIOGRAPHY<br />
Bîrzan, L., Rafferty, D. A., McNamara, B. R., Wise, M. W., Nulsen, P. E. J., 2004, ApJ, 607, 800<br />
Bîrzan, L., McNamara, B.R., Nulsen, P.E.J., Carilli, C.L., Wise, M.W., 2008, ApJ, 686, 859,<br />
Blanton, E.L., Sarazin, C. L., McNamara, B. R. Wise, M. W., 2001, ApJL, 558, L15<br />
Blanton, E.L., Gregg, M.D., Helfand, D.J., Becker, R.H., White, R.L., 2003, AJ, 125, 1635<br />
Blasi, P., 2000, ApJ, 532, 9<br />
Bogdanović, T., Reynolds, C. S., Balbus, S. A. & Parrish, I. J. 2009, ApJ, 704, 211<br />
Bonafede, A., Giovannini, G., Feretti, L., Govoni, F. & Murgia, M., 2009, A&A, 494, 429<br />
Bonafede, A., Feretti, L., Murgia, M., Govoni, F., et al., 2010, A&A, 513, 30<br />
Bon<strong>di</strong>, M., Parma, P., de Ruiter, H., Fanti, R., Laing, R.A., Fomalont, E.B., 2000, MNRAS, 314,<br />
11<br />
Bower, G.A., Heckman, T.M., Wilson, A.S., Richstone, D.O., 1997, ApJ, 483, 33<br />
Bower, G. A., Green, R. F., Quillen, A. C., Danks, A., et al., 2000, ApJ, 534, 189<br />
Brentjens M. A. & de Bruyn A. G., 2005, A&A, 441, 1217<br />
Bridle, A. H. & Perley, R. A, 1984, ARA& A, 22, 319<br />
Brüggen M., Ruszkowski M., Simionescu A., Hoeft M., Dalla Vecchia C., 2005, ApJ, 631, L21<br />
Brunetti, G., Setti, G., Feretti, L. & Giovannini, G. 2001, MNRAS, 320, 365<br />
Brunetti, G. & Lazarian, A., 2007, MNRAS, 378, 245<br />
Burn, B.J., 1966, MNRAS, 133, 67<br />
Canosa, C. M., Worrall, D. M., Hardcastle, M. J., Birkinshaw, M., 1999, MNRAS, 310, 30<br />
Carilli, C. L., Perley, R. A. & Harris, D. E., 1994, MNRAS, 270, 173<br />
Carilli, C.L., Perley, R.A. & Dreher, J.W., 1988, ApJL, 334, L73<br />
Carilli, C.L. & Taylor, G.B., 2002, ARAA, 40, 319<br />
Cassano, R. & Brunetti, G., 2005, MNRAS, 357, 1313<br />
Cavagnolo, K. W., McNamara, B. R., Nulsen, P. E. J. Carilli, C. L., et al. 2010, ApJ, 720, 1066<br />
Cavaliere A. & Fusco-Femiano R., 1976, A&A, 49, 137<br />
144
BIBLIOGRAPHY 145<br />
Churazov, E., Forman, W.R., Vikhlinin, A., Tremaine, S., et al., 2008, MNRAS, 388.1062<br />
Clarke T. E., 2004, JKAS, 37, 337<br />
Clarke, T.E. & Ensslin, T.A. 2006, AJ, 131.2900<br />
Croston, J. H., Hardcastle, M. J., Birkinshaw, M., Worrall, D. M. 2003, MNRAS, 346, 1041<br />
Croston, J. H., Birkinshaw, M., Hardcastle, M. J., Worrall, D. M., 2004, MNRAS, 353, 879<br />
Croston, J. H., Hardcastle, M. J., Birkinshaw, M., 2005, MNRAS, 357, 279<br />
Croston, J. H., Kraft, R. P., Hardcastle, M. J, 2007, ApJ, 660, 191<br />
Croston, J.H., Hardcastle, M.J., Birkinshaw, M., Worrall, D.M., Laing, R.A., 2008, MNRAS, 386,<br />
1709<br />
Croston, J. H.,Hardcastle, M. J., Mingo, B., Evans, D. A., Dicken, D., Morganti, R., Tadhunter,<br />
C. N., 2010arXiv1011.6405<br />
de Vaucouleurs, G, de Vaucouleurs,A., Corwin, Jr. H.G., Buta, R.J., Paturel, G., Fouqué<br />
P., 1991, Third Reference Catalogue of Bright Galaxies, Springer, New York, NY (USA).<br />
http://adsabs.harvard.edu/abs/1995yCat.7155....0D<br />
De Young, D. S., 2006 ApJ, 648, 200,<br />
Dineen, P. & Coles, P. 2005, MNRAS, 362,403<br />
Dolag, K., 2006, Astronomische Nachrichten, 327, 575<br />
Dolag, K., Schindler, S., Govoni, F., Feretti, L., 2001, A&A, 378, 777<br />
Dolag K., Bartelmann M., & Lesch H., 2002, A&A, 387, 383<br />
Dolag K., Bykov A. M. & Diaferio A., 2008, SSRv, 134, 311<br />
Dreher, J.W., Carilli, C.L. & Perley, R.A., 1987, ApJ, 316, 611<br />
Dursi, L.J. & Pfrommer, C., 2008, ApJ, 677, 993<br />
Eckert, D., Produit, N., Paltani, S., Neronov, A., Courvoisier, T. J.-L., 2008, A&A, 479, 27<br />
Eilek, J. A., Burns, J. O., O’Dea, C. P., Owen, F. N., 1984, ApJ, 278, 37E<br />
Eilek, J.A. & Owen, F.N., 2002, ApJ, 567, 202<br />
Enßlin, T.A., Biermann, P.L., Klein, U. & Kohle, S. 1998, A&A, 332, 395<br />
145
146 BIBLIOGRAPHY<br />
Ensslin, T.A. & Gopal-Krishna 2001, A&A, 366, 26<br />
Enßlin T.A. & Vogt C. 2003, A&A, 401, 835<br />
Enßlin, T.A., Vogt, C., 2005, A&A, 434, 67<br />
Fabian, A. C., Sanders, J. S., Ettori, S., Taylor, G. B. et al., 2000, MNRAS, 318, 65<br />
Fabian, A. C., Sanders, J. S., Allen, S. W., Crawford, C. S., et al. 2003, MNRAS, 344, 43<br />
Fanaroff, B.L., Riley, J.M., 1974, MNRAS, 167, 31P<br />
Faraday, M., 1846, Experimental Researches in Electricity. Nineteenth SeriesPhil. Trans. R. Soc.<br />
Lond., 136:1-20<br />
Felten J.E., 1996, in Trimble V., Reisenegger A., eds, ASP Conf. Ser. 88, Clusters, Lensing and<br />
the future of the Universe, Astron. Soc. Pac., San Francisco, p. 271<br />
Feretti, L., Perley, R., Giovannini, G. & Andernach, H. 1999a, A&A, 341, 29<br />
Feretti, L., Dallacasa, D., Govoni, F., et al. 1999b, A&A, 344, 472<br />
Feretti, L., Orrú, E., Brunetti, G., Giovannini, G., et al., 2004, A&A, 423, 111<br />
Ferrari, C., Govoni, F., Schindler, S., Bykov, A. M., Rephaeli, Y., 2008, SSRv, 134, 93<br />
Finoguenov, A. & Jones, C., 2001, ApJ, 547, 107<br />
Finoguenov, A., Davis, D.S., Zimer, M., Mulchaey, J.S., 2006, ApJ, 646, 143<br />
Finoguenov, A., Ruszkowski, M., Jones, C., Brüggen, M., et al., 2008, ApJ, 686, 911<br />
Forman, W., Schwarz , J.Jones, C., Liller, W., Fabian, A. C., 1979, 234, 27<br />
Forman, W.R., J.Jones, C., 1982, ARA&A, 20, 547<br />
Forman, W.R., Nulsen, P.E.G., Heinz, S., et al., 2005, ApJ, 635, 894<br />
Forman W.R., Jones, C., Churazov E., Markevitch, M., et al., 2007, ApJ, 665, 1057<br />
Fujita, Y., Takizawa, M. & Sarazin, C. L., 2003, ApJ, 584, 190<br />
Garrington S. T., Leahy J. P., Conway R. G., Laing R. A., 1988, Nature, 331, 147<br />
Giacintucci, S., Venturi, T., Brunetti, G., Dallacasa, D., et al. 2009, A&A, 505, 45<br />
Giacintucci, S., O’Sullivan, E., Vrtilek, J. David, et al., 2011arXiv1103.1364<br />
146
BIBLIOGRAPHY 147<br />
Giovannini, G., Feretti, L., Venturi, T., Kim, K.-T., Kronberg, P. P., 1993, ApJ, 406, 399<br />
Giovannini, G. & Feretti L., 2002, ASSL, 272, 197<br />
Gitti, M., O’Sullivan, E., Giacintucci, S., David, L.P., 2010, ApJ, 714, 758,<br />
Goldreich, P. & Sridhar, S., 1997, ApJ, 485, 680<br />
Goodger, J.L., Hardcastle, M.J., Croston, J.H., Kassim, N.E., Perley, R.A., 2008, MNRAS, 386,<br />
337<br />
Govoni, F., Taylor, G.B., Dallacasa, D., Feretti, L. & Giovannini, G. 2001, A&A, 379, 807<br />
Govoni, F. & Feretti, L., 2004, International Journal of Modern Physics D 13, 1549<br />
Govoni F., Murgia M., Feretti L.,Giovannini G., et al., 2006, A&A, 460, 425<br />
Gregory, P.C. & Condon, J.J., 1991, ApJS, 75, 1011<br />
Greisen E.W., Spekkens K. & van Moorsel G.A., 2009, AJ, 137, 4718<br />
Guidetti, D., Murgia, M., Govoni, F., Parma, P., et al., 2008, A&A, 483, 699<br />
Guidetti, D., Laing, R. A., Murgia, M., Govoni, F., et al., 2010, A&A, 514, 50<br />
Guidetti, D., Laing, R. A., Bridle, A.H., Parma.P, Gregorin, L., 2011, MNRAS, in press<br />
Guidetti, D., Laing, R. A., Bridle, A.H., Parma.P, Gregorini, L., in prep<br />
Guidetti, D., Laing, R. A., Bridle, A.H., Parma.P, Gregorini, L., in prep<br />
Hansen, L., Norgaard-Nielsen, H.U. & Jorgensen, H.E., 1985, A&A, 149, 442<br />
Hardcastle, M. J., Worrall, D. M. & Birkinshaw, M. 1998 MNRAS, 296, 1098<br />
Hardcastle, M. J., Birkinshaw, M., Cameron, R. A. Harris, D. E., et al., 2002, ApJ, 581, 948<br />
Harris, D.E., Stern, C.P., Willis, A.G., Dewdney, P.E. 1993, AJ, 105, 769<br />
Harris, D.E., Cheung, C.C., Biretta, J.A., Sparks W.B., 2006, 640, 211<br />
Helsdon, S. F. & Ponman, T. J., 2000, MNRAS, 315, 356<br />
Iwasawa, K., Ettori, S., Fabian, A. C., Edge, A. C., Ebeling, H., 2000, MNRAS, 313, 515<br />
Isobe, N., Seta, H., Gandhi, P., Tashiro, M. S., 2011, ApJ, 727, 82<br />
Jaffe, W.J., ApJ, 1980, 241, 925<br />
147
148 BIBLIOGRAPHY<br />
Jeltema, T.E. & Profumo, S., 2011, ApJ, 728, 53<br />
Jetha, N. N., Ponman, T. J., Hardcastle, M. J., Croston, J. H., 2007, MNRAS, 378, 384<br />
Kaiser, C. R. & Alexander, P., 1997, MNRAS, 286, 215,<br />
Kataoka, J. & Stawarz, L., 2005, ApJ, 622, 797<br />
Kolmogorov, A.N., 1941, Dokl. Nauk. Acad. SSSR, 30, 301<br />
Konar, C., Hardcastle, M. J.,Croston, J. H. Saikia, D. J., 2009, MNRAS, 400, 480<br />
Kovalev, Y. Y., Lister, M. L., Homan, D. C., Kellermann, K. I. 2007, ApJ, 668, 27<br />
Kraft, R.P., Vźquez, S.E., Forman, W.R., Jones C., et al., 2003, ApJ, 592, 129<br />
Kriss, G. A., Canizares, C. R., McClintock, J. E, Feigelson, E. D., 1980, ApJ, 235, 61<br />
Kuchar, P. & Enßlin, T.A., 2009arXiv0912.3930K<br />
Kühr, H., Witzel, A., Pauliny-Toth, I.I.K., Nauber, U., 1981, A&AS, 45, 367<br />
Laing, R.A., 1988, Nature, 331, 149<br />
Laing, R.A. & Bridle, A.H., 1987, MNRAS, 228, 557<br />
Laing, R. A., 1993, ASSL, 103, 95, Ra<strong>di</strong>o observations of jets: large scales, Astrophysics and<br />
Space Science Library, vol. 103 http://cdsads.u-strasbg.fr/abs/1993ASSL..103...95L<br />
Laing R.A. & Peacock J.A., 1980, MNRAS, 190, 903<br />
Laing, R. A. & Bridle, A. H. 2002, MNRAS, 336, 328<br />
Laing, R. A., Canvin, J. R., Cotton, W. D., Bridle, A. H. 2006, MNRAS, 368, 48<br />
Laing, R.A., Canvin, J.R, Bridle, A.H., Hardcastle, M.J., 2006b, MNRAS, 372, 510<br />
Laing, R.A., Guidetti D. & Bridle, A.H., in prep<br />
Laing, R.A. & Bridle, A.H., in prep<br />
Laing, R.A., Bridle, A.H., Parma, P., Murgia, M., 2008, MNRAS, 386, 657<br />
Laing, R.A., Guidetti, D., Bridle, A.H., Parma, P., Bon<strong>di</strong>, M., MNRAS, 2011, in prep.<br />
Landau, L.D., Lifshitz, E.M., 1987, Fluid mechanics, Course of theoretical physics, Vol.6<br />
Pergamon Press, Oxford<br />
148
BIBLIOGRAPHY 149<br />
Laskar, T., Fabian, A. C., Blundell, K. M., Erlund, M. C.,MNRAS, 401, 1500<br />
Lawler, J.M. & Dennison B., 1982, ApJ, 252, 81<br />
Leahy J.P. & Perley R.A., 1991, AJ, 102, 537<br />
Longair, M. S., High energy astrophysics. Volume 2. Stars, the Galaxy and the<br />
interstellar me<strong>di</strong>um, Cambridge University Press, Cambridge (UK), 1994 http://cdsads.ustrasbg.fr/abs/1994hea2.book.....L<br />
Lutovinov A. A., Vikhlinin A., Churazov E. M., Revnivtsev M. G., Sunyaev R. A., 2008, ApJ,<br />
687, 968<br />
Mathews, W. G. & Brighenti, F., 2003, ApJ, 599, 992<br />
Matsushita, K., Belsole, E., Finoguenov, A., Böhringer H., 2002, A&A, 386, 77<br />
McNamara, B. R., Nulsen, P. E. J., Wise, M. W., Rafferty, et al., 2005, Nature, 433, 45<br />
McNamara, B.R. & Nulsen, P. E. J., 2007, ARA&A, 45, 117<br />
McNamara, B.R., Wise, M., Nulsen, P.E.J., David, L.P., et al., 2000, ApJ, 534, L135<br />
Meier, D. L., 2002, NewAR, 46, 247<br />
Miller, N. A., Ledlow, M. J., Owen, F. N., F. N. and Hill, J. M., 2002, AJ, 123, 3018<br />
Minter, A.H. & Spangler, S.R., 1996, ApJ, 458, 194<br />
Morganti, R., Fanti, R., Gioia, I. M., Harris, D. E. Parma, P., de Ruiter, H., 1988, A&A 189, 11<br />
Morganti, R., Parma, P., Capetti, A., Fanti, R., de Ruiter, H.R., 1997, A&A, 326, 919<br />
Mulchaey, J.S., Davis, D.S., Mushotzky, R.F., Burstein, D. 2003, ApJS, 145, 39<br />
Murgia, M., Govoni, F., Feretti, L., Giovannini, G., et al., 2004, A&A, 424, 429<br />
Murgia, M., Eckert, D., Govoni, F., Ferrari, C., et al., 2010, A&A, 514, 76<br />
Nulsen P.E.J., David, L. P., McNamara, B. R. Jones, C., Forman, W. R., Wise, M., 2002, ApJ, 568,<br />
163<br />
Nulsen P.E.J., McNamara B.R., Wise M.W., David L.P., 2005, ApJ, 628, 629<br />
Nulsen, P. E. J., Hambrick, D. C., McNamara, B. R., Rafferty, D., et al., 2005, ApJ, 625, 9<br />
O’Dea, C. P. & Owen, F. N., 1986, ApJ, 301, 841<br />
149
150 BIBLIOGRAPHY<br />
Owen, F.N., 1989, BAPS, 34.1278<br />
Owen, F.N., Eilek, J.A. & Keel, W.C., 1990, ApJ, 362, 449<br />
Owen, F.N., Eilek, J.A. & Kassim, N.E. , 2000, ApJ, 543, 611<br />
Perley, R. A., Willis, A. G. & Scott, J. S. 1979, Nature, 281, 437<br />
Petrosian V., 2001, ApJ, 557, 560<br />
Petrosian V., 2003, ASPC, 301, 337<br />
Pfrommer, C., Enßlin, T. A. & Springel, V., 2008, MNRAS, 385.1211<br />
Regis, M., 2011, arXiv1101.5524<br />
Rephaeli Y., 1977, ApJ, 218, 323<br />
Rephaeli Y., Gruber D. & Arieli Y., 2006, ApJ, 649, 673<br />
Rice, S.O., Bell System Technical Journal 24 (1945) 46<br />
Röettiger, K., Burns, J.O. & Stone, J.M. 1999, ApJ, 518, 603<br />
Rybicki, G. B. & Lightman, A. P., 1986,rpa, book, Ra<strong>di</strong>ative Processes in Astrophysics, Wiley-<br />
VCH, http://cdsads.u-strasbg.fr/abs/1986rpa..book.....R<br />
Sarazin, C.L. 1988, X-ray emission from clusters of galaxies, (Cambridge University Press)<br />
Scheuer, P. A. G.,1974, MNRAS, 166, 513<br />
Schekochihin, A.A., Cowley, S.C., 2006, Phys. Plasmas, 13, 56501<br />
Schlickeiser, R., Sievers, A., Thiemann, H, 1987, A&A, 182, 21<br />
Simard-Norman<strong>di</strong>n, M., Kronberg, P. P., Button, S., 1981, ApJS, 45, 97<br />
Simonetti, J.H., Cordes, J.M. & Spangler, S.R., 1984, ApJ, 284, 126<br />
Slee, O. B., Roy, A. L., Murgia, M., Andernach, H., Ehle, M., 2001, AJ, 122.1172<br />
Stokes, G.C., 1856, On the composition and resolution of streams of polarized light from <strong>di</strong>fferent<br />
sources, Cambridge Philosophical Society Transactions, IX:399-416, 1856.<br />
Swain, M.R., 1996, PhD. Thesis, University of Rochester, NY, USA<br />
Swain, M. R., Bridle, A. H. & Baum, S., 1998, ApJ, 1998, 507, 29<br />
150
BIBLIOGRAPHY 151<br />
Taylor, G.B. & Perley, R.A. 1993, ApJ, 416, 554<br />
Timokhin, A. N., Aharonian, F. A., Neronov, A.Yu, 2004, A&A, 417, 391<br />
Trager, S. C., Faber, S. M., Worthey, G., González, J. J, 2000, AJ, 119, 1645<br />
Tribble, P.C., 1991, MNRAS, 250, 726<br />
Trinchieri, G., Fabbiano G., & Kim, D.-W., 1997, A&A ,318, 361<br />
Trussoni, E., Massaglia, S., Ferrari, R., Fanti, R., et al., 1997, A&A, 327, 27<br />
Ulvestad J.S., Perley R.A., Chandler C.J. 2009, The Very Large Array Observational Status<br />
Summary, NRAO, Socorro, http://www.vla.nrao.edu/astro/guides/vlas/current/<br />
Urry, C. M & Padovani, P., 1995, PASP, 107, 803<br />
van Weeren, R. J., Röttgering, H. J. A., Brüggen, M. & Hoeft, M., 2010, Sci, 330, 347<br />
VLA Staff, 2010, EVLA Transition for Observers,<br />
http://www.vla.nrao.edu/astro/guides/evlareturn/vla-evla/<br />
Wardle, J. F. C. & Kronberg, P. P. 1974, ApJ, 194, 249<br />
White, R.L. & Becker, R.H., 1992, ApJS, 79, 331<br />
Wik, D. R., Sarazin, C. L., Finoguenov, A., Baumgartner, W. H., et al., 2011, ApJ, 727, 119<br />
Wilson, A. S., Young, A. J. &Shopbell, P. L.,2001, ApJ, 547, 740<br />
Wilson, A.S., Smith, D.A., Young, A.J., 2006, ApJ, 644,9<br />
Worrall, D. M. & Birkinshaw, M., 1994, ApJ, 427, 134<br />
Worrall, D. M. & Birkinshaw, M., 2000, ApJ, 530, 719<br />
Worrall, D. M., Birkinshaw, M. & Hardcastle, M. J., MNRAS, 2001, 326, 7<br />
Worrall, D. M., Birkinshaw, M., O’Sullivan, E., Zezas, A., et al., MNRAS, 2010, 408,701<br />
Wu, Q., Feng Y. & Xinwu C., 2007, ApJ, 669, 96<br />
Xue, S.-J. & Wu, X.-P., 2002,ApJ, 576, 152<br />
Zwicky, F. & Kowal, C. T., 1968, Catalogue of Galaxies and of Clusters of Galaxies, Vol. 6.<br />
California Institute of Technology, Pasadena<br />
151
152 BIBLIOGRAPHY<br />
152
Acknowledgments<br />
Probably the most important result is that during this PhD I have grown not only as scientist but<br />
as person. For this, I owe many people a debt of gratitude for all my life.<br />
I am privileged for having Robert Laing as supervisor, this thesis would not have been possible<br />
without his help and patience. I have learned many valuable things from him, and I also wish to<br />
express gratitude for believing in me. One simply could not wish for a better supervisor.<br />
I thank Paola Parma and Loretta Gregorini for their help and support.<br />
I would like to acknowledge ESO (Garching) for the award of a ESO Studentship that allowed<br />
me to breath a wide spirit of research and to grow.<br />
I wish to thank Matteo Murgia, Federica Govoni and the staff of the Astronomical Observatory<br />
of Cagliari for their hospitality and support during the development of the work on 3C 449.<br />
The work on this ra<strong>di</strong>o galaxy is part of the “Cybersar” Project, which is managed by the<br />
COSMOLAB Regional Consortium with the financial support of the Italian Ministry of University<br />
and Research (MUR), in the context of the “Piano Operativo Nazionale Ricerca Scientifica,<br />
Sviluppo Tecnologico, Alta Formazione (PON 2000-2006)”. I wish to thank Luigina Feretti for<br />
provi<strong>di</strong>ng the excellent VLA dataset of 3C 449 and Greg Taylor for the use of his rotation measure<br />
code. I also thank M. Swain for provi<strong>di</strong>ng the VLA dataset for 3C 353, J. Eilek for a FITS image<br />
of 3C 465 and J. Croston, A. Finoguenov and J. Goodger for the FITS images of 3C 270, M 84 and<br />
3C 353, respectively.<br />
I am grateful to M. Bon<strong>di</strong>, G. Brunetti, A. Shukurov and J. Stöckl for many valuable<br />
comments. I also acknowledge the use of HEALPIX package (http://healpix.jpl.nasa.gov) and<br />
the provision of the models of Dineen & Coles (2005) inHEALPIX format.<br />
The last but certainly not least words are for all of You which “see all my light and love my<br />
dark”.<br />
“And thus I stand”.<br />
153


