Alma Mater Studiorum Universit`a degli Studi di Bologna ... - Inaf
Alma Mater Studiorum Universit`a degli Studi di Bologna ... - Inaf
Alma Mater Studiorum Universit`a degli Studi di Bologna ... - Inaf
Create successful ePaper yourself
Turn your PDF publications into a flip-book with our unique Google optimized e-Paper software.
16 2. The X-ray environment of ra<strong>di</strong>o galaxies<br />
where r is the projected ra<strong>di</strong>al <strong>di</strong>stance from the centroid of the X-ray surface brightness<br />
<strong>di</strong>stribution, S (0) is the central surface brightness, r c is the X-ray core ra<strong>di</strong>us andβ= µm pσ 2 r<br />
k B T<br />
. Here,<br />
µ is the mean molecular weight, m p is the proton mass, andσ r is the ra<strong>di</strong>al velocity <strong>di</strong>spersion of<br />
the galaxies.<br />
The model of Eq. 2.2 has the advantage that its shape is uniquely described by only two<br />
parameters: the core ra<strong>di</strong>us and the slopeβ. The latter determines the sharpness of the turnover<br />
beyond the core ra<strong>di</strong>us and the asymptotic slope of the scaling. Physically,β represents the ratio<br />
between the specific kinetic energy of the gravitationally bound galaxies and the specific thermal<br />
energy of the hot gas. Fits to the X-ray surface brightness profiles generally giveβ∼0.4-0.7,<br />
in<strong>di</strong>cating that the energy per unit mass is higher in the hot gas than in the galaxies. The core<br />
ra<strong>di</strong>us r c is highly correlated with the parameterβ, in the sense that larger r c corresponds to higher<br />
β: indeed, a given X-ray surface brightness can be reproduced by a concentrated <strong>di</strong>stribution with<br />
a rapid decline (small r c and highβ), or by a more <strong>di</strong>ffuse one with a flatter decline (large r c and<br />
lowβ). Typical ranges for the fitted X-ray parameters are summarized in Table 2.1.<br />
Assuming that the gas-density <strong>di</strong>stribution is isothermal and hydrostatic, the surface<br />
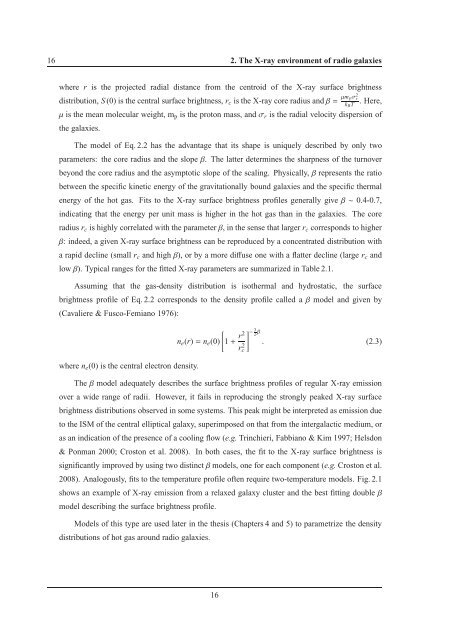
brightness profile of Eq. 2.2 corresponds to the density profile called aβmodel and given by<br />
(Cavaliere & Fusco-Femiano 1976):<br />
where n e (0) is the central electron density.<br />
] − 3<br />
n e (r)=n e (0)<br />
[1+ r2 2 β<br />
. (2.3)<br />
Theβmodel adequately describes the surface brightness profiles of regular X-ray emission<br />
over a wide range of ra<strong>di</strong>i. However, it fails in reproducing the strongly peaked X-ray surface<br />
brightness <strong>di</strong>stributions observed in some systems. This peak might be interpreted as emission due<br />
to the ISM of the central elliptical galaxy, superimposed on that from the intergalactic me<strong>di</strong>um, or<br />
as an in<strong>di</strong>cation of the presence of a cooling flow (e.g. Trinchieri, Fabbiano & Kim 1997; Helsdon<br />
& Ponman 2000; Croston et al. 2008). In both cases, the fit to the X-ray surface brightness is<br />
significantly improved by using two <strong>di</strong>stinctβmodels, one for each component (e.g. Croston et al.<br />
2008). Analogously, fits to the temperature profile often require two-temperature models. Fig. 2.1<br />
shows an example of X-ray emission from a relaxed galaxy cluster and the best fitting doubleβ<br />
model describing the surface brightness profile.<br />
Models of this type are used later in the thesis (Chapters 4 and 5) to parametrize the density<br />
<strong>di</strong>stributions of hot gas around ra<strong>di</strong>o galaxies.<br />
r 2 c<br />
16


