

Alma Mater Studiorum Universit`a degli Studi di Bologna ... - Inaf
Alma Mater Studiorum Universit`a degli Studi di Bologna ... - Inaf
Alma Mater Studiorum Universit`a degli Studi di Bologna ... - Inaf

Create successful ePaper yourself
Turn your PDF publications into a flip-book with our unique Google optimized e-Paper software.
64 4. The magneto-ionic me<strong>di</strong>um around 3C 449<br />
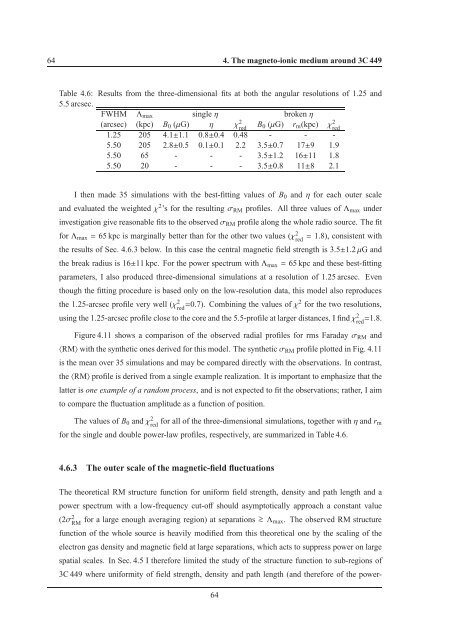
Table 4.6: Results from the three-<strong>di</strong>mensional fits at both the angular resolutions of 1.25 and<br />
5.5 arcsec.<br />
FWHM Λ max singleη brokenη<br />
(arcsec) (kpc) B 0 (µG) η χ 2 red<br />
B 0 (µG) r m (kpc) χ 2 red<br />
1.25 205 4.1±1.1 0.8±0.4 0.48 - - -<br />
5.50 205 2.8±0.5 0.1±0.1 2.2 3.5±0.7 17±9 1.9<br />
5.50 65 - - - 3.5±1.2 16±11 1.8<br />
5.50 20 - - - 3.5±0.8 11±8 2.1<br />
I then made 35 simulations with the best-fitting values of B 0 andηfor each outer scale<br />
and evaluated the weightedχ 2 ’s for the resultingσ RM profiles. All three values ofΛ max under<br />
investigation give reasonable fits to the observedσ RM profile along the whole ra<strong>di</strong>o source. The fit<br />
forΛ max = 65 kpc is marginally better than for the other two values (χ 2 red<br />
= 1.8), consistent with<br />
the results of Sec. 4.6.3 below. In this case the central magnetic field strength is 3.5±1.2µG and<br />
the break ra<strong>di</strong>us is 16±11 kpc. For the power spectrum withΛ max = 65 kpc and these best-fitting<br />
parameters, I also produced three-<strong>di</strong>mensional simulations at a resolution of 1.25 arcsec. Even<br />
though the fitting procedure is based only on the low-resolution data, this model also reproduces<br />
the 1.25-arcsec profile very well (χ 2 red =0.7). Combining the values ofχ2 for the two resolutions,<br />
using the 1.25-arcsec profile close to the core and the 5.5-profile at larger <strong>di</strong>stances, I findχ 2 red =1.8.<br />
Figure 4.11 shows a comparison of the observed ra<strong>di</strong>al profiles for rms Faradayσ RM and<br />
〈RM〉 with the synthetic ones derived for this model. The syntheticσ RM profile plotted in Fig. 4.11<br />
is the mean over 35 simulations and may be compared <strong>di</strong>rectly with the observations. In contrast,<br />
the〈RM〉 profile is derived from a single example realization. It is important to emphasize that the<br />
latter is one example of a random process, and is not expected to fit the observations; rather, I aim<br />
to compare the fluctuation amplitude as a function of position.<br />
The values of B 0 andχ 2 red for all of the three-<strong>di</strong>mensional simulations, together withηand r m<br />
for the single and double power-law profiles, respectively, are summarized in Table 4.6.<br />
4.6.3 The outer scale of the magnetic-field fluctuations<br />
The theoretical RM structure function for uniform field strength, density and path length and a<br />
power spectrum with a low-frequency cut-off should asymptotically approach a constant value<br />
(2σ 2 RM for a large enough averaging region) at separations > ∼ Λ max . The observed RM structure<br />
function of the whole source is heavily mo<strong>di</strong>fied from this theoretical one by the scaling of the<br />
electron gas density and magnetic field at large separations, which acts to suppress power on large<br />
spatial scales. In Sec. 4.5 I therefore limited the study of the structure function to sub-regions of<br />
3C 449 where uniformity of field strength, density and path length (and therefore of the power-<br />
64


