

Alma Mater Studiorum Universit`a degli Studi di Bologna ... - Inaf
Alma Mater Studiorum Universit`a degli Studi di Bologna ... - Inaf
Alma Mater Studiorum Universit`a degli Studi di Bologna ... - Inaf

You also want an ePaper? Increase the reach of your titles
YUMPU automatically turns print PDFs into web optimized ePapers that Google loves.
4.6. Three-<strong>di</strong>mensional analysis 63<br />
(a)<br />
(b)<br />
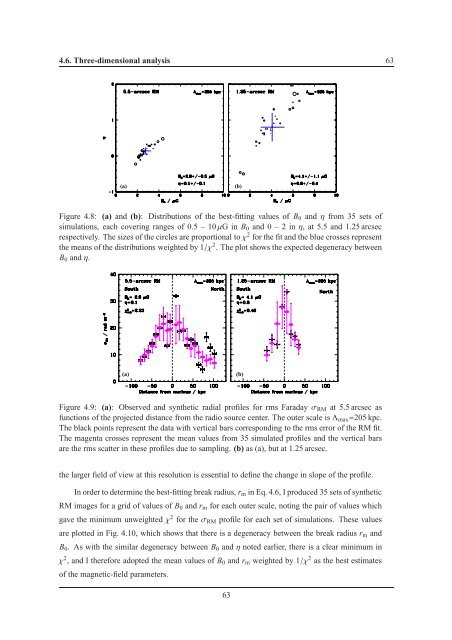
Figure 4.8: (a) and (b): Distributions of the best-fitting values of B 0 andηfrom 35 sets of<br />
simulations, each covering ranges of 0.5 – 10µG in B 0 and 0 – 2 inη, at 5.5 and 1.25 arcsec<br />
respectively. The sizes of the circles are proportional toχ 2 for the fit and the blue crosses represent<br />
the means of the <strong>di</strong>stributions weighted by 1/χ 2 . The plot shows the expected degeneracy between<br />
B 0 andη.<br />
(a)<br />
(b)<br />
Figure 4.9: (a): Observed and synthetic ra<strong>di</strong>al profiles for rms Faradayσ RM at 5.5 arcsec as<br />
functions of the projected <strong>di</strong>stance from the ra<strong>di</strong>o source center. The outer scale isΛ max =205 kpc.<br />
The black points represent the data with vertical bars correspon<strong>di</strong>ng to the rms error of the RM fit.<br />
The magenta crosses represent the mean values from 35 simulated profiles and the vertical bars<br />
are the rms scatter in these profiles due to sampling. (b) as (a), but at 1.25 arcsec.<br />
the larger field of view at this resolution is essential to define the change in slope of the profile.<br />
In order to determine the best-fitting break ra<strong>di</strong>us, r m in Eq. 4.6, I produced 35 sets of synthetic<br />
RM images for a grid of values of B 0 and r m for each outer scale, noting the pair of values which<br />
gave the minimum unweightedχ 2 for theσ RM profile for each set of simulations. These values<br />
are plotted in Fig. 4.10, which shows that there is a degeneracy between the break ra<strong>di</strong>us r m and<br />
B 0 . As with the similar degeneracy between B 0 andηnoted earlier, there is a clear minimum in<br />
χ 2 , and I therefore adopted the mean values of B 0 and r m weighted by 1/χ 2 as the best estimates<br />
of the magnetic-field parameters.<br />
63


