

Alma Mater Studiorum Universit`a degli Studi di Bologna ... - Inaf
Alma Mater Studiorum Universit`a degli Studi di Bologna ... - Inaf
Alma Mater Studiorum Universit`a degli Studi di Bologna ... - Inaf

Create successful ePaper yourself
Turn your PDF publications into a flip-book with our unique Google optimized e-Paper software.
138 Data reduction and imaging of lobed ra<strong>di</strong>o galaxies<br />
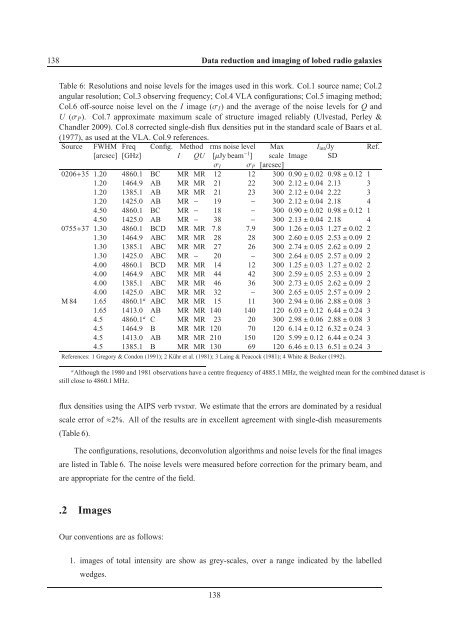
Table 6: Resolutions and noise levels for the images used in this work. Col.1 source name; Col.2<br />
angular resolution; Col.3 observing frequency; Col.4 VLA configurations; Col.5 imaging method;<br />
Col.6 off-source noise level on the I image (σ I ) and the average of the noise levels for Q and<br />
U (σ P ). Col.7 approximate maximum scale of structure imaged reliably (Ulvestad, Perley &<br />
Chandler 2009). Col.8 corrected single-<strong>di</strong>sh flux densities put in the standard scale of Baars et al.<br />
(1977), as used at the VLA. Col.9 references.<br />
Source FWHM Freq Config. Method rms noise level Max I int /Jy Ref.<br />
[arcsec] [GHz] I QU [µJy beam −1 ] scale Image SD<br />
σ I σ P [arcsec]<br />
0206+35 1.20 4860.1 BC MR MR 12 12 300 0.90±0.02 0.98±0.12 1<br />
1.20 1464.9 AB MR MR 21 22 300 2.12±0.04 2.13 3<br />
1.20 1385.1 AB MR MR 21 23 300 2.12±0.04 2.22 3<br />
1.20 1425.0 AB MR − 19 − 300 2.12±0.04 2.18 4<br />
4.50 4860.1 BC MR − 18 − 300 0.90±0.02 0.98±0.12 1<br />
4.50 1425.0 AB MR − 38 − 300 2.13±0.04 2.18 4<br />
0755+37 1.30 4860.1 BCD MR MR 7.8 7.9 300 1.26±0.03 1.27±0.02 2<br />
1.30 1464.9 ABC MR MR 28 28 300 2.60±0.05 2.53±0.09 2<br />
1.30 1385.1 ABC MR MR 27 26 300 2.74±0.05 2.62±0.09 2<br />
1.30 1425.0 ABC MR − 20 − 300 2.64±0.05 2.57±0.09 2<br />
4.00 4860.1 BCD MR MR 14 12 300 1.25±0.03 1.27±0.02 2<br />
4.00 1464.9 ABC MR MR 44 42 300 2.59±0.05 2.53±0.09 2<br />
4.00 1385.1 ABC MR MR 46 36 300 2.73±0.05 2.62±0.09 2<br />
4.00 1425.0 ABC MR MR 32 − 300 2.65±0.05 2.57±0.09 2<br />
M 84 1.65 4860.1 a ABC MR MR 15 11 300 2.94±0.06 2.88±0.08 3<br />
1.65 1413.0 AB MR MR 140 140 120 6.03±0.12 6.44±0.24 3<br />
4.5 4860.1 a C MR MR 23 20 300 2.98±0.06 2.88±0.08 3<br />
4.5 1464.9 B MR MR 120 70 120 6.14±0.12 6.32±0.24 3<br />
4.5 1413.0 AB MR MR 210 150 120 5.99±0.12 6.44±0.24 3<br />
4.5 1385.1 B MR MR 130 69 120 6.46±0.13 6.51±0.24 3<br />
References: 1 Gregory & Condon (1991); 2 Kühr et al. (1981); 3 Laing & Peacock (1981); 4 White & Becker (1992).<br />
a Although the 1980 and 1981 observations have a centre frequency of 4885.1 MHz, the weighted mean for the combined dataset is<br />
still close to 4860.1 MHz.<br />
flux densities using the AIPS verbTVSTAT. We estimate that the errors are dominated by a residual<br />
scale error of≈2%. All of the results are in excellent agreement with single-<strong>di</strong>sh measurements<br />
(Table 6).<br />
The configurations, resolutions, deconvolution algorithms and noise levels for the final images<br />
are listed in Table 6. The noise levels were measured before correction for the primary beam, and<br />
are appropriate for the centre of the field.<br />
.2 Images<br />
Our conventions are as follows:<br />
1. images of total intensity are show as grey-scales, over a range in<strong>di</strong>cated by the labelled<br />
wedges.<br />
138


