

Alma Mater Studiorum Universit`a degli Studi di Bologna ... - Inaf
Alma Mater Studiorum Universit`a degli Studi di Bologna ... - Inaf
Alma Mater Studiorum Universit`a degli Studi di Bologna ... - Inaf

Create successful ePaper yourself
Turn your PDF publications into a flip-book with our unique Google optimized e-Paper software.
4.5. Two <strong>di</strong>mensional analysis 57<br />
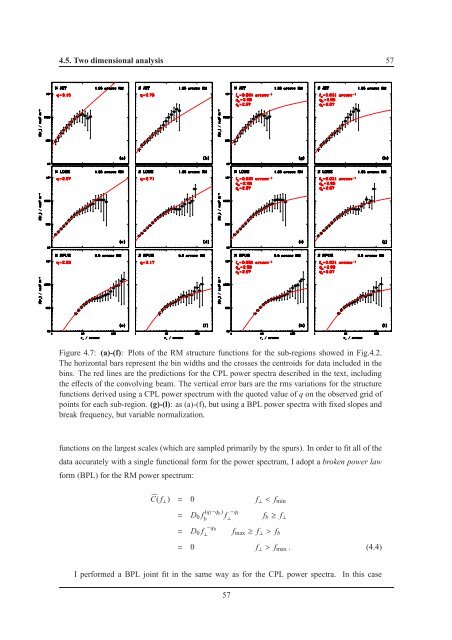
Figure 4.7: (a)-(f): Plots of the RM structure functions for the sub-regions showed in Fig.4.2.<br />
The horizontal bars represent the bin widths and the crosses the centroids for data included in the<br />
bins. The red lines are the pre<strong>di</strong>ctions for the CPL power spectra described in the text, inclu<strong>di</strong>ng<br />
the effects of the convolving beam. The vertical error bars are the rms variations for the structure<br />
functions derived using a CPL power spectrum with the quoted value of q on the observed grid of<br />
points for each sub-region. (g)-(l): as (a)-(f), but using a BPL power spectra with fixed slopes and<br />
break frequency, but variable normalization.<br />
functions on the largest scales (which are sampled primarily by the spurs). In order to fit all of the<br />
data accurately with a single functional form for the power spectrum, I adopt a broken power law<br />
form (BPL) for the RM power spectrum:<br />
Ĉ( f ⊥ ) = 0 f ⊥ < f min<br />
= D 0 f (q l−q h )<br />
b<br />
f −q l<br />
⊥<br />
= D 0 f −q h<br />
⊥<br />
f b ≥ f ⊥<br />
f max ≥ f ⊥ > f b<br />
= 0 f ⊥ > f max . (4.4)<br />
I performed a BPL joint fit in the same way as for the CPL power spectra.<br />
In this case<br />
57


