

Alma Mater Studiorum Universit`a degli Studi di Bologna ... - Inaf
Alma Mater Studiorum Universit`a degli Studi di Bologna ... - Inaf
Alma Mater Studiorum Universit`a degli Studi di Bologna ... - Inaf

You also want an ePaper? Increase the reach of your titles
YUMPU automatically turns print PDFs into web optimized ePapers that Google loves.
52 4. The magneto-ionic me<strong>di</strong>um around 3C 449<br />
IMAGE: K;BURN_4P_2000.FITS<br />
IMAGE: K;BURN_5.5.FITS<br />
;400 ;200 0 200 400 600<br />
;400 ;200 0 200 400 600 800 1000<br />
39 24 00<br />
39 27 00<br />
39 23 00<br />
39 24 00<br />
DECLINATION (J2000)<br />
39 22 00<br />
39 21 00<br />
DECLINATION (J2000)<br />
39 21 00<br />
(c)<br />
39 20 00<br />
39 18 00<br />
39 19 00<br />
(a)<br />
22 31 24 22 31 21 22 31 18<br />
RIGHT ASCENSION (J2000)<br />
(b)<br />
22 31 30 22 31 24 22 31 18 22 31 12<br />
RIGHT ASCENSION (J2000)<br />
(d)<br />
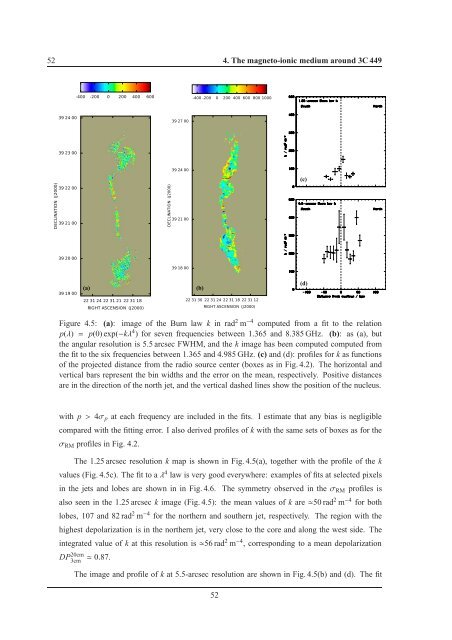
Figure 4.5: (a): image of the Burn law k in rad 2 m −4 computed from a fit to the relation<br />
p(λ) = p(0) exp(−kλ 4 ) for seven frequencies between 1.365 and 8.385 GHz. (b): as (a), but<br />
the angular resolution is 5.5 arcsec FWHM, and the k image has been computed computed from<br />
the fit to the six frequencies between 1.365 and 4.985 GHz. (c) and (d): profiles for k as functions<br />
of the projected <strong>di</strong>stance from the ra<strong>di</strong>o source center (boxes as in Fig. 4.2). The horizontal and<br />
vertical bars represent the bin widths and the error on the mean, respectively. Positive <strong>di</strong>stances<br />
are in the <strong>di</strong>rection of the north jet, and the vertical dashed lines show the position of the nucleus.<br />
with p>4σ p at each frequency are included in the fits. I estimate that any bias is negligible<br />
compared with the fitting error. I also derived profiles of k with the same sets of boxes as for the<br />
σ RM profiles in Fig. 4.2.<br />
The 1.25 arcsec resolution k map is shown in Fig. 4.5(a), together with the profile of the k<br />
values (Fig. 4.5c). The fit to aλ 4 law is very good everywhere: examples of fits at selected pixels<br />
in the jets and lobes are shown in in Fig. 4.6. The symmetry observed in theσ RM profiles is<br />
also seen in the 1.25 arcsec k image (Fig. 4.5): the mean values of k are≃50 rad 2 m −4 for both<br />
lobes, 107 and 82 rad 2 m −4 for the northern and southern jet, respectively. The region with the<br />
highest depolarization is in the northern jet, very close to the core and along the west side. The<br />
integrated value of k at this resolution is≃56 rad 2 m −4 , correspon<strong>di</strong>ng to a mean depolarization<br />
DP 20cm<br />
3cm ≃ 0.87.<br />
The image and profile of k at 5.5-arcsec resolution are shown in Fig. 4.5(b) and (d). The fit<br />
52


