

Alma Mater Studiorum Universit`a degli Studi di Bologna ... - Inaf
Alma Mater Studiorum Universit`a degli Studi di Bologna ... - Inaf
Alma Mater Studiorum Universit`a degli Studi di Bologna ... - Inaf

Create successful ePaper yourself
Turn your PDF publications into a flip-book with our unique Google optimized e-Paper software.
120 6. Faraday rotation in two extreme environments<br />
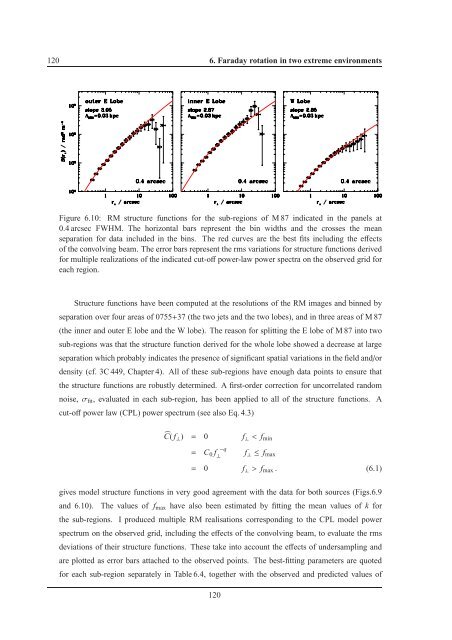
Figure 6.10: RM structure functions for the sub-regions of M 87 in<strong>di</strong>cated in the panels at<br />
0.4 arcsec FWHM. The horizontal bars represent the bin widths and the crosses the mean<br />
separation for data included in the bins. The red curves are the best fits inclu<strong>di</strong>ng the effects<br />
of the convolving beam. The error bars represent the rms variations for structure functions derived<br />
for multiple realizations of the in<strong>di</strong>cated cut-off power-law power spectra on the observed grid for<br />
each region.<br />
Structure functions have been computed at the resolutions of the RM images and binned by<br />
separation over four areas of 0755+37 (the two jets and the two lobes), and in three areas of M 87<br />
(the inner and outer E lobe and the W lobe). The reason for splitting the E lobe of M 87 into two<br />
sub-regions was that the structure function derived for the whole lobe showed a decrease at large<br />
separation which probably in<strong>di</strong>cates the presence of significant spatial variations in the field and/or<br />
density (cf. 3C 449, Chapter 4). All of these sub-regions have enough data points to ensure that<br />
the structure functions are robustly determined. A first-order correction for uncorrelated random<br />
noise,σ fit , evaluated in each sub-region, has been applied to all of the structure functions. A<br />
cut-off power law (CPL) power spectrum (see also Eq. 4.3)<br />
Ĉ( f ⊥ ) = 0 f ⊥ < f min<br />
= C 0 f −q<br />
⊥<br />
f ⊥ ≤ f max<br />
= 0 f ⊥ > f max . (6.1)<br />
gives model structure functions in very good agreement with the data for both sources (Figs.6.9<br />
and 6.10). The values of f max have also been estimated by fitting the mean values of k for<br />
the sub-regions. I produced multiple RM realisations correspon<strong>di</strong>ng to the CPL model power<br />
spectrum on the observed grid, inclu<strong>di</strong>ng the effects of the convolving beam, to evaluate the rms<br />
deviations of their structure functions. These take into account the effects of undersampling and<br />
are plotted as error bars attached to the observed points. The best-fitting parameters are quoted<br />
for each sub-region separately in Table 6.4, together with the observed and pre<strong>di</strong>cted values of<br />
120


