

Alma Mater Studiorum Universit`a degli Studi di Bologna ... - Inaf
Alma Mater Studiorum Universit`a degli Studi di Bologna ... - Inaf
Alma Mater Studiorum Universit`a degli Studi di Bologna ... - Inaf

You also want an ePaper? Increase the reach of your titles
YUMPU automatically turns print PDFs into web optimized ePapers that Google loves.
58 4. The magneto-ionic me<strong>di</strong>um around 3C 449<br />
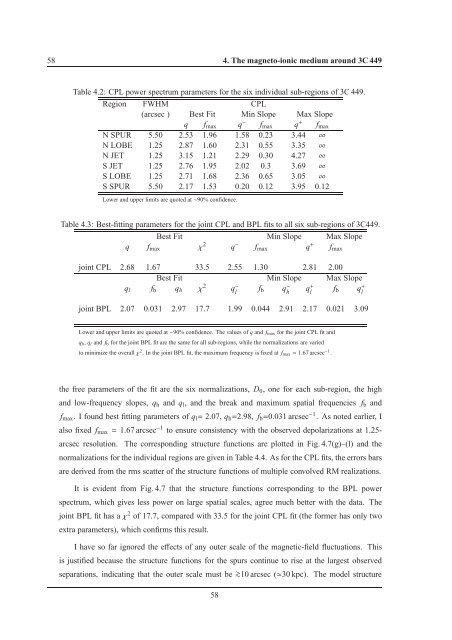
Table 4.2: CPL power spectrum parameters for the six in<strong>di</strong>vidual sub-regions of 3C 449.<br />
Region FWHM CPL<br />
(arcsec ) Best Fit Min Slope Max Slope<br />
q f max q − f max q + f max<br />
N SPUR 5.50 2.53 1.96 1.58 0.23 3.44 ∞<br />
N LOBE 1.25 2.87 1.60 2.31 0.55 3.35 ∞<br />
N JET 1.25 3.15 1.21 2.29 0.30 4.27 ∞<br />
S JET 1.25 2.76 1.95 2.02 0.3 3.69 ∞<br />
S LOBE 1.25 2.71 1.68 2.36 0.65 3.05 ∞<br />
S SPUR 5.50 2.17 1.53 0.20 0.12 3.95 0.12<br />
Lower and upper limits are quoted at∼90% confidence.<br />
Table 4.3: Best-fitting parameters for the joint CPL and BPL fits to all six sub-regions of 3C449.<br />
Best Fit Min Slope Max Slope<br />
q f max χ 2 q − f max q + f max<br />
joint CPL 2.68 1.67 33.5 2.55 1.30 2.81 2.00<br />
Best Fit Min Slope Max Slope<br />
q l f b q h χ 2 q − l<br />
f b q − h<br />
q + l<br />
f b q + l<br />
joint BPL 2.07 0.031 2.97 17.7 1.99 0.044 2.91 2.17 0.021 3.09<br />
Lower and upper limits are quoted at∼90% confidence. The values of q and f max for the joint CPL fit and<br />
q h , q l and f b for the joint BPL fit are the same for all sub-regions, while the normalizations are varied<br />
to minimize the overallχ 2 . In the joint BPL fit, the maximum frequency is fixed at f max = 1.67 arcsec −1 .<br />
the free parameters of the fit are the six normalizations, D 0 , one for each sub-region, the high<br />
and low-frequency slopes, q h and q l , and the break and maximum spatial frequencies f b and<br />
f max . I found best fitting parameters of q l = 2.07, q h =2.98, f b =0.031 arcsec −1 . As noted earlier, I<br />
also fixed f max = 1.67 arcsec −1 to ensure consistency with the observed depolarizations at 1.25-<br />
arcsec resolution. The correspon<strong>di</strong>ng structure functions are plotted in Fig. 4.7(g)–(l) and the<br />
normalizations for the in<strong>di</strong>vidual regions are given in Table 4.4. As for the CPL fits, the errors bars<br />
are derived from the rms scatter of the structure functions of multiple convolved RM realizations.<br />
It is evident from Fig. 4.7 that the structure functions correspon<strong>di</strong>ng to the BPL power<br />
spectrum, which gives less power on large spatial scales, agree much better with the data. The<br />
joint BPL fit has aχ 2 of 17.7, compared with 33.5 for the joint CPL fit (the former has only two<br />
extra parameters), which confirms this result.<br />
I have so far ignored the effects of any outer scale of the magnetic-field fluctuations. This<br />
is justified because the structure functions for the spurs continue to rise at the largest observed<br />
separations, in<strong>di</strong>cating that the outer scale must be> ∼ 10 arcsec (≃30 kpc). The model structure<br />
58


