

Alma Mater Studiorum Universit`a degli Studi di Bologna ... - Inaf
Alma Mater Studiorum Universit`a degli Studi di Bologna ... - Inaf
Alma Mater Studiorum Universit`a degli Studi di Bologna ... - Inaf

Create successful ePaper yourself
Turn your PDF publications into a flip-book with our unique Google optimized e-Paper software.
60 4. The magneto-ionic me<strong>di</strong>um around 3C 449<br />
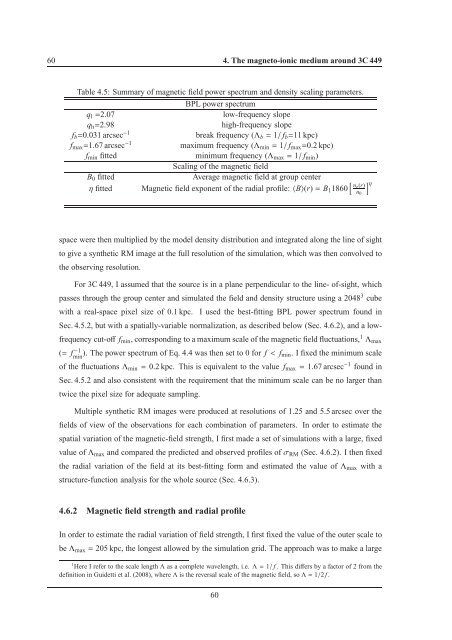
Table 4.5: Summary of magnetic field power spectrum and density scaling parameters.<br />
BPL power spectrum<br />
q l =2.07<br />
low-frequency slope<br />
q h =2.98<br />
high-frequency slope<br />
f b =0.031 arcsec −1<br />
break frequency (Λ b = 1/ f b =11 kpc)<br />
f max =1.67 arcsec −1<br />
maximum frequency (Λ min = 1/ f max =0.2 kpc)<br />
f min fitted minimum frequency (Λ max = 1/ f min )<br />
Scaling of the magnetic field<br />
B 0 fitted<br />
Average magnetic field at group center<br />
η fitted Magnetic field exponent of the ra<strong>di</strong>al profile:〈B〉(r)= B 1 1860 [ n e (r)<br />
n 0<br />
] η<br />
space were then multiplied by the model density <strong>di</strong>stribution and integrated along the line of sight<br />
to give a synthetic RM image at the full resolution of the simulation, which was then convolved to<br />
the observing resolution.<br />
For 3C 449, I assumed that the source is in a plane perpen<strong>di</strong>cular to the line- of-sight, which<br />
passes through the group center and simulated the field and density structure using a 2048 3 cube<br />
with a real-space pixel size of 0.1 kpc.<br />
I used the best-fitting BPL power spectrum found in<br />
Sec. 4.5.2, but with a spatially-variable normalization, as described below (Sec. 4.6.2), and a lowfrequency<br />
cut-off f min , correspon<strong>di</strong>ng to a maximum scale of the magnetic field fluctuations, 1 Λ max<br />
(= f −1<br />
min ). The power spectrum of Eq. 4.4 was then set to 0 for f


