

Alma Mater Studiorum Universit`a degli Studi di Bologna ... - Inaf
Alma Mater Studiorum Universit`a degli Studi di Bologna ... - Inaf
Alma Mater Studiorum Universit`a degli Studi di Bologna ... - Inaf

Create successful ePaper yourself
Turn your PDF publications into a flip-book with our unique Google optimized e-Paper software.
4.6. Three-<strong>di</strong>mensional analysis 65<br />
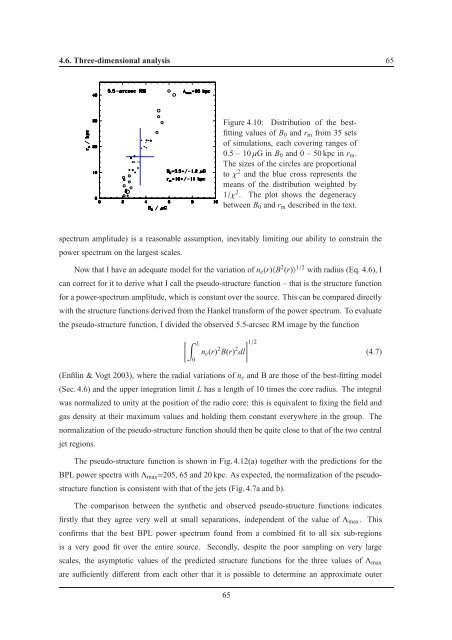
Figure 4.10: Distribution of the bestfitting<br />
values of B 0 and r m from 35 sets<br />
of simulations, each covering ranges of<br />
0.5 – 10µG in B 0 and 0 – 50 kpc in r m .<br />
The sizes of the circles are proportional<br />
toχ 2 and the blue cross represents the<br />
means of the <strong>di</strong>stribution weighted by<br />
1/χ 2 . The plot shows the degeneracy<br />
between B 0 and r m described in the text.<br />
spectrum amplitude) is a reasonable assumption, inevitably limiting our ability to constrain the<br />
power spectrum on the largest scales.<br />
Now that I have an adequate model for the variation of n e (r)〈B 2 (r)〉 1/2 with ra<strong>di</strong>us (Eq. 4.6), I<br />
can correct for it to derive what I call the pseudo-structure function – that is the structure function<br />
for a power-spectrum amplitude, which is constant over the source. This can be compared <strong>di</strong>rectly<br />
with the structure functions derived from the Hankel transform of the power spectrum. To evaluate<br />
the pseudo-structure function, I <strong>di</strong>vided the observed 5.5-arcsec RM image by the function<br />
[∫ L<br />
1/2<br />
n e (r) 2 B(r) dl] 2 (4.7)<br />
0<br />
(Enßlin & Vogt 2003), where the ra<strong>di</strong>al variations of n e and B are those of the best-fitting model<br />
(Sec. 4.6) and the upper integration limit L has a length of 10 times the core ra<strong>di</strong>us. The integral<br />
was normalized to unity at the position of the ra<strong>di</strong>o core: this is equivalent to fixing the field and<br />
gas density at their maximum values and hol<strong>di</strong>ng them constant everywhere in the group. The<br />
normalization of the pseudo-structure function should then be quite close to that of the two central<br />
jet regions.<br />
The pseudo-structure function is shown in Fig. 4.12(a) together with the pre<strong>di</strong>ctions for the<br />
BPL power spectra withΛ max =205, 65 and 20 kpc. As expected, the normalization of the pseudostructure<br />
function is consistent with that of the jets (Fig. 4.7a and b).<br />
The comparison between the synthetic and observed pseudo-structure functions in<strong>di</strong>cates<br />
firstly that they agree very well at small separations, independent of the value ofΛ max . This<br />
confirms that the best BPL power spectrum found from a combined fit to all six sub-regions<br />
is a very good fit over the entire source. Secondly, despite the poor sampling on very large<br />
scales, the asymptotic values of the pre<strong>di</strong>cted structure functions for the three values ofΛ max<br />
are sufficiently <strong>di</strong>fferent from each other that it is possible to determine an approximate outer<br />
65


