

Alma Mater Studiorum Universit`a degli Studi di Bologna ... - Inaf
Alma Mater Studiorum Universit`a degli Studi di Bologna ... - Inaf
Alma Mater Studiorum Universit`a degli Studi di Bologna ... - Inaf

You also want an ePaper? Increase the reach of your titles
YUMPU automatically turns print PDFs into web optimized ePapers that Google loves.
5.8. Discussion 101<br />
line−of−sight<br />
><br />
><br />
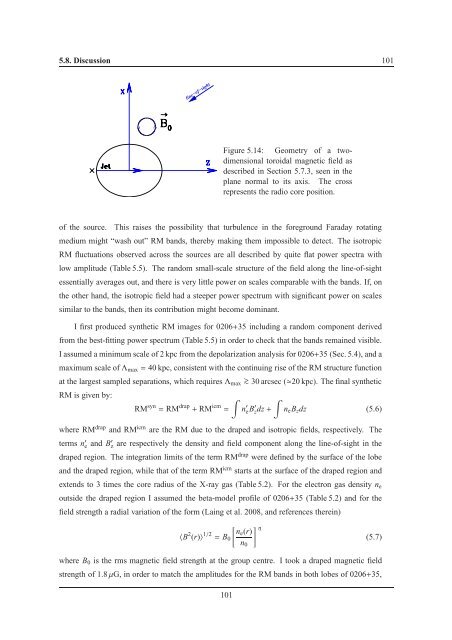
Figure 5.14: Geometry of a two<strong>di</strong>mensional<br />
toroidal magnetic field as<br />
described in Section 5.7.3, seen in the<br />
plane normal to its axis. The cross<br />
represents the ra<strong>di</strong>o core position.<br />
of the source.<br />
This raises the possibility that turbulence in the foreground Faraday rotating<br />
me<strong>di</strong>um might “wash out” RM bands, thereby making them impossible to detect. The isotropic<br />
RM fluctuations observed across the sources are all described by quite flat power spectra with<br />
low amplitude (Table 5.5). The random small-scale structure of the field along the line-of-sight<br />
essentially averages out, and there is very little power on scales comparable with the bands. If, on<br />
the other hand, the isotropic field had a steeper power spectrum with significant power on scales<br />
similar to the bands, then its contribution might become dominant.<br />
I first produced synthetic RM images for 0206+35 inclu<strong>di</strong>ng a random component derived<br />
from the best-fitting power spectrum (Table 5.5) in order to check that the bands remained visible.<br />
I assumed a minimum scale of 2 kpc from the depolarization analysis for 0206+35 (Sec. 5.4), and a<br />
maximum scale ofΛ max = 40 kpc, consistent with the continuing rise of the RM structure function<br />
at the largest sampled separations, which requiresΛ max<br />
> ∼ 30 arcsec (≃20 kpc). The final synthetic<br />
RM is given by:<br />
∫<br />
RM syn = RM drap + RM icm =<br />
n ′ e B′ z dz+ ∫<br />
n e B z dz (5.6)<br />
where RM drap and RM icm are the RM due to the draped and isotropic fields, respectively. The<br />
terms n ′ e and B ′ z are respectively the density and field component along the line-of-sight in the<br />
draped region. The integration limits of the term RM drap were defined by the surface of the lobe<br />
and the draped region, while that of the term RM icm starts at the surface of the draped region and<br />
extends to 3 times the core ra<strong>di</strong>us of the X-ray gas (Table 5.2). For the electron gas density n e<br />
outside the draped region I assumed the beta-model profile of 0206+35 (Table 5.2) and for the<br />
field strength a ra<strong>di</strong>al variation of the form (Laing et al. 2008, and references therein)<br />
〈B 2 (r)〉 1/2 = B 0<br />
[<br />
ne (r)<br />
n 0<br />
] η<br />
(5.7)<br />
where B 0 is the rms magnetic field strength at the group centre. I took a draped magnetic field<br />
strength of 1.8µG, in order to match the amplitudes for the RM bands in both lobes of 0206+35,<br />
101


