

Alma Mater Studiorum Universit`a degli Studi di Bologna ... - Inaf
Alma Mater Studiorum Universit`a degli Studi di Bologna ... - Inaf
Alma Mater Studiorum Universit`a degli Studi di Bologna ... - Inaf

Create successful ePaper yourself
Turn your PDF publications into a flip-book with our unique Google optimized e-Paper software.
76 5. Ordered magnetic fields around ra<strong>di</strong>o galaxies<br />
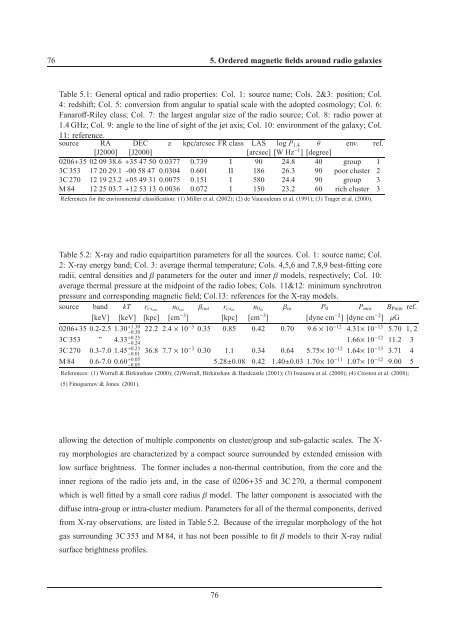
Table 5.1: General optical and ra<strong>di</strong>o properties: Col. 1: source name; Cols. 2&3: position; Col.<br />
4: redshift; Col. 5: conversion from angular to spatial scale with the adopted cosmology; Col. 6:<br />
Fanaroff-Riley class; Col. 7: the largest angular size of the ra<strong>di</strong>o source; Col. 8: ra<strong>di</strong>o power at<br />
1.4 GHz; Col. 9: angle to the line of sight of the jet axis; Col. 10: environment of the galaxy; Col.<br />
11: reference.<br />
source RA DEC z kpc/arcsec FR class LAS log P 1.4 θ env. ref.<br />
[J2000] [J2000] [arcsec] [W Hz −1 ] [degree]<br />
0206+35 02 09 38.6+35 47 50 0.0377 0.739 I 90 24.8 40 group 1<br />
3C 353 17 20 29.1 -00 58 47 0.0304 0.601 II 186 26.3 90 poor cluster 2<br />
3C 270 12 19 23.2+05 49 31 0.0075 0.151 I 580 24.4 90 group 3<br />
M 84 12 25 03.7+12 53 13 0.0036 0.072 I 150 23.2 60 rich cluster 3<br />
References for the environmental classification: (1) Miller et al. (2002); (2) de Vaucouleurs et al. (1991); (3) Trager et al. (2000).<br />
Table 5.2: X-ray and ra<strong>di</strong>o equipartition parameters for all the sources. Col. 1: source name; Col.<br />
2: X-ray energy band; Col. 3: average thermal temperature; Cols. 4,5,6 and 7,8,9 best-fitting core<br />
ra<strong>di</strong>i, central densities andβparameters for the outer and innerβmodels, respectively; Col. 10:<br />
average thermal pressure at the midpoint of the ra<strong>di</strong>o lobes; Cols. 11&12: minimum synchrotron<br />
pressure and correspon<strong>di</strong>ng magnetic field; Col.13: references for the X-ray models.<br />
source band kT r cxout n 0out β out r cxin n 0in β in P 0 P min B Pmin ref.<br />
[keV] [keV] [kpc] [cm −3 ] [kpc] [cm −3 ] [dyne cm −2 ] [dyne cm −2 ] µG<br />
0206+35 0.2-2.5 1.30 +1.30<br />
−0.30 22.2 2.4×10⁻³ 0.35 0.85 0.42 0.70 9.6×10 −12 4.31× 10 −13 5.70 1, 2<br />
3C 353 ” 4.33 +0.25<br />
−0.24<br />
1.66× 10 −12 11.2 3<br />
3C 270 0.3-7.0 1.45 +0.23<br />
−0.01 36.8 7.7×10⁻³ 0.30 1.1 0.34 0.64 5.75× 10 −12 1.64× 10 −13 3.71 4<br />
M 84 0.6-7.0 0.60 +0.05<br />
−0.05<br />
5.28±0.08 0.42 1.40±0.03 1.70× 10 −11 1.07× 10 −12 9.00 5<br />
References: (1) Worrall & Birkinshaw (2000); (2)Worrall, Birkinshaw & Hardcastle (2001); (3) Iwasawa et al. (2000); (4) Croston et al. (2008);<br />
(5) Finoguenov & Jones (2001).<br />
allowing the detection of multiple components on cluster/group and sub-galactic scales. The X-<br />
ray morphologies are characterized by a compact source surrounded by extended emission with<br />
low surface brightness. The former includes a non-thermal contribution, from the core and the<br />
inner regions of the ra<strong>di</strong>o jets and, in the case of 0206+35 and 3C 270, a thermal component<br />
which is well fitted by a small core ra<strong>di</strong>usβmodel. The latter component is associated with the<br />
<strong>di</strong>ffuse intra-group or intra-cluster me<strong>di</strong>um. Parameters for all of the thermal components, derived<br />
from X-ray observations, are listed in Table 5.2. Because of the irregular morphology of the hot<br />
gas surroun<strong>di</strong>ng 3C 353 and M 84, it has not been possible to fitβmodels to their X-ray ra<strong>di</strong>al<br />
surface brightness profiles.<br />
76


