

Alma Mater Studiorum Universit`a degli Studi di Bologna ... - Inaf
Alma Mater Studiorum Universit`a degli Studi di Bologna ... - Inaf
Alma Mater Studiorum Universit`a degli Studi di Bologna ... - Inaf

Create successful ePaper yourself
Turn your PDF publications into a flip-book with our unique Google optimized e-Paper software.
84 5. Ordered magnetic fields around ra<strong>di</strong>o galaxies<br />
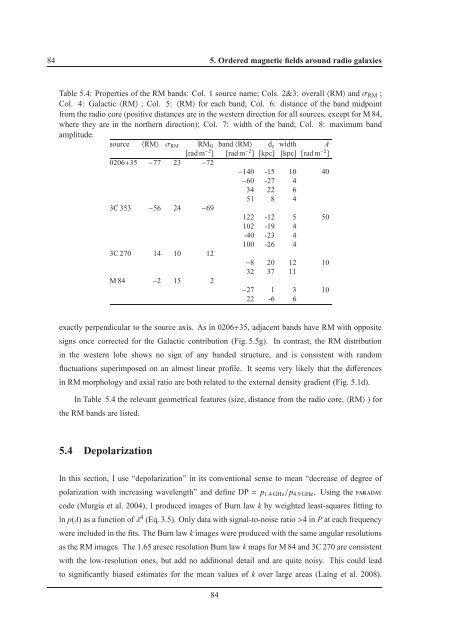
Table 5.4: Properties of the RM bands: Col. 1 source name; Cols. 2&3: overall〈RM〉 andσ RM ;<br />
Col. 4: Galactic〈RM〉 ; Col. 5: 〈RM〉 for each band; Col. 6: <strong>di</strong>stance of the band midpoint<br />
from the ra<strong>di</strong>o core (positive <strong>di</strong>stances are in the western <strong>di</strong>rection for all sources, except for M 84,<br />
where they are in the northern <strong>di</strong>rection); Col. 7: width of the band; Col. 8: maximum band<br />
amplitude.<br />
source 〈RM〉 σ RM RM G band〈RM〉 d c width A<br />
[rad m −2 ] [rad m −2 ] [kpc] [kpc] [rad m −2 ]<br />
0206+35 −77 23 −72<br />
−140 -15 10 40<br />
−60 -27 4<br />
34 22 6<br />
51 8 4<br />
3C 353 −56 24 −69<br />
122 -12 5 50<br />
102 -19 4<br />
-40 -23 4<br />
100 -26 4<br />
3C 270 14 10 12<br />
−8 20 12 10<br />
32 37 11<br />
M 84 −2 15 2<br />
−27 1 3 10<br />
22 -6 6<br />
exactly perpen<strong>di</strong>cular to the source axis. As in 0206+35, adjacent bands have RM with opposite<br />
signs once corrected for the Galactic contribution (Fig. 5.5g). In contrast, the RM <strong>di</strong>stribution<br />
in the western lobe shows no sign of any banded structure, and is consistent with random<br />
fluctuations superimposed on an almost linear profile. It seems very likely that the <strong>di</strong>fferences<br />
in RM morphology and axial ratio are both related to the external density gra<strong>di</strong>ent (Fig. 5.1d).<br />
In Table 5.4 the relevant geometrical features (size, <strong>di</strong>stance from the ra<strong>di</strong>o core,〈RM〉 ) for<br />
the RM bands are listed.<br />
5.4 Depolarization<br />
In this section, I use “depolarization” in its conventional sense to mean “decrease of degree of<br />
polarization with increasing wavelength” and define DP= p 1.4 GHz /p 4.9 GHz . Using theFARADAY<br />
code (Murgia et al. 2004), I produced images of Burn law k by weighted least-squares fitting to<br />
ln p(λ) as a function ofλ 4 (Eq. 3.5). Only data with signal-to-noise ratio>4 in P at each frequency<br />
were included in the fits. The Burn law k images were produced with the same angular resolutions<br />
as the RM images. The 1.65 arcsec resolution Burn law k maps for M 84 and 3C 270 are consistent<br />
with the low-resolution ones, but add no ad<strong>di</strong>tional detail and are quite noisy. This could lead<br />
to significantly biased estimates for the mean values of k over large areas (Laing et al. 2008).<br />
84


