

Alma Mater Studiorum Universit`a degli Studi di Bologna ... - Inaf
Alma Mater Studiorum Universit`a degli Studi di Bologna ... - Inaf
Alma Mater Studiorum Universit`a degli Studi di Bologna ... - Inaf

Create successful ePaper yourself
Turn your PDF publications into a flip-book with our unique Google optimized e-Paper software.
4.4. Depolarization 51<br />
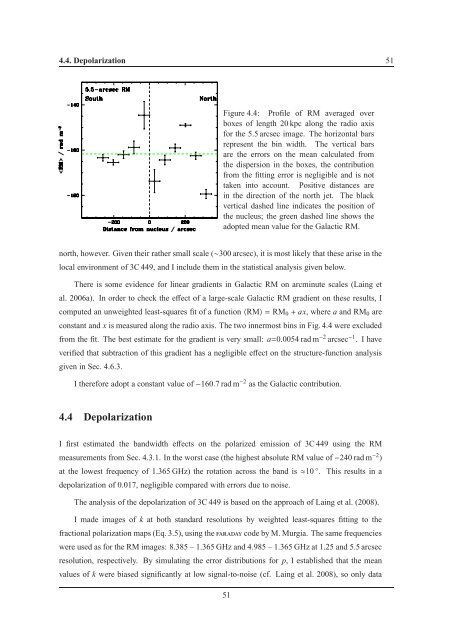
Figure 4.4: Profile of RM averaged over<br />
boxes of length 20 kpc along the ra<strong>di</strong>o axis<br />
for the 5.5 arcsec image. The horizontal bars<br />
represent the bin width. The vertical bars<br />
are the errors on the mean calculated from<br />
the <strong>di</strong>spersion in the boxes, the contribution<br />
from the fitting error is negligible and is not<br />
taken into account. Positive <strong>di</strong>stances are<br />
in the <strong>di</strong>rection of the north jet. The black<br />
vertical dashed line in<strong>di</strong>cates the position of<br />
the nucleus; the green dashed line shows the<br />
adopted mean value for the Galactic RM.<br />
north, however. Given their rather small scale (∼300 arcsec), it is most likely that these arise in the<br />
local environment of 3C 449, and I include them in the statistical analysis given below.<br />
There is some evidence for linear gra<strong>di</strong>ents in Galactic RM on arcminute scales (Laing et<br />
al. 2006a). In order to check the effect of a large-scale Galactic RM gra<strong>di</strong>ent on these results, I<br />
computed an unweighted least-squares fit of a function〈RM〉= RM 0 + ax, where a and RM 0 are<br />
constant and x is measured along the ra<strong>di</strong>o axis. The two innermost bins in Fig. 4.4 were excluded<br />
from the fit. The best estimate for the gra<strong>di</strong>ent is very small: a=0.0054 rad m −2 arcsec −1 . I have<br />
verified that subtraction of this gra<strong>di</strong>ent has a negligible effect on the structure-function analysis<br />
given in Sec. 4.6.3.<br />
I therefore adopt a constant value of−160.7 rad m −2 as the Galactic contribution.<br />
4.4 Depolarization<br />
I first estimated the bandwidth effects on the polarized emission of 3C 449 using the RM<br />
measurements from Sec. 4.3.1. In the worst case (the highest absolute RM value of−240 rad m −2 )<br />
at the lowest frequency of 1.365 GHz) the rotation across the band is≈10 ◦ . This results in a<br />
depolarization of 0.017, negligible compared with errors due to noise.<br />
The analysis of the depolarization of 3C 449 is based on the approach of Laing et al. (2008).<br />
I made images of k at both standard resolutions by weighted least-squares fitting to the<br />
fractional polarization maps (Eq. 3.5), using theFARADAY code by M. Murgia. The same frequencies<br />
were used as for the RM images: 8.385 – 1.365 GHz and 4.985 – 1.365 GHz at 1.25 and 5.5 arcsec<br />
resolution, respectively. By simulating the error <strong>di</strong>stributions for p, I established that the mean<br />
values of k were biased significantly at low signal-to-noise (cf. Laing et al. 2008), so only data<br />
51


