PMRY - Institute for Social and Economic Change
PMRY - Institute for Social and Economic Change
PMRY - Institute for Social and Economic Change

You also want an ePaper? Increase the reach of your titles
YUMPU automatically turns print PDFs into web optimized ePapers that Google loves.
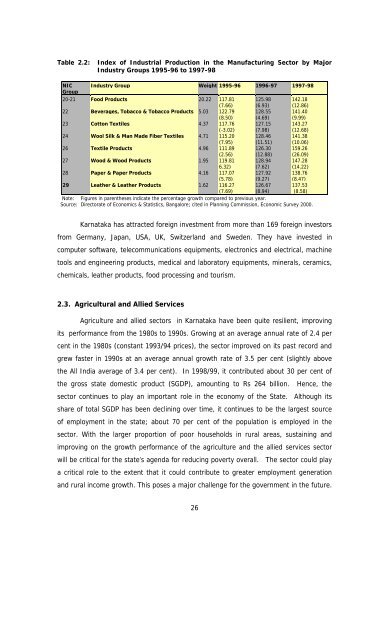
Table 2.2: Index of Industrial Production in the Manufacturing Sector by Major<br />
Industry Groups 1995-96 to 1997-98<br />
NIC Industry Group Weight 1995-96 1996-97 1997-98<br />
Group<br />
20-21 Food Products 20.22 117.81<br />
(7.66)<br />
125.98<br />
(6.93)<br />
142.18<br />
(12.86)<br />
22 Beverages, Tobacco & Tobacco Products 5.03 122.79<br />
(8.50)<br />
128.55<br />
(4.69)<br />
141.40<br />
(9.99)<br />
23 Cotton Textiles 4.37 117.76<br />
(-3.02)<br />
127.15<br />
(7.98)<br />
143.27<br />
(12.68)<br />
24 Wool Silk & Man Made Fiber Textiles 4.71 115.20<br />
(7.95)<br />
128.46<br />
(11.51)<br />
141.38<br />
(10.06)<br />
26 Textile Products 4.96 111.89<br />
(2.56)<br />
126.30<br />
(12.88)<br />
159.26<br />
(26.09)<br />
27 Wood & Wood Products 1.95 119.81<br />
6.32)<br />
128.94<br />
(7.62)<br />
147.28<br />
(14.22)<br />
28 Paper & Paper Products 4.16 117.07<br />
(5.78)<br />
127.92<br />
(9.27)<br />
138.76<br />
(8.47)<br />
29 Leather & Leather Products 1.62 116.27<br />
(7.69)<br />
126.67<br />
(8.94)<br />
137.53<br />
(8.58)<br />
Note: Figures in parentheses indicate the percentage growth compared to previous year.<br />
Source: Directorate of <strong>Economic</strong>s & Statistics, Bangalore; cited in Planning Commission, <strong>Economic</strong> Survey 2000.<br />
Karnataka has attracted <strong>for</strong>eign investment from more than 169 <strong>for</strong>eign investors<br />
from Germany, Japan, USA, UK, Switzerl<strong>and</strong> <strong>and</strong> Sweden. They have invested in<br />
computer software, telecommunications equipments, electronics <strong>and</strong> electrical, machine<br />
tools <strong>and</strong> engineering products, medical <strong>and</strong> laboratory equipments, minerals, ceramics,<br />
chemicals, leather products, food processing <strong>and</strong> tourism.<br />
2.3. Agricultural <strong>and</strong> Allied Services<br />
Agriculture <strong>and</strong> allied sectors in Karnataka have been quite resilient, improving<br />
its per<strong>for</strong>mance from the 1980s to 1990s. Growing at an average annual rate of 2.4 per<br />
cent in the 1980s (constant 1993/94 prices), the sector improved on its past record <strong>and</strong><br />
grew faster in 1990s at an average annual growth rate of 3.5 per cent (slightly above<br />
the All India average of 3.4 per cent). In 1998/99, it contributed about 30 per cent of<br />
the gross state domestic product (SGDP), amounting to Rs 264 billion. Hence, the<br />
sector continues to play an important role in the economy of the State. Although its<br />
share of total SGDP has been declining over time, it continues to be the largest source<br />
of employment in the state; about 70 per cent of the population is employed in the<br />
sector. With the larger proportion of poor households in rural areas, sustaining <strong>and</strong><br />
improving on the growth per<strong>for</strong>mance of the agriculture <strong>and</strong> the allied services sector<br />
will be critical <strong>for</strong> the state’s agenda <strong>for</strong> reducing poverty overall. The sector could play<br />
a critical role to the extent that it could contribute to greater employment generation<br />
<strong>and</strong> rural income growth. This poses a major challenge <strong>for</strong> the government in the future.<br />
26