CIE paper using ASME template - Institute for Systems Research ...
CIE paper using ASME template - Institute for Systems Research ...
CIE paper using ASME template - Institute for Systems Research ...

Create successful ePaper yourself
Turn your PDF publications into a flip-book with our unique Google optimized e-Paper software.
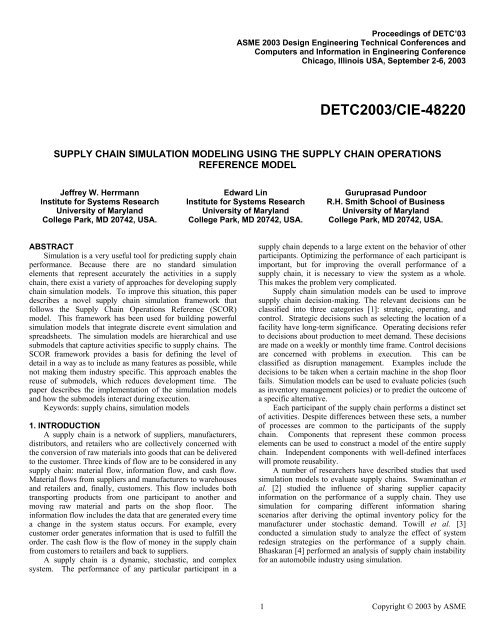
Proceedings of DETC’03<br />
<strong>ASME</strong> 2003 Design Engineering Technical Conferences and<br />
Computers and In<strong>for</strong>mation in Engineering Conference<br />
Chicago, Illinois USA, September 2-6, 2003<br />
DETC2003/<strong>CIE</strong>-48220<br />
SUPPLY CHAIN SIMULATION MODELING USING THE SUPPLY CHAIN OPERATIONS<br />
REFERENCE MODEL<br />
Jeffrey W. Herrmann<br />
<strong>Institute</strong> <strong>for</strong> <strong>Systems</strong> <strong>Research</strong><br />
University of Maryland<br />
College Park, MD 20742, USA.<br />
Edward Lin<br />
<strong>Institute</strong> <strong>for</strong> <strong>Systems</strong> <strong>Research</strong><br />
University of Maryland<br />
College Park, MD 20742, USA.<br />
Guruprasad Pundoor<br />
R.H. Smith School of Business<br />
University of Maryland<br />
College Park, MD 20742, USA.<br />
ABSTRACT<br />
Simulation is a very useful tool <strong>for</strong> predicting supply chain<br />
per<strong>for</strong>mance. Because there are no standard simulation<br />
elements that represent accurately the activities in a supply<br />
chain, there exist a variety of approaches <strong>for</strong> developing supply<br />
chain simulation models. To improve this situation, this <strong>paper</strong><br />
describes a novel supply chain simulation framework that<br />
follows the Supply Chain Operations Reference (SCOR)<br />
model. This framework has been used <strong>for</strong> building powerful<br />
simulation models that integrate discrete event simulation and<br />
spreadsheets. The simulation models are hierarchical and use<br />
submodels that capture activities specific to supply chains. The<br />
SCOR framework provides a basis <strong>for</strong> defining the level of<br />
detail in a way as to include as many features as possible, while<br />
not making them industry specific. This approach enables the<br />
reuse of submodels, which reduces development time. The<br />
<strong>paper</strong> describes the implementation of the simulation models<br />
and how the submodels interact during execution.<br />
Keywords: supply chains, simulation models<br />
1. INTRODUCTION<br />
A supply chain is a network of suppliers, manufacturers,<br />
distributors, and retailers who are collectively concerned with<br />
the conversion of raw materials into goods that can be delivered<br />
to the customer. Three kinds of flow are to be considered in any<br />
supply chain: material flow, in<strong>for</strong>mation flow, and cash flow.<br />
Material flows from suppliers and manufacturers to warehouses<br />
and retailers and, finally, customers. This flow includes both<br />
transporting products from one participant to another and<br />
moving raw material and parts on the shop floor. The<br />
in<strong>for</strong>mation flow includes the data that are generated every time<br />
a change in the system status occurs. For example, every<br />
customer order generates in<strong>for</strong>mation that is used to fulfill the<br />
order. The cash flow is the flow of money in the supply chain<br />
from customers to retailers and back to suppliers.<br />
A supply chain is a dynamic, stochastic, and complex<br />
system. The per<strong>for</strong>mance of any particular participant in a<br />
supply chain depends to a large extent on the behavior of other<br />
participants. Optimizing the per<strong>for</strong>mance of each participant is<br />
important, but <strong>for</strong> improving the overall per<strong>for</strong>mance of a<br />
supply chain, it is necessary to view the system as a whole.<br />
This makes the problem very complicated.<br />
Supply chain simulation models can be used to improve<br />
supply chain decision-making. The relevant decisions can be<br />
classified into three categories [1]: strategic, operating, and<br />
control. Strategic decisions such as selecting the location of a<br />
facility have long-term significance. Operating decisions refer<br />
to decisions about production to meet demand. These decisions<br />
are made on a weekly or monthly time frame. Control decisions<br />
are concerned with problems in execution. This can be<br />
classified as disruption management. Examples include the<br />
decisions to be taken when a certain machine in the shop floor<br />
fails. Simulation models can be used to evaluate policies (such<br />
as inventory management policies) or to predict the outcome of<br />
a specific alternative.<br />
Each participant of the supply chain per<strong>for</strong>ms a distinct set<br />
of activities. Despite differences between these sets, a number<br />
of processes are common to the participants of the supply<br />
chain. Components that represent these common process<br />
elements can be used to construct a model of the entire supply<br />
chain. Independent components with well-defined interfaces<br />
will promote reusability.<br />
A number of researchers have described studies that used<br />
simulation models to evaluate supply chains. Swaminathan et<br />
al. [2] studied the influence of sharing supplier capacity<br />
in<strong>for</strong>mation on the per<strong>for</strong>mance of a supply chain. They use<br />
simulation <strong>for</strong> comparing different in<strong>for</strong>mation sharing<br />
scenarios after deriving the optimal inventory policy <strong>for</strong> the<br />
manufacturer under stochastic demand. Towill et al. [3]<br />
conducted a simulation study to analyze the effect of system<br />
redesign strategies on the per<strong>for</strong>mance of a supply chain.<br />
Bhaskaran [4] per<strong>for</strong>med an analysis of supply chain instability<br />
<strong>for</strong> an automobile industry <strong>using</strong> simulation.<br />
1 Copyright © 2003 by <strong>ASME</strong>
In addition to these reports, a variety of approaches <strong>for</strong><br />
building supply chain simulation models have been described.<br />
Some of these approaches used general-purpose discrete event<br />
simulation, others developed specialized software, and others<br />
used distributed simulation.<br />
Jain et al. [5] observe that the level of detail included in the<br />
development of a simulation model should be appropriate to the<br />
objective of the study. The <strong>paper</strong> describes a high level supply<br />
chain simulation model that includes order fulfillment,<br />
procurement, <strong>for</strong>ecasting, and replenishment. Their approach<br />
uses general-purpose simulation software because it lets the<br />
user select the desired level of abstraction.<br />
Bhaskaran [4] used an automobile supply chain simulation<br />
software originally developed to GM’s specifications.<br />
Chatfield et al. [6] describe an approach that automatically<br />
generates supply chain simulation models. The analyst must<br />
first describe the supply chain structure <strong>using</strong> a special<br />
modeling language. A model generation routine creates a<br />
simulation model <strong>using</strong> a library of Java classes.<br />
Eliter et al. [7] worked on the concept of Agent Programs.<br />
An agent consists of a body of software code that supports a<br />
well-defined application programmer interface and a semantic<br />
wrapper that contains a wealth of in<strong>for</strong>mation. As part of the<br />
work, the team developed agents <strong>for</strong> various functions of<br />
supply chain management systems. A simulation model of a<br />
supply chain application based on agents was built <strong>using</strong><br />
commercial softwares such as Microsoft Access and ESRI’s<br />
MapObject. Swaminathan et al. [8] describe a supply chain<br />
modeling framework through software components <strong>for</strong><br />
representing various types of supply chain agents such as<br />
retailers, manufacturers, and transporters.<br />
Commercial vendors also offer supply chain simulators<br />
such as IBM Supply Chain Simulator [9], Supply Chain<br />
Builder [10], and e-SCOR [11].<br />
Although these supply chain simulation models are<br />
discrete-event simulation models, some supply chain variables<br />
such as inventory levels can be viewed as continuous variables.<br />
See, <strong>for</strong> example, Lee et al. [12]. Our approach includes<br />
planning activities that manage these variables <strong>using</strong> Excel<br />
VBA (see Section 3.1).<br />
The proliferation of supply chain simulation models has<br />
yielded competing approaches. To attack this problem, this<br />
research adopted the Supply Chain Operations Reference<br />
(SCOR) model [13,14], which has been proposed as a standard<br />
<strong>for</strong> describing supply chain management processes, their<br />
relationships, and best practices. Barnett and Miller [15]<br />
describe specialized supply chain simulation software that<br />
implements SCOR. Our goal was to implement supply chain<br />
simulation models <strong>using</strong> the SCOR model with reusable<br />
components from general-purpose discrete-event simulation<br />
software to facilitate model construction. This will enable<br />
firms that are <strong>using</strong> the SCOR model to more easily create<br />
simulation models of their supply chains. We have constructed<br />
a variety of simulation models <strong>using</strong> this framework; these are<br />
described in more detail in Pundoor [16]. In addition, a more<br />
detailed description of the model and links to examples are<br />
available online at the following URL:<br />
http://www.isr.umd.edu/Labs/CIM/SC_Simulation/<br />
The remainder of the <strong>paper</strong> is organized as follows.<br />
Section 2 presents our new framework <strong>for</strong> building supply<br />
chain simulation models. Section 3 describes the<br />
implementation <strong>using</strong> Arena and Microsoft Excel, discusses<br />
how the submodels interact, and describes cash flow and<br />
per<strong>for</strong>mance measures. Section 4 concludes the <strong>paper</strong>.<br />
2. SUPPLY CHAIN SIMULATION FRAMEWORK<br />
The hierarchical simulation modeling approach presented<br />
here is based on the Supply Chain Operations Reference model,<br />
Version 4.0, proposed by the Supply Chain Council [13]. The<br />
SCOR model was developed to describe the business activities<br />
associated with all phases of satisfying a customer’s demand.<br />
SCOR is founded on four distinct supply chain management<br />
processes: Plan, Source, Make, and Deliver. Supply chains can<br />
be described <strong>using</strong> these process building blocks, which are<br />
known as Process Categories. Each of the Process Categories<br />
consists of Process Elements.<br />
SCOR model also distinguishes between Planning,<br />
Execution, and Enable level process categories. Planning<br />
processes balance aggregate demand across a consistent<br />
planning horizon. Planning processes generally occur at regular<br />
intervals. Execution processes are triggered by planned or<br />
actual demand that changes the state of products. These include<br />
scheduling and sequencing, trans<strong>for</strong>ming materials and<br />
services, and moving product. Enable processes prepare,<br />
maintain and manage in<strong>for</strong>mation or relationships upon which<br />
planning and execution processes rely.<br />
For explaining our approach, it is convenient to identify<br />
three kinds of participants: consumers, producers, and traders.<br />
Consumers are those participants who place orders <strong>for</strong> finished<br />
products, but do not supply any products to any other<br />
participants. They are the most downstream participants in the<br />
model of the supply chain. Producers are the most upstream<br />
participants in the model of the supply chain. Producers supply<br />
parts to other participants, but do not receive any. Traders are<br />
the intermediate participants in the supply chain. Traders both<br />
place orders with some participants and deliver orders to other<br />
participants. Traders include manufacturers, warehouses, and<br />
retailers.<br />
In this framework, a simulation model of a supply chain<br />
has three levels. The first level is the simulation model. The<br />
second level has submodels that correspond to the supply chain<br />
participants (consumers, producers, and traders). The third<br />
level has submodels that correspond to the process elements<br />
(across all process categories) that each participant per<strong>for</strong>ms.<br />
Figure 1 displays the corresponding hierarchy of submodels.<br />
Each participant submodel includes a subset of the process<br />
element submodels shown in Fig. 1.<br />
Each process element is implemented as a separate<br />
submodel that represents a specific activity in the supply chain.<br />
Each process element submodel has clearly defined interfaces,<br />
which are used to integrate the submodels. The process<br />
element submodels contain Arena blocks. The participant<br />
submodels contain process element submodels and other<br />
submodels needed to initialize the simulation model.<br />
There are small differences in the submodels <strong>for</strong><br />
consumers, traders, and producers. In the case of the<br />
producers, raw material sourcing is not per<strong>for</strong>med. A fixed<br />
amount of raw materials is assumed to be available all the time.<br />
The consumer acts as a place <strong>for</strong> receiving the products<br />
corresponding to the orders that he places. So the consumer<br />
does not per<strong>for</strong>m production and delivery activities. Because<br />
participants such as distributors or retailers do not have any<br />
2 Copyright © 2003 by <strong>ASME</strong>
manufacturing processes, the corresponding participant<br />
submodels do not have produce and test submodels.<br />
3. IMPLEMENTATION<br />
This section describes the implementation of the<br />
framework <strong>using</strong> Arena and Microsoft Excel, the initialization<br />
of a supply chain simulation model, the interactions of the<br />
process element submodels, and the cash flow and per<strong>for</strong>mance<br />
measures.<br />
3.1 SIMULATION AND SPREADSHEET INTEGRATION<br />
The simulation models were built <strong>using</strong> Arena 4.0 and<br />
Microsoft Excel 2000. The Arena software interacts with<br />
Microsoft Excel <strong>using</strong> Arena VBA (as shown in Fig. 2). Each<br />
participant of the supply chain has an Excel workbook<br />
associated with it. The submodels associated with a participant<br />
include VBA blocks that communicate with tables in the<br />
corresponding Excel workbook (to get or save data) <strong>using</strong><br />
Excel VBA. The Excel VBA routines include functions and<br />
procedures to take care of planning activities such as allocating<br />
raw materials <strong>for</strong> orders.<br />
Planning activities are carried out <strong>using</strong> Excel VBA.<br />
Execution is carried out in Arena. Enable processes are<br />
modeled as input to the simulation either in the <strong>for</strong>m of Excel<br />
data or parameters in the Arena model. Every time a planning<br />
activity is carried out, the system status is checked and actions<br />
are taken depending on the status. The Excel workbooks are<br />
used to record the status of the system and to calculate the<br />
per<strong>for</strong>mance measures. In order to prevent the Excel files from<br />
becoming too large in the course of a simulation run, clean up<br />
actions are triggered at periodic intervals. The customer orders<br />
and purchasing orders that have been fulfilled are archived once<br />
the per<strong>for</strong>mance measures relating to those orders are taken.<br />
The archived customer orders are put in a text file and this can<br />
be viewed at the end of the simulation run if desired.<br />
3.2 MODEL INITIALIZATION<br />
Constructing the supply chain simulation model requires<br />
constructing the Arena submodels and the Excel workbooks <strong>for</strong><br />
each participant, since both the Arena submodels and the Excel<br />
workbooks include data needed to specify the complete model.<br />
The Excel workbooks are also used to process and store<br />
in<strong>for</strong>mation during the execution of the model.<br />
3.3 MODEL EXECUTION<br />
This section describes how the submodels work together to<br />
execute the key activities that occur in supply chain operations:<br />
1. A trader checks the inventory and places orders <strong>for</strong><br />
raw materials with other traders or producers if necessary.<br />
2. A trader or producer checks the existing open orders<br />
<strong>for</strong> production and obtains the production plan based on<br />
material availability.<br />
3. A trader or producer checks the open orders <strong>for</strong><br />
delivery to construct a delivery plan.<br />
Note that orders placed by consumers are a special case of<br />
the first activity listed above.<br />
3.3.1 SOURCING<br />
Traders per<strong>for</strong>m sourcing at periodic intervals. The trader<br />
orders raw materials from his supplier based on an inventory<br />
control policy, which, in the models that we have created, is a<br />
periodic (R, s, S) policy. R is the interval at which inventory is<br />
checked, s is the reorder level, and S is the order up to quantity.<br />
These values are defined <strong>for</strong> each type of product and are<br />
specified in the Inventory Management table in the<br />
corresponding Excel workbook. The net inventory position is<br />
calculated <strong>using</strong> the on-hand inventory, the on-order inventory,<br />
the allocated inventory, and the backorders.<br />
For each trader, the Schedule Product Deliveries submodel<br />
in Arena, which corresponds to module S2.1 in SCOR, triggers<br />
an event periodically that invokes the Excel procedure <strong>for</strong><br />
checking the inventory levels (Fig. 3). The values <strong>for</strong> on hand<br />
inventory, inventory on order, allocated inventory, and<br />
backorders <strong>for</strong> each component can be obtained from the Item<br />
Master table. Excel VBA calculates the sourcing quantity based<br />
on these values. The trader’s (or producer’s) name <strong>for</strong> each<br />
component is obtained from the Item Master table.<br />
Figure 4 shows the process elements and worksheets<br />
involved in the receipt of sourced products. Sourced products<br />
are received in three stages: Receive Product, Verify Product,<br />
and Transfer Product. In the Receive Product stage, the sourced<br />
products seize a resource at the receive module. The processing<br />
time distribution depends upon the product type. After<br />
receiving, the product goes through the Verify Product stage,<br />
which delays the movement of the sourced product. The<br />
Transfer Product stage seizes a resource that moves the verified<br />
products into the raw material inventory. Each of these<br />
processes has an associated cost and this cost is added to the<br />
sourced product depending on the amount of time the product<br />
spends at each resource.<br />
Once the sourced products reach the raw material<br />
inventory (after the Transfer Product stage), the Arena VBA<br />
block calls the Excel VBA procedure <strong>for</strong> updating the inventory<br />
status in the Item Master table. It also updates the Purchase<br />
Action Report and the Material Release table, which tracks the<br />
values of the raw material available in the inventory.<br />
3.3.2 CHECKING OPEN ORDERS FOR PRODUCTION<br />
All unfinished customer orders have their status indicated<br />
by a tag in the Customer Order table. The status of an existing<br />
order is either Received, In process, FGI, In transit, or<br />
Delivered. The Customer Order Tracking table lists the orders<br />
that are open <strong>for</strong> production (their status is Received). That is,<br />
these orders have been received, but not yet scheduled <strong>for</strong><br />
production. Periodically, these orders are checked <strong>for</strong><br />
production release. The interval between each such check<br />
depends on the production rescheduling period. If material <strong>for</strong><br />
processing the whole order is available, then it is released <strong>for</strong><br />
production. All of the open orders <strong>for</strong> which material is<br />
available are released at the same time <strong>for</strong> production. If the<br />
available material is insufficient, the order remains open and is<br />
checked again during the next production order release cycle.<br />
Figure 5 shows the process elements and Microsoft Excel<br />
worksheets that are used <strong>for</strong> simulating the production activity.<br />
During each production order release cycle (the Schedule<br />
Production stage), Excel VBA checks the inventory status in<br />
Item Master worksheet to identify orders that can be released<br />
<strong>for</strong> production. For checking the material availability, both the<br />
order size and the bill of materials <strong>for</strong> the corresponding<br />
product have to be considered. This is carried out in Excel<br />
VBA. During each planning cycle, open orders are listed <strong>for</strong><br />
processing based on a heuristic. Raw material requirements are<br />
3 Copyright © 2003 by <strong>ASME</strong>
calculated <strong>using</strong> the bill of materials. Whenever an order is<br />
released <strong>for</strong> production, the necessary raw material is removed<br />
from inventory. When an order is released <strong>for</strong> production, its<br />
status changes from Received to In process.<br />
The released orders seize the Issue Product resource, which<br />
transports the raw materials from the raw material inventory to<br />
the shop floor. The processing time distribution <strong>for</strong> this stage<br />
depends upon the product and the order quantity.<br />
After the raw material has been issued to the shop floor,<br />
the order goes through the Produce and Test stage. (This stage<br />
is absent in participants such as warehouse and retailers that do<br />
not per<strong>for</strong>m any production activities.) The test stage includes<br />
a rework loop that sends a portion of the orders to rework.<br />
The order then enters the Package stage. After packaging,<br />
the order moves to the Stage Product stage, and then the order<br />
is ready <strong>for</strong> delivery and moves to the finished goods inventory.<br />
(Note that this stage uses, in a different manner, the same<br />
Customer Order table that the Schedule Production stage uses.)<br />
At this time, the status of the order changes from In process to<br />
FGI. The order waits in the finished goods inventory until a<br />
delivery plan releases it <strong>for</strong> delivery. Each of the processes<br />
mentioned above has costs associated with it and the costs are<br />
added to the order <strong>using</strong> job order costing method.<br />
3.3.2 CHECKING OPEN ORDERS FOR DELIVERY<br />
The finished goods inventory status is checked<br />
periodically. The Customer Order Tracking table keeps track of<br />
the orders that are available <strong>for</strong> delivery in the finished goods<br />
inventory. As shown in Fig. 6, these orders are sent <strong>for</strong> delivery<br />
during the Schedule Delivery process. The delivery process<br />
requires seizing a transporter resource. The processing time<br />
here corresponds to the transportation time from the producer<br />
(or trader) to the customer. Each order is delivered separately.<br />
The cost <strong>for</strong> transportation gets added to the cost of the order.<br />
Once the order is delivered, its status is changed to Delivered.<br />
The price <strong>for</strong> the order is obtained from the Item Master table.<br />
This value, along with the accumulated cost, is used <strong>for</strong><br />
calculating the profit. After the per<strong>for</strong>mance measures<br />
corresponding to the order have been taken, it is removed from<br />
the Excel file and archived in a text file.<br />
3.4 CASH FLOW<br />
In addition to time based per<strong>for</strong>mance measures (discussed<br />
in the next section), the simulation model also records financial<br />
per<strong>for</strong>mance measures. Cash flow is obtained by associating<br />
costs to each order. Cost accumulation methods (the manner in<br />
which costs are collected and identified with specific<br />
customers, jobs, batches, orders, departments and processes)<br />
vary from firm to firm. In the models developed, job order<br />
costing method is followed. In job order costing, costs are<br />
accumulated by jobs, orders, contracts or lots. In the simulation<br />
model, each order is considered as a job and costs are assigned<br />
to it. Direct material, direct labor, and overhead rates are<br />
considered <strong>for</strong> assigning costs to each order. All the process<br />
costs, including manufacturing costs, are applied to orders<br />
<strong>using</strong> predetermined rates along with an overhead rate<br />
associated with each activity. Direct material cost is obtained at<br />
the point of order release <strong>using</strong> first-in-first-out policy <strong>for</strong> the<br />
raw material inventory. The cost assigned to an order at a<br />
particular resource depends on the amount of time the resource<br />
was utilized by the order. Costs at various stages are added to<br />
arrive at the final cost <strong>for</strong> the order.<br />
3.5 PERFORMANCE MEASURES<br />
Periodically, Arena VBA triggers Excel procedures that<br />
calculate the per<strong>for</strong>mance measures based on the entries in the<br />
corresponding Excel sheets. At the end of each replication,<br />
these per<strong>for</strong>mance measures are put together and the overall<br />
per<strong>for</strong>mance measures <strong>for</strong> the entire replication are calculated.<br />
The per<strong>for</strong>mance measures include cycle time, percent<br />
tardiness, inventory, cost per<strong>for</strong>mance, and resource utilization.<br />
Order based per<strong>for</strong>mance measures are calculated based on the<br />
orders that have been delivered during any given period. For<br />
purposes of cycle time calculations, the whole process from<br />
placing of an order to the delivery of the finished product at the<br />
customer site is divided into four stages. The cycle time refers<br />
to the average time at each of the stages, the average being<br />
taken over the customer orders. The overall cycle time is<br />
calculated as the average time between the placing of an order<br />
by the customer and the delivery of that order by the producer<br />
(or trader) at the customer site. Each product has an associated<br />
lead time. Whenever an order is placed, its estimated delivery<br />
date is given based on the lead time <strong>for</strong> that product. If the<br />
order is delayed beyond its estimated delivery date, then the<br />
order is considered tardy. Percentage of orders that were<br />
delivered after the due date is calculated as the percentage tardy<br />
per<strong>for</strong>mance measure. For calculating the resource utilization,<br />
variables are used to keep track of the amount of time the<br />
resource was busy in any given period. Cost per<strong>for</strong>mance<br />
measures are calculated based on job order costing. Costs are<br />
associated with each order and these values are used to obtain<br />
per<strong>for</strong>mance measures such as cost of goods sold.<br />
Delivery Per<strong>for</strong>mance: Delivery per<strong>for</strong>mance includes the<br />
average cycle time at each stage, the overall cycle time, and the<br />
percentage of orders that were tardy. For calculating the cycle<br />
times, four stages are considered: order receipt to start build,<br />
start build to finished goods inventory, finished goods<br />
inventory to release <strong>for</strong> delivery, and release <strong>for</strong> delivery to<br />
delivery at customer site. The sum of the average cycle times at<br />
these four stages gives the overall cycle time.<br />
Inventory Per<strong>for</strong>mance: Inventory is measured in dollars.<br />
Each inventory per<strong>for</strong>mance measure is the average of the<br />
inventory at the beginning of the period and the inventory at the<br />
end of the period. The inventory per<strong>for</strong>mance measures<br />
include raw material, work in process, and finished goods<br />
inventory.<br />
Inventory Holding Expenses: Each product has an<br />
inventory holding cost associated with it. Inventory holding<br />
expenses are calculated based on the average inventory level.<br />
Inventory Days of Supply: This is calculated based on the<br />
cost of goods manufactured and the average inventory level.<br />
This ratio measures the number of days it takes to sell the entire<br />
stock of inventory.<br />
Cost of Goods Sold: The cost of goods sold is calculated<br />
based on the production costs, purchases, work in process, and<br />
finished goods inventory. For a manufacturing firm, cost of<br />
goods sold is the manufacturing expenses, along with other<br />
expenses <strong>for</strong> goods sold during the period, including raw<br />
material, direct labor, and overhead. For a retail firm, the<br />
manufacturing process is not present. Cost of goods sold can be<br />
used to find the gross profit during the period. The gross profit<br />
4 Copyright © 2003 by <strong>ASME</strong>
is defined as the difference between the sales and the cost of<br />
goods sold. The total sales can be obtained from the total price<br />
<strong>for</strong> the orders delivered during the period.<br />
Cost of Goods Manufactured: Cost of goods manufactured<br />
is the cost of orders that were put in the finished goods<br />
inventory during the period. This includes the cost of orders<br />
that were released <strong>for</strong> production in an earlier period but<br />
completed during the current period. This value is dependent on<br />
the manufacturing expenses <strong>for</strong> the period, including the<br />
overhead, and the work in process inventory at the beginning<br />
and end of the period.<br />
Process Element Utilization: Process element utilization<br />
<strong>for</strong> each of the resources is calculated at the end of the period.<br />
This value is dependent on the time <strong>for</strong> which the<br />
corresponding resources were busy during the period.<br />
4. SUMMARY AND CONCLUSIONS<br />
As companies concentrate on improving the per<strong>for</strong>mance<br />
of the entire supply chain instead of viewing it as a set of<br />
independent organizations, coordination among various<br />
organizations becomes important. Simulation is a very effective<br />
way of evaluating different scenarios in such an environment.<br />
With the advent of more powerful computers, it has become<br />
easier to simulate complex systems. But the amount of time<br />
needed to develop the simulation model can be quite high.<br />
Libraries of reusable submodels can be used to build supply<br />
chain models with less time and ef<strong>for</strong>t, thus increasing the<br />
amount of time available <strong>for</strong> evaluating the system.<br />
Arena, like other simulation software, offers numerous<br />
features to simulate discrete event systems. But the modules<br />
available in Arena are at a very basic level compared to those<br />
used in supply chain simulation models. Developing models<br />
hierarchically (<strong>using</strong> submodels that represent supply chain<br />
processes) can overcome this limitation. In addition, by <strong>using</strong><br />
Arena VBA, the simulation model can communicate with other<br />
applications such as Microsoft Excel. By combining the<br />
simulation capabilities of Arena and the spreadsheet<br />
capabilities of Microsoft Excel, we have constructed a very<br />
efficient and flexible library <strong>for</strong> developing supply chain<br />
simulation models. In order to make the submodels more<br />
common (and thus more useful), we have followed the Supply<br />
Chain Operations Reference model.<br />
Our implementation does not use distributed simulation or<br />
parallel simulation techniques like the Simulation Object Model<br />
or the Run Time Infrastructure that HLA (High Level<br />
Architecture) employs to define data, pass messages, and<br />
synchronize time. For an example of <strong>using</strong> such techniques <strong>for</strong><br />
supply chain simulation, see Turner et al. [17]. However, in<br />
our approach, the simulation components, which can be<br />
modeled as web service components, may communicate<br />
through remote procedure calls in a distributed environment.<br />
ACKNOWLEDGMENTS<br />
This research was supported as part of a collaboration<br />
entitled Enhancing Collaborative <strong>Research</strong> in Industrial and<br />
<strong>Systems</strong> Engineering. The following organizations participated<br />
in the collaboration, which was sponsored by the National<br />
Science Foundation: Department of Industrial and <strong>Systems</strong><br />
Engineering, North Carolina A&T State University; The<br />
Logistics <strong>Institute</strong>, Georgia Tech; and the <strong>Institute</strong> <strong>for</strong> <strong>Systems</strong><br />
<strong>Research</strong>, University of Maryland. The research was<br />
conducted in the Computer Integrated Manufacturing Lab. The<br />
authors appreciate the help provided by Paul Stanfield. Jeffrey<br />
Herrmann has a joint appointment with the Department of<br />
Mechanical Engineering.<br />
REFERENCES<br />
[1] Gaither, N., and Frazier, G., 2002, Operations<br />
Management, Southwestern Thomson Learning,<br />
Cincinnati, Ohio.<br />
[2] Swaminathan, J.M., Smith, S.F., and Sadeh, N.M., 1995,<br />
“In<strong>for</strong>mation exchange in the supply chain,” Technical<br />
Report CMU-RI-TR-95-36, The Robotics <strong>Institute</strong>,<br />
Carnegie Mellon University.<br />
[3] Towill, D.R., Naim, M.M., and Wikner, J., 1992,<br />
“Industrial dynamics simulation models in the design of<br />
supply chains,” International Journal of Physical<br />
Distribution and Logistics Management, 22, pp. 3-13.<br />
[4] Bhaskaran, S., 1998, “Simulation analysis of a<br />
manufacturing supply chain,” Decision Sciences, 29,<br />
pp. 633-657.<br />
[5] Jain, S., Workman, R.W., Collins, L.M., and Ervin, E.C.,<br />
2001, “Development of a high-level supply chain<br />
simulation model,” Proceedings of the 2001 Winter<br />
Simulation Conference, Arlington, Virginia, pp. 1129-<br />
1137.<br />
[6] Chatfield, D.C., Harrison, T.P., and Hayya, J.C., 2001,<br />
“SISCO: a supply chain simulation tool utilizing Silk and<br />
XML,” Proceedings of the 2001 Winter Simulation<br />
Conference, Arlington, Virginia, pp. 614-622.<br />
[7] Eliter, T., Subrahmanian, V.S., and Pick, G., 1998,<br />
“Heterogeneous active agents,” Computer Science<br />
Technical Report Series, University of Maryland, College<br />
Park.<br />
[8] Swaminathan, J.M., Smith, S.F., and Sadeh, N.M., 1998,<br />
“Modeling Supply Chain Dynamics: A Multiagent<br />
Approach,” Decision Sciences, 29, pp. 607-631.<br />
[9] Bagchi, S., Buckley, S.J., Ettl, M., and Lin, G.Y., 1998,<br />
“Experience <strong>using</strong> the IBM supply chain simulator,”<br />
Proceedings of the 1998 Winter Simulation Conference,<br />
Washington, D.C., pp. 1387-1394.<br />
[10] Simulation Dynamics, 2001, “Supply chain builder: a<br />
simulation plat<strong>for</strong>m <strong>for</strong> developing understanding of<br />
complex supply chains,”<br />
http://www.simulationdynamics.com/Sc/index.htm.<br />
[11] GenSym, 2003, “e-SCOR Overview,”<br />
www.gensym.com/supplychain/escor_overview.shtm.<br />
[12] Lee, Y.H., Cho, M.K., Kim, S.J., and Kim, Y.B., 2002,<br />
“Supply chain simulation with discrete-continuous<br />
5 Copyright © 2003 by <strong>ASME</strong>
combined modeling,” Computers & Industrial<br />
Engineering, 43, pp. 375-392.<br />
[13] Supply-Chain Council, 2000, Supply-Chain Operations<br />
Reference-model, Version 4.0, Pittsburgh, Pennsylvania.<br />
[14] Supply-Chain Council, 2002, Supply-Chain Operations<br />
Reference-model, Version 5.0, Pittsburgh, Pennsylvania.<br />
[15] Barnett, M.W., and Miller, C.J., 2000, “Analysis of the<br />
virtual enterprise <strong>using</strong> distributed supply chain modeling<br />
and simulation: an application of e-SCOR,” Proceedings of<br />
the 2000 Winter Simulation Conference, Orlando, Florida,<br />
pp. 352-355.<br />
[16] Pundoor, G., 2002, “Supply chain simulation models <strong>for</strong><br />
evaluating the impact of rescheduling frequencies,” MS<br />
2002-9, <strong>Institute</strong> <strong>for</strong> <strong>Systems</strong> <strong>Research</strong>, University of<br />
Maryland, College Park.<br />
[17] Turner, S.J., Cai-Wentong, and Ping, G.B., 2001,<br />
“Distributed supply chain simulation,” Transactions of the<br />
Society <strong>for</strong> Computer Simulation, 18, pp. 98-109.<br />
6 Copyright © 2003 by <strong>ASME</strong>
Supply Chain<br />
Supply Chain<br />
Participant 1 Participant 2 Participant 3 Participant 4<br />
Participants<br />
Schedule Product<br />
Deliveries<br />
Receive Product<br />
Verify Product<br />
Transfer Product<br />
Schedule<br />
Production<br />
Issue Product<br />
Produce and Test<br />
Package<br />
Stage Product<br />
Receive Orders<br />
Pick and Deliver<br />
Staged Product<br />
Schedule Delivery<br />
Process<br />
Elements<br />
Figure 1. Submodel Hierarchy<br />
Supply Chain<br />
Participant 1 Participant 2 Participant 3 Participant 4<br />
Arena<br />
Submodel A,<br />
Submodel B,<br />
…<br />
Submodel A,<br />
Submodel B,<br />
…<br />
Submodel A,<br />
Submodel B,<br />
…<br />
Submodel A,<br />
Submodel B,<br />
…<br />
VBA<br />
Routines<br />
VBA<br />
Routines<br />
VBA<br />
Routines<br />
VBA<br />
Routines<br />
Participant 1<br />
Workbook<br />
Participant 2<br />
Workbook<br />
Participant 3<br />
Workbook<br />
Participant 4<br />
Workbook<br />
Microsoft<br />
Excel<br />
Figure 2. Arena and Excel Integration<br />
7
Arena Submodels<br />
Participant B<br />
Participant A<br />
Receive Order<br />
Schedule Product<br />
Deliveries<br />
Excel Tables<br />
Item<br />
Master<br />
Customer<br />
Order<br />
Item<br />
Master<br />
Inventory<br />
Management<br />
Figure 3. Participant A placing an order with Participant B<br />
Arena Submodels<br />
Participant A<br />
Participant B<br />
Receive<br />
Product<br />
Verify<br />
Product<br />
Transfer<br />
Product<br />
Pick and Deliver<br />
Staged Products<br />
Excel Tables<br />
Purchase<br />
Action Report<br />
Material<br />
Release<br />
Item Master<br />
Figure 4. Participant A receiving delivery of orders from Participant B<br />
8
Arena Submodels<br />
Schedule<br />
Production<br />
Issue<br />
Product<br />
Produce<br />
and Test<br />
Package<br />
Stage<br />
Product<br />
Excel Tables<br />
Customer Order<br />
Tracking<br />
Customer<br />
Order<br />
Customer Order<br />
Item<br />
Master<br />
Processing<br />
Times<br />
Finished Goods<br />
Inventory<br />
Figure 5. Checking Open Orders <strong>for</strong> Production<br />
Arena Submodels<br />
Participant A<br />
Participant B<br />
Schedule<br />
Delivery<br />
Pick and Deliver<br />
Staged Product<br />
Receive<br />
Product<br />
Excel Tables<br />
Customer<br />
Order<br />
Tracking<br />
Customer<br />
Table<br />
Customer<br />
Order<br />
Finished Goods<br />
Inventory<br />
Figure 6. Participant A delivering completed orders to Participant B<br />
9