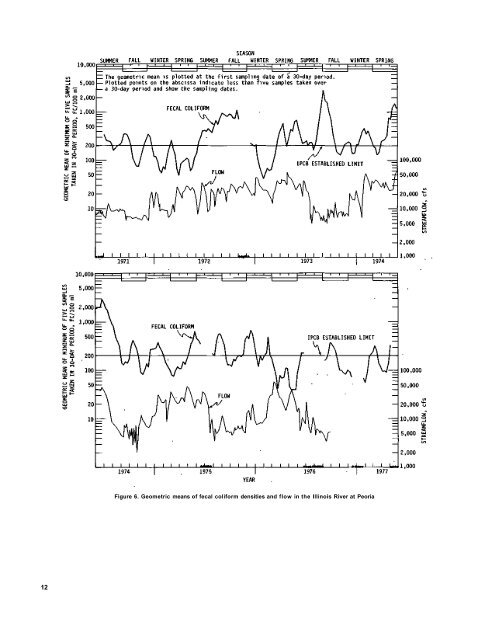
12 Figure 6. Geometric means of <strong>fecal</strong> coliform densities <strong>and</strong> flow <strong>in</strong> <strong>the</strong> Ill<strong>in</strong>ois <strong>River</strong> <strong>at</strong> <strong>Peoria</strong>
Sampl<strong>in</strong>g period Table 5. Evalu<strong>at</strong>ion of Fecal Coliform Densities dur<strong>in</strong>g June 1971-May 1976 with IPCB Rule 203(g) Total number of 30-day periods evalu<strong>at</strong>ed Compliance with geometric mean (≤200/100 ml) Number of Percentage 30-day of 30-day periods periods Observed d<strong>at</strong>a Compliance with 10% of samples dur<strong>in</strong>g 30 days (≤400/100 ml) Number of Percentage 30-day of 30-day periods periods Total number of . 30-day periods evalu<strong>at</strong>ed D<strong>at</strong>a adjusted with omissions Compliance.with IPCB Rule 203(g) Number of Percentage 30-day of 30-day periods periods 6/1971-5/1972 49 33 67.3 22 44.9 53 22 41.5 6/1972-5/1973 47 12 25.5 9 19.1 52 10 19.2 6/1973-5/1974 52 12 23.1 7 13.5 52 7 13.5 6/1974-5/1975 52 24 46.2 17 32.7 52 17 32.7 6/1975-5/1976 47 28 59.6 4 8.5 52 4 7.7 Five-year 247 109 44.1 59 23.9 261 60 23.0 1971 through May 1973, compliance was achieved along <strong>the</strong> Spoon <strong>River</strong> only about 20 percent of <strong>the</strong> time. 18 S<strong>in</strong>ce <strong>the</strong> sewered popul<strong>at</strong>ion of <strong>the</strong> dra<strong>in</strong>age area <strong>at</strong> <strong>Peoria</strong> is about 10 times th<strong>at</strong> of <strong>the</strong> Spoon <strong>River</strong> bas<strong>in</strong>, nonpo<strong>in</strong>t sources <strong>and</strong> <strong>the</strong> assimil<strong>at</strong>ive capacity of stream w<strong>at</strong>ers are important factors to be considered <strong>in</strong> assess<strong>in</strong>g bacterial quality. A comparison of <strong>the</strong> observed FC counts with <strong>the</strong> last part of Rule 203(g) shows th<strong>at</strong> compliance was achieved about 25 percent of <strong>the</strong> time. On <strong>the</strong> basis of <strong>the</strong> results shown <strong>in</strong> table 5, it is apparent th<strong>at</strong> this last part of <strong>the</strong> rule, whereby no more than 10 percent of <strong>the</strong> samples dur<strong>in</strong>g any 30-day period shall exceed 400 FC/100 ml, is <strong>the</strong> limit<strong>in</strong>g factor <strong>in</strong> assess<strong>in</strong>g bacterial quality. The part of <strong>the</strong> rule regard<strong>in</strong>g <strong>the</strong> geometric mean is not <strong>the</strong> limit<strong>in</strong>g factor. A similar conclusion was reported for <strong>the</strong> Spoon <strong>River</strong>. 18 FC/TC Values The historical record of bacteria tests <strong>in</strong> <strong>the</strong> Ill<strong>in</strong>ois <strong>River</strong> as well as o<strong>the</strong>r surface w<strong>at</strong>ers is composed ma<strong>in</strong>ly of total coliform densities. It seems worthwhile, <strong>the</strong>refore; to determ<strong>in</strong>e <strong>the</strong> FC/TC r<strong>at</strong>io values. On <strong>the</strong> basis of <strong>the</strong>se values, FC densities can be estim<strong>at</strong>ed from <strong>the</strong> historical TC d<strong>at</strong>a. The arithmetic mean <strong>and</strong> st<strong>and</strong>ard devi<strong>at</strong>ion were used for evalu<strong>at</strong><strong>in</strong>g <strong>the</strong> FC/TC r<strong>at</strong>ios. The r<strong>at</strong>ios are summarized for yearly <strong>and</strong> monthly <strong>in</strong>tervals <strong>in</strong> tables 6 <strong>and</strong> 7. The overall r<strong>at</strong>ios varied considerably, rang<strong>in</strong>g from 0.0000 to 0.5333 with a 5-year average of 0.0711; <strong>in</strong> o<strong>the</strong>r words, about 7.1 percent of <strong>the</strong> total coliform consisted of <strong>fecal</strong> coliform. The overall average FC/TC r<strong>at</strong>io for <strong>the</strong> Ill<strong>in</strong>ois <strong>River</strong> <strong>at</strong> <strong>Peoria</strong> was found to be lower than th<strong>at</strong> for <strong>the</strong> Upper Ill<strong>in</strong>ois W<strong>at</strong>erway (8.8 percent), 10 <strong>the</strong> Spoon <strong>River</strong> (9.5 percent), 18 <strong>and</strong> <strong>the</strong> Ohio <strong>River</strong> (14 percent). 23 The range of <strong>the</strong> r<strong>at</strong>ios for <strong>the</strong> Ill<strong>in</strong>ois <strong>River</strong> <strong>at</strong> <strong>Peoria</strong> (0.000-0.53) was gre<strong>at</strong>er than th<strong>at</strong> of <strong>the</strong> Upper Ill<strong>in</strong>ois W<strong>at</strong>erway (0.002- 0.38) <strong>and</strong> <strong>the</strong> Ohio <strong>River</strong> (0.004-0.45), <strong>and</strong> was comparable to th<strong>at</strong> of <strong>the</strong> Spoon <strong>River</strong> (0.003-0.57). The yearly average FC/TC r<strong>at</strong>ios varied widely; <strong>the</strong> high <strong>and</strong> low ones differ 10-fold (table 6). The highest yearly average was observed dur<strong>in</strong>g <strong>the</strong> first study year (June 1971-May 1972), <strong>and</strong> <strong>the</strong> smallest r<strong>at</strong>io occurred dur<strong>in</strong>g <strong>the</strong> fourth study year. To produce low r<strong>at</strong>ios, ei<strong>the</strong>r <strong>the</strong> FC densities must decrease or <strong>the</strong> TC counts must <strong>in</strong>crease. From <strong>in</strong>spection of table 4, it can be concluded th<strong>at</strong> <strong>the</strong> lower FC/TC r<strong>at</strong>ios <strong>in</strong> <strong>the</strong> w<strong>in</strong>ter <strong>and</strong> spr<strong>in</strong>g are due to <strong>the</strong> <strong>in</strong>creases <strong>in</strong> TC densities, <strong>and</strong> <strong>the</strong> higher r<strong>at</strong>ios <strong>in</strong> summer <strong>and</strong> fall are due to <strong>the</strong> <strong>in</strong>creases <strong>in</strong> FC counts. Based on <strong>the</strong> 5-year d<strong>at</strong>a, <strong>the</strong> monthly average FC/TC r<strong>at</strong>ios are modified by seasons. Table 7 shows th<strong>at</strong> <strong>the</strong> r<strong>at</strong>ios were low <strong>in</strong> w<strong>in</strong>ter <strong>and</strong> spr<strong>in</strong>g (December through May), while high r<strong>at</strong>ios occurred <strong>in</strong> June, July, <strong>and</strong> September. The average r<strong>at</strong>io for August was about th<strong>at</strong> for <strong>the</strong> 5-year average; <strong>the</strong> mean FC/TC values for October <strong>and</strong> November were above <strong>the</strong> 5-year average. Similar p<strong>at</strong>terns were also observed <strong>in</strong> <strong>the</strong> Spoon <strong>River</strong>. 18 The monthly st<strong>and</strong>ard devi<strong>at</strong>ions followed <strong>the</strong> same p<strong>at</strong>tern as <strong>the</strong> monthly average FC/TC r<strong>at</strong>ios, i.e., <strong>the</strong> higher <strong>the</strong> monthly average, <strong>the</strong> higher <strong>the</strong> st<strong>and</strong>ard devi<strong>at</strong>ion. Strobel 24 po<strong>in</strong>ted out th<strong>at</strong> <strong>the</strong> rel<strong>at</strong>ionship between FC <strong>and</strong> TC varied with <strong>the</strong> source of pollution, level of wastew<strong>at</strong>er tre<strong>at</strong>ment, characteristics 13