The Rich Transcription 2007 Meeting Recognition Evaluation - NIST ...
The Rich Transcription 2007 Meeting Recognition Evaluation - NIST ...
The Rich Transcription 2007 Meeting Recognition Evaluation - NIST ...

You also want an ePaper? Increase the reach of your titles
YUMPU automatically turns print PDFs into web optimized ePapers that Google loves.
<strong>The</strong> <strong>Rich</strong> <strong>Transcription</strong> <strong>2007</strong> <strong>Meeting</strong> <strong>Recognition</strong><br />
<strong>Evaluation</strong><br />
Jonathan G. Fiscus 1 , Jerome Ajot 1,2 , John S. Garofolo 1<br />
1 National Institute Of Standards and Technology, 100 Bureau Drive Stop 8940, Gaithersburg,<br />
MD 20899<br />
2 Systems Plus, Inc., One Research Court – Suite 360, Rockville, MD 20850<br />
{jfiscus,ajot,jgarofolo}@nist.gov<br />
Abstract. We present the design and results of the Spring <strong>2007</strong> (RT-07) <strong>Rich</strong><br />
<strong>Transcription</strong> <strong>Meeting</strong> <strong>Recognition</strong> <strong>Evaluation</strong>; the fifth in a series of community-wide<br />
evaluations of language technologies in the meeting domain. For <strong>2007</strong>,<br />
we supported three evaluation tasks: Speech-To-Text (STT) transcription,<br />
“Who Spoke When” Diarization (SPKR), and Speaker Attributed Speech-To-<br />
Text (SASTT). <strong>The</strong> SASTT task, which combines STT and SPKR tasks, was a<br />
new evaluation task. <strong>The</strong> test data consisted of three test sets: Conference<br />
<strong>Meeting</strong>s, Lecture <strong>Meeting</strong>s, and Coffee Breaks from lecture meetings. <strong>The</strong><br />
Coffee Break data was included as a new test set this year. Twenty-one research<br />
sites materially contributed to the evaluation by providing data or building<br />
systems. <strong>The</strong> lowest STT word error rates with up to four simultaneous<br />
speakers in the multiple distant microphone condition were 40.6 %, 49.8 %, and<br />
48.4 % for the conference, lecture, and coffee break test sets respectively. For<br />
the SPKR task, the lowest diarization error rates for all speech in the multiple<br />
distant microphone condition were 8.5 %, 25.8 %, and 25.5 % for the conference,<br />
lecture, and coffee break test sets respectively. For the SASTT task, the<br />
lowest speaker attributed word error rates for segments with up to three simultaneous<br />
speakers in the multiple distant microphone condition were 40.3 %,<br />
59.3 %, and 68.4 % for the conference, lecture, and coffee break test sets respectively.<br />
1. Motivation<br />
<strong>The</strong> National Institute of Standards and Technology (<strong>NIST</strong>) has worked with the<br />
speech recognition community since the mid 1980s to improve the state-of-the-art in<br />
speech processing technologies. [1] To facilitate progress, <strong>NIST</strong> has worked with the<br />
community to make training/development data sets available for several speech domains.<br />
<strong>NIST</strong> collaborated with the research community to define performance metrics<br />
and create evaluation tools for technology developers to perform hill-climbing<br />
experiments and measure their progress. <strong>NIST</strong> also coordinates periodic communitywide<br />
benchmark tests and technology workshops to facilitate technical exchange and<br />
track progress trends over time. <strong>The</strong> test suites used in these benchmark tests become<br />
development resources after the formal evaluations.
In 2001, <strong>NIST</strong> began administering the <strong>Rich</strong> <strong>Transcription</strong> <strong>Evaluation</strong> series for the<br />
DARPA Effective, Affordable, Reusable, Speech-to-Text (EARS) Program in the<br />
Broadcast News (BN) and Conversation Telephone Speech (CTS) domains. <strong>The</strong><br />
EARS community focused on building technologies to generate transcriptions of<br />
speech that are fluent, informative, readable by humans, and usable in downstream<br />
processes. To accomplish this, EARS technologies produced transcripts consisting of<br />
words and non-orthographic metadata. We refer to these metadata enriched transcripts<br />
as “rich transcriptions.” While the metadata can take many forms, the EARS program<br />
worked on three main forms: which speakers spoke which words, syntactic boundaries,<br />
and dysfluent speech detection.<br />
In 2002, the community began investigating the meeting domain as a new evaluation<br />
domain because the error rates on BN material approached 6 times that of human<br />
performance indicating the community needed a more difficult challenge problem.<br />
When error rates come close to human performance, the evaluation costs rise dramatically<br />
because transcription ambiguity in the reference becomes a disproportionately<br />
large component of the error rates. While large test sets and/or meticulously scrutinized<br />
reference transcripts can ameliorate the impact of ambiguity, they both require<br />
great expense. Instead, research in the meeting domain became a popular because it<br />
provides a unique environment to collect naturally occurring spoken interactions under<br />
controlled sensor conditions that presents several challenges to the technologies<br />
resulting in higher error rates. <strong>The</strong>se include varied fora, an infinite number of topics,<br />
spontaneous highly interactive/overlapping speech, varied recording environments,<br />
varied/multiple microphones, multi-modal inputs, participant movement, and far field<br />
speech effects such as ambient noise and reverberation.<br />
At roughly the same time in the early 2000’s, a number of independent large-scale<br />
programs included the meeting domain as a component of their research and evaluation<br />
efforts. <strong>The</strong> programs included the European Union (EU) Computers in the Human<br />
Interaction Loop (CHIL), the EU Augmented Multiparty Interaction with Distant<br />
Access (AMIDA) program, and the US Video Analysis and Content Extraction<br />
(VACE) program. <strong>The</strong> programs shared many aspects of uni-modal (audio or video)<br />
and multi-modal (audio+video) research indicating a strong movement was underway<br />
in the research community to focus on building and experimenting with multi-modal<br />
technologies. However, little infrastructure was in place to support the research nor<br />
was there a public evaluation-based forum for technical interchange.<br />
Beginning in 2005, CHIL, <strong>NIST</strong>, and VACE orchestrated a multi-year plan to<br />
bring together the disjoint speech and video processing communities through common<br />
evaluations. In 2006, the CHIL and VACE programs started the Classification of<br />
Events, Activities, and Relationships (CLEAR) evaluation [7, 14]. While the 2006<br />
CLEAR <strong>Evaluation</strong> Workshop was held in conjunction with the 7th IEEE International<br />
Conference on Face and Gesture <strong>Recognition</strong> (FG2006), the shared use of common<br />
evaluation corpora for the RT and CLEAR evaluations in 2006 set the stage for the<br />
joint CLEAR and RT evaluations and workshops in <strong>2007</strong>. [15]<br />
<strong>The</strong> <strong>Rich</strong> <strong>Transcription</strong> <strong>2007</strong> (RT-07) <strong>Meeting</strong> <strong>Recognition</strong> evaluation, which was<br />
part of the <strong>NIST</strong> <strong>Rich</strong> <strong>Transcription</strong> (RT) series of language technology evaluations<br />
[1] [2] [6] [10], included three evaluation tasks:<br />
• Speech-To-Text (STT) transcription – Transcribe the spoken words.
• “Who Spoke When” Diarization (SPKR) – Detect segments of speech and<br />
cluster them by speaker.<br />
• Speaker Attributed Speech-To-Text (SASTT) – Transcribe the spoken<br />
words and associate them with a speaker<br />
<strong>The</strong> first two tasks, STT and SPKR, are component tasks that have always been include<br />
in the RT evaluations. <strong>The</strong> SASTT is a composite task that includes both STT<br />
and SPKR tasks. <strong>The</strong> RT-07 evaluation was the first evaluation to include the SASTT<br />
task although ICSI/SRI experiments conducted during the EARS Program [13] were<br />
very similar to the presently defined task.<br />
<strong>The</strong> RT-07 evaluation is the result of a multi-site/multi-national collaboration. In<br />
addition to <strong>NIST</strong>, the organizers and contributors included:<br />
• Athens Information Technology (AIT)<br />
• <strong>The</strong> Augmented Multiparty Interaction with Distant Access (AMIDA)<br />
Program<br />
• <strong>The</strong> Computers in the Human Interaction Loop (CHIL) Program<br />
• Carnegie Mellon University (CMU)<br />
• Edinburgh University (EDI)<br />
• <strong>Evaluation</strong>s and Language Resources Distribution Agency (ELDA)<br />
• IBM<br />
• International Computer Science Institute (ICSI)<br />
• Infocomm Research Site (I2R)<br />
• Nanyang Technological University (NTU)<br />
• SRI International (SRI)<br />
• <strong>The</strong> Center for Scientific and Technological Research (ITC-irst)<br />
• Karlsruhe University (UKA)<br />
• <strong>The</strong> Linguistic Data Consortium (LDC)<br />
• Laboratoire Informatique d'Avignon (LIA)<br />
• Laboratoire d'Informatique pour la Mécanique et les Sciences de<br />
l'Ingénieur (LIMSI)<br />
• Sheffield University<br />
• Netherlands Organisation for Applied Scientific Research (TNO)<br />
• Universitat Politècnica de Catalunya (UPC)<br />
• Virginia Tech (VT)<br />
<strong>The</strong> RT-07 evaluation made use of three test sets: Conference <strong>Meeting</strong>s, Lecture<br />
<strong>Meeting</strong>s, and Coffee Breaks from Lecture <strong>Meeting</strong>s. <strong>The</strong> multiple test sets fostered<br />
collaboration by sharing data across programmatic boundaries while accommodating<br />
the needs of individual programs and by promoting cross-disciplinary interchange via<br />
shared corpora.
2. <strong>Rich</strong> <strong>Transcription</strong> <strong>2007</strong> <strong>Meeting</strong> <strong>Recognition</strong> <strong>Evaluation</strong><br />
<strong>The</strong> RT-07 evaluation was similar to previous RT evaluations except for three<br />
changes: the addition of the Speaker Attributed Speech-To-Text task, the deletion of<br />
Speech Activity Detection (SAD) task, and the addition of Coffee Break excerpts as a<br />
new test set.<br />
All participating teams were required to submit a single primary system on the required<br />
task-specific evaluation condition. Developers selected their primary systems<br />
based on their efforts to build their best performing system. <strong>NIST</strong>’s analysis focuses<br />
on these primary systems.<br />
<strong>The</strong> <strong>Rich</strong> <strong>Transcription</strong> Spring <strong>2007</strong> <strong>Evaluation</strong> plan [3] describes in detail the<br />
evaluation tasks, data sources, microphone conditions, system input and output formats,<br />
and evaluation metrics employed in the evaluation. This section summarizes<br />
the evaluation plan by discussing the test sets for the meeting sub-domains, the audio<br />
input conditions, the evaluation task definitions, and the evaluation corpora details.<br />
2.1 <strong>Meeting</strong> Sub-Domains and Test Sets<br />
<strong>The</strong> meeting domain is highly variable along several dimensions. <strong>Meeting</strong>s, which<br />
are verbal interactions between two or more people, range from brief informal exchanges<br />
to extremely formal proceedings with many participants following specific<br />
rules of order. However, the variability is so large that it would be impossible to<br />
build either training or testing corpora that encompasses all of these factors. <strong>The</strong>refore,<br />
the RT evaluations have focused efforts on narrowly defined meeting subdomains<br />
to make the problem tractable. <strong>The</strong> RT-07 evaluation material included data<br />
from two meeting sub-domains: small conference room meetings (also occasionally<br />
referred to as “board room” meetings) and interactive lectures in a small meeting<br />
room setting.<br />
<strong>The</strong> two sub-domains represent two different participant interaction modes as<br />
well as sensor setups. <strong>The</strong> primary difference between the two sub-domains is in the<br />
group dynamics of the meetings. <strong>The</strong> first sub domain, conference meetings, consists<br />
of primarily goal-oriented, decision-making exercises and can vary from moderated<br />
meetings to group consensus-building meetings. As such, these meetings are highly<br />
interactive and multiple participants contribute to the information flow and decisions.<br />
In contrast, the second sub-domain, lecture meetings, consists of educational events<br />
where a single lecturer briefs an audience on a particular topic. While the audience<br />
occasionally participates in question and answer periods, the lecturer predominately<br />
controls the meeting.<br />
<strong>The</strong> RT-07 evaluation included three test sets: the conference room meeting test set<br />
(confmtg), the lecture room meeting test set (lectmtg), and the coffee break (cbreak)<br />
test set. <strong>The</strong> confmtg and lectmtg data sets are “similar” to previous test sets because<br />
the data selection protocol did not change. <strong>The</strong> cbreak data consisted of excerpts selected<br />
from Lecture <strong>Meeting</strong>s where the participants took a coffee break during the<br />
recording.<br />
<strong>The</strong> recordings were sent to participants as either down-sampled, 16-bit, 16 KHz,<br />
<strong>NIST</strong> Speech Header Resources (SPHERE) files, the original 24-bit, 44.1 KHz WAV
files, or headerless raw files. [12] further documents the confmtg data set. [11] further<br />
documents the lectmtg data set.<br />
Conference Room <strong>Meeting</strong>s: <strong>The</strong> confmtg test set consisted of nominally 190 min of<br />
meeting excerpts from eight different meetings. <strong>NIST</strong> selected 22.5 min from each<br />
meeting to include in the test set. Four sites contributed two meeting recordings for<br />
eight total meetings. <strong>The</strong> four sites were Edinburgh University (EDI), Carnegie Mellon<br />
University (CMU), the National Institute of Standards and Technology (<strong>NIST</strong>),<br />
and Virginia Tech (VT). <strong>The</strong> Linguistic Data Consortium (LDC) transcribed the test<br />
set according to the “<strong>Meeting</strong> Data Careful <strong>Transcription</strong> Specification - V1.2” guidelines<br />
[4], [12]. Table 1 gives the salient details concerning the confmtg evaluation<br />
corpus.<br />
Each meeting recording met minimum sensor requirements. All meeting participants<br />
wore a head-mounted close talking microphone and there were at least three table-top<br />
microphones placed between the meeting participants. <strong>The</strong> dialects were predominately<br />
American English with the exception of the EDI meetings. In addition to<br />
these sensors, the EDI meetings included an eight-channel circular microphone array<br />
placed on the table between the meeting participants.<br />
Table 1. Summary of Conference Room <strong>Meeting</strong> evaluation corpus<br />
<strong>Meeting</strong> ID<br />
Duration Number of<br />
(minutes) Participants<br />
Notes<br />
CMU_20061115-1030 22.5 4 Discussion group<br />
CMU_20061115-1530 22.6 4 <strong>Transcription</strong> team mtg.<br />
EDI_20051113-1500 22.6 4 Remote control design<br />
EDI_20051114-1500 22.7 4 Remote control design<br />
<strong>NIST</strong>_20051104_1515 22.4 4 Planning meeting<br />
<strong>NIST</strong>_20060216-1347 22.5 6 SWOT analysis mtg.<br />
VT_20050408-1500 22.4 5 Problem solving scenario<br />
VT_20050425-1000 22.6 4 Problem solving scenario<br />
Total 35<br />
Lecture Room <strong>Meeting</strong>s <strong>The</strong> lectmtg test set consisted of 164 min of lecture<br />
meeting excerpts recorded at AIT, IBM, ITC-irst, UKA, and UPC. CMU selected and<br />
transcribed 32, 5 min excerpts for the test set from 20 different meeting recordings<br />
[11]. <strong>The</strong> lectures were the CHIL “interactive lectures.” <strong>The</strong> lectures involved fewer<br />
people, 3-7 participants, and contained more interactivity than the RT-06 lectmtg test<br />
set. <strong>The</strong> excerpts selected for the lectmtg test set were from the core of the meeting<br />
when either the lecturer was speaking or the lecture was answering questions.<br />
<strong>The</strong> lectmtg data included more audio sensors that the confmtg data. <strong>The</strong>y included<br />
four-to-six source localization arrays mounted on each of the four walls of the<br />
room, and one or two Mark III arrays mounted near the lecturer.
Coffee Break <strong>Meeting</strong>s <strong>The</strong> cbreak test set consisted of 41 min of lecture meeting<br />
excerpts recorded at AIT, IBM, ITC-irst, UKA, and UPC. CMU selected and transcribed<br />
eight, 5 min excerpts for the test set from eight different meeting recordings<br />
[11]. <strong>The</strong> data, which came from the same meetings as the lectmtg data, consisted of<br />
the coffee break periods when the lecturer took a brief break from the presentation<br />
and participants stood up to walk around the room and get coffee. <strong>The</strong> CLEAR evaluation<br />
developed the cbreak data set as a more challenging video processing meeting<br />
data set than the typical lecture meeting videos. While the community at large wanted<br />
to build multi-modal data sets, the RT community decided the cbreak data did not<br />
conform to previously used lectmtg test sets. <strong>The</strong>refore, the RT community decided<br />
to make the coffee break material a separate test set rather than drastically change the<br />
makeup of the RT-07 lectmtg test set compared to previous years.<br />
2.2 Microphone Conditions<br />
<strong>The</strong> RT-07 evaluation supported seven input conditions. <strong>The</strong>y were:<br />
• Multiple distant microphones (MDM): This evaluation condition includes the audio<br />
from at least three omni-directional microphones placed (generally on a table)<br />
between the meeting participants.<br />
• Single distant microphone (SDM): This evaluation condition includes the audio of<br />
a single, centrally located omni-directional microphone from the set of MDM microphones.<br />
Metadata provided with the meetings supplies the information to select<br />
the microphone.<br />
• Individual head microphone (IHM): This evaluation condition includes the audio<br />
recordings collected from a head mounted microphone positioned very closely to<br />
each participant’s mouth. <strong>The</strong> microphones are typically cardioid or super cardioid<br />
microphones and therefore of the best quality signal for each speaker. Since the<br />
IHM condition is a contrastive condition, systems can also use any of the microphones<br />
used for the MDM condition.<br />
• Individual head microphone plus reference segmentation (IHM+REFSEG): This<br />
evaluation condition used the IHM audio and reference speech/non-speech segmentations.<br />
This evaluation condition is a laboratory control condition. <strong>The</strong> intent<br />
of the IHM condition was to provide clean, near field speech. However, the IHM<br />
recordings can at times include a significant amount of cross talk that requires significant<br />
effort to ameliorate. This condition provides developers with the opportunity<br />
to process clean, near field speech without the need to implement cross talk rejection.<br />
• Multiple Mark III microphone arrays (MM3A): This evaluation condition includes<br />
audio from all the collected Mark III microphone arrays. A Mark III microphone<br />
arrays is a 64-channel, linear topology, digital microphone array [18]. <strong>The</strong> lecture<br />
domain data contains the data from each channel of one or two Mark-III microphone<br />
array per meeting.<br />
• Multiple source localization microphone arrays (MSLA): This evaluation condition<br />
includes the audio from all the CHIL source localization arrays (SLA). An SLA is<br />
a 4-element digital microphone array arranged in an upside down ‘T’ topology.
<strong>The</strong> lecture domain data includes four or six SLAs mounted on the walls of the<br />
room.<br />
• All distant microphones (ADM): This evaluation conditions permits the use of all<br />
distant microphones for each meeting. This condition differs from the MDM condition<br />
in that the microphones are not restricted to the centrally located microphones<br />
but rather all microphones including the Mark III arrays and Source Localization<br />
arrays.<br />
<strong>The</strong> troika of MDM, SDM, and IHM audio input conditions makes a very powerful<br />
set of experimental controls for black box evaluations. <strong>The</strong> MDM condition provides<br />
a venue for the demonstration of multi-microphone input processing techniques. It<br />
lends itself to experimenting with beamforming and noise abatement techniques to<br />
address room acoustic issues. <strong>The</strong> SDM input condition provides a control condition<br />
for testing the effectiveness of multi-microphone techniques. <strong>The</strong> IHM condition<br />
provides two important contrasts: first, it reduces the effects of room acoustics, background<br />
noise, and most simultaneous speech, and second it is most similar to the<br />
Conversational Telephone Speech (CTS) domain [1] and may be compared to results<br />
in comparable CTS evaluations.<br />
2.3 <strong>Evaluation</strong> tasks<br />
<strong>The</strong> RT-07 evaluation supported three evaluation tasks: the Speech-To-Text transcription<br />
task, the “Who Spoke When” Diarization Task, and the Speaker Attributed<br />
Speech-To-Text task. <strong>The</strong> following is a brief description of each of the evaluation<br />
tasks:<br />
Speech-To-Text (STT) <strong>Transcription</strong>: STT systems output a transcript containing<br />
all of the words spoken by the meeting participants. For each word recognized by the<br />
system, the system outputs the word’s orthography along with the word’s start/end<br />
times and confidence score. For this task, the system outputs a single stream of words<br />
since no speaker designation is required.<br />
<strong>The</strong> primary metric is Word Error Rate (WER). WER is the sum of transcription<br />
errors, (word substitutions, deletions, and insertions) divided by the number of reference<br />
words, and expressed as a percentage. It is an error metric, so lower scores indicate<br />
better performance. <strong>The</strong> score for perfect performance is zero. WER scores can<br />
exceed one hundred percent since the metric includes insertion errors.<br />
<strong>The</strong> scoring process consists of three steps: transcript normalization, segment<br />
group chunking to reduce alignment computations, and word alignment.<br />
<strong>The</strong> process for text normalization includes many steps including spelling variant<br />
normalization, contraction expansion, optional words, etc. See the evaluation plan for<br />
a detailed enumeration of the text normalizations.<br />
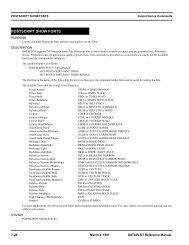
<strong>The</strong> segment group chunking splits a recording into independent units for alignment<br />
based on reference speaker segment times. Figure 1 is an example of segment<br />
group chunking which shows four segment groups. <strong>The</strong> number of active speakers in<br />
a segment group defines the “Overlap Factor” (OV) of the segment group. <strong>The</strong> overlap<br />
factor is not a measure of absolute speaker overlap (e.g., by time); rather it is a
method for counting the dimensions necessary to compute a word alignment. Segment<br />
group chunking is consistent across systems; therefore, segment groups provide an effective<br />
way to bound computation and score subsets of the recordings consistently<br />
across systems. <strong>The</strong> final step in segment group chunking is to collect the system<br />
words whose time midpoints are within the span of a segment group. Each segment<br />
group along with the system output words assigned to it form an independent unit for<br />
the alignment engine.<br />
Time<br />
Reference<br />
Segments<br />
Spkr1<br />
Spkr3<br />
Spkr2<br />
Spkr1<br />
Spkr2<br />
Spkr1<br />
Spkr2<br />
Spkr3<br />
Segment<br />
Groups<br />
Overlap<br />
Factor<br />
0 1 2 3<br />
Figure 1. Example segment group chunking analysis<br />
<strong>The</strong> final scoring step is to align the references and the system output in order to<br />
count errors. An alignment is a one-to-one mapping between system and reference<br />
words that minimizes the edit distance to convert the system transcript into the reference<br />
transcript. <strong>NIST</strong> used the multi-dimensional, Dynamic Programming solution to<br />
sequence alignment found in the ASCLITE tool [8] of the SCTK package [5] to perform<br />
the alignment and scoring. <strong>The</strong> alignments are computationally expensive,<br />
O(N #S+#R ) where N is the number of words per speaker, #S is the number of system<br />
speakers, and #R is the number of reference speakers. <strong>The</strong> STT systems do not differentiate<br />
speakers therefore #S for the STT task is 1. To reduce the computational burden,<br />
several techniques discussed in [8] minimize the computational requirements.<br />
<strong>The</strong> MDM audio input condition was the primary evaluation condition for the STT<br />
task for all test sets. <strong>The</strong> results reported for all distant microphone conditions include<br />
segment groups with up to and including overlap factor 4 (WER (OV≤4) ). Standardizing<br />
on OV≤4 was empirically determined to be a reasonable cutoff balancing<br />
evaluated material vs. the required computational resources for alignment.<br />
Diarization “Who Spoke When” (SPKR): SPKR systems annotate a meeting with<br />
regions of time indicating when each meeting participant is speaking and clustering<br />
the regions by speaker. It is a clustering task as opposed to an identification task<br />
since the system is not required to output a speaker name or identify each speaker<br />
from a gallery – only a generic id that is unique within the processed meeting excerpt.<br />
<strong>The</strong> Diarization Error Rate (DER) is the primary metric. DER is the ratio of incorrectly<br />
attributed speech time, (falsely detected speech, missed detections of speech,<br />
and incorrectly clustered speech) to the total amount of speech time, expressed as a<br />
percentage. As with WER, a score of zero indicates perfect performance and higher<br />
scores indicate poorer performance.<br />
Incorrectly clustered speech, a speaker error, occurs when a system successfully<br />
detects speech but attributes the speech to the wrong speaker. Since the system generates<br />
its own clusters and there is no a priori connection between the system and reference<br />
speaker clusters, correct speaker attribution is determined by finding a minimal
cost, one-to-one mapping between the system speaker clusters and reference speaker<br />
clusters using the Hungarian solution to a bipartite graph [16]. This “speaker mapping”<br />
is the basis for determining which system speaker is correct – the mapped system/reference<br />
speakers are correct.<br />
Preparing reference segment boundaries for the evaluation is an inherently difficult<br />
human annotation task because of the ambiguities in pinpointing speech boundaries.<br />
Ambiguities include time padding for segment-initial plosives, differentiating independent<br />
adjacent segments and single segments, and others. Instead of building arbitrary<br />
rules for annotators to follow, the evaluation infrastructure accommodates the<br />
variability with three techniques. First, the evaluation tool does not score system performance<br />
within 0.25 s of each reference segment boundary. This “no score” collar<br />
minimizes the amount of DER error due to segment boundary inconsistencies.<br />
Second, adjacent reference segments are merged if they are within 0.3 s of each other.<br />
Although somewhat arbitrary, 0.3 s was empirically determined to be a good approximation<br />
of the minimum duration for a pause in speech resulting in an utterance<br />
boundary. Finally, the process for constructing the reference segments changed for<br />
RT-07. Instead of relying on human segmentations, the reference segment times were<br />
derived from automatically computed word occurrence times. <strong>NIST</strong> used the LIMSI<br />
speech recognition tools to align the reference transcript to the speech signals thus generating<br />
the word time locations. Using these “forced word alignments,” construction<br />
of the reference segments consisted of converting each word into a segment and then<br />
smoothing the segments with the 0.3 s smoothing parameter.<br />
<strong>The</strong> MDM audio input condition was the primary evaluation condition for the<br />
SPKR task for a test sets.<br />
Speaker Attributed Speech-To-Text (SASTT): SASTT systems output a transcript<br />
containing all of the words spoken during a meeting and attributing each word to a<br />
single speaker. <strong>The</strong> SASTT task is a joint technology development task that combines<br />
both Diarization “Who Spoke When” and Speech-To-Text technologies into a<br />
single task.<br />
Speaker Attributed Word Error Rate (SWER) is the primary evaluation metric.<br />
SWER is the sum of transcription errors, (word substitutions, word deletions, word<br />
insertions, and speaker substitutions) divided by the number of reference words, and<br />
expressed as a percentage. WER and SWER are closely related – SWER has an additional<br />
error type, “speaker substitutions” (SpSub). Speaker substitutions are correctly<br />
recognized words attributed to the incorrect speaker. SWER is an error metric, so<br />
lowers scores indicate better performance. <strong>The</strong> score for perfect performance is zero.<br />
SWER scores can exceed one hundred percent since the metric includes insertion errors.<br />
<strong>The</strong> SASTT scoring process, which is very similar to the STT scoring process,<br />
consists of four steps: transcript normalization, speaker mapping, segment group<br />
chunking, and word alignment. <strong>The</strong> transcript normalization and segment group<br />
chunking steps are identical to the processes used for STT scoring. <strong>The</strong> speaker mapping<br />
step is an additional step for SASTT scoring and the word alignment process is<br />
slightly different for SASTT scoring.<br />
As stated prpeviously, SASTT systems must accurately attribute each word to a<br />
speaker. <strong>The</strong> SASTT scorer uses the SPKR evaluation tool to generate a system-to-
eference speaker-mapping list that serves as the definition of a correct speaker: the<br />
correct reference speaker for a system speaker is the reference speaker mapped to it.<br />
<strong>The</strong> word alignment process uses the speaker correctness information to determine<br />
when speaker substitutions occur. We used ASCLITE’s [8] Multiple System Streamto-Multiple<br />
Reference Stream alignment capabilities to compute the word alignments.<br />
Like the STT evaluation, the MDM audio input condition is the required condition.<br />
Unlike STT, however, the results reported for all distant microphone conditions include<br />
segment groups with up to and including overlap factor 3 (OV≤3). <strong>The</strong> additional<br />
computation burden proved too great to compute overlap factor 4 in reasonable<br />
time and with complete coverage. This is because the number of number of system<br />
speakers in a segment group can be greater than one. As an example, overlap factor 4<br />
scoring for the AMI SASTT system would require 272 TB of memory search space to<br />
complete.<br />
3. Results of the RT-07 <strong>Evaluation</strong><br />
3.1 RT-07 <strong>Evaluation</strong> Participants<br />
<strong>The</strong> following table lists the RT-07 participants and the evaluation tasks for which<br />
they built systems.<br />
Table 2. Summary of evaluation participants and the tasks for which systems were submitted.<br />
Site ID<br />
Site Name<br />
<strong>Evaluation</strong> Task<br />
SPKR STT SASTT<br />
AMI<br />
Augmented Multiparty Interaction with Distance<br />
Access<br />
X X X<br />
Infocomm Research Site and Nanyang Technological<br />
University<br />
X<br />
I2R/NTU<br />
IBM IBM X X X<br />
ICSI International Computer Science Institute X<br />
LIA Laboratoire Informatique d'Avignon X<br />
LIMSI<br />
Laboratoire d'Informatique pour la<br />
X<br />
X<br />
Mécanique et les Sciences de l'Ingénieur<br />
SRI/ICSI<br />
International Computer Science Institute and<br />
X X<br />
SRI International<br />
UKA Karlsruhe University (UKA) X<br />
UPC Universitat Politècnica de Catalunya X<br />
3.2 Speech-To-Text (STT) Results<br />
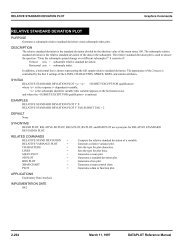
Four sites participated in the STT task: AMI, IBM, SRI/ICSI, and UKA. Figure 2<br />
contains the results of all primary systems.
<strong>The</strong> WER (OV≤4) s for the MDM audio input condition for the confmtg data were<br />
45.6 % and 40.6 % for AMI and SRI/ICSI respectively. <strong>The</strong> coverage of scoreable<br />
meetings for segment groups with OV≤4 was 99.3 %. <strong>The</strong> differences are significant<br />
at the 95 % confidence level using the Matched Pairs Sentence-Segment Word Error<br />
(MAPSSWE) test [17].<br />
<strong>The</strong> WER (OV≤4) s for the MDM audio input condition on the lectmtg data were 51.0<br />
%, 49.8 %, and 58.4 % for IBM, SRI/ICSI, and UKA respectively. <strong>The</strong> coverage of<br />
scoreable meetings for segment groups with OV≤4 was 99.6%. All differences are<br />
significant according to the MAPSSWE test.<br />
Only SRI/ICSI submitted outputs for the cbreak data. <strong>The</strong>ir WER (OV≤4) s for the<br />
MDM condition was 48.4, which was 2.8 % (relative) lower than their WER for the<br />
lectmtg data. While the error rate was lower for the cbreak data, it was not a significant<br />
different based a 2-Sample T-Test at the 95 % confidence level.<br />
WER(%)<br />
70<br />
60<br />
50<br />
40<br />
30<br />
20<br />
10<br />
0<br />
IHM MDM SDM IHM MDM SDM IHM MDM SDM<br />
Conference Lecture Coffee Break<br />
AMI 25.7 45.6<br />
IBM 33.4 51 53.8<br />
SRI/ICSI 25.7 40.6 46.7 30.7 49.8 55.2 31.2 48.4 54.7<br />
UKA 36.7 58.4<br />
AMI<br />
IBM<br />
SRI/ICSI<br />
UKA<br />
Figure 2. WERs for primary STT systems across test sets and audio input conditions.<br />
Overlap Factor 4 and less included in distant microphone conditions. 1<br />
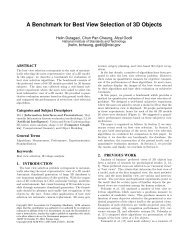
Figure 3 plots the historical error rates for the MDM and IHM conditions in both<br />
domains. For the confmtg data, the MDM error rate was 12 % lower than the same<br />
condition for ’06, but the IHM error rate was 6% higher. For the lectmtg data, the<br />
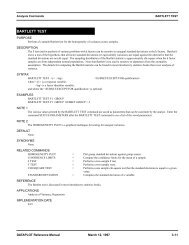
MDM error rates dropped 7 % relative while the IHM error rate had no change. Figure<br />
4 sets the confmtg ’07 results in the context of previous <strong>NIST</strong> STT evaluations.<br />
As evident from the graph, the meeting domain continues to be the most difficult actively<br />
researched domain for STT systems.<br />
1<br />
All of SRI/ICSI’s submissions were late accept their submissions for the IHM conditions
60<br />
WER (%)<br />
50<br />
40<br />
30<br />
20<br />
10<br />
0<br />
MDM IHM MDM IHM<br />
Conference Room<br />
Lecture Room<br />
RT-04S 53.6 32.7<br />
RT-05S 38.1 25.9 46.1 28.1<br />
RT-06 46.3 24.2 53.4 31<br />
RT-07 40.6 25.7 49.8 30.7<br />
Figure 3. WERs for the best STT systems from RT-04S through RT-06S. MDM<br />
results are for segment groups with OV≤4 while the IHM results include all speech.<br />
100%<br />
Switchboard<br />
Conversational Speech<br />
(Non-English)<br />
<strong>Meeting</strong> Speech<br />
Read<br />
Speech<br />
Air Travel<br />
Planning Kiosk<br />
Speech<br />
Broadcast<br />
Speech<br />
Varied<br />
Microphones<br />
Switchboard II<br />
Switchboard Cellular<br />
(Non-English)<br />
CTS Arabic (UL)<br />
<strong>Meeting</strong> – SDM OV4<br />
<strong>Meeting</strong> – MDM OV4<br />
CTS Mandarin (UL)0<br />
<strong>Meeting</strong> - IHM<br />
News Mandarin 10X<br />
News Arabic 10X<br />
20k<br />
CTS Fisher (UL)<br />
News English 1X<br />
WER(%)<br />
10%<br />
1k<br />
5k<br />
Noisy<br />
News English unlimited<br />
News English 10X<br />
4%<br />
2%<br />
Range of Human Error In <strong>Transcription</strong><br />
1%<br />
1988 1989 1990 1991 1992 1993 1994 1995 1996 1997 1998 1999 2000 2001 2002 2003 2004 2005 2006 <strong>2007</strong> 2008 2009 2010 2011<br />
Figure 4. STT Benchmark Test History 1988-<strong>2007</strong>
3.3 Diarization “Who Spoke When” (SPKR) Results<br />
Eight sites participated in the SPKR task: AMDA, I2R, IBM, ICSI, LIA, LIMSI,<br />
NTU, and UPC. I2R and NTU collaborated to build a single system. All participants<br />
except IBM submitted confmtg systems. IBM, LIA, and LIMSI submitted lectmtg<br />
systems. Figure 5 contains the results of all primary systems. <strong>The</strong> lowest MDM<br />
DERs were 8.5%, and 25.8% for the confmtg and lectmtg test sets respectively.<br />
<strong>The</strong> lectmtg scores for most systems at the same performance level as the previous<br />
year’s, however, the 8.5% DER achieved by ICSI is very low. It is half of the closest<br />
system and a roughly a third of the rest of the systems. Further, Figure 5 the contains<br />
lowest error rate for each of the previous evaluations and shows the result was 76%<br />
relative lower than last year’s best system.<br />
DER(%)<br />
35<br />
30<br />
25<br />
20<br />
15<br />
10<br />
5<br />
0<br />
MDM SDM MDM SDM<br />
Conference<br />
AMIDA 22.03 28.32<br />
I2R/NTU 15.32<br />
Lec ture<br />
IBM 31.22 31.06<br />
ICSI 8.51 21.74<br />
LIA 24.16 24.49 31.23 29.48<br />
LIMSI 26.07 29.52 25.81 25.6<br />
UPC 22.7 27.72<br />
Figure 5. DERs for the primary SPKR systems across test sets and audio input<br />
conditions.<br />
Extensive discussions of the ICSI confmtg results occurred during the workshop.<br />
Table 3 compares the performance of the primary confmtg systems for differentiating<br />
speech vs. non-speech and for the system’s ability to cluster speakers.<br />
Table 3. Primary SPKR system performance comparing DET to speech activity<br />
detection and speaker count prediction<br />
Site ID SPKR DER SAD DER Avg. Nbr. Sys. Mtgs. With
Speakers Correct Nbr. Speakers<br />
ICSI 8.51 3.33 4.5 87.5%<br />
I2R/NTU 15.32 8.65 4.4 75.0%<br />
UPC 22.70 5.39 3.9 25.0%<br />
LIA 24.16 3.69 4.9 12.5%<br />
LIMSI 26.07 3.23 12.3 12.5%<br />
AMIDA 22.03 6.73 7.1 0%<br />
To evaluate speech/non-speech detection, we scored each SPKR submission as if<br />
it were a Speech Activity Detection (SAD) system as defined for the RT-06 SAD<br />
evaluation methodology [10]. To evaluate the system’s ability cluster speakers, we<br />
computed both the average number of system speakers per meeting and the number of<br />
meetings with the correct number of speakers. <strong>The</strong> ICSI system had the second lowest<br />
SAD DER score of 3.33% with LIMSI having the lowest at 3.23%. <strong>The</strong> actual average<br />
number of speakers for the confmtg test set is 4.4. Six of the eight meetings had<br />
4 speakers, one meeting had 5 speakers, and one meeting had 6 speakers. ICSI had<br />
nearly the right average and they correctly predicted the number of speakers in 7 of<br />
the 8 meetings. <strong>The</strong> combination of good SAD performance and accurate clustering<br />
led to ICSI’s low overall SPKR DER performance. Other sites did well at one of the<br />
aspects, but not both.<br />
<strong>The</strong> selection protocol for confmtg test sets will change in future evaluations. <strong>The</strong><br />
lack of variability in the number of speakers per test excerpt is not adequately testing<br />
the SPKR systems. Next year there will be more excerpts to improve the statistical reliability<br />
of the performance estimates. Additionally, next year there will be a wider<br />
variety in the number of speakers per excerpt to test the system’s ability to predict the<br />
correct number of speakers over a broader range of meeting participants.<br />
Figure 5 contains the historical lowest error rates for each year when scored against<br />
forced alignment mediated references. As mentioned earlier, the SPKR error rates for<br />
the confmtg data dropped. <strong>The</strong> SPKR DER for the lectmtg data remained flat when<br />
comparing this year’s LIMSI system to last year’s LIMSI system. However, the<br />
LIMSI SAD DER was lower in ’07.
Diarization Error (%)<br />
30.0<br />
25.0<br />
20.0<br />
15.0<br />
10.0<br />
5.0<br />
0.0<br />
RT06<br />
Conference<br />
RT07<br />
RT06<br />
(ICISI)<br />
RT06<br />
(LIMSI)<br />
Lecture<br />
RT07<br />
(LIMSI)<br />
MDM 16.6 8.5 14.0 25.6 25.8<br />
MDM(asSAD) 6.3 3.3 7.3 14.5 10.0<br />
Figure 6. DERs for the best MDM SPKR systems from RT-06 and RT-07 scored<br />
against forced alignment mediated references.<br />
Only LIA submitted SPKR results for the Coffee Break data. <strong>The</strong> DER for their<br />
primary, MDM audio condition system on cbreak data was 25.5% compared to 31.2%<br />
for the same system on the lectmtg data. <strong>The</strong> SAD scores for the LIA system were<br />
7.38 and 9.34 for the cbreak and lectmtg data respectively. While the error rates for<br />
the cbreak data are lower, the average SPKR DER by meeting excerpt are not statistically<br />
different at the 95% confidence level using a 2-sample T-Test.<br />
3.4 Speaker Attributed Speech-To-Text (SASTT) Results<br />
Five sites participated in the Speaker Attributed Speech-To-Text task: AMI, IBM,<br />
LIMSI, SRI/ICSI, and UKA. Figure 6 contains the results of all primary systems on<br />
the cbreak, confmtg, and lectmtg data for segment groups with OV≤3.<br />
SRI/ICSI had the lowest SWER (OV≤3) of 40.3 % on the confmtg data which was<br />
statistically different, according to the MAPSSWE test, than AMI’s 54.2 %. <strong>The</strong> coverage<br />
of scoreable meetings for segment groups with OV≤3 was 84.5 %.<br />
IBM had the lowest SWER (OV≤3) of 59.3 % on the lectmtg data which was not statistically<br />
different, according to the MAPSSWE test, than SRI/ICSI’s 60.0 %. <strong>The</strong><br />
rest of the inter-system comparisons on the lecture data were statistically different according<br />
to the MAPSSWE test. <strong>The</strong> coverage of scoreable meetings for segment<br />
groups with OV≤3 was 97 %.<br />
AMI was the only participant to run their system on the cbreak data and achieved<br />
a 68.4 % SWER (OV≤3) .<br />
<strong>The</strong> novel aspect of the SASTT task is to combine speaker diarization and STT<br />
systems. Figure 6 presents two data points in order to separate the errors due to diarization.<br />
<strong>The</strong> SWER-SpSub bar is the SWER minus the Speaker Substitution rate. <strong>The</strong>
distance between the height of SWER and SWER-SpSub bars indicates the affect of<br />
speaker diarization errors on system performance. <strong>The</strong> second data point is<br />
DER(sastt) which is the diarization error using inferred speaker segment boundaries<br />
from the SASTT system output 2 . DER (sastt) is not equivalent to the DER for SPKR<br />
systems, but it does correlate with Speaker Substitution errors. <strong>The</strong> notable exception<br />
is the LIMSI system where their SpSub errors were relatively low given their high<br />
DER (sastt) : this is because a large component of the LIMSI’s diarization system DER is<br />
speech activity detection rather than speaker identification.<br />
Error Rate<br />
80.0<br />
70.0<br />
60.0<br />
50.0<br />
40.0<br />
30.0<br />
20.0<br />
10.0<br />
0.0<br />
AMI<br />
SRI/ICSI<br />
(late)<br />
AMI<br />
Figure 7. RT-07 Primary SASTT system performance on the MDM condition<br />
scored without speaker substitutions and as diarization systems.<br />
This initial evaluation of SASTT systems was a success in that developers built<br />
combined systems and the evaluation infrastructure was able to evaluate their performance.<br />
Unfortunately, none of the fielded SASTT systems for the <strong>2007</strong> evaluation<br />
jointly optimized their STT and SPKR systems, so one would expect future research<br />
to include joint optimization to improve error rates.<br />
IBM<br />
LIMSI<br />
(late)<br />
SRI/ICSI<br />
(late)<br />
AMI<br />
Conference Lecture Room CBreak<br />
SWER 54.2 40.3 67.7 59.3 62.4 60.0 68.4<br />
SWER-SpSub 43.5 37.5 52.0 49.7 57.0 49.8 50.7<br />
DER(sastt) 39.2 18.6 51.5 43.8 39.8 31.6 48.3<br />
4.0 Conclusions and Future <strong>Evaluation</strong>s<br />
<strong>The</strong> 5 th RT evaluation occurred during the 1 st half of <strong>2007</strong>. In order to promote multimodal<br />
research, the RT and CLEAR evaluations shared development/evaluation corpora<br />
and collocated their evaluation workshops.<br />
2<br />
<strong>The</strong> inferred boundaries were generated automatically by converting each recognized word to<br />
a speaker segment, then smoothing the segments with the 0.3 second smoothing parameter.
<strong>The</strong> evaluation included three evaluation tasks: Speech-To-Text, Speaker Diarization,<br />
and Speaker Attributed Speech-To-Text.<br />
<strong>The</strong> WERs for the STT task continue to be higher than the WERs for previous<br />
Conversational Telephone Speech evaluations by 25 % relative.<br />
<strong>The</strong> ICSI SPKR team achieved 8.5 % DER on the confmtg test set which was 76%<br />
lower than last year’s best system. <strong>The</strong> ICSI system both detected speech accurately<br />
and clustered speakers accurately.<br />
This was the first RT evaluation to include the SASTT task. Four out of five STT<br />
sites submitted systems for the SASTT tasks. <strong>The</strong> lowest speaker attributed word error<br />
rates for segment groups with OV≤4 for the MDM condition were 40.3 %, 59.3 %,<br />
and 68.4 % for the confmtg, lectmtg, and cbreak test sets respectively with relative increases<br />
in error of 7.7 %, 17.6 %, and 41.6 % respectively over comparable STT systems.<br />
<strong>The</strong> <strong>Rich</strong> <strong>Transcription</strong> 2008 <strong>Evaluation</strong> will occur during the Fall of 2008. <strong>The</strong><br />
SASTT task will likely remain as a task for the next evaluation since the implementation<br />
of the evaluation task was successful and there is enthusiasm within the community<br />
to continue to work on the task. <strong>The</strong> selection strategy for the confmtg test data<br />
will change for the next evaluation to include a wider variety of speaker speech durations<br />
and the number of active speakers within each excerpt.<br />
5.0 Acknowledgements<br />
<strong>NIST</strong> would like to thank AIT, EDI, CMU, IBM, ITC, VT, UKA, TNO, and UPC for<br />
donating meeting recordings to the evaluation. Special thanks go to CMU and LDC<br />
for preparing reference transcriptions and annotations.<br />
6.0 Disclaimer<br />
<strong>The</strong>se tests are designed for local implementation by each participant. <strong>The</strong> reported<br />
results are not to be construed, or represented, as endorsements of any participant’s<br />
system, or as official findings on the part of <strong>NIST</strong> or the U. S. Government.<br />
Certain commercial products may be identified in order to adequately specify or describe<br />
the subject matter of this work. In no case does such identification imply recommendation<br />
or endorsement by <strong>NIST</strong>, nor does it imply that the products identified<br />
are necessarily the best available for the purpose.<br />
References<br />
1. Fiscus et al., “Results of the Fall 2004 STT and MDE <strong>Evaluation</strong>”, RT-04F <strong>Evaluation</strong><br />
Workshop Proceedings, November 7-10, 2004.<br />
2. Garofolo et al., “<strong>The</strong> <strong>Rich</strong> <strong>Transcription</strong> 2004 Spring <strong>Meeting</strong> <strong>Recognition</strong> <strong>Evaluation</strong>”,<br />
ICASSP 2004 <strong>Meeting</strong> <strong>Recognition</strong> Workshop, May 17, 2004
3. <strong>The</strong> <strong>2007</strong> (RT-07) <strong>Rich</strong> <strong>Transcription</strong> <strong>Meeting</strong> <strong>Recognition</strong> <strong>Evaluation</strong> Plan,<br />
http://www.nist.gov/speech/tests/rt/rt<strong>2007</strong><br />
4. LDC <strong>Meeting</strong> Recording <strong>Transcription</strong>,<br />
http://www.ldc.upenn.edu/Projects/<strong>Transcription</strong>/<strong>NIST</strong>Meet<br />
5. SCTK toolkit, http://www.nist.gov/speech/tools/index.htm<br />
6. Fiscus et al., “<strong>The</strong> <strong>Rich</strong> <strong>Transcription</strong> 2005 Spring <strong>Meeting</strong> <strong>Recognition</strong> <strong>Evaluation</strong>”,<br />
<strong>The</strong> joint proceedings <strong>Rich</strong> <strong>Transcription</strong> Workshop and the 2nd Joint Workshop<br />
on Multimodal Interaction and Related Machine Learning Algorithms<br />
(MLMI), 11-13 July 2005<br />
7. http://www.clear-evaluation.org/<br />
8. Fiscus et. al., “Multiple Dimension Levenshtein Distance Calculations for Evaluating<br />
Automatic Speech <strong>Recognition</strong> Systems During Simultaneous Speech”, LREC<br />
2006: Sixth International Conference on Language Resources and <strong>Evaluation</strong><br />
9. http://isl.ira.uka.de/clear06/downloads/ClearEval_Protocol_v5.pdf<br />
10. Fiscus, J., Ajot, J., Michel, M., Garofolo, J., “<strong>The</strong> <strong>Rich</strong> <strong>Transcription</strong> 2006 Spring<br />
<strong>Meeting</strong> <strong>Recognition</strong> <strong>Evaluation</strong>”, <strong>The</strong> joint proceedings <strong>Rich</strong> <strong>Transcription</strong> Workshop<br />
and the 3 rd Joint Workshop on Multimodal Interaction and Related Machine<br />
Learning Algorithms (MLMI), May 2006, LNCS 4299<br />
11. Burger, S., “<strong>The</strong> CHIL RT07 <strong>Evaluation</strong> Data”, <strong>The</strong> Joint Proceedings of the 2006<br />
CLEAR and RT <strong>Evaluation</strong>s, May <strong>2007</strong><br />
12. Lammie Glenn, M., Strassel, S., Shared Linguistic Resources for the <strong>Meeting</strong><br />
Domain”, <strong>The</strong> Joint Proceedings of the 2006 CLEAR and RT <strong>Evaluation</strong>s, May<br />
<strong>2007</strong><br />
13. Wooters, C., Fung, J., Peskin, B., and Anguera, X., "Towards Robust Speaker<br />
Segmentation: <strong>The</strong> ICSI-SRI Fall 2004 Diarization System", RT-04F Workshop,<br />
Nov. 2004<br />
14. Stiefelhagen, R., Bernardin, K., Bowers, R., Garofolo, J., Mostefa, D, Soundararajan,<br />
P., “<strong>The</strong> CLEAR 2006 <strong>Evaluation</strong>, Proceedings of the first International<br />
CLEAR <strong>Evaluation</strong> Workshop”, CLEAR 2006, Springer Lecture Notes in Computer<br />
Science, No. 4122., pp 1-45.<br />
15.StainStiefelhagen, R., Bowers, R., Rose, R., “Results of the CLEAR <strong>2007</strong> <strong>Evaluation</strong>”,<br />
<strong>The</strong> Joint Proceedings of the 2006 CLEAR and RT <strong>Evaluation</strong>s, May <strong>2007</strong>.<br />
16.http://www.nist.gov/dads/HTML/HungarianAlgorithm.html<br />
17.http://www.nist.gov/speech/tests/sigtests/mapsswe.htm<br />
18.Stanford, V.: <strong>The</strong> <strong>NIST</strong> Mark-III microphone array - infrastructure, reference data,<br />
and metrics. In: Proceedings International Workshop on Microphone Array<br />
Systems - <strong>The</strong>ory and Practice, Pommersfelden, Germany (2003).