CP PLOT
CP PLOT
CP PLOT

You also want an ePaper? Increase the reach of your titles
YUMPU automatically turns print PDFs into web optimized ePapers that Google loves.
Graphics Commands<br />
<strong>CP</strong> <strong>PLOT</strong><br />
<strong>CP</strong> <strong>PLOT</strong><br />
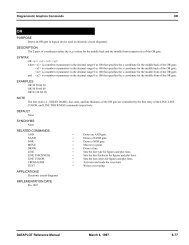
PURPOSE<br />
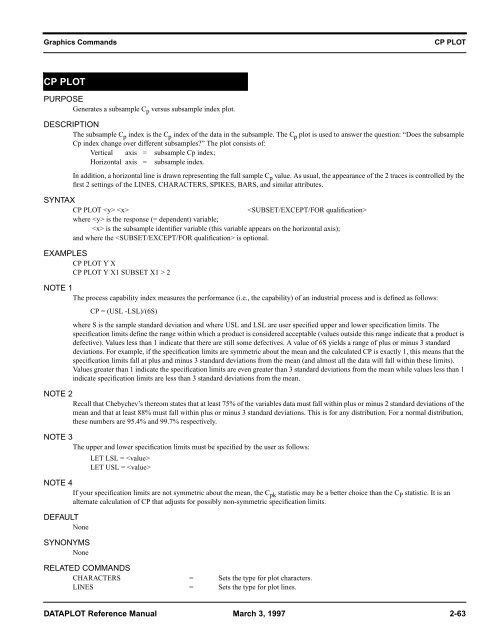
Generates a subsample C p versus subsample index plot.<br />
DESCRIPTION<br />
The subsample C p index is the C p index of the data in the subsample. The C p plot is used to answer the question: “Does the subsample<br />
Cp index change over different subsamples?” The plot consists of:<br />
Vertical axis = subsample Cp index;<br />
Horizontal axis = subsample index.<br />
In addition, a horizontal line is drawn representing the full sample C p value. As usual, the appearance of the 2 traces is controlled by the<br />
first 2 settings of the LINES, CHARACTERS, SPIKES, BARS, and similar attributes.<br />
SYNTAX<br />
<strong>CP</strong> <strong>PLOT</strong> <br />
<br />
where is the response (= dependent) variable;<br />
is the subsample identifier variable (this variable appears on the horizontal axis);<br />
and where the is optional.<br />
EXAMPLES<br />
<strong>CP</strong> <strong>PLOT</strong> Y X<br />
<strong>CP</strong> <strong>PLOT</strong> Y X1 SUBSET X1 > 2<br />
NOTE 1<br />
The process capability index measures the performance (i.e., the capability) of an industrial process and is defined as follows:<br />
<strong>CP</strong> = (USL -LSL)/(6S)<br />
where S is the sample standard deviation and where USL and LSL are user specified upper and lower specification limits. The<br />
specification limits define the range within which a product is considered acceptable (values outside this range indicate that a product is<br />
defective). Values less than 1 indicate that there are still some defectives. A value of 6S yields a range of plus or minus 3 standard<br />
deviations. For example, if the specification limits are symmetric about the mean and the calculated <strong>CP</strong> is exactly 1, this means that the<br />
specification limits fall at plus and minus 3 standard deviations from the mean (and almost all the data will fall within these limits).<br />
Values greater than 1 indicate the specification limits are even greater than 3 standard deviations from the mean while values less than 1<br />
indicate specification limits are less than 3 standard deviations from the mean.<br />
NOTE 2<br />
Recall that Chebychev’s thereom states that at least 75% of the variables data must fall within plus or minus 2 standard deviations of the<br />
mean and that at least 88% must fall within plus or minus 3 standard deviations. This is for any distribution. For a normal distribution,<br />
these numbers are 95.4% and 99.7% respectively.<br />
NOTE 3<br />
The upper and lower specification limits must be specified by the user as follows:<br />
LET LSL = <br />
LET USL = <br />
NOTE 4<br />
If your specification limits are not symmetric about the mean, the C pk statistic may be a better choice than the C P statistic. It is an<br />
alternate calculation of <strong>CP</strong> that adjusts for possibly non-symmetric specification limits.<br />
DEFAULT<br />
None<br />
SYNONYMS<br />
None<br />
RELATED COMMANDS<br />
CHARACTERS = Sets the type for plot characters.<br />
LINES = Sets the type for plot lines.<br />
DATA<strong>PLOT</strong> Reference Manual March 3, 1997 2-63
<strong>CP</strong> <strong>PLOT</strong><br />
Graphics Commands<br />
CAPABILITY ANALYSIS = Generate a capability analysis.<br />
<strong>CP</strong> = Compute the <strong>CP</strong> statistic.<br />
<strong>CP</strong>K <strong>PLOT</strong> = Generates a C pk plot.<br />
EXPECTED LOSS <strong>PLOT</strong> = Generates an expected loss plot.<br />
PERCENT DEFECTIVE <strong>PLOT</strong> = Generates a percent defective plot.<br />
BOX <strong>PLOT</strong> = Generates a box plot.<br />
CONTROL CHART = Generate various types of control charts.<br />
<strong>PLOT</strong> = Generates a data or function plot.<br />
APPLICATIONS<br />
Quality Control<br />
IMPLEMENTATION DATE<br />
93/10<br />
PROGRAM<br />
SKIP 25<br />
READ GEAR.DAT DIAMETER BATCH<br />
TITLE CASE ASIS<br />
LABEL CASE ASIS<br />
TITLE Gear Diameter Analysis<br />
Y1LABEL <strong>CP</strong>; X1LABEL Batch<br />
LEGEND 1 Process Capability<br />
LEGEND 2 <strong>CP</strong> Plot<br />
XTIC OFFSET 0.5 0.5<br />
CHARACTER X BLANK<br />
LINE BLANK SOLID<br />
LET LSL = 0.98<br />
LET USL = 1.02<br />
<strong>CP</strong> <strong>PLOT</strong> Diameter Batch<br />
2<br />
Gear Diameter Analysis<br />
1.5<br />
PROCESS CAPABILITY<br />
<strong>CP</strong> <strong>PLOT</strong><br />
X<br />
X<br />
X<br />
X<br />
X<br />
X<br />
X<br />
<strong>CP</strong><br />
1<br />
X<br />
X<br />
X<br />
0.5<br />
0<br />
1 2 3 4 5 6 7 8 9 10<br />
Batch<br />
2-64 March 3, 1997 DATA<strong>PLOT</strong> Reference Manual