DIELECTRIC DISPERSION IN 1,2-DIAMINOPROPANE ...
DIELECTRIC DISPERSION IN 1,2-DIAMINOPROPANE ...
DIELECTRIC DISPERSION IN 1,2-DIAMINOPROPANE ...

Create successful ePaper yourself
Turn your PDF publications into a flip-book with our unique Google optimized e-Paper software.
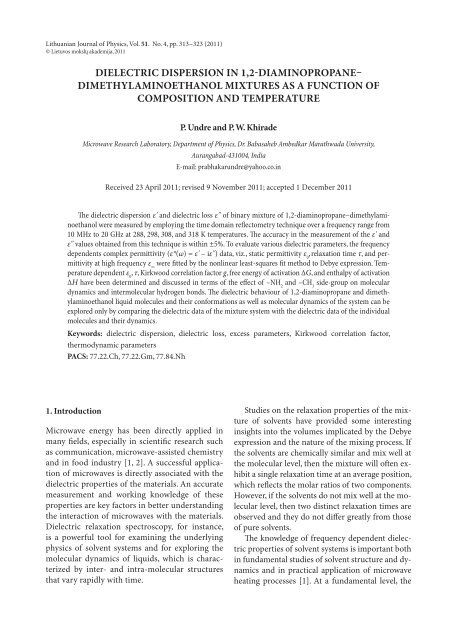
Lithuanian Journal of Physics, Vol. 51. No. 4, pp. 313–323 (2011)<br />
© lietuvos mokslų akademija, 2011<br />
<strong>DIELECTRIC</strong> <strong>DISPERSION</strong> <strong>IN</strong> 1,2-DIAM<strong>IN</strong>OPROPANE–<br />
DIMETHYLAM<strong>IN</strong>OETHANOL MIXTURES AS A FUNCTION OF<br />
COMPOSITION AND TEMPERATURE<br />
P. Undre and P. W. Khirade<br />
Microwave Research Laboratory, Department of Physics, Dr. Babasaheb Ambedkar Marathwada University,<br />
Aurangabad-431004, India<br />
E-mail: prabhakarundre@yahoo.co.in<br />
Received 23 April 2011; revised 9 November 2011; accepted 1 December 2011<br />
The dielectric dispersion ε' and dielectric loss ε" of binary mixture of 1,2-diaminopropane–dimethylaminoethanol<br />
were measured by employing the time domain reflectometry technique over a frequency range from<br />
10 MHz to 20 GHz at 288, 298, 308, and 318 K temperatures. The accuracy in the measurement of the ε' and<br />
ε" values obtained from this technique is within ±5%. To evaluate various dielectric parameters, the frequency<br />
dependents complex permittivity (ε*(ω) = ε' – iε") data, viz., static permittivity ε 0<br />
, relaxation time τ, and permittivity<br />
at high frequency ε ∞<br />
were fitted by the nonlinear least-squares fit method to Debye expression. Temperature<br />
dependent ε 0<br />
, τ, Kirkwood correlation factor g, free energy of activation ΔG, and enthalpy of activation<br />
ΔH have been determined and discussed in terms of the effect of –NH 2<br />
and –CH 3<br />
side-group on molecular<br />
dynamics and intermolecular hydrogen bonds. The dielectric behaviour of 1,2-diaminopropane and dimethylaminoethanol<br />
liquid molecules and their conformations as well as molecular dynamics of the system can be<br />
explored only by comparing the dielectric data of the mixture system with the dielectric data of the individual<br />
molecules and their dynamics.<br />
Keywords: dielectric dispersion, dielectric loss, excess parameters, Kirkwood correlation factor,<br />
thermodynamic parameters<br />
PACS: 77.22.Ch, 77.22.Gm, 77.84.Nh<br />
1. Introduction<br />
Microwave energy has been directly applied in<br />
many fields, especially in scientific research such<br />
as communication, microwave-assisted chemistry<br />
and in food industry [1, 2]. A successful application<br />
of microwaves is directly associated with the<br />
dielectric properties of the materials. An accurate<br />
measurement and working knowledge of these<br />
properties are key factors in better understanding<br />
the interaction of microwaves with the materials.<br />
Dielectric relaxation spectroscopy, for instance,<br />
is a powerful tool for examining the underlying<br />
physics of solvent systems and for exploring the<br />
molecular dynamics of liquids, which is characterized<br />
by inter- and intra-molecular structures<br />
that vary rapidly with time.<br />
Studies on the relaxation properties of the mixture<br />
of solvents have provided some interesting<br />
insights into the volumes implicated by the Debye<br />
expression and the nature of the mixing process. If<br />
the solvents are chemically similar and mix well at<br />
the molecular level, then the mixture will often exhibit<br />
a single relaxation time at an average position,<br />
which reflects the molar ratios of two components.<br />
However, if the solvents do not mix well at the molecular<br />
level, then two distinct relaxation times are<br />
observed and they do not differ greatly from those<br />
of pure solvents.<br />
The knowledge of frequency dependent dielectric<br />
properties of solvent systems is important both<br />
in fundamental studies of solvent structure and dynamics<br />
and in practical application of microwave<br />
heating processes [1]. At a fundamental level, the
314<br />
P. Undre and P. W. Khirade / Lith. J. Phys. 51, 313–323 (2011)<br />
frequency dependent dielectric behaviour of solvent<br />
mixtures provides information on molecular<br />
interactions and mechanism of molecular processes.<br />
The dielectric relaxation behaviour of mixtures<br />
of polar molecules under varying conditions<br />
of compositions is very important as it helps in obtaining<br />
information about relaxation processes in<br />
mixtures.<br />
Becker et al. [3] carried out a systematic study<br />
of dielectric relaxation of monohydric alcohol with<br />
dihydric alcohols (diols) solutions at 293 K over<br />
the frequency range of 5 MHz to 72 GHz using<br />
the lumped circuit, coaxial and waveguide method.<br />
The principal component, which is related to the<br />
dynamics of self- and/or hetro-association, is discussed<br />
with respect to steric conditions. In mixtures<br />
of monohydric (1-butanol) with longer chain 1,2-<br />
diols, the principal relaxation time passes through a<br />
minimum on increasing the dihydroxy content. In<br />
mixtures of tert-butanol (which has a weaker selfassociation<br />
tendency) with longer chain 1,n-diols,<br />
on the other hand, it passes through a maximum.<br />
With regard to the principal relaxation strength,<br />
longer chain 1,2-diols tend to resemble monohydric<br />
alcohols of full diol chain length while 1,n-diol<br />
tends to resemble monohydric alcohol of half the<br />
diol chain length.<br />
Sengwa et al. [4] studied the dielectric relaxation<br />
in propylene glycol–poly propylene glycol mixtures<br />
over three concentrations in the frequency range<br />
10 MHz to 4 GHz at 298 K using Time Domain<br />
Reflectometry (TDR). The effective Dielectric relaxation<br />
is shown to depend exponentially on the<br />
number density of dipoles or molecules. Puranik<br />
et al. [5] studied the dielectric properties of ethanol<br />
and ethylene glycol using TDR techniques in<br />
the frequency range of 10 MHz to 10 GHz over the<br />
temperature range 243–313 K. The activation energies<br />
of both systems are compared.<br />
Hanna et al. [6] carried out a dielectric relaxation<br />
study of monohydroxy–dihydroxy alcohols binary<br />
and monohydroxyl–diol-diol ternary mixtures at<br />
293 K over the frequency range from 10 MHz to<br />
10 GHz using the TDR technique. An apparent dipole<br />
moment term and the effective relaxation time<br />
of the main dispersion region are given as a function<br />
of the number density of dipoles.<br />
To compare the influence of different polar<br />
groups in the relaxation mechanism, we have considered<br />
it interesting to perform an analogous treatment<br />
such as that carried out for binary mixture<br />
of primary alcohols-diol, dio-diol. For this reason,<br />
dielectric dispersion study in 1,2-diaminopropane<br />
(DP) with dimethylaminoethanol (DMAE) mixtures<br />
over the frequency range of 10 MHz to 20 GHz<br />
has been carried out using pico-second TDR. The<br />
binary system of DP–DMAE has been selected to<br />
understand the effect of amino and methyl sidegroup<br />
on the dielectric parameters, where the significance<br />
is based upon the tetrahedric nature of the<br />
–NH 2<br />
group. This extreme is of decisive relevance<br />
for the process of chemical synthesis, the behaviour<br />
of amino acids and proteins in biochemical models<br />
related to biogenic amines which contribute to the<br />
mechanism of electrical conduction in the nervous<br />
system, especially in nurotransmission.<br />
This binary system of DP and DMAE is of interest<br />
because of two functional groups in both<br />
components with one common –NH 2<br />
group. The<br />
four sites available for H-bonding in a DP molecule<br />
promote a set of transient cross links between<br />
neighbouring molecules. In such a case, relevant<br />
transient structures such as branched associated<br />
species and/or chains are formed. In addition, many<br />
conformations can be generated for each molecule<br />
by the rotation of CH 2<br />
NH 2<br />
group around the C–C<br />
axis with respect to H 2<br />
N–CH–CH 3<br />
group. DMAE<br />
is a hydroxylamine, tertiary amine, versatile and<br />
polyfunctional molecule that combines the characteristics<br />
of amines and alcohols and is capable of<br />
undergoing reactions typical of both alcohols and<br />
amines. Competition for H-bond site governs the<br />
nature of short-range order around molecules of<br />
both components of the solvent mixture. For the<br />
hydroxyamines, this is the dominant feature. The<br />
molecules of DMAE exist in intermolecular hydrogen<br />
bonded form with the rotation of CH 2<br />
N–<br />
(CH 3<br />
) 2<br />
group around C–O bond in dynamic equilibrium.<br />
The dielectric study of the binary system<br />
of these DP and DMAE molecules will give information<br />
about interaction between OH–NH 2<br />
and<br />
NH 2<br />
–NH 2<br />
group thereby forming different types of<br />
structures.<br />
Due to good solubility of DP in DMAE, these<br />
molecules may form a variety of clusters due to inter-<br />
and intra-molecular hydrogen bonds, depending<br />
on the molecular geometry of individual molecules,<br />
and hence, it is interesting to investigate the<br />
variation in the shapes of the dielectric relaxation<br />
curves of the DP–DMAE system with concentration.
P. Undre and P. W. Khirade / Lith. J. Phys. 51, 313–323 (2011) 315<br />
The concentration dependence of the shape of the<br />
relaxation curves and various dielectric parameters<br />
of the DP–DMAE mixture are compared with those<br />
of the monomeric, dimeric, trimeric and polymeric<br />
molecules in the DP–DMAE solution, to obtain<br />
some insight into the possible relaxation behaviour<br />
of the DP and DMAE molecules in their mixtures.<br />
The relaxation curves are treated assuming one<br />
relaxation process, and their shapes are discussed<br />
based on the cooperativity of DP and DMAE molecules.<br />
The dipole moment value of DP molecules is<br />
slightly larger than the dipole moment values of<br />
DMAE in the gas phase. The values of static permittivity<br />
ε 0<br />
, relaxation time τ, activation enthalpy<br />
ΔH, and Gibbs free energy of activation ΔG for DP<br />
are larger than those for DMAE. The difference in<br />
permittivity values of pure DP and DMAE are due<br />
to difference pattern of alignment of dipoles in liquid.<br />
2. Experimental set-up<br />
2.1. Chemicals<br />
The chemicals used in the present work, 1,2-diaminopropane<br />
and dimethylaminoethanol, were<br />
of spectroscopic grade and were obtained from<br />
ACROS ORGANICS, New Jersey, USA, and Kemphasol,<br />
Bombay, respectively, commercially with<br />
99% purity and were used without further purification.<br />
The solutions were prepared at different<br />
volume percentage of DP in DMAE in the step of<br />
10% at room temperature. The concentrations were<br />
prepared for 5 ml solution at room temperature assuming<br />
ideal mixing behaviour, within 0.02% error<br />
limit.<br />
2.2. TDR set-up and data acquisition<br />
The Hewlett Packard HP54750A sampling oscilloscope<br />
with HP54754A TDR plug-in module has<br />
been used. After observing TDR response for a<br />
sample under study, the time window was kept to<br />
5 ns. By observing TDR response for a sample under<br />
study, the SMA sample cell with 1.35 mm effective<br />
pin length was used. The sample cell holds the liquid<br />
under consideration. The physical dimensions<br />
of the cell are very important, so one must be careful<br />
while designing the sample cell. The impedance<br />
of the cell should be matched with the coaxial transmission<br />
line to which the cell is connected. If there<br />
is impedance mismatch, then unwanted reflections<br />
may disturb the wave thereby causing some errors<br />
in the measurements. The proper design of the cell<br />
includes the inner conductor and outer conductor<br />
diameters. The length of the inner conductor is<br />
called the ‘pin length’ of the cell and is a very important<br />
factor in analysis. The sample length must be<br />
enough to avoid unwanted reflections.<br />
In the total reflection method, the sample length<br />
must be long enough to produce an adequate difference<br />
signal but short enough to keep less complication<br />
of resonance effects at frequencies above<br />
the range of interest.<br />
The characteristic impedance of a coaxial line is<br />
given by<br />
(1)<br />
This impedance for our transmission line is frequently<br />
50 Ω. Here, a is the diameter of inner conductor,<br />
b is the inner diameter of outer conductor,<br />
and ε is the relative permittivity of the dielectric between<br />
the conductors. Using Teflon and air and taking<br />
appropriate a, b, a cell can be designed to have<br />
a matching impedance of Z = 50 Ω (for air ε = 1<br />
and for Teflon ε = 2.2). The sample cell consists of<br />
standard military applications (SMA) coaxial connector<br />
with matched impedance with 3.5 mm inner<br />
diameter of outer conductor. The inner conductor<br />
of SMA connector itself is considered as ‘inner<br />
conductor’ and hex-nut is treated as an outer conductor.<br />
Since these SMA connectors have already<br />
been designed for precise 50 Ω impedance, a special<br />
design, when used with high frequency, is not<br />
required. The physical length of inner conductor<br />
can be changed. When the cell is filled with sample<br />
above the physical length of inner conductor, the<br />
fringing effect takes place [7, 8]. Due to the fringing<br />
field, the effective pin length [9] will not be equal to<br />
the physical pin length. The effective electrical pin<br />
length will be greater than the physical pin length.<br />
The accurate determination of the effective pin<br />
length d is very important for the accurate evaluation<br />
of dielectric parameters. It is found that for<br />
SMA type cell, the effective pin length [9] is greater<br />
than the actual physical length by 0.1–0.2 mm.
316<br />
P. Undre and P. W. Khirade / Lith. J. Phys. 51, 313–323 (2011)<br />
To reduce noise, the time dependent response<br />
curve was averaged for 64 times and then stored in<br />
TDR oscilloscope memory with 1024 points per waveform.<br />
First, the response waveform for an empty cell<br />
is acquired and stored in memory and then, secondly,<br />
the response waveform for a sample is acquired and<br />
stored in other memory. The empty cell waveform is<br />
used as a reference waveform. Both response waveforms<br />
are the reflected waveforms from the sample<br />
cell with the open termination transmission line.<br />
The data acquisition is carried out for 11 concentrations<br />
at 288, 298, 308, and 318 K. The temperature<br />
of a sample was maintained at a desired<br />
value, within accuracy limit of ±1 K, by circulating<br />
constant temperature water through heat insulating<br />
jacket surrounding the sample cell.<br />
At each time the response waveforms without a<br />
sample and with a sample were recorded. The time<br />
dependent response waveform without a sample is<br />
referred to as R 1<br />
(t) and with a sample as R x<br />
(t).<br />
2.3. Data analysis<br />
The time dependent data were processed to obtain<br />
complex reflection coefficient spectra ρ * (ω) over<br />
the frequency range from 10 MHz to 10 GHz using<br />
Fourier transformation as [10, 11]<br />
(2)<br />
where p(ω) and q(ω) are Fourier transformations of<br />
R 1<br />
(t) – R x<br />
(t) and R 1<br />
(t) + R x<br />
(t), respectively, c is the<br />
velocity of light, ω is angular frequency, d is effective<br />
pin length, and i = √-1.<br />
The complex permittivity spectra ε * (ω) [12] were<br />
obtained from reflection coefficient spectra ρ * (ω)<br />
by applying the bilinear calibration method [13].<br />
The complex permittivity spectra measured<br />
using TDR are fitted by the nonlinear least-squares<br />
fit method to the Havriliak–Negami expression<br />
[14] to obtain various dielectric parameters. The accuracy<br />
in the measurement of dielectric dispersion<br />
ε' and dielectric loss ε" values obtained from this<br />
technique is within ±5%.<br />
(3)<br />
where ε * (ω) is the complex permittivity at an angular<br />
frequency ω, ε ∞<br />
is the permittivity at high frequency,<br />
ε is the static permittivity, τ is the relaxation<br />
time of the system, α is the shape parameter<br />
0<br />
representing symmetrical distribution of relaxation<br />
time, and β is the shape parameter of an asymmetric<br />
relaxation curve.<br />
Equation (3) includes Cole–Cole (β = 1) [15],<br />
Davidson–Cole (α = 0) [16], and Debye (α = 0,<br />
β = 1) [17] relaxation models. The dielectric model<br />
for fitting dielectric parameters suitable for present<br />
system is the Debye dispersion model.<br />
3. Results and discussion<br />
Frequency dependence curves for the dielectric<br />
dispersion ε' and absorption ε" of DP–DMAE with<br />
varying volume fraction of DMAE at 298 K are depicted<br />
in Figs. 1 and 2, respectively. In the case of<br />
DP–DMAE mixtures, there is a considerable possibility<br />
of modifications in these homomolecular<br />
clusters due to molecular interactions between the<br />
DP and DMAE molecules. Apart from the complexities<br />
in the DP–DMAE mixtures, the observed<br />
dielectric dispersion behaviour is a simple Debyetype<br />
for all the concentrations studied, and this is<br />
also the case for the individual molecules.<br />
Both ε' (Fig. 1) and ε" (Fig. 2) increase with increasing<br />
volume percentage of DMAE in the binary<br />
mixture DP–DMAE at the low-frequency<br />
end and decrease at the high-frequency end. The<br />
frequency at which the loss factor is a maximum,<br />
Fig. 1. Frequency dependent dielectric dispersion ε'<br />
curves for 1,2-diaminopropane, dimethylaminoethanol<br />
and their mixtures at 298 K.
P. Undre and P. W. Khirade / Lith. J. Phys. 51, 313–323 (2011) 317<br />
f max<br />
(τ = 1/(2πf max<br />
)) shifts to higher values with decreasing<br />
the volume percentage of DMAE in the<br />
mixture, corresponding to their individual relaxation<br />
times, because the individual molecular values<br />
Fig. 2. Frequency dependent dielectric loss (absorption)<br />
ε" curves for 1,2- diaminopropane, dimethylaminoethanol<br />
and their mixtures at 298 K.<br />
are sufficiently different (i. e. 79.21 and 14.23 ps)<br />
to allow their resolution in practice. However, in<br />
a mixture of two associated liquids it seems that<br />
the individual principal relaxation processes of the<br />
components coalesce, and hence the mixture exhibits<br />
a single relaxation time. Earlier, Kumar et al.<br />
[18] observed Debye-type behaviour in amines<br />
(aliphatic/aromatic)–alcohol mixtures, despite<br />
large differences in the values of individual molecule<br />
relaxation times.<br />
The values of the dielectric parameters ε 0<br />
and<br />
τ obtained from Eq. (3) for DP, DMAE and DP–<br />
DMAE with the volume fraction of DMAE at four<br />
different temperatures are recorded in Table 1.<br />
From Table 1 it can be observed that static permittivity<br />
systematically increases with increase in volume<br />
fraction of DMAE in DP. The same type of change in<br />
permittivity values has been observed at four temperatures<br />
under study.<br />
The τ values gradually increase with increase in<br />
volume fraction of DMAE in DP. With increase in<br />
Table 1. Temperature dependent dielectric parameters for binary mixture of dimethylaminoethanol–1,2-diaminopropane.<br />
Number in parenthesis represents error, e. g. 13.06 (02) means 13.06 ± 0.02 X DMAE<br />
volume fraction of<br />
dimethylaminoethanol.<br />
288 K 298 K<br />
X DMAE<br />
ε 0<br />
τ, ps ε 0<br />
τ, ps<br />
0 13.06 (02) 15.12 (09) 12.54 (02) 14.23 (07)<br />
0.1 12.92 (26) 25.08 (89) 12.76 (24) 23.38 (40)<br />
0.2 12.90 (32) 28.63 (28) 12.44 (26) 27.48 (30)<br />
0.3 13.64 (36) 39.25 (50) 13.43 (29) 33.47 (07)<br />
0.4 13.23 (38) 46.74 (30) 13.01 (34) 40.49 (99)<br />
0.5 13.87 (45) 55.28 (30) 13.67 (39) 48.40 (80)<br />
0.6 13.77 (41) 69.47 (75) 13.57 (38) 57.47 (60)<br />
0.7 13.81 (47) 78.70 (70) 13.59 (42) 68.83 (50)<br />
0.8 13.56 (45) 85.20 (48) 13.29 (45) 72.60 (44)<br />
0.9 13.46 (54) 85.81 (45) 13.29 (71) 78.10 (60)<br />
1 13.84 (01) 93.58 (03) 13.68 (05) 79.21 (04)<br />
308 K 318 K<br />
ε 0<br />
τ, ps ε 0<br />
τ, ps<br />
0 11.86 (01) 13.50 (05) 10.75 (01) 11.72 (07)<br />
0.1 12.63 (21) 21.17 (11) 12.59 (15) 15.58 (60)<br />
0.2 12.41 (23) 24.13 (10) 12.20 (28) 18.00 (70)<br />
0.3 12.93 (27) 30.16 (80) 12.63 (20) 23.95 (48)<br />
0.4 12.76 (28) 35.01 (60) 12.16 (22) 27.94 (41)<br />
0.5 13.48 (29) 42.28 (50) 13.19 (24) 32.38 (35)<br />
0.6 13.12 (31) 50.39 (40) 13.03 (22) 37.61 (24)<br />
0.7 13.31(37) 56.16 (35) 13.28 (39) 44.49 (40)<br />
0.8 13.28 (48) 60.99 (42) 13.14 (30) 48.74 (25)<br />
0.9 13.20 (55) 63.13 (40) 12.93 (34) 53.22 (24)<br />
1 13.44 (06) 67.20 (04) 13.17 (05) 58.95 (03)
318<br />
P. Undre and P. W. Khirade / Lith. J. Phys. 51, 313–323 (2011)<br />
temperature, the relaxation time values are decreasing<br />
by maintaining the same type of variation with<br />
change in concentration. In the DP-rich region,<br />
τ values are not so much sensitive with change in<br />
temperature. The values ε 0<br />
as well as τ increase with<br />
increase in volume fraction of DMAE in DP, which<br />
indicates that with increase in the number of dipoles<br />
in the solution, the intermediate structures<br />
formed rotate slowly thereby giving the increase in<br />
the values of τ in the solution.<br />
A large value of τ for DMAE molecules is attributed<br />
to H-bonded polymeric cluster formation.<br />
The primary relaxation of DMAE may be due<br />
to the cooperative process of long chain multimers<br />
with (O–H …. N or may be H–N ... H) linkage. The<br />
observed relaxation time τ of DMAE (79.21 ps) is<br />
much smaller than the τ of ethanolamine (155 ps)<br />
[19] and ethanol (139.85 ps) [20], which suggests<br />
that there is substantial hindrance to molecular<br />
reorientation due to the bulky –CH 3<br />
side group<br />
in ethanol. Moreover, the fact that the τ values<br />
of amines are smaller than homologous alcohols<br />
indicates [21], on the one hand, the weaker<br />
dipolar character of the NH 2<br />
group with respect<br />
to the OH group and, on the other hand, that the<br />
relaxation times for amines are near to the rotation<br />
time of the NH 2<br />
group in its free state. The<br />
τ value of DMAE is much smaller than ethanol<br />
and aminoethanol, which suggests that there is<br />
substantial hindrance to molecular reorientation<br />
due to the terminal hydroxy (OH) and dimethylamine<br />
(–N(CH 3<br />
) 2<br />
) groups. The Kirkwood correlation<br />
factor of propylamine (g = 1.45) [22] is larger<br />
in comparison with DP (g = 1.003), the observed<br />
relaxation time τ of DP (14.23 ps) is much larger<br />
than the τ of propylamine (3.05 ps), which suggests<br />
the fact that there is substantial hindrance to<br />
molecular reorientation due to –NH 2<br />
groups and<br />
also bulky –CH 3<br />
side group of propane. Increase<br />
in volume fraction of DMAE in DP when relaxation<br />
value τ increases is a manifestation of the dielectric<br />
orientation of the clusters containing both<br />
DP and DMAE molecules, which is because of the<br />
continuous breaking and making of H-bonds in<br />
the heterogeneous mixture.<br />
The excess parameters [22, 23] related to ε 0<br />
and τ<br />
provide valuable information regarding interaction<br />
between (solute–solvent) polar–polar liquid mixtures.<br />
These properties are also useful for the detection<br />
of the cooperative domain in the mixture and<br />
may give evidence for the formation of multimers<br />
in the mixture due to intermolecular interaction.<br />
The excess permittivity is defined as<br />
ε E = (ε o<br />
) m<br />
– [(ε o<br />
) A<br />
x A<br />
+ (ε o<br />
) B<br />
x B<br />
)], (4)<br />
where x is the mole fraction, and suffixes m, A, B<br />
represent mixture, liquid A and liquid B, respectively.<br />
The excess inverse relaxation time is defined as<br />
(1/τ) E = (1/τ) m<br />
– [(1/τ) A<br />
x A<br />
+ (1/τ) B<br />
x B<br />
], (5)<br />
which represents average broadening of dielectric<br />
spectra. The inverse relaxation time analogy is<br />
taken from spectral line broadening (which is the<br />
inverse of relaxation time) from the resonant spectroscopy<br />
[24].<br />
In DP–DMAE, three kinds of cooperative domains<br />
are expected due to molecular interactions: cooperative<br />
domain (CD) includes DP molecules only,<br />
CD includes DMAE molecules only, and CD includes<br />
both DP and DMAE molecules. Further, the ratio of<br />
these cooperative domains may vary with concentration<br />
of individual molecules in the mixture. For<br />
the detection of the CD in the mixture, it is useful to<br />
compute the excess permittivity ε E which may provide<br />
evidence for the formation of dimmers/multimers<br />
in the mixture due to molecular interactions.<br />
The obtained excess permittivity and excess<br />
inverse relaxation data for the binary mixture of<br />
DP–DMAE are presented in Figs. 3 and 4, respectively.<br />
The observed ε E is found to be negative at the<br />
DMAE-rich region for all temperatures and at the<br />
DP-rich region at 288 K (Fig. 3). The negative values<br />
of ε E indicate that the total number of dipoles decreases<br />
in the DMAE- and DP-rich region (288 K)<br />
which is due to the opposite alignment of the dipoles<br />
of the interacting DP and DMAE molecules. Further,<br />
the low value of ε E at concentrations near to that of<br />
pure DMAE indicates that there is less interaction<br />
between DP and DMAE molecules, and hence cooperative<br />
domain decreases in comparison with the cooperative<br />
domain including DP–DMAE molecules<br />
at remaining concentrations. The positive value of<br />
ε E indicates that the total number of dipoles in DP–<br />
DMAE increases with the formation of monomeric<br />
or dimeric structures which is due to the parallel<br />
alignments of the dipoles of the interacting DP and<br />
DMAE molecules.
P. Undre and P. W. Khirade / Lith. J. Phys. 51, 313–323 (2011) 319<br />
From Fig. 4 it is found that the (1/τ) E values of<br />
DP–DMAE binary mixtures are negative over the<br />
entire concentration range. The negative peak value<br />
is observed at 80% DP–DMAE concentration. The<br />
negative values of (1/τ) E indicate the formation of<br />
linear structures, probably dimeric, and these rotate<br />
slowly under the influence of an external varying<br />
field.<br />
Different molecules are connected by hydrogen<br />
bonds; it will be necessary to break these bonds<br />
for the dielectric relaxation to be produced. This<br />
question has been envisaged by considering the<br />
Kirkwood correlation factor g [25] which itself expresses<br />
the existing dipolar correlation between the<br />
molecule and its surroundings.<br />
The g for pure liquid can be obtained by the expression<br />
(6)<br />
Fig. 3. Variation of excess permittivity with mole fraction<br />
of dimethylaminoethanol in 1,2-diaminopropane<br />
at various temperatures.<br />
where μ is the dipole moment, ρ is the density of<br />
liquid at temperature T, M is the molecular weight,<br />
k is the Boltzmann constant, and N is the Avogadro’s<br />
number.<br />
The effective averaged angular Kirkwood correlation<br />
factor g eff [26, 27] of the mixed solvents<br />
was determined by the following volume fractionweighted<br />
mixture law:<br />
(7)<br />
Fig. 4. Variation of excess inverse relaxation time with<br />
mole fraction of dimethylaminoethanol in 1,2-diaminopropane<br />
at various temperatures.<br />
where g eff is the effective Kirkwood correlation factor<br />
for a binary mixture, and Φ A<br />
, Φ B<br />
are volume<br />
fraction of liquid A and liquid B, respectively.<br />
Considering the Kirkwood correlation factors g 1<br />
and g 2<br />
for the molecules of liquids 1 and 2 which<br />
contributed proportional to their pure liquid g values<br />
in the binary mixture, Eq. (7) of the Kirkwood<br />
correlation factor can be written as<br />
(8)<br />
where g f<br />
is the corrective Kirkwood correlation factor<br />
for a binary mixture. The evaluated g f<br />
values of<br />
the DP–DMAE mixture are given in Fig. 5.<br />
The calculated values of g eff are presented in Table<br />
2. The g eff values change periodically with change<br />
in concentration of DMAE in binary mixture of<br />
DP–DMAE. This concentration-dependent periodic<br />
behaviour of the investigated mixed solvents
320<br />
P. Undre and P. W. Khirade / Lith. J. Phys. 51, 313–323 (2011)<br />
g f<br />
Fig. 5. Plots of g f<br />
against volume fraction of dimethylaminoethanol<br />
for 1,2-diaminopropane–dimethylaminoethanol<br />
binary mixtures at various temperatures.<br />
confirms the change in dipolar ordering of DMAE<br />
molecules due to their H-bond molecular interactions<br />
with DP molecules. The corrective Kirkwood<br />
correlation factor g f<br />
of the investigated mixtures<br />
deviate from unity (Fig. 5) confirming the change<br />
in net dipolar ordering. The plots of g f<br />
values of<br />
DP–DMAE mixtures have good resemblance with<br />
their corresponding ε E plots, i. e. the mixtures<br />
which have g f<br />
values greater than unity have positive<br />
ε E values, and vice versa (Fig. 3). The g f<br />
values<br />
higher than unity for DP–DMAE mixtures reveal<br />
enhanced in the effective dipolar ordering due to<br />
hetero-molecular H-bond interactions. Whereas<br />
the g f<br />
values of DMAE and DP (288 K) rich region<br />
are less than unity, which suggests that the addition<br />
of a small amount of DMAE breaks a large<br />
amount of H-bonded long-range ordered DP<br />
structures.<br />
Since the Arrhenius plots of log τ vs 1/T displayed<br />
a good linearity for all the studied liquid<br />
mixtures, the kinetic parameters that characterise<br />
the molecular mobility in those systems were evaluated<br />
using the Eyring formula [28, 29].<br />
The dielectric relaxation can be treated as a<br />
rate process involving a path over a potential barrier<br />
[24, 29]. Figure 6(a, b) shows free energy of<br />
activation ΔG of the DP–DMAE mixtures as a<br />
function of temperature at different solution compositions<br />
and as a function of solution composition<br />
at different temperatures, respectively. Over<br />
the temperature range of 288–318 K, ΔG varies<br />
gradually with the mole fraction of DMAE. It is<br />
observed that the ΔG values of DMAE are higher<br />
than those of DP over the temperature range of<br />
288–318 K. This difference is attributed to the formation<br />
of hydrogen bonded networks for DP and<br />
DMAE that tend to increase the effective size of a<br />
rotating dipole and the dielectric frictional force<br />
between the rotating dipole and its neighbouring<br />
molecules. Despite the distinctly different ΔG values<br />
of DP and DMAE and the presence of hydrogen<br />
bonding between DP and DMAE molecules,<br />
there is a gradual increase in ΔG with increase in<br />
DMAE composition as shown in Fig. 6(b), which<br />
Table 2. The value of Kirkwood correlation factor (g eff )<br />
for dimethylaminoethanol–1,2-diaminopropane binary<br />
mixture at various temperatures.<br />
X DMAE<br />
288 K 298 K 308 K 318 K<br />
0 1.02 1.00 0.97 0.88<br />
0.1 0.99 1.01 1.03 1.06<br />
0.2 0.98 0.97 1.00 1.01<br />
0.3 1.04 1.05 1.04 1.04<br />
0.4 0.99 1.00 1.01 0.99<br />
0.5 1.03 1.05 1.07 1.08<br />
0.6 1.01 1.03 1.02 1.05<br />
0.7 1.01 1.02 1.03 1.06<br />
0.8 0.98 0.99 1.02 1.04<br />
0.9 0.96 0.98 1.00 1.01<br />
1 0.98 1.00 1.01 1.02<br />
g eff<br />
Fig. 6(a). Variation of free energy of activation ΔG for<br />
the dipolar relaxation for dimethylaminoethanol–1,<br />
2-diaminopropane binary mixture as a function of<br />
temperature.
P. Undre and P. W. Khirade / Lith. J. Phys. 51, 313–323 (2011) 321<br />
Fig. 6(b). Variation of free energy of activation ΔG for<br />
the dipolar relaxation for dimethylaminoethanol–1,<br />
2-diaminopropane binary mixture as a function of<br />
solution composition.<br />
suggests that the DP and DMAE molecules in the<br />
mixture react to the external field in a strongly<br />
cooperative way rather than individually over the<br />
temperature range of 288–318 K. It also suggests<br />
that there is more hindrance to the rotation of the<br />
DP and DMAE molecule clusters in DP–DMAE<br />
in comparison with the rotation of their homogeneous<br />
clusters. This also supports the conclusions<br />
drawn from the negative values of the excess inverse<br />
relaxation time. Further, the increase in hindrance<br />
to molecular rotation in the mixture is due<br />
to intermolecular interactions between the DP and<br />
DMAE molecules, and hence chain-like structures<br />
are generated in DP–DMAE, which supports the<br />
excess permittivity and relaxation time data. In<br />
the DP–DMAE mixtures, the two different molecules<br />
are suggested to behave interchangeably in<br />
forming the cyclic molecular clusters, yielding a<br />
microscopically homogeneous liquid phase and a<br />
pure Debye-type dielectric dispersion. The primary<br />
relaxation in these mixtures is attributed to the<br />
cooperative process of the cyclic clusters, with the<br />
clusters having an increased dipole moment relative<br />
to the individual molecules. Figure 6(a) shows<br />
that ΔG of DP–DMAE mixtures is a linear function<br />
of temperature over the range of 288–318 K.<br />
The varying relaxation behaviour over the entire<br />
temperature range may be caused by changes in<br />
the hydrogen-bonding ability that produce different<br />
structures of chain-like or cyclic clusters.<br />
Factors such as changes in the angle between the<br />
neighbouring dipoles or in the average number<br />
of molecules in each cluster could yield different<br />
cluster structures. Tsurko et al. [30] reported the<br />
activation energy for the amino acid–propanol binary<br />
mixture. They suggested that the activation<br />
energy increased with increase in mole fraction of<br />
propanol and temperature. Jianfeng Lou et al. [31]<br />
reported ΔG for the nitrobenzene–toluene, ethanol–butanol<br />
and butanol–formamide. They suggested<br />
that ΔG for nitrobenzene–toluene mixture<br />
linearly increases with increase in mole fraction<br />
of nitrobenzene and temperature, consistent with<br />
the ideal dielectric mixing behaviour that might<br />
be expected on the basis of the nature of these solvent<br />
mixtures. Nitrobenzene and toluene are polar<br />
and non-polar solvents, respectively, and they do<br />
not associate with each other or with like molecules.<br />
But in case of ethanol–butanol and butanol–<br />
formamide, ΔG linearly increases with increase in<br />
compositions but decreases with increase in temperature.<br />
This may be due to the molecules in both<br />
mixtures reacting to the external field in a strongly<br />
cooperative way.<br />
An interesting trend may be observed in the<br />
temperature-dependent relaxation time for the<br />
DP–DMAE binary mixture. The most probable relaxation<br />
time determined for the DP–DMAE binary<br />
mixture decreases with increasing temperature. In<br />
general, this type of temperature-dependent effect<br />
could indicate either a temperature-dependent rate<br />
process with activation energy or an equilibrium<br />
process with an enthalpy change between the two<br />
(or perhaps more) states (ΔH).<br />
The value of ΔH increases with increase in<br />
volume fraction of DMAE in DP from 3.72 kJ/<br />
(K.mol) to 12.23 kJ/(K.mol) with increase in volume<br />
fraction of DMAE up to 0.6 in the mixture<br />
of DP–DMAE (Table 3). This indicates that more<br />
energy is needed for group dipole reorientation<br />
with increase in volume fraction of DMAE in the<br />
mixture. There is an increase in agitation with increase<br />
in volume fraction of DMAE up to 60%<br />
in the mixture, which may be due to the interaction<br />
in NH 2<br />
–NH 2<br />
group or may be due to NH 2<br />
–<br />
OH group. Furthermore, ΔH decreases towards<br />
the corresponding ΔH value of pure DMAE.<br />
A large value of ΔH at 0.6 volume fraction of<br />
DMAE indicates strong hydrogen bonding in the<br />
solution.
322<br />
P. Undre and P. W. Khirade / Lith. J. Phys. 51, 313–323 (2011)<br />
Table 3. The activation enthalpy (ΔH) of dimethylaminoethanol–1,2-diaminopropane<br />
binary mixture for<br />
various concentrations.<br />
X DMAE<br />
Activation enthalpy ΔH,<br />
kJ/(K.mol)<br />
0 3.72<br />
0.1 8.81<br />
0.2 8.86<br />
0.3 9.22<br />
0.4 10.23<br />
0.5 10.75<br />
0.6 12.23<br />
0.7 11.53<br />
0.8 11.17<br />
0.9 10.08<br />
1 9.02<br />
4. Conclusions<br />
The dielectric dispersion ε' and dielectric loss<br />
ε" of binary mixture of 1,2-diaminopropane in<br />
dimethylaminoethanol have been studied using<br />
the TDR technique in the frequency range from<br />
10 MHz to 20 GHz over entire concentration at<br />
288, 298, 308, and 318 K. Both ε' and ε" increase<br />
with increase in volume percentage of DMAE in<br />
DP–DMAE mixture at the low-frequency end and<br />
decrease at the high-frequency end. The ε 0<br />
as well<br />
as τ values increase with increase in volume fraction<br />
of DMAE in DP, which indicates that with<br />
increase in the number of dipoles in the solution<br />
the intermediate structures formed rotate slowly<br />
thereby giving the increase in the values of τ in<br />
the solution. The plots of g f<br />
values of DP–DMAE<br />
mixtures have good resemblance with their corresponding<br />
ε E plots, i. e. the mixtures which have<br />
g f<br />
values greater than unity, have positive ε E values,<br />
and vice versa. The g f<br />
values higher than unity for<br />
DP–DMAE mixtures reveal enhancement in the<br />
effective dipolar ordering due to hetero-molecular<br />
H-bond interactions. The dielectric behavior<br />
of 1,2-diaminopropane and dimethylaminoethanol<br />
liquid molecules and their conformations as<br />
well as molecular dynamics of the system can be<br />
explored only by comparing the dielectric data of<br />
the mixture system with the dielectric data of the<br />
individual molecules and their dynamics.<br />
References<br />
[1] C. Gabriel, S. Gabriel, E.H. Grant, B.S.J. Halstead,<br />
and D.M.P. Mingos, Chem. Soc. Rev. 27, 213 (1998).<br />
[2] W. Kuang, and S.O. Nelson, J. Microw. Power<br />
Electromagn. Energ. 32, 114 (1997).<br />
[3] U. Becker and M. Stockhausen, J. Mol. Liq. 81, 89<br />
(1999).<br />
[4] R.J. Sengawa, R. Chaudhary, and S.C. Mehrotra,<br />
Polymer 43, 1467 (2002).<br />
[5] S.M. Puranik, A.C. Kumbharkhane, and<br />
S.C. Mehrotra, Indian J. Phys. 67(B), 9 (1993).<br />
[6] F.F. Hanna, Bo Gestblom, and A. Soliman, J. Mol.<br />
Liq. 95, 27 (2000).<br />
[7] M.J.C. van Gemert, Adv. Mol. Relaxation Processes<br />
6, 123 (1974).<br />
[8] D. Bertolini, M. Cassettari, S. Salvetti, E. Tombari,<br />
and S. Veronesi, Rev. Sci. Instrum. 61, 2416 (1990).<br />
[9] J.G. Berberian and E. King, J. Non-Cryst. Solids.<br />
305, 10 (2002).<br />
[10] C.E. Shannon, Proc. Inst. Radio Eng. 37, 10<br />
(1949).<br />
[11] H.A. Samulan, Proc. Inst. Radio Eng. 39, 175<br />
(1951).<br />
[12] S. Mashimo, S. Kuwabara, S. Yogihara, and K. Higasi,<br />
J. Chem. Phys. 90, 3292 (1989).<br />
[13] R.H. Cole, J.G. Berbarian, S.G. Chryssikos, A. Burns,<br />
and E. Tombari, J. Appl. Phys. 66, 793 (1989).<br />
[14] S. Havriliak and S. Negami, J. Polymer. Sci. C 14, 99<br />
(1966).<br />
[15] K.S. Cole and R.H. Cole, J. Chem. Phys. 9, 341<br />
(1941).<br />
[16] D.W. Davidson and R.H. Cole, J. Chem. Phys. 18,<br />
1484 (1950).<br />
[17] P. Debye, Polar Molecules The Chemical Catalogue<br />
Co., New York, 1929).<br />
[18] S. Kumar, T. Ganesh, S. Krishana, and S.C. Mehrotra,<br />
Bull. Pure Appl. Sci. D 20(1), 125 (2001).<br />
[19] P. Undre, S.N. Helambe, S.B. Jagdale, P.W. Khirade,<br />
and S.C. Mehrotra, J. Mol. Liq. 137, 147 (2008).<br />
[20] B.G. Lone, P.B. Undre, S.S. Patil, P.W. Khirade, and<br />
S.C. Mehrotra, J. Mol. Liq. 141, 47 (2008).<br />
[21] A. Volmari and H. Weingartner, J. Mol. Liq. 98–99,<br />
293 (2002).<br />
[22] F.J. Arcega, J.M. Fornies-Marquina, A.M. Bottreau,<br />
and G. Vicq, An. Fys. 77 B, 28 (1981).<br />
[23] M. Tabellout, P. Lanceleur, J.R. Emery, D.Hayward,<br />
and R.A. Pethrick, J. Chem. Soc. Farad. and Trans.<br />
86, 1493 (1990).<br />
[24] J. Lou, T.A. Hatton, and P.E. Laibinis, J. Phys. Chem.<br />
A 101, 5262 (1997).<br />
[25] G. Oster and J.G. Kirkwood, J. Chem. Phys. 11, 175<br />
(1943).<br />
[26] A.C. Kumbharkhane, S.M. Puranik, and<br />
S.C. Mehrotra, J. Solution Chem. 22, 219 (1993).<br />
[27] G. MouMouzlas, D.K. Panpoulos, and G. Ritzoulis,<br />
J. Chem. Eng. Data 36, 20 (1991).
P. Undre and P. W. Khirade / Lith. J. Phys. 51, 313–323 (2011) 323<br />
[28] N.E. Hill, W. Vaughan, A.H. Price, and M. Davies,<br />
Dielectric Properties and Molecular Behaviour (Van<br />
Nostrand Reinhold Co., London, 1969).<br />
[29] S. Glasstone, K.J. Laidler, and H. Eyring, The Theory<br />
of Rate Processes (McGraw-Hill Book Co., New York,<br />
1941).<br />
[30] E.N. Tsurko, T.M. Shihova, and N.V. Bondarev,<br />
J. Mol. Liqs. 96–97, 425 (2002).<br />
[31] J. Lou, A.K. Paravastu, P.E. Laibinis, and T.A. Hatton,<br />
J. Phys. Chem. A 101, 9892 (1997).<br />
DIELEKTR<strong>IN</strong>Ė DISPERSIJA 1,2-DIAM<strong>IN</strong>OPROPANO IR<br />
DIMETILAM<strong>IN</strong>OETANOLIO MIŠ<strong>IN</strong>IUOSE, PRIKLAUSANTI NUO SUDĖTIES IR<br />
TEMPERATŪROS<br />
P. Undre, P. W. Khirade<br />
Babasaheb Ambedkar Marathwada universiteto Fizikos katedra, Aurangabadas, Indija<br />
Santrauka<br />
Dielektrinė dispersija ε' ir dielektriniai nuostoliai<br />
ε" dvinariuose 1,2-diaminopropano ir dimetilaminoetanolio<br />
mišiniuose matuoti laikinės reflektometrijos<br />
metodu 10 MHz – 20 GHz dažnių ruože, esant 288,<br />
298, 308 ir 318 K temperatūrai. Šiuo metodu matuojant<br />
ε' ir ε" vertes matavimo paklaida yra ne didesnė<br />
nei ±5 %. Siekiant įvertinti įvairius dielektrinius<br />
parametrus, nuo laiko priklausančios kompleksinės<br />
skvarbos (ε* (ω) = ε'– i ε") duomenys, pavyzdžiui,<br />
statinė dielektrinė skvarba (ε 0<br />
), relaksacijos trukmė<br />
(τ) ir skvarba esant aukštam dažniui (ε ∞<br />
), netiesiniu<br />
mažiausių kvadratų metodu aproksimuoti Debajaus<br />
formule. Iš nustatytų ε 0<br />
, τ, Kirkvudo (Kirkwood) koreliacijos<br />
daugiklio (g), aktyvacijos laisvosios energijos<br />
(ΔG) ir aktyvacijos entalpijos (ΔH) temperatūrių<br />
priklausomybių daromos išvados apie -NH 2<br />
ir -CH 3<br />
šoninių grupių įtaką molekulinei dinamikai ir tarpmolekuliniams<br />
vandeniliniams ryšiams. 1,2-diami nopropano<br />
ir dimetilaminoetanolio skysčių molekulių<br />
ir jų konformacijų dielektrinės savybės bei molekulių<br />
dinamika gali būti ištirtos tik palyginus dielektrinius<br />
mišinio sistemos duomenis su pavienių molekulių ir jų<br />
dinamikos dielektriniais duomenimis.