effects of the multiple internal reflection and sample thickness ...
effects of the multiple internal reflection and sample thickness ...
effects of the multiple internal reflection and sample thickness ...

Create successful ePaper yourself
Turn your PDF publications into a flip-book with our unique Google optimized e-Paper software.
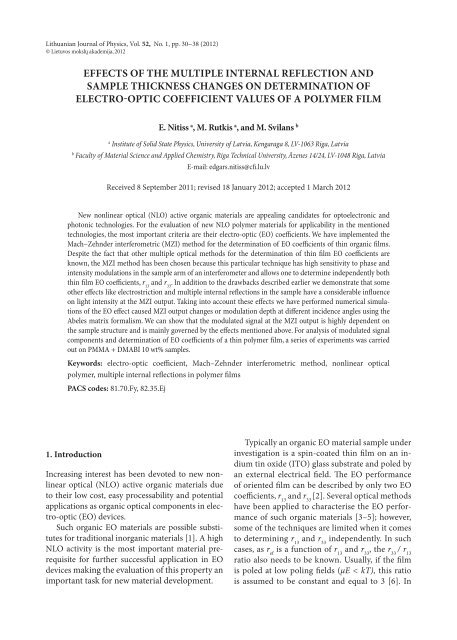
Lithuanian Journal <strong>of</strong> Physics, Vol. 52, No. 1, pp. 30–38 (2012)<br />
© Lietuvos mokslų akademija, 2012<br />
EFFECTS OF THE MULTIPLE INTERNAL REFLECTION AND<br />
SAMPLE THICKNESS CHANGES ON DETERMINATION OF<br />
ELECTRO-OPTIC COEFFICIENT VALUES OF A POLYMER FILM<br />
E. Nitiss a , M. Rutkis a , <strong>and</strong> M. Svilans b<br />
a<br />
Institute <strong>of</strong> Solid State Physics, University <strong>of</strong> Latvia, Kengaraga 8, LV-1063 Riga, Latvia<br />
b<br />
Faculty <strong>of</strong> Material Science <strong>and</strong> Applied Chemistry, Riga Technical University, Āzenes 14/24, LV-1048 Riga, Latvia<br />
E-mail: edgars.nitiss@cfi.lu.lv<br />
Received 8 September 2011; revised 18 January 2012; accepted 1 March 2012<br />
New nonlinear optical (NLO) active organic materials are appealing c<strong>and</strong>idates for optoelectronic <strong>and</strong><br />
photonic technologies. For <strong>the</strong> evaluation <strong>of</strong> new NLO polymer materials for applicability in <strong>the</strong> mentioned<br />
technologies, <strong>the</strong> most important criteria are <strong>the</strong>ir electro-optic (EO) coefficients. We have implemented <strong>the</strong><br />
Mach–Zehnder interferometric (MZI) method for <strong>the</strong> determination <strong>of</strong> EO coefficients <strong>of</strong> thin organic films.<br />
Despite <strong>the</strong> fact that o<strong>the</strong>r <strong>multiple</strong> optical methods for <strong>the</strong> determination <strong>of</strong> thin film EO coefficients are<br />
known, <strong>the</strong> MZI method has been chosen because this particular technique has high sensitivity to phase <strong>and</strong><br />
intensity modulations in <strong>the</strong> <strong>sample</strong> arm <strong>of</strong> an interferometer <strong>and</strong> allows one to determine independently both<br />
thin film EO coefficients, r 13<br />
<strong>and</strong> r 33<br />
. In addition to <strong>the</strong> drawbacks described earlier we demonstrate that some<br />
o<strong>the</strong>r <strong>effects</strong> like electrostriction <strong>and</strong> <strong>multiple</strong> <strong>internal</strong> <strong>reflection</strong>s in <strong>the</strong> <strong>sample</strong> have a considerable influence<br />
on light intensity at <strong>the</strong> MZI output. Taking into account <strong>the</strong>se <strong>effects</strong> we have performed numerical simulations<br />
<strong>of</strong> <strong>the</strong> EO effect caused MZI output changes or modulation depth at different incidence angles using <strong>the</strong><br />
Abeles matrix formalism. We can show that <strong>the</strong> modulated signal at <strong>the</strong> MZI output is highly dependent on<br />
<strong>the</strong> <strong>sample</strong> structure <strong>and</strong> is mainly governed by <strong>the</strong> <strong>effects</strong> mentioned above. For analysis <strong>of</strong> modulated signal<br />
components <strong>and</strong> determination <strong>of</strong> EO coefficients <strong>of</strong> a thin polymer film, a series <strong>of</strong> experiments was carried<br />
out on PMMA + DMABI 10 wt% <strong>sample</strong>s.<br />
Keywords: electro-optic coefficient, Mach–Zehnder interferometric method, nonlinear optical<br />
polymer, <strong>multiple</strong> <strong>internal</strong> <strong>reflection</strong>s in polymer films<br />
PACS codes: 81.70.Fy, 82.35.Ej<br />
1. Introduction<br />
Increasing interest has been devoted to new nonlinear<br />
optical (NLO) active organic materials due<br />
to <strong>the</strong>ir low cost, easy processability <strong>and</strong> potential<br />
applications as organic optical components in electro-optic<br />
(EO) devices.<br />
Such organic EO materials are possible substitutes<br />
for traditional inorganic materials [1]. A high<br />
NLO activity is <strong>the</strong> most important material prerequisite<br />
for fur<strong>the</strong>r successful application in EO<br />
devices making <strong>the</strong> evaluation <strong>of</strong> this property an<br />
important task for new material development.<br />
Typically an organic EO material <strong>sample</strong> under<br />
investigation is a spin-coated thin film on an indium<br />
tin oxide (ITO) glass substrate <strong>and</strong> poled by<br />
an external electrical field. The EO performance<br />
<strong>of</strong> oriented film can be described by only two EO<br />
coefficients, r 13<br />
<strong>and</strong> r 33<br />
[2]. Several optical methods<br />
have been applied to characterise <strong>the</strong> EO performance<br />
<strong>of</strong> such organic materials [3–5]; however,<br />
some <strong>of</strong> <strong>the</strong> techniques are limited when it comes<br />
to determining r 13<br />
<strong>and</strong> r 33<br />
independently. In such<br />
cases, as r ef<br />
is a function <strong>of</strong> r 13<br />
<strong>and</strong> r 33<br />
, <strong>the</strong> r 33<br />
/ r 13<br />
ratio also needs to be known. Usually, if <strong>the</strong> film<br />
is poled at low poling fields (μE < kT), this ratio<br />
is assumed to be constant <strong>and</strong> equal to 3 [6]. In
E. Nitiss et al. / Lith. J. Phys. 52, 30–38 (2012) 31<br />
spite <strong>of</strong> high sensitivity to acoustic <strong>and</strong> mechanical<br />
vibrations, <strong>the</strong> Mach–Zehnder interferometric<br />
(MZI) techniques in <strong>the</strong> transmission or in <strong>the</strong> <strong>reflection</strong><br />
mode are being applied more <strong>and</strong> more<br />
<strong>of</strong>ten [7, 8]. Researchers using <strong>the</strong> MZI technique<br />
in <strong>the</strong> transmission mode have mostly excluded<br />
<strong>multiple</strong> <strong>internal</strong> <strong>reflection</strong>s <strong>and</strong> <strong>thickness</strong> change<br />
<strong>of</strong> <strong>the</strong> <strong>sample</strong> by electrostriction <strong>and</strong> piezoelectric<br />
<strong>effects</strong> from <strong>the</strong>ir considerations. To our knowledge,<br />
a limited number <strong>of</strong> investigators pay attention<br />
to <strong>the</strong>se <strong>effects</strong> [9–11]; however, according<br />
to our observations, <strong>the</strong> <strong>effects</strong> can contribute<br />
greatly to <strong>the</strong> measured modulated signal amplitude<br />
<strong>and</strong> phase <strong>and</strong> <strong>the</strong>refore must be taken into<br />
account. For correct determination <strong>of</strong> both EO<br />
coefficients <strong>the</strong> light intensity <strong>and</strong> phase transmitted<br />
by <strong>the</strong> multilayer EO <strong>sample</strong> must be known.<br />
It can be described by <strong>the</strong> Abelès matrix formalism<br />
[12, 13]. In this contribution we would like<br />
to present <strong>the</strong> influence <strong>of</strong> <strong>the</strong> <strong>multiple</strong> <strong>internal</strong><br />
<strong>reflection</strong> <strong>and</strong> <strong>sample</strong> <strong>thickness</strong> change <strong>effects</strong> on<br />
<strong>the</strong> determination <strong>of</strong> polymer film EO coefficients<br />
using <strong>the</strong> MZI technique.<br />
2. Experimental set-up<br />
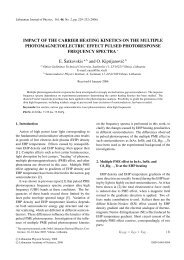
The MZI set-up for EO measurements can be seen<br />
in Fig. 1. The <strong>sample</strong> was usually examined in <strong>the</strong><br />
transmission configuration. In contrast to <strong>the</strong> <strong>reflection</strong><br />
configuration, where <strong>the</strong> <strong>sample</strong> is used<br />
Fig.1. Experimental set-up <strong>of</strong> MZI for determination<br />
<strong>of</strong> EO coefficients <strong>of</strong> a thin organic film: helium-neon<br />
laser 632.8 nm He–Ne, half wave plate λ/2, beam splitter<br />
BS, mirrors M 1<br />
, M 2<br />
<strong>and</strong> M 3<br />
, phase shifter PS, <strong>sample</strong>,<br />
photodiode PD, lock-in amplifier Lock-in, amplifier<br />
Amp, computer PC.<br />
as a mirror in <strong>the</strong> <strong>sample</strong> arm, here we can obtain<br />
modulation amplitude values as a function <strong>of</strong> <strong>the</strong><br />
light incidence angle.<br />
In our optical scheme we used a Helium-Neon<br />
laser (632.8 nm) as a light source. Polarisation <strong>of</strong><br />
incident light can be controlled by a half wave plate<br />
λ/2. Afterwards, light is split into <strong>sample</strong> I s<br />
<strong>and</strong> reference<br />
I r<br />
arms <strong>of</strong> a MZI by a 50/50 beam splitter.<br />
By means <strong>of</strong> a small angle glass wedge <strong>and</strong> a computer<br />
controllable translation stage in <strong>the</strong> reference<br />
arm <strong>the</strong> interference phase <strong>of</strong> I r<br />
<strong>and</strong> I s<br />
<strong>and</strong> thus <strong>the</strong><br />
AC signal measurement point can be shifted. To<br />
obtain an interference pattern <strong>the</strong> light <strong>of</strong> <strong>the</strong> reference<br />
<strong>and</strong> <strong>sample</strong> arms is combined by a second<br />
50/50 beam splitter. The acquired interference pattern<br />
is detected by a large area Si photodiode. It is<br />
important to note that full overlapping <strong>of</strong> both light<br />
beams is necessary to achieve <strong>the</strong> maximum modulated<br />
signal. As <strong>the</strong> MZI is highly sensitive to any<br />
vibrations <strong>the</strong> elements <strong>of</strong> <strong>the</strong> optical set-up must<br />
be fixed firmly. An ultra stable beam splitter <strong>and</strong><br />
mirror holders are suggested. A modulation voltage<br />
at 4 kHz was provided by a computer controlled<br />
lock-in detector (Stanford Research Systems SR830)<br />
<strong>and</strong> an amplifier (Trek PZD350). The light intensity<br />
modulation (AC signal) as well as <strong>the</strong> average<br />
MZI output light intensity (DC signal) was measured<br />
with <strong>the</strong> SR830 <strong>and</strong> recorded by <strong>the</strong> PC. It is<br />
important to note that <strong>the</strong> AC signal recovered by<br />
<strong>the</strong> Lock-in amplifier contains a notable fraction <strong>of</strong><br />
crosstalk. This effect is caused by electromagnetic<br />
induction <strong>and</strong> can be recognised by its presence in<br />
<strong>the</strong> detection system with <strong>the</strong> laser light turned <strong>of</strong>f.<br />
The crosstalk signal has <strong>the</strong> same frequency as <strong>the</strong><br />
modulation caused by EO effect <strong>and</strong> creates an additional<br />
<strong>of</strong>fset value in <strong>the</strong> signal detected by lockin<br />
which is not dependent on MZI phase.<br />
Typically, <strong>the</strong> polymer <strong>sample</strong> PMMA + DMA-<br />
BI 10 wt% (for a detailed molecular structure see<br />
Ref. [14]) used in this investigation was made by<br />
spin-coating (900 rpm speed, 300 rpm/s acceleration)<br />
it onto an ITO covered glass slide (SPI Supplies<br />
ITO 70–100 Ω) from a chlor<strong>of</strong>orm solution (concentration<br />
<strong>of</strong> 100 mg/ml) <strong>of</strong> appropriate amounts<br />
<strong>of</strong> components. The glass transition temperature <strong>of</strong><br />
<strong>the</strong> polymer is approximately 110 °C.<br />
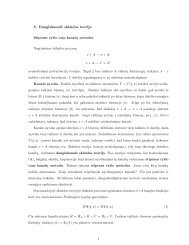
There are two main possibilities how to obtain<br />
<strong>the</strong> s<strong>and</strong>wich <strong>sample</strong> structure. For <strong>sample</strong> 1, an<br />
ITO glass slide carrying <strong>the</strong> polymer is covered<br />
with ano<strong>the</strong>r bare ITO glass slide as shown in Fig. 2,
32<br />
E. Nitiss et al. / Lith. J. Phys. 52, 30–38 (2012)<br />
Sample 1 Sample 2<br />
Fig. 2. Sample 1 geometry: 1, 4 ITO coated glass, 2 air gap, 3 PMMA + DMABI 10 wt%, θ light incidence angle.<br />
Sample 2 geometry: 1 sputtered Al layer, 2 polymer (PMMA + DMABI 10 wt%), 3 ITO coated glass, θ light incidence<br />
angle.<br />
after which both slides are squeezed toge<strong>the</strong>r in <strong>the</strong><br />
<strong>sample</strong> holder. On a micron scale <strong>the</strong> surface <strong>of</strong> <strong>the</strong><br />
<strong>sample</strong>, especially at slide edges, is ra<strong>the</strong>r rough. Due<br />
to this an air gap forms between <strong>the</strong> surface <strong>of</strong> polymer<br />
<strong>and</strong> second ITO electrode. Alternatively, for<br />
<strong>sample</strong> 2 an Al layer with <strong>the</strong> <strong>thickness</strong> <strong>of</strong> ~25 nm<br />
can be sputtered directly onto <strong>the</strong> polymer as shown<br />
in Fig. 2. In this case <strong>the</strong> overall optical transmission<br />
coefficient <strong>of</strong> <strong>the</strong> <strong>sample</strong> is reduced; however, lower<br />
voltages on electrodes are necessary for material<br />
poling <strong>and</strong> observation <strong>of</strong> EO modulations.<br />
The electrical connections to ITO electrodes<br />
were made using a silver paste. The in situ poling<br />
was performed at 100 °C <strong>and</strong> 80 V on <strong>the</strong> electrodes<br />
for 30 minutes for <strong>sample</strong> 1 <strong>and</strong> at 100 °C <strong>and</strong> 40 V<br />
on <strong>the</strong> electrodes for 30 minutes for <strong>sample</strong> 2. The<br />
EO measurements were performed after at least<br />
24 hours during which <strong>the</strong> charge relaxation had<br />
taken place. The parameters <strong>of</strong> <strong>the</strong> s<strong>and</strong>wich type<br />
<strong>sample</strong>s are as shown in Table 1.<br />
The <strong>thickness</strong> <strong>and</strong> refractive index <strong>of</strong> <strong>the</strong> polymer<br />
thin film was determined by a prism coupler<br />
(Metricon 2010), <strong>the</strong> extinction coefficient by<br />
measuring <strong>the</strong> absorption coefficient (Ocean Optics<br />
HR4000CG-UV-NIR). The air gap <strong>thickness</strong> was<br />
evaluated by interference fringe separation in <strong>the</strong><br />
low absorbance part <strong>of</strong> <strong>the</strong> <strong>sample</strong> transmittance<br />
spectrum.<br />
Table 1. Parameters <strong>of</strong> s<strong>and</strong>wich type <strong>sample</strong>s.<br />
Sample 1<br />
Layer<br />
Thickness<br />
Refractive index n (at<br />
632.8 nm)<br />
Extinction coefficient k (at 632.8 nm)<br />
Glass 1 ± 0.02 mm 1.50 0<br />
ITO 15–30 nm 1.76 0<br />
Air Gap 5.95 ± 2.38 µm 1.00 0<br />
Polymer 0.90 ± 0.09 μm 1.54 (10.4 ± 0.01)×10 –3<br />
ITO 15–30 nm 1.76 0<br />
Glass 1±0.02 mm 1.50 0<br />
Sample 2<br />
Layer<br />
Thickness<br />
Refractive index n (at<br />
632.8 nm)<br />
Extinction coefficient k (at 632.8 nm)<br />
Al layer 25 ± 1 nm 1.45 7.54<br />
Polymer 1.21 ± 0.09 μm 1.54 (10.4 ± 0.01)×10 –3<br />
ITO 15–30 nm 1.76 0<br />
Glass 1 ± 0.02 mm 1.50 0
E. Nitiss et al. / Lith. J. Phys. 52, 30–38 (2012) 33<br />
The EO experiment was performed as follows.<br />
Modulation voltage (typically 50 V rms for <strong>sample</strong><br />
1 <strong>and</strong> 15 V rms for <strong>sample</strong> 2) was applied to <strong>the</strong><br />
electrodes, <strong>the</strong> output light intensity <strong>of</strong> MZI (DC<br />
signal) <strong>and</strong> <strong>the</strong> light modulation amplitude (AC<br />
signal) was detected with <strong>the</strong> Si photodiode <strong>and</strong><br />
measured by <strong>the</strong> lock-in detector. Data was collected<br />
for 20 s at several MZI interference phase points<br />
<strong>and</strong> <strong>the</strong>n averaged. The measurement series was<br />
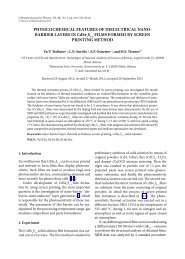
done with s <strong>and</strong> p polarised light at several incident<br />
angles. Figure 3 shows typical measurement results<br />
where <strong>the</strong> interference phase is scanned with <strong>the</strong><br />
motor-controlled glass wedge.<br />
From Fig. 3 <strong>the</strong> maximal modulation depth m max<br />
is calculated by<br />
(1)<br />
maximal modulation depth is a dimensionless<br />
number used to describe <strong>the</strong> relative AC modulation<br />
intensity.<br />
2.1. Description <strong>of</strong> <strong>the</strong> MZI output<br />
The EO coefficient tensor r ijk<br />
characterises <strong>the</strong><br />
ability <strong>of</strong> a material to change its refractive index n<br />
when low frequency electric field E is applied:<br />
(2)<br />
Due to Kleinman symmetry, r ijk<br />
can be rewritten as<br />
r il<br />
which is a 6 × 3 tensor. In a poled polymer with<br />
point group symmetry <strong>of</strong> C ∞V<br />
<strong>the</strong> effective EO coefficient<br />
can be rewritten for s polarised light as [15]<br />
where I ac max<br />
<strong>and</strong> I ac min<br />
are <strong>the</strong> AC maximal <strong>and</strong><br />
minimal modulated signal amplitudes, I max<br />
<strong>and</strong><br />
I min<br />
are <strong>the</strong> maximal <strong>and</strong> minimal values <strong>of</strong> DC<br />
signal obtained from <strong>the</strong> MZI phase scan. The<br />
r ef<br />
= r 13<br />
<strong>and</strong> for p polarised light as<br />
r ef<br />
= r 13<br />
cos 2 α + r 33<br />
sin 2 α,<br />
(3a)<br />
(3b)<br />
Fig. 3. Typical EO measurement performed at 8° incidence angle <strong>and</strong> s polarised light: 1 I DC<br />
signal experimental data,<br />
2 I AC<br />
signal experimental data, 3 I DC<br />
signal sin approximation, 4 I AC<br />
signal sin approximation; Ψ is AC <strong>and</strong> DC signal<br />
maxima phase difference.
34<br />
E. Nitiss et al. / Lith. J. Phys. 52, 30–38 (2012)<br />
where r 13<br />
<strong>and</strong> r 33<br />
are <strong>the</strong> EO coefficients, <strong>and</strong> α is <strong>the</strong><br />
angle between <strong>the</strong> <strong>sample</strong> normal <strong>and</strong> light propagation<br />
direction.<br />
The light intensity at <strong>the</strong> MZI output can be described<br />
by <strong>the</strong> two beam interference equation:<br />
(4)<br />
where I r<br />
is light intensity in <strong>the</strong> reference arm, I s<br />
is<br />
light intensity in <strong>the</strong> <strong>sample</strong> arm without <strong>the</strong> <strong>sample</strong>,<br />
φ 0 is interference phase difference (adjustable<br />
by phase shifter), T is transmission coefficient <strong>of</strong><br />
<strong>the</strong> <strong>sample</strong>, φ is additional phase difference caused<br />
by <strong>the</strong> <strong>sample</strong>.<br />
If an AC electrical field is applied to <strong>the</strong> <strong>sample</strong><br />
<strong>the</strong> transmission T <strong>and</strong> phase φ are also modulated<br />
as affected by several parameters, e. g. <strong>the</strong> refractive<br />
index, light polarisation, <strong>sample</strong> <strong>thickness</strong><br />
etc., with corresponding changes in <strong>the</strong> detected<br />
output light intensity <strong>and</strong> <strong>the</strong>refore <strong>the</strong> AC signal<br />
amplitude. Some parameters, e. g. <strong>thickness</strong>es <strong>and</strong><br />
complex refraction indices for each layer could be<br />
obtained from independent experiments. The unknown<br />
is <strong>the</strong> effective coefficient r ef<br />
<strong>of</strong> EO active<br />
layer that we would like to determine from our<br />
MZI experiment. To describe <strong>the</strong> intensity <strong>and</strong><br />
phase <strong>of</strong> light transmitted through <strong>the</strong> <strong>sample</strong> at<br />
a certain applied voltage one can use <strong>the</strong> Abelès<br />
matrix formalism [16].<br />
3. Results <strong>and</strong> discussion<br />
According to our observations, for <strong>sample</strong> 1 <strong>the</strong><br />
maximal modulation depth m max<br />
decreases as <strong>the</strong><br />
incidence angle is increased. This dependence could<br />
not be explained just by <strong>multiple</strong> <strong>internal</strong> <strong>reflection</strong><br />
<strong>effects</strong>. To describe experimental data adequately,<br />
<strong>sample</strong> <strong>thickness</strong> modulations needed to be included<br />
in our model. Thickness change can be caused<br />
by electrostriction or piezoelectric <strong>effects</strong>. To prove<br />
<strong>the</strong> existence <strong>of</strong> <strong>the</strong>se <strong>effects</strong> <strong>and</strong> evaluate <strong>the</strong> magnitude<br />
<strong>of</strong> <strong>sample</strong> <strong>thickness</strong> modulation we used <strong>the</strong><br />
MZI method in <strong>the</strong> <strong>reflection</strong> configuration [10]. In<br />
this case <strong>the</strong> ITO glass slide covered by a spin coated<br />
polymer thin film (~1 µm) was not enclosed by<br />
ano<strong>the</strong>r slide, but a reflective 100 nm thick Al layer<br />
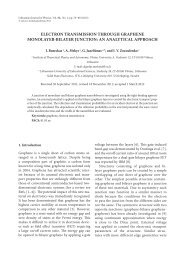
was deposited on <strong>the</strong> polymer. Then one <strong>of</strong> <strong>the</strong> mirrors<br />
(M 2<br />
, see Fig. 1) in our MZI set-up was replaced<br />
Fig. 4. Experimental set-up <strong>of</strong> MZI in <strong>reflection</strong> configuration<br />
for determination <strong>of</strong> a thin organic film <strong>thickness</strong><br />
changes: helium-neon laser 632.8 nm He–Ne, half<br />
wave plate λ/2, beam splitter BS, minors M 1<br />
<strong>and</strong> M 2<br />
,<br />
phase shifter PS, <strong>sample</strong>, photodiode PD, lock-in amplifier<br />
Lock-in, amplifier Amp, computer PC.<br />
by <strong>the</strong> <strong>sample</strong> with <strong>the</strong> Al layer facing <strong>the</strong> incident<br />
beam (see Fig. 4). The Al layer was thicker than for<br />
<strong>sample</strong> 2 so that light would not penetrate into <strong>the</strong><br />
<strong>sample</strong>. In this configuration, when voltage is applied<br />
to electrodes, electric field can cause <strong>sample</strong><br />
<strong>thickness</strong> changes, <strong>the</strong>reby changing <strong>the</strong> position <strong>of</strong><br />
Al mirror surface <strong>and</strong> thus mechanically altering <strong>the</strong><br />
optical path length in <strong>the</strong> <strong>sample</strong> arm <strong>of</strong> <strong>the</strong> MZI.<br />
To evaluate <strong>the</strong> actual <strong>thickness</strong> change <strong>of</strong> <strong>the</strong> <strong>sample</strong><br />
<strong>the</strong> modulation depth equation is modelled for<br />
phase modulation only due to changes in <strong>the</strong> <strong>sample</strong><br />
arm path length. In this case <strong>the</strong> average light intensity<br />
at <strong>the</strong> MZI output, or DC signal, has a phase difference<br />
<strong>of</strong> π/2 with respect to <strong>the</strong> 4 kHz AC modulated<br />
signal amplitude since <strong>the</strong> beam intensities in<br />
both arms, I r<br />
<strong>and</strong> I s<br />
, remain constant.<br />
For a modulation depth (Eq. (1)) <strong>of</strong> 7 ×10 –5 ,<br />
which is <strong>the</strong> maximal measured modulation<br />
depth <strong>of</strong> an unpoled <strong>sample</strong>, <strong>the</strong> <strong>sample</strong> <strong>thickness</strong><br />
alteration <strong>of</strong> approximately 14 pm was estimated.<br />
In Fig. 5 we present <strong>the</strong> modulation<br />
depth determined according to Eq. (1) as a function<br />
<strong>of</strong> applied modulation voltage. The maximal<br />
modulation depth dependence on modulation<br />
voltage exhibits a quadratic <strong>and</strong> a linear component<br />
caused by electrostriction <strong>and</strong> piezoelectric<br />
<strong>effects</strong>, respectively. Moreover, both <strong>of</strong> <strong>the</strong>se <strong>effects</strong><br />
are more pronounced for <strong>the</strong> poled polymer<br />
films.<br />
In Fig. 6 <strong>the</strong> maximal modulation depth <strong>of</strong><br />
<strong>sample</strong> 1 (see Table 1) at different light incidence
E. Nitiss et al. / Lith. J. Phys. 52, 30–38 (2012) 35<br />
Fig. 5. Modulation depth m max as a function <strong>of</strong> modulation<br />
voltage U for a MZI in <strong>the</strong> <strong>reflection</strong> configuration.<br />
Quadratic function regression is applied: 1 modulation<br />
depth m max <strong>of</strong> poled film, 2 modulation depth m max <strong>of</strong><br />
unpoled film, 3 quadratic approximation <strong>of</strong> modulation<br />
depth m max <strong>of</strong> poled film, 4 quadratic approximation <strong>of</strong><br />
modulation depth mmax <strong>of</strong> unpoled film.<br />
Fig. 6. Modulation depth dependence on <strong>the</strong> incidence<br />
angle in MZI in <strong>the</strong> transmission configuration for <strong>sample</strong><br />
1: 1, 2 experimental data for s <strong>and</strong> p polarised light,<br />
respectively; 3, 4 numerical approximation with MatLab<br />
performed using functions based on Abeles matrix formalism.<br />
angles is shown. The measurement is performed by<br />
MZI in <strong>the</strong> transmission configuration by applying<br />
50 V rms on <strong>the</strong> <strong>sample</strong>. The most important thing<br />
to notice in Fig. 6 is that <strong>the</strong> maximal modulation<br />
depth <strong>of</strong> s polarised light is higher than <strong>of</strong> p polarised<br />
light. From Eqs. (3a) <strong>and</strong> (3b) we would expect<br />
<strong>the</strong> refractive index change <strong>and</strong> <strong>the</strong>refore <strong>the</strong><br />
maximal modulation depth for p polarised light to<br />
be higher as <strong>the</strong> effective EO coefficient is a combination<br />
<strong>of</strong> both r 13<br />
<strong>and</strong> r 33<br />
. In case <strong>of</strong> s polarised light<br />
<strong>the</strong> modulation depth should be dependent only on<br />
r 13<br />
. However, due to electrostriction <strong>and</strong> piezoelectric<br />
effect <strong>the</strong> <strong>sample</strong> <strong>thickness</strong> changes take place<br />
in addition to refractive index changes so that both<br />
<strong>the</strong> light phase <strong>and</strong> <strong>the</strong> amplitude are modulated<br />
causing <strong>the</strong> modulation depth decrease for greater<br />
incidence angles. The modelling is performed by refining<br />
<strong>the</strong> preliminary experimental results <strong>of</strong> a thin<br />
film <strong>and</strong> air gap <strong>thickness</strong>es <strong>and</strong> varying <strong>the</strong> EO coefficients<br />
r 13<br />
<strong>and</strong> r 33<br />
<strong>and</strong> <strong>sample</strong> <strong>thickness</strong> alteration<br />
Δl due to electrostriction <strong>and</strong> piezoelectric <strong>effects</strong>.<br />
For approximation <strong>of</strong> <strong>sample</strong> 1 experimental<br />
data we used a simple ITO-polymer-air gap-ITO<br />
layer system (Fig. 2 <strong>and</strong> Table 1) <strong>and</strong> glass as input<br />
<strong>and</strong> output media. This approach neglects interference<br />
<strong>effects</strong> caused by <strong>multiple</strong> light <strong>reflection</strong>s<br />
within <strong>the</strong> glass slides <strong>and</strong> <strong>the</strong>refore <strong>the</strong>oretical<br />
lines are much smoo<strong>the</strong>r than experimental. Of<br />
course we could take into account glass slides as<br />
additional layers in our approximation. In that case<br />
noise-like interference fringes are superposed on<br />
<strong>the</strong> curves. The angular spacing <strong>of</strong> <strong>the</strong>se fringes is<br />
well below <strong>the</strong> experimental incidence angle resolution.<br />
After performing <strong>the</strong> first numerical approximations<br />
for <strong>sample</strong> 1 we found that <strong>the</strong> modulation<br />
depth is a linear combination <strong>of</strong> NLO active layer<br />
<strong>thickness</strong> <strong>and</strong> EO modulations. When <strong>the</strong> EO coefficients<br />
were calculated taking into account a <strong>thickness</strong><br />
modulation amplitude in <strong>the</strong> range <strong>of</strong> several<br />
tens <strong>of</strong> pm, <strong>the</strong> obtained r 33<br />
to r 13<br />
ratio ~10 <strong>and</strong> r 33<br />
value close to 100 pm/V were obviously too high.<br />
The ratio <strong>of</strong> r 33<br />
to r 13<br />
can be estimated by measuring<br />
<strong>the</strong> ratio <strong>of</strong> NLO coefficients d 33<br />
<strong>and</strong> d 13<br />
. Both<br />
EO <strong>and</strong> NLO coefficients characterise <strong>the</strong> material<br />
nonlinearity <strong>and</strong> are proportional to <strong>the</strong> second order<br />
polarisability χ (2) , but are used to describe <strong>the</strong><br />
nonlinearity at different interactions <strong>and</strong> conditions.<br />
The NLO coefficient ratio d 33<br />
/d 13<br />
(nominally<br />
<strong>the</strong> same as r 33<br />
/r 13<br />
[17]) measurements performed<br />
by <strong>the</strong> second harmonic generation Maker fringe<br />
technique on <strong>the</strong> same <strong>sample</strong> yielded a value <strong>of</strong><br />
1.86. This suggests that <strong>the</strong> modulation is mainly<br />
caused by some effect o<strong>the</strong>r than EO variations. As<br />
described above <strong>the</strong> modulations could be caused<br />
by <strong>thickness</strong> changes in <strong>the</strong> polymer layer. The air<br />
gap (Fig. 2) <strong>thickness</strong> modulations can also take<br />
place as shown previously [18]. Therefore, <strong>the</strong> final<br />
modelling was performed allowing only air gap <strong>and</strong><br />
NLO active layer <strong>thickness</strong> modulations Δl air<br />
<strong>and</strong>
36<br />
E. Nitiss et al. / Lith. J. Phys. 52, 30–38 (2012)<br />
Δl, respectively. As it turned out in such case <strong>the</strong><br />
calculated modulation depth was in good agreement<br />
with experimental data. The experimental<br />
data <strong>and</strong> best fit are shown in Fig. 6. The approximation<br />
values are shown in Table 2.<br />
Table 2. Sample 1 parameters calculated from numerical<br />
approximation results.<br />
Parameter<br />
Value<br />
Thickness l 0.85 ± 0.05 µm<br />
Air gap 5.85 ± 0.10 µm<br />
Δl air<br />
170 ± 5 pm<br />
Δl<br />
76.5 ± 1.0 pm<br />
effect <strong>of</strong> <strong>thickness</strong> change in this case has a small<br />
influence on <strong>the</strong> total modulation depth. Therefore,<br />
we excluded <strong>the</strong> <strong>sample</strong> <strong>thickness</strong> change effect in<br />
approximation by leaving only EO modulations.<br />
The approximation can be seen in Fig. 7. The numerical<br />
fit values can be seen in Table 3.<br />
Table 3. Sample 2 parameters calculated from numerical<br />
approximation results.<br />
Parameter<br />
Value<br />
Thickness l 1.34 ± 0.05 µm<br />
r 13<br />
0.19 ± 0.02 pm/V<br />
0.55 ± 0.06 pm/V<br />
r 33<br />
From comparison <strong>of</strong> data in Tables 1 <strong>and</strong> 2 one<br />
can see that <strong>the</strong> <strong>sample</strong> (polymer film) <strong>and</strong> air gap<br />
<strong>thickness</strong>es are in good agreement with <strong>the</strong> preliminary<br />
experimental results. As expected, with<br />
<strong>thickness</strong> changes <strong>of</strong> air gap <strong>and</strong> NLO active layer,<br />
one can have a good approximation <strong>of</strong> modulation<br />
depth values.<br />
The dependence <strong>of</strong> modulation depth on <strong>the</strong> incidence<br />
angle for <strong>sample</strong> 2 can be seen in Fig. 7. After<br />
measuring <strong>the</strong> dependence <strong>of</strong> modulation depth<br />
on <strong>the</strong> applied voltage we found that <strong>the</strong> dependence<br />
was linear. As <strong>thickness</strong> changes in <strong>the</strong> <strong>sample</strong><br />
were expected to be quadratic, we consider that <strong>the</strong><br />
4. Conclusions<br />
Both EO coefficients (r 13<br />
<strong>and</strong> r 33<br />
) <strong>of</strong> poled polymer<br />
films can be determined by applying <strong>the</strong> Abelès matrix<br />
formalism for numerical approximation <strong>of</strong> experimental<br />
MZI data at different incidence angles.<br />
However, one has to consider <strong>the</strong> <strong>sample</strong> structure.<br />
If an air gap is formed in <strong>the</strong> <strong>sample</strong>, <strong>the</strong> modulated<br />
signal in <strong>the</strong> MZI is usually generated by <strong>the</strong> air gap<br />
<strong>thickness</strong> modulations. The <strong>thickness</strong> modulations<br />
in <strong>the</strong> NLO active layer are also to be taken into account.<br />
An experimental procedure <strong>and</strong> data modelling<br />
are demonstrated for determining <strong>the</strong> EO coefficients<br />
<strong>of</strong> a poled PMMA + DMABI 10 wt% thin<br />
film. The obtained values are r 13<br />
= 0.19 ± 0.02 pm/V<br />
<strong>and</strong> r 33<br />
= 0.55 ± 0.06 pm/V.<br />
Acknowledgements<br />
This research was granted by ERDF 2.1.1.1 activity<br />
project No. 2010/0308/2DP/2.1.1.1.0/10/<br />
APIA/VIAA/051 “Development <strong>of</strong> Polymer EO<br />
Modulator Prototype Device” <strong>and</strong> Latvian National<br />
Research Program “Development <strong>of</strong> Innovative<br />
Multifunctional Materials, Signal Processing <strong>and</strong><br />
Information Technologies for Competitive Science<br />
Intensive Products”.<br />
Fig. 7. Modulation depth dependence on <strong>the</strong> incidence<br />
angle in MZI in <strong>the</strong> transmission configuration for <strong>sample</strong><br />
2: 1, 2 experimental data for s <strong>and</strong> p polarised light,<br />
respectively; 3, 4 numerical approximation with MatLab<br />
performed using functions based on <strong>the</strong> Abeles matrix<br />
formalism.<br />
References<br />
[1] L.R. Dalton, Rational design <strong>of</strong> organic electrooptic<br />
materials, J. Phys. Condens. Matter 15, 897–<br />
934 (2003).<br />
[2] A. Knoesen, M.E. Molau, D.R. Yankelevich,<br />
M.A. Mortazavi, <strong>and</strong> A. Dienes, Corona-poled
E. Nitiss et al. / Lith. J. Phys. 52, 30–38 (2012) 37<br />
nonlinear polymeric films: in situ electric field<br />
measurement, charectarization <strong>and</strong> ultrashortpuls<br />
applications, Int. J. Nonlinear Opt. Phys. 1(1),<br />
73–102 (1992).<br />
[3] M. Aillerie <strong>and</strong> N. The<strong>of</strong>anous, Measurement<br />
<strong>of</strong> <strong>the</strong> electro-optic coefficients: description <strong>and</strong><br />
comparison <strong>of</strong> <strong>the</strong> experimental techniques, Appl.<br />
Phys. B 70, 317–334 (2000).<br />
[4] C.C. Teng <strong>and</strong> H.T. Man, Simple <strong>reflection</strong> technique<br />
for measuring <strong>the</strong> electro-optic coefficient<br />
<strong>of</strong> poled polymer films, Appl. Phys. Lett. 56(18),<br />
1734–1737 (1990).<br />
[5] W.H.G. Horsthuis <strong>and</strong> G.J.M. Krijnen, Simple<br />
measuring method for electro-optical coefficients<br />
in poled polymer waveguides, Appl. Phys. Lett.<br />
55(7), 616–618 (1989).<br />
[6] C. Maertens, C. Detrembleur, P. Dubois,<br />
R. Jérôme, R. Blanche, Ph.C. Lemaire, Syn<strong>the</strong>sis<br />
<strong>and</strong> electrooptic properties <strong>of</strong> a new chromophore<br />
dispersed or grafted in a carbazolyl methacrylate<br />
matrix, Chem. Mater. 10, 1010–1016 (1998).<br />
[7] M. Sigelle <strong>and</strong> R. Hierle, Determination <strong>of</strong> electrooptic<br />
coefficients <strong>of</strong> 3-methyl 4-nitropyridine<br />
1-oxide by an interferometric phase-modulation<br />
technique, J. Appl. Phys. 52(6), 4199–4204 (1981).<br />
[8] M.J. Shin, H.R. Cho, J.H. Kim, S.H. Han, <strong>and</strong> J.W. Wu,<br />
Optical interferometric measurement <strong>of</strong> <strong>the</strong> electrooptic<br />
coeffcient in nonlinear optical polymer films, J.<br />
Korean Phys. Soc. 31(1), 99–103 (1997).<br />
[9] R. Meyrueix <strong>and</strong> O. Lemonnier, Piezoelectrically<br />
induced electrooptical effect <strong>and</strong> dipole orientation<br />
measurement in undoped amorphous polymers,<br />
J. Phys. D: Appl. Phys. 27, 379–386 (1994).<br />
[10] C. Greenlee, A. Guilmo, A. Opadeyi,<br />
R. Himmelhuber, R.A. Norwood, M. Fallahi,<br />
J. Luo, S. Huang, X.H. Zhou, A.K.Y. Jen, <strong>and</strong><br />
N. Peyghambarian, Mach-Zehnder interferometry<br />
method for decoupling electro-optic <strong>and</strong> piezoelectric<br />
tensor components in poled polymer films,<br />
Proc. SPIE 7774, 77740D–2 (2010).<br />
[11] F. Qui, X. Cheng, K. Misawa, <strong>and</strong> T. Kobayashi,<br />
Multiple <strong>reflection</strong> correction in <strong>the</strong> determination<br />
<strong>of</strong> <strong>the</strong> complex electro-optic constant using a<br />
Mach-Zehnder interferometer, Chem. Phys. Lett.<br />
266, 153–160 (1997).<br />
[12] P. Nagtegaele, E. Brasselet, <strong>and</strong> J. Zyss, Anisotropy<br />
<strong>and</strong> dispersion <strong>of</strong> a Pockels tensor: a benchmark<br />
for electro-optic organic thin-film assessment, J.<br />
Opt. Soc. Am. B 20(9), 1932–1936 (2003).<br />
[13] F. Abelès, La détermination de l’indice et de<br />
l’épaisseur des couches minces transparentes, J.<br />
Phys. Radium 11(7), 310–314 (1950).<br />
[14] M. Rutkis, A. Vembris, V. Zauls, A. Tokmakovs,<br />
E. Fonavs, A. Jurgis, <strong>and</strong> V. Kampars, Novel second-order<br />
nonlinear optical polymer materials<br />
containing ind<strong>and</strong>ione derivatives as a chromophore,<br />
Proc. SPIE 6192, 61922Q (2006).<br />
[15] R.A. Norwood, M.G. Kuzyk, <strong>and</strong> R.A. Keosian,<br />
Electro-optic tensor ratio determination <strong>of</strong> side<br />
chain copolymers with electro-optic interferometry,<br />
J. Appl. Phys. 75(4), 1869–1874 (1994).<br />
[16] S. Larouche <strong>and</strong> L. Martinu, OpenFilters: opensource<br />
s<strong>of</strong>tware for design, optimization, <strong>and</strong> syn<strong>the</strong>sis<br />
<strong>of</strong> optical filters, Appl. Opt. 47(13), C219–<br />
C230 (2008).<br />
[17] O. Ahumada, C. Weder, P. Neuenschw<strong>and</strong>er, <strong>and</strong><br />
U.W. Suter, Electro-optical properties <strong>of</strong> waveguides<br />
based on a main-chain nonlinearo-optical<br />
polyamide, Macromolecules 30, 3256–3261<br />
(1997).<br />
[18] E. Nitiss, M. Rutkis, <strong>and</strong> O. Vilitis, Determination<br />
<strong>of</strong> electro-optic coefficient <strong>of</strong> thin organic films by<br />
Mach-Zehnder interferometric method, Latv. J.<br />
Phys. Tech. Sci. 46(3), 5–14 (2009).
38<br />
E. Nitiss et al. / Lith. J. Phys. 52, 30–38 (2012)<br />
DAUGKARTINIO VIDINIO ATSPINDŽIO IR BANDINIO STORIO KITIMO<br />
ĮTAKA POLIMERINIO SLUOKSNIO ELEKTROOPTINIŲ KOEFICIENTŲ VERČIŲ<br />
NUSTATYMUI<br />
E. Nitišs a , M. Rutkis a , M. Svilans b<br />
a<br />
Latvijos universiteto Kietojo kūno fizikos institutas, Ryga, Latvija<br />
b<br />
Rygos technikos universiteto Medžiagotyros ir taikomosios chemijos fakultetas, Ryga, Latvija<br />
Santrauka<br />
Naujos organinės netiesiškai optiškai aktyvios medžiagos<br />
yra naudojamos optoelektroniniuose ir fotoniniuose<br />
taikymuose. Tokių medžiagų tinkamumas<br />
minėtiems taikymams gali būti vertinamas pagal jų<br />
elektrooptinius (EO) koeficientus. Mes pritaikėme<br />
Macho ir Cėnderio (Mach–Zehnder, MZ) interferometrijos<br />
metodą plonų organinių sluoksnių EO koeficientams<br />
nustatyti. Nepaisant daugybės kitų EO koeficientų<br />
nustatymo ploniems sluoksniams optinių metodų,<br />
šį metodą pasirinkome todėl, kad jis pasižymi dideliu<br />
jautrumu fazės ir intensyvumo moduliacijoms interferometro<br />
b<strong>and</strong>inio petyje ir leidžia nepriklausomai matuoti<br />
abu plonojo sluoksnio EO koeficientus – r 13<br />
ir r 33<br />
.<br />
Parodėme, kad elektrostrikcija ir daugkartiniai vidiniai<br />
atspindžiai b<strong>and</strong>inyje stipriai veikia šviesos intensyvumą<br />
MZ interferometro išėjime. Atsižvelgdami į šiuos<br />
reiškinius, skaitmeniškai naudodami Abelès matricų<br />
formalizmą, sumodeliavome EO koeficientų poveikį<br />
MZ interferometro signalo kaitai arba moduliacijos<br />
gylį esant skirtingiems kritimo kampams. Pavyko parodyti,<br />
kad moduliuotas signalas MZ interferometro<br />
išėjime labai priklauso nuo b<strong>and</strong>inio s<strong>and</strong>aros ir yra<br />
stipriai lemiamas EO koeficientų. Moduliuoto signalo<br />
s<strong>and</strong>ų analizei ir plonų polimerinių sluoksnių EO koeficientų<br />
nustatymui atlikome keliolika eksperimentų<br />
su PMMA ir 10 svorio % DMABI b<strong>and</strong>iniais.