AQUAMONEY CASE STUDY REPORT - VU University, Institute for ...
AQUAMONEY CASE STUDY REPORT - VU University, Institute for ...
AQUAMONEY CASE STUDY REPORT - VU University, Institute for ...

Create successful ePaper yourself
Turn your PDF publications into a flip-book with our unique Google optimized e-Paper software.
Tel<br />
UNIVERSITY OF BUCHAREST<br />
DEPARTAMENT OF SYSTEMS ECOLOGY<br />
AND SUSTAINABILITY<br />
<strong>AQUAMONEY</strong> <strong>CASE</strong> <strong>STUDY</strong> <strong>REPORT</strong><br />
Islands of Braila complex (Inner Danube Delta)<br />
Prof. Dr. Angheluta VADINEANU, Dr. Nicoleta GEAMANA,<br />
PhD Student Teodora PALARIE<br />
25 November 2008
Table of Content<br />
1. Introduction<br />
2. Description of the case study<br />
2.1. Location of the case study area<br />
2.2 Water system characteristics<br />
2.3. Short characterization of water use and water users<br />
2.4. Main water management and policy issues in the context of the WFD<br />
3. Set up of the survey<br />
3.1. Questionnaire design (common)<br />
3.2. Sampling procedure and response rate<br />
4. Valuation results<br />
4.1. Respondent characteristics and sample representativeness<br />
4.1.1. Demographic characteristics<br />
4.1.2. Socio-economic characteristics<br />
4.1.3. Water use characteristics<br />
4.2. Public perception of water management problems<br />
4.3. Estimated economic values <strong>for</strong> water resource management<br />
4.4. Factors explaining economic values <strong>for</strong> water resource management<br />
4.5. Total Economic Value<br />
5. Conclusions<br />
6. Best practice recommendations<br />
2
1. Introduction<br />
As part of the AquaMoney deliverables, the current report addresses the following project<br />
objectives:<br />
test the practice-oriented guidelines <strong>for</strong> assessing environmental and resource costs and<br />
benefits (ERCB) developed in the first year of project activity, by carrying out pilot case<br />
studies in 10 different European river basins;<br />
analyze experiences in the pilot case studies and translate these into practical policy<br />
guidelines.<br />
The main objective of this report is to assess public perception of the values associated with<br />
river restoration projects in terms of flood control and water quality improvements in the<br />
Romanian LTSER site Braila Islands, part of the international Danube Basin.<br />
By using choice experiment and contingent valuation, the economic values of river<br />
restoration are elicitated in order to estimate non-market values which can be used, together with<br />
potential market benefits such as the avoided costs of flood damage or water purification, to<br />
justify investments in Danube river restoration projects to achieve the environmental and<br />
ecological objectives of the WFD based on economic welfare considerations.<br />
Danube, the second largest river in Europe, has been strongly modified during the last 5-6<br />
centuries by different canalization and embankments, navigation and hydropower works. This is<br />
also the case of Braila Islands Danube sector where the Romanian study took place. There<strong>for</strong>e,<br />
with the WFD in placed the objective of achieving a “good ecological potential” <strong>for</strong> heavily<br />
modified water bodies, according with Article 4, requires water body specific measures including<br />
ecological restoration. The whole arsenal of measures that might insure achieving this ecological<br />
objective is governed by the costs of such improvements and the scope <strong>for</strong> time derogations and<br />
the setting of less restrictive targets because of disproportionate costs.<br />
At the same time, multiple benefits will reside from WFD implementation like improving<br />
the ecological status of water bodies and wetlands including the pollution reduction, decreasing<br />
the frequency and extent of floods and droughts, encouraging participation in water-based<br />
recreation, developing recreational activities, biodiversity conservation etc, from which only<br />
some will be quantifiable in monetary terms.<br />
In this context, there is an urgent policy requirement <strong>for</strong> better understanding of nonmarket<br />
benefits and costs of WFD implementation, in order to scientifically underpin WFD<br />
implementation strategies.<br />
3
2. Description of the case study<br />
2.1. Location of the case study area<br />
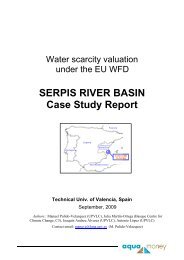
Braila Islands is a large Long Term Socio-Ecological Research site, situated in the<br />
South-East of Romania, that extends over 2600km 2 and corresponds to a 78km long Danube<br />
sector that stretches between Harsova (kilometer 253) and Braila (kilometer 175) cities. This<br />
socio-ecological system is inhabited by near 300,000 people and comprises heavily modified<br />
ecosystems (e.g. Big Island of Braila) but also systems under a natural functional regime (e.g.<br />
Small Islands of Braila), being of a crucial natural and socio-economical value.<br />
Braila Islands<br />
Location of the case study area<br />
27 48’36" E / 28 15 ’52" E<br />
45 25’26” N / 44 35’ 18” N<br />
Fig.1. Location of the Braila Islands in the Lower Danube Basin.<br />
2.2 Water system characteristics<br />
The Danube river in the Braila Islands section has been ranked as a heavily modified water body<br />
according to criteria 2.1 (embankment works) due to the hydro-technical works on 79% of the<br />
river stretch sector and a candidate to “heavily modified” according with the WFD criteria 2.2<br />
(regulation works) as a result of dredging of 21% of the river bed <strong>for</strong> intensive navigation. The<br />
main remnant of the natural floodplains consists in the wetlands from the Small Island of Braila<br />
4
Natural Park (SIBr) with a total surface of 210 square kilometers and the floodplains between the<br />
riverbanks and dikes of almost 93 square kilometers.<br />
2.3. Short characterization of water use and water users<br />
2.3.1. The main uses related to water in the region are:<br />
Agriculture – 73.46% of the total area is represented by agricultural land. In 2004, of the total<br />
191,000 ha representing the agricultural surface, 71,960 ha (37.68% from the total agricultural<br />
area in Braila Islands) was irrigated according with water users associations data 1 . At that time,<br />
the widest irrigated area was represented by the Big Island of Braila with 64,663 ha (97% of the<br />
area) due to its predominant agricultural character.<br />
Navigation – The Danube segment between Harsova and Braila (Braila Islands area) is part of an<br />
important sector (Calarasi-Braila) of the Pan-European corridor no. VII. In the case-study section<br />
freight and passengers transport is done through Braila Harbour. Because, Braila port assures the<br />
connection between the fluvial and maritime Danube, in 2006 the cargo traffic consisted in<br />
approximatively 940,000 tones from which the maritime traffic accounted <strong>for</strong> about 220,000<br />
tones and 720,000 tones <strong>for</strong> fluvial traffic according with the Union of Romanian Inland Ports<br />
data 2 .<br />
As draught is severely affecting navigation on the fluvial Danube (e.g. the draught from 2003),<br />
an ISPA project was designed to assure stabilization of the fairway through riverbed<br />
rehabilitation and improving of hydromorphological conditions in some critical points of the<br />
Calarasi-Braila sector. There<strong>for</strong>e after 2012 it is expected that the cargo transport to strongly<br />
increase.<br />
Recreation and tourism – there are 3 touristical attraction areas in the Islands of Braila: Small<br />
Island of Braila Natural Park, Macin Natural Park and Lacu Sarat Spa resort. Nevertheless<br />
local people use more leisure areas from the region from the Braila beach (a recreation area that<br />
was created in the Big Island of Braila, on the right arm of the Danube to small recreational areas<br />
without facilities)<br />
Industry and households – there are two water plants in the area, one in Braila and one in<br />
Chiscani, which are supplying the end-users with drinking water extracted from Danube.<br />
1 Ministry of Agriculture and Rural Development web-page, Journal of Irrigation Water Users Association<br />
registered in the National Register of Water Users Association, December 2004, downloaded from:<br />
http://www.maap.ro/pages/page.php?self=01&sub=0106&art=0607&var=010603<br />
2 Union of Romanian Inland Ports web-page, Traffic Data 2000-2006, downloaded from: http://www.danubeports.ro/trafic_braila.html<br />
5
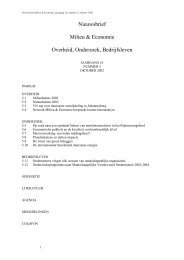
2.3.2. Water users<br />
The main water users are grouped in the three economic sectors: primary<br />
(agriculture, fishing, <strong>for</strong>estry and minig), secondary (manufactoring and construction)<br />
and tertiary (services). The only <strong>for</strong>m of organization of the water users takes place in<br />
agriculture where Irrigation Water Users Associations (Asociatii ale Utilizatorilor de<br />
Apa pentru Irigatii) have been establisehed. The primary sector is relatively low<br />
represented, despite the fact that the area is primarily an agricultural one, due to the fact<br />
that the majority of farms is represented by small subsistance farms, which do not<br />
account <strong>for</strong> companies turnover and that some of the big farms in the area are registered<br />
in other counties.<br />
Secondary sector<br />
39%<br />
Tertiary sector<br />
54%<br />
Commerce<br />
44%<br />
Primary sector<br />
Secondary sector<br />
Transport and tourism<br />
Commerce<br />
Primary sector<br />
7%<br />
Transport and<br />
tourism<br />
5%<br />
Other services<br />
5%<br />
Other services<br />
Fig.2: Economic sectors Islands of Braila according with the registered companies’ turnover 3<br />
2.4. Main water management and policy issues in the context of the WFD<br />
<br />
<br />
<br />
<br />
<br />
<br />
<br />
<br />
<br />
The need to adapt the water strategy and management to the trend of increasing frequency<br />
and intensity of droughts and floods;<br />
Wetlands restoration, up to one half of the current agricultural polders existing in the physical<br />
structure of the Braila Islands;<br />
Agricultural landscape planning <strong>for</strong> multifunctional farming system which may allow <strong>for</strong><br />
effective diffuse pollution control, habitat connectivity and biodiversity conservation;<br />
Building and improving the water drainage system within the remaining agricultural polders;<br />
Rehabilitation of the flood defence system;<br />
Dredging river bad and improving navigation;<br />
Improving water flow inside SiBr;<br />
Development of the water supply infrastructure <strong>for</strong> about 22 per cent of population, living in<br />
the rural area around BrI;<br />
Efficient and effective waste water treatment infrastructure development.<br />
3 Statistical data provided by the National Statistics <strong>Institute</strong><br />
6
3. Set up of the survey<br />
3.1. Questionnaire design<br />
The questionnaire was developed after several meetings, discussions and pre-tests and consisted<br />
of four main parts:<br />
<br />
<br />
<br />
<br />
Perceptions and attitudes. The first part of the questionnaire contained questions about<br />
respondents’ general perceptions and environmental attitudes. Respondents were asked,<br />
<strong>for</strong> example, about types and frequency of recreational activities in the catchment area<br />
and how often they visit the case study area. This section also captured people’s<br />
perceptions about water quality and water quality evolution over the last ten years.<br />
Choice Experiment. In the second part, respondents were asked to state their choices<br />
using four different choice sets. In the introduction to the choice experiment a map of the<br />
location of the river restoration area was show to each respondent. The maps were based<br />
on CORINE LANDCOVER 2000 (shape file 1:100000). The major types of ecosystems<br />
were derived from Corine classes’ level 3 and provided in<strong>for</strong>mation about human<br />
settlements, agricultural systems, <strong>for</strong>ests and meadows, wetlands and freshwater<br />
ecosystems. The CE was followed up with a debriefing question and respondents who<br />
opted out (i.e. chose not to select one of the alternatives) four times were asked why they<br />
chose as they did.<br />
Contingent Valuation. The CE was followed up by a CV-question on ecological<br />
restoration. Participants were asked to state their maximum willingness to pay in order to<br />
help finance (largely unspecified) restoration measures which they were told would<br />
change the ecological status and/or recreational potential of the area.<br />
Demographic/socio-economic data. The final part of the questionnaire was focused on<br />
gathering data on respondents’ demographic and socio-economic status (income, age,<br />
number of children, current work status, education, etc.).<br />
3.1.1. Design and Implementation of the choice experiment<br />
In order to estimate and justify expenses <strong>for</strong> river restoration programs ecologists consider to be<br />
beneficial (in order to assist the decision-making processes), in the present study a choice<br />
experiment (CE) was chosen to value ecological restoration and to estimate the WTP <strong>for</strong> certain<br />
restoration management programmes. The design consisted of two exclusive categories of<br />
benefits: the impact of river restoration on floodwater storage and the corresponding reduction of<br />
flood risk, and the river’s nutrient retention capacity and hence water quality. There<strong>for</strong>e, the CE<br />
was composed of three attributes (flood frequency, water quality and cost of the option) and<br />
respondents were asked to choose between the current situation and two alternatives.<br />
Respondents were told in the introduction that river restoration measures can positively affect<br />
water quality and flood frequency. The degree of restoration of the river (towards a more natural<br />
state) is connected to the degree of water quality improvement and flood frequency decrease that<br />
can be expected.<br />
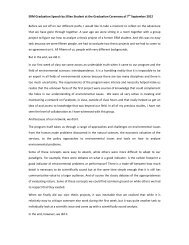
Water quality was described in terms of variety of aquatic life and recreational uses such as<br />
swimming, booting and fishing. A selection of multi-colored pictograms was used to assist<br />
respondents to visualize different quality levels, starting from moderate to good and very good<br />
water quality (Fig.3). The differences between the levels were explained in detail.<br />
7
Option A Option B Status Quo<br />
Flood<br />
frequency<br />
Once every 25 Once every 25 Once every 5<br />
years<br />
years<br />
years<br />
Good Very good Moderate<br />
Water quality<br />
Increase<br />
water bill<br />
€ 3<br />
€ 10<br />
in<br />
No additional<br />
(25 Cent /(83 Cent /<br />
payment<br />
month) month)<br />
Fig.3. Example choice card<br />
I choose:<br />
(Please tick as Option A Option B Neither<br />
appropriate)<br />
Flood frequency was defined as the probability to cause damage (financial losses) to<br />
communities, agricultural and industrial uses in the areas downstream of the river restoration and<br />
re-naturalization measures, with the four levels: 5, 25, 50 and 100 years. The lowest level <strong>for</strong><br />
both attributes, water quality and flood frequency corresponded to the status quo. The monetary<br />
attribute payment vehicle was specified as an increase in the respondents’ water bill to fund the<br />
water management programme (in the <strong>for</strong>m of an annual contribution on top of the water bill).<br />
The payment levels used in the choice experiment were equivalent amounts of 3, 10, 30 and 50 €<br />
expressed in Romanian Lei. In order to combine the levels of the attributes into a number of<br />
options a fractional factorial design was used. 32 choice sets were assigned to 8 blocks such that<br />
each respondent was confronted with a randomly selected four choice set.<br />
3.1.2. Design of the contingent valuation scenarios<br />
In the study, the contingent valuation method consisted of asking respondents about their<br />
willingness to pay <strong>for</strong> increasing the size of natural areas along the river - from the actual<br />
situation to an ecologically enhanced situation. Respondents were told that, with restoration<br />
measures, wetlands and <strong>for</strong>ests could be connected to the Danube river which would lead to a<br />
more natural landscape with water flowing not only through the main channel but also through<br />
adjacent creeks and ponds (Box 1). Respondents were told that currently about 20 % (210 km 2 )<br />
of the <strong>for</strong>mer wetlands are still in a natural shape. It was also mentioned that the reference state<br />
of the area (1056 km 2 ) contained a large number of shallow lakes, ponds and marshes, linked to<br />
8
each other by natural or man made channels and the entire network of freshwater /wetland<br />
ecosystems was connected to the Danube river arms.<br />
Box 1: Introduction of the CV-question<br />
As described be<strong>for</strong>e, the Danube River is heavily modified in many places. Today approximately<br />
a quarter of the river is still connected the surrounding floodplains and wetlands and the river<br />
banks are still in a natural state (SHOW MAP OF THE CURRENT SITUATION).<br />
Restoration measures would connect the river again to the floodplains and the wetlands as they<br />
were originally be<strong>for</strong>e the changes made to the river and river banks. As a result of river and<br />
floodplain restoration the landscape will look more natural, with water flowing also through<br />
adjacent creeks and ponds. This more natural state has a positive effect on nature and the variety<br />
of plant and animal species found in the catchment.<br />
Plans exist to restore half (50 percent) (alternatively 90%) of the <strong>for</strong>mer wetlands in the Braila<br />
Islands catchment back into their original natural state as shown on the map (SHOW MAP), and<br />
connect the river again with the floodplains and wetlands.<br />
The respondents were explicitly told that <strong>for</strong> each scenario they should state the maximum<br />
amount they would be willing to pay on top of their annual water bill in order to restore a certain<br />
degree of the river bank. We used an open-ended <strong>for</strong>mat (a payment card) to elicit individuals’<br />
maximum willingness. The payment card showed 29 values ranging from €0 to €250.<br />
Additionally, the payment card offered the options “more than € 250, namely …”, “other amount,<br />
namely…” and “I don’t know”. The WTP question was <strong>for</strong>mulated as follows:<br />
“Can you tell me with the help of this card how much you are willing to pay MAXIMUM on top<br />
of your yearly water bill over the next 5 years <strong>for</strong> the restoration of half (alternatively 90 %) of<br />
the modified river banks in the Braila Islands catchment area back into their original natural<br />
state as shown on the map?”<br />
Those respondents who were not willing to make a financial contribution to restoration measures<br />
were asked to state why. In addition, these respondents were confronted with a series of<br />
statements (e.g. “It is the task and responsibility of the government to protect the rivers” or “The<br />
environment has the right to be protected irrespective of the costs of the society.”) to identify and<br />
categorize protest bidders.<br />
9
3.2. Sampling procedure and response rate<br />
The main survey was carried out between 12 th and 17 th of November 2007 following a<br />
random sampling procedure (every 10th person in the urban area – city of Braila, every 5th<br />
person in the rural area - 19 settlements situated on the right and left arm of Danube) and the<br />
sample size has included 851 asked persons, from which only 61% (519 persons) accepted to<br />
complete the questionnaire and 39% (332 persons) have refused to answer the questionnaire. In<br />
the urban area almost 44% (316 persons) of the contacted person refused to participate in the<br />
survey. A frequent motivation was: “I’ve already filled in other questionnaire” which allow us to<br />
assume that this was a simple excuse <strong>for</strong> saying No or that they had been already involved in<br />
other investigations based on questionnaires. The last assumption seems to be more reliable<br />
because frequent investigations dealing with the assessment of the credibility of politicians/<br />
parties (preparation work of the election campaign <strong>for</strong> European Parliament, local authorities and<br />
National Parliament) were carried out at that moment.<br />
In rural areas the majority of refuses (14,5% of the contacted persons) came from old<br />
people (over 65 years old) who justified their attitude by lack of trust that their opinion will be<br />
taken into account by decision-makers.<br />
The respondents sample consisted in 49,13% female and 50,87% male and, 78,8% of the<br />
respondents (409 people) living in the urban area and 21,2% (110 respondents) in the rural area.<br />
The interviews’ locations were public places with high pedestrian traffic: main squares,<br />
parks, in front of shopping centers and shops, Mayoralties, Postal offices.<br />
A special attention was given to the composition of the sub-sample in order to mimic the<br />
local population structure including sex ratio (e.g. 1/1), age classes, level of education, income<br />
categories.<br />
4. Valuation results<br />
4.1. Respondent characteristics and sample representativeness<br />
4.1.1. Demographic characteristic<br />
a) Gender<br />
The percentage of males wass 51% in our sample, while in the region it is 48.3%. According to<br />
the t-test it is representative (see below).<br />
T-TEST<br />
/TESTVAL=0.483136<br />
/MISSING=ANALYSIS<br />
/VARIABLES=Sex<br />
/CRITERIA=CI(.9500).<br />
One-Sample Statistics<br />
N Mean Std. Deviation Std. Error Mean<br />
Sex 519 ,51 ,500 ,022<br />
10
One-Sample Test<br />
Test Value = 0.483136<br />
95% Confidence Interval of the<br />
Difference<br />
t df Sig. (2-tailed) Mean Difference Lower Upper<br />
Sex 1,162 518 ,246 ,026 -,02 ,07<br />
Since Sig. is larger than 0.246 >0.05, and the Confidence Interval of the Difference includes the<br />
zero value, we come to the conclusions that there is no significant difference in the variance<br />
between the sample and the local population, there<strong>for</strong>e the sample is representative from the<br />
gender perspective.<br />
b) Age<br />
The age structure of the sample is quite heterogeneous and covers all categories of age classes,<br />
with a better representation <strong>for</strong> the 28-57 years interval (see Figure 3).<br />
AGE<br />
120<br />
100<br />
80<br />
79<br />
108<br />
117<br />
108<br />
Number sample<br />
60<br />
40<br />
57<br />
39<br />
Series1<br />
20<br />
0<br />
18-27 28-37 38-47 48-57 58-67 68-77 78-87<br />
11<br />
Fig.4. Age classes of the sample<br />
With a mean difference of -1.06 and a Sig. value of 0.121, the t test shows that the<br />
average age of the sample (44.47 years) is representative <strong>for</strong> the adult local population<br />
(45.53). As the survey addressed only people of 18 and over, the average age <strong>for</strong> the adult<br />
local population (45.53) is bigger than the average age <strong>for</strong> the local population that takes<br />
into account all class ages (39.54)<br />
11
T-TEST<br />
/TESTVAL=45.53<br />
/MISSING=ANALYSIS<br />
/VARIABLES=Age<br />
/CRITERIA=CI(.9500).<br />
One-Sample Statistics<br />
N Mean Std. Deviation Std. Error Mean<br />
Age 519 44,47 15,585 ,684<br />
One-Sample Test<br />
Test Value = 45.53<br />
95% Confidence Interval of the<br />
Difference<br />
t df Sig. (2-tailed) Mean Difference Lower Upper<br />
Age -1,552 518 ,121 -1,062 -2,41 ,28<br />
c) Household size<br />
In the region the average household size is 3.11, while in our sample it is 3.1. According to the t-<br />
test it is representative (see below).<br />
T-TEST<br />
/TESTVAL=3.11<br />
/MISSING=ANALYSIS<br />
/VARIABLES=nopers<br />
/CRITERIA=CI(.9500).<br />
One-Sample Statistics<br />
N Mean Std. Deviation Std. Error Mean<br />
nopers 519 3,10 1,237 ,054<br />
One-Sample Test<br />
Test Value = 3.11<br />
95% Confidence Interval of the<br />
Difference<br />
t df Sig. (2-tailed) Mean Difference Lower Upper<br />
nopers -,216 518 ,829 -,012 -,12 ,09<br />
12
With a Sig. value of 0.829 the sample is representative <strong>for</strong> the local population.<br />
d) Urban-rural ratio<br />
The population in the region is mainly located in urban areas (Braila, Harsova and Macin),<br />
there<strong>for</strong>e 80% of the people are living in the city, while in our sample is 78.8% of the population.<br />
The t-test shows that the sample is representative:<br />
T-TEST<br />
/TESTVAL=0.8<br />
/MISSING=ANALYSIS<br />
/VARIABLES=urban<br />
/CRITERIA=CI(.9500).<br />
One-Sample Statistics<br />
N Mean Std. Deviation Std. Error Mean<br />
urban 519 ,79 ,409 ,018<br />
One-Sample Test<br />
Test Value = 0.8<br />
95% Confidence Interval of the<br />
Difference<br />
t df Sig. (2-tailed) Mean Difference Lower Upper<br />
urban -,665 518 ,506 -,012 -,05 ,02<br />
with a Sig.value of 0.506 and a confidence interval containing the zero value.<br />
13
4.1.2. Socio-economic characteristics<br />
Due to the limited statistical data available in the national and regional statistics regarding<br />
socio-economic characteristics, an extensive examination of the representativeness of the sample<br />
is impossible.<br />
For the occupation structure the only available data in the national statistics are the<br />
numbers of unemployed people at the county level. Having in mind the fact that more than 80%<br />
of the case-study population lives in the Braila County we used Braila data <strong>for</strong> the sample<br />
comparison, keeping in mind though the fact that by doing this we introduce a new level of<br />
uncertainty in the analysis. In the Braila County there are 8733 unemployed people, representing<br />
2.38% of the county population, which is similar to the 3% unemployed people from the sample.<br />
Still this in<strong>for</strong>mation is not significant to come to the conclusion that the sample is or not<br />
representative <strong>for</strong> the local population.<br />
The sample occupation structure is as following:<br />
Occupation<br />
22%<br />
1%2%<br />
9%<br />
PFA<br />
Employed<br />
Part-time employed<br />
Student<br />
Unemployed<br />
5%<br />
3%<br />
5%<br />
1%<br />
52%<br />
House keeper<br />
Pensioner<br />
Handicap<br />
Other<br />
Fig. 5. Occupation structure of the sample<br />
The education structure of the sample shows that a great number of the<br />
respondents (almost 40%) have a minimal education (primary school and vocational)<br />
which can be explained by the fact that the area is primarily an agricultural area, and also<br />
the big percentage of people with technical background which is due to the industry<br />
clustering in the city of Braila.<br />
Frequency Percent<br />
Valid<br />
Percent<br />
Cumulativ<br />
e Percent<br />
Valid primary school 92 17.7 17.7 17.7<br />
professional 104 20.0 20.0 37.8<br />
high school 181 34.9 34.9 72.6<br />
college<br />
(technical)<br />
106 20.4 20.4 93.1<br />
university 33 6.4 6.4 99.4<br />
Other 3 .6 .6 100.0<br />
Total 519 100.0 100.0<br />
14
Table 1. Education structure of the sample<br />
Education<br />
6% 1%<br />
18%<br />
20%<br />
20%<br />
School<br />
Vocational school<br />
High school<br />
College<br />
<strong>University</strong><br />
Other<br />
35%<br />
Fig.6. Education structure of the sample<br />
4.1.3. Recreational water use characteristics<br />
Despite the fact that the Small Islands Income of Braila is the second most valuable wetland area<br />
in Romania, after the Danube Delta (the coastal delta), nevertheless there are about 55% of the<br />
respondents who claim they have never visited the park. In this category are also included those<br />
who have been in the area but not 0.58% <strong>for</strong> recreational purposes. From the respondents 0-250/month who have<br />
251-500<br />
visited the area, the great majority are going there at least once a year. There are only 4% of the<br />
respondents who are visiting the Natural 1.54%<br />
501-750<br />
4.24% Park on weekly bases.<br />
0.19%<br />
Number of visits to the Small Islands of Braila Natural Park<br />
750-1000<br />
1001-1500<br />
1501-2000<br />
2001-2500<br />
2501-3000<br />
13.29%<br />
30%<br />
31.41%<br />
11.75%<br />
8%<br />
3%<br />
4%<br />
55%<br />
36.99%<br />
I never visit the Small Island of Braila<br />
I visit it at least once a month<br />
I visit it at least once a year<br />
I visit it at least once a week<br />
I visit it at least 4 times a year<br />
Fig.7. Income structure of the sample<br />
15
The average net income of the respondents is about 5640 euros/household/year, but there are big<br />
differences between the households per year income in the rural areas compared to the one in the<br />
urban area.<br />
180<br />
160<br />
140<br />
120<br />
100<br />
Rural<br />
80<br />
Urban<br />
60<br />
40<br />
20<br />
0<br />
1- 250 251-500 501-750 751-1000 1001-<br />
1500<br />
1501-<br />
2000<br />
2001-<br />
2500<br />
2501-<br />
3000<br />
Fig.8. Household net income (euros/month) in urban and rural areas in Braila Islands<br />
No respondent from the rural area reported a household net income per month larger than<br />
1500 euros, while about 54.5% of the rural respondents fit into the first income category (1-250<br />
euros/month). In both rural and urban areas about one third of the respondents had a household<br />
income between 251 and 500eurs /month, but in the urban areas more than one third (37.4%) of<br />
the respondents had an income greater than 501 euros/household/year compared to 10% in the<br />
rural areas.<br />
4.1.3. Water use characteristics<br />
The most common recreational activities undertaken by respondents are walking and<br />
relaxation, with almost 50% of the respondents actually doing these activities quite often.<br />
Recreational activities undertaken by respondents<br />
100%<br />
90%<br />
80%<br />
70%<br />
60%<br />
50%<br />
40%<br />
30%<br />
20%<br />
10%<br />
0%<br />
fishing swim boat walks othsport relaxing wildobs picknik caffe dogwalk kidsplay<br />
never<br />
sometimes<br />
often<br />
Fig.9. Recreational activities undertaken by respondents<br />
16
The most unpopular activity seems to be dog walking with less than 10% of the<br />
respondents who are dog walking in the vicinity of Danube as a recreational activity. This is<br />
explainable by the fact that in rural and also in urban areas that are still developing like Braila<br />
dogs are not seen as pets but as farm animals, just like chickens and pigs, which have a specific<br />
role of guarding the farm.<br />
Swimming and fishing seem to be similarly popular among respondents (with 40% of the<br />
respondents doing the activities sometimes or often), which can be explained by the fact the<br />
majority of respondents live in urban areas where there not proper places arranged <strong>for</strong> these<br />
activities.<br />
4.2. Public perception of water management problems<br />
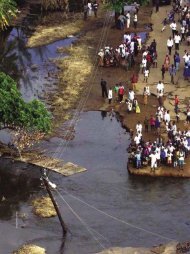
4.2.1. Flood experiences<br />
Floods and their control are considered an important problem by the respondents<br />
regardless the fact that only 8% of the respondents had experienced floods problem during their<br />
life time, while the other 92% had never suffered any losses caused by floods. From the people<br />
who had experienced floods the majority had suffered due to agricultural land flooding.<br />
Importance of flood control<br />
76%<br />
2% 3%<br />
19%<br />
not important at all<br />
not important<br />
somewhat important<br />
very important<br />
Fig.10. Importance of flood control<br />
Comparing the importance attributed by the respondents to water quality to the one<br />
ascribed to flood control, it seems that people view floods and water quality similarly important.<br />
Even though, there are more people who do not consider important water quality compared to<br />
flood. Still, the majority (72%) consider water quality as being very important (see Fig. 11).<br />
17
Importance of the water quality<br />
72%<br />
5%<br />
23%<br />
Not important at all<br />
Somewhat<br />
Very important<br />
Fig.11. Importance of the water quality<br />
People perception about water quality in the Danube differs from reality, as a large<br />
fraction of the sample (45%) considers water quality poor. Actually water quality is moderate to<br />
good, with some pollution hot-spots, the main problem in the area being the large<br />
hydromorphological modifications (canalization, dredging, and embankments) of the river arms<br />
that affected the natural functioning of the system. Almost 45% of the sample views water<br />
quality closer to reality as being moderate and good, while only 1% believes the water is very<br />
good.<br />
Water quality in Danube<br />
15%<br />
1% 9% Poor<br />
45% Moderate<br />
Good<br />
Very good<br />
Don't know<br />
30%<br />
Fig.12. Water quality in Danube<br />
Evolution of water quality seems to have deteriorated in the last 10 years in the public<br />
perception, as 62% of the respondents have indicated it, contrary to realty that shows an<br />
improvement of water quality in the last years.<br />
18
Evolution of the water quality<br />
11%<br />
6%<br />
21%<br />
Improved<br />
No change<br />
Deteriorated<br />
Don't know<br />
62%<br />
Fig.13. Evolution of the water quality in the last 10 years<br />
4.3. Estimated economic values <strong>for</strong> water resource management<br />
4.3.1. Public willingness to pay <strong>for</strong> ecological restoration<br />
4.3.1.1. Results from the contingent valuation<br />
In order to analyze and compare people’s willingness to pay <strong>for</strong> restoration projects,<br />
people were asked <strong>for</strong> both WTP <strong>for</strong> the two different scenarios: 50% and 90% restoration of<br />
the <strong>for</strong>mer wetlands (see Fig. 14 and 15).<br />
Financial contribution <strong>for</strong> ecological restoration<br />
projects (50%)<br />
180<br />
160<br />
140<br />
120<br />
100<br />
80<br />
60<br />
40<br />
20<br />
0<br />
0<br />
169<br />
1<br />
104 121 51<br />
3<br />
5<br />
10<br />
15<br />
20<br />
30<br />
40<br />
50<br />
75<br />
30<br />
13 7<br />
21<br />
3 0 0 0 0 0<br />
100<br />
200<br />
more than 200<br />
Series1<br />
Fig. 14. Financial Contributions in Euros/year <strong>for</strong> ecological restoration projects (50%)<br />
19
Financial contribution <strong>for</strong> ecological restoration<br />
projects (90%)<br />
200<br />
180<br />
160<br />
140<br />
120<br />
100<br />
80<br />
60<br />
40<br />
20<br />
0<br />
190<br />
90 97 51<br />
32 24<br />
7<br />
22<br />
5 1 0 0 0 0<br />
Series1<br />
0<br />
3<br />
10<br />
20<br />
40<br />
75<br />
200<br />
Fig.15. Financial Contributions in Euros/year <strong>for</strong> ecological restoration projects (90%)<br />
One third of the respondents were zero bidders <strong>for</strong> the 50% restoration<br />
scenario, and the number increase by 4% in case of the 90% scenario. The difference<br />
consisted in people who believed that the 90% scenario is not possible or is not<br />
desirable, as it will affect the agricultural activities in the area, by trans<strong>for</strong>ming large<br />
polders into wetlands. According with the CV analysis results, local population is<br />
willing to pay <strong>for</strong> restoration projects, despite the low level of income (mean income =<br />
5640Euro/year/household) ~ 1% of the mean annual income of the sample. The<br />
difference in bids <strong>for</strong> the 50 % and 90 % restoration projects in the CV is not<br />
significant (the mean of the bids is: <strong>for</strong> 50 % - 46.97 Euro/year and <strong>for</strong> 90% restoration<br />
- 52.93 Euro/year). Taking into account that in the area are about 103.460 households<br />
the total economic value associated with the two restoration projects are:<br />
50% 90%<br />
Braila Islands 4.86 5.48<br />
Table 1: Estimated total economic value (TEV) in million Euros per year <strong>for</strong> 50% and 90%<br />
restoration scenarios in Braila Islands:<br />
20
4.3.1.2. Results from Choice Experiment<br />
+---------------------------------------------+<br />
| Discrete choice (multinomial logit) model |<br />
| Maximum Likelihood Estimates |<br />
| Dependent variable Choice |<br />
| Weighting variable ONE |<br />
| Number of observations 2076 |<br />
| Iterations completed 4 |<br />
| Log likelihood function -2254.513 |<br />
| Log-L <strong>for</strong> Choice model = -2254.5131 |<br />
| R2=1-LogL/LogL* Log-L fncn R-sqrd RsqAdj |<br />
| No coefficients -2280.7191 .01149 .01054 |<br />
| Constants only. Must be computed directly. |<br />
| Use NLOGIT ;...; RHS=ONE $ |<br />
| Response data are given as ind. choice. |<br />
| Number of obs.= 2076, skipped 0 bad obs. |<br />
+---------------------------------------------+<br />
+---------+--------------+----------------+--------+---------+---------<br />
-+<br />
|Variable | Coefficient | Standard Error |b/St.Er.|P[|Z|>z] | Mean of<br />
X|<br />
+---------+--------------+----------------+--------+---------+---------<br />
-+<br />
ASC -.3048910310 .10698173 -2.850 .0044<br />
PR -.7236477008E-02 .21170583E-02 -3.418 .0006<br />
FL .5364740473 .46088788 1.164 .2444<br />
QUL .2461949719 .44019830E-01 5.593 .0000<br />
Table 2. Discrete choice (multinomial logit) model Maximum Likelihood Estimates<br />
A multinomial logit model - using a maximum likelihood (ML) estimation method - was<br />
employed to analyze the choice data. The ML method calls <strong>for</strong> assumptions about<br />
probability distribution functions, such as the logistic function and the complementary<br />
log-log function. All coefficients are correctly signed according to a priori expectations,<br />
meaning the price is negative and the water quality and flood frequency positive. The<br />
probability <strong>for</strong> the water quality attribute to have a coefficient value (log of odds) of 0.25<br />
is 100% according to the model, but the probability <strong>for</strong> the flood frequency coefficient to<br />
be 0.54 is un<strong>for</strong>tunately only 76% which is far under the confidence level of 95% (using<br />
an alpha value of 0.05), there<strong>for</strong>e the flood coefficient is not statistically significant.<br />
Implicit prices <strong>for</strong> river restoration attributes can be derived by comparing<br />
the ratio between the coefficients <strong>for</strong> each attribute and the coefficient <strong>for</strong> the monetary<br />
attribute, everything else being equal. On average, respondents are willing to pay <strong>for</strong> the<br />
flood frequency improvements about 74.135 euros/year and <strong>for</strong> water quality<br />
improvements 34.021 euros/year. Still correlating the p-values with the implicit prices we<br />
can actually come to the conclusion that while it is almost certain that local population of<br />
Braila Islands will pay 34.021euros/year <strong>for</strong> water quality improvements, we can not be<br />
confident that the choice of paying 74.135euros/year <strong>for</strong> flood frequency reduction is not<br />
purely accidental and that is actually reflecting their WTP <strong>for</strong> this attribute.<br />
21
+---------------------------------------------+<br />
| Discrete choice (multinomial logit) model |<br />
| Maximum Likelihood Estimates |<br />
| Dependent variable Choice |<br />
| Weighting variable ONE |<br />
| Number of observations 2076 |<br />
| Iterations completed 4 |<br />
| Log likelihood function -2253.812 |<br />
| Log-L <strong>for</strong> Choice model = -2253.8119 |<br />
| R2=1-LogL/LogL* Log-L fncn R-sqrd RsqAdj |<br />
| No coefficients -2280.7191 .01180 .01013 |<br />
| Constants only. Must be computed directly. |<br />
| Use NLOGIT ;...; RHS=ONE $ |<br />
| Response data are given as ind. choice. |<br />
| Number of obs.= 2076, skipped 0 bad obs. |<br />
+---------------------------------------------+<br />
+---------+--------------+----------------+--------+---------+---------<br />
-+<br />
|Variable | Coefficient | Standard Error |b/St.Er.|P[|Z|>z] | Mean of<br />
X|<br />
+---------+--------------+----------------+--------+---------+---------<br />
-+<br />
ASC .6615037582E-02 .97892972E-01 .068 .9461<br />
PR -.5721932418E-02 .28482023E-02 -2.009 .0445<br />
FLOW100 -.1601268706 .12510458 -1.280 .2006<br />
FMED50 -.1284072460 .97298083E-01 -1.320 .1869<br />
FHIGH25 -.3960500109E-01 .90066659E-01 -.440 .6601<br />
QGOOD .3089792650 .95069101E-01 3.250 .0012<br />
QVERGOD .4989618767 .91652918E-01 5.444 .0000<br />
Table 3: Discrete choice (multinomial logit) model Maximum Likelihood Estimates<br />
Marginal change in:<br />
Braila Islands<br />
Flood frequency 0<br />
(not significant)<br />
Water quality conditions<br />
moderate good 50.7<br />
(23.6)<br />
moderate very good 81.2<br />
(31.1)<br />
Note: standard errors between brackets.<br />
Table 4: Attribute implicit prices (€/household/year)<br />
The values presented in Table 4 represent marginal WTP: what a household is willing to pay, <strong>for</strong> a<br />
reduction of the flood return period with one year and <strong>for</strong> a change in water quality from moderate to<br />
good and very good conditions. In the case of floods, the WTP seems to be zero, while <strong>for</strong> the water<br />
quality improvements the sums are extremely large, but holding huge standard errors.<br />
22
4.4. Factors explaining economic values <strong>for</strong> water resource management<br />
Variable<br />
Mean fixed effects Estimate s.e. p<<br />
ASC 0.325 0.119 0.006<br />
Flood frequency -0.004 0.002 0.029<br />
Water Q Good 0.174 0.151 0.248<br />
Water Q Very Good 0.455 0.134 0.001<br />
Water QG x Perception -0.003 0.003 0.233<br />
Water QVG x Perception -0.007 0.002 0.001<br />
Water QG x Future visit 0.463 0.168 0.006<br />
Water QVG x Future visit 0.447 0.136 0.001<br />
Mean random effects<br />
Cost price -0.042 0.007 0.001<br />
Cost price x income 0.014 0.002 0.001<br />
Standard deviation<br />
Cost price 0.016 0.013 0.198<br />
Cost price x income 0.006 0.003 0.030<br />
Model fit<br />
Log Likelihood -1805.617<br />
Adjusted R square 0.056<br />
N 1996<br />
Table 4: Estimated mixed logit choice models<br />
According with the very low R square values, the model does not succeed to explain the choice<br />
of one of the two restoration alternatives proposed by the study. Still, what seems to have an influence<br />
on people’s choices are the higher expectations of people related to the water quality level, and the<br />
intention of future visits in the area.<br />
Even though the flood frequency estimate is negative, contrary to what it was expected, its value<br />
is very close to zero, which means that it has no influence on people’s choices. Still the negative sign is<br />
a surprise that can be explained by the fact that despite the ef<strong>for</strong>t put into the wording of the survey, still<br />
it was not clear enough <strong>for</strong> the respondents the difference between the floods as an attribute, which was<br />
described as a negative event causing economic damage, and the natural floods that will reside from a<br />
natural configuration and functionality of a river systems. Probably by perceiving floods as a beneficial<br />
natural process that creates habitats <strong>for</strong> fish and birds spawning, favors the regeneration of fertile soils<br />
<strong>for</strong> agriculture and other resources, etc. respondents felt that a decline in flood frequency to be a<br />
negative result that will diminished all the benefits generated by flooding and there<strong>for</strong>e as a decrease in<br />
welfare.<br />
Another possible explanation can reside from people’s lack of understanding on how ecological<br />
restoration and there<strong>for</strong>e flooding of some areas can solve the catastrophic flood problems. Maybe<br />
asking people <strong>for</strong> their willingness to pay <strong>for</strong> restoration projects sounded more like asking someone to<br />
“fight fire with fire”, or in our case to “fight floods with floodings”.<br />
23
4.5. Total Economic Value<br />
Policy scenario<br />
Braila Islands<br />
Flooding Water quality WTP s.e.<br />
1 Once every 25 yrs Good 9.31 2.26<br />
2 Once every 50 yrs Good 7.52 2.63<br />
3 Once every 25 yrs Very good 22.56 4.28<br />
4 Once every 50 yrs Very good 20.77 4.49<br />
5 Once every 100 yrs Very good 17.19 5.59<br />
Table 5: Consumer surplus welfare measures (€/household/year) <strong>for</strong> different policy scenarios<br />
From the above table the WTP <strong>for</strong> very good quality is higher than <strong>for</strong> good quality, showing<br />
people interest and concern about water quality.<br />
For the first two scenarios characterized by good water quality and a flood frequency decrease<br />
from 25 years (1 st Scenario) to 50 years (2 nd scenario) the difference in WTP is not significant. Also a<br />
decreasing WTP is observed whenever the flood frequency reduces. This can be explained by the fact<br />
that people feel less concerned and are less willing to take responsibility of paying <strong>for</strong> long term results.<br />
The large differences between WTP <strong>for</strong> scenario 1 and 3, and also <strong>for</strong> scenarios 2 and 4 show<br />
that the most stringent <strong>for</strong> the people is water quality, which has an impact on people’s day-to-day life.<br />
At the same time, people are not willing to pay <strong>for</strong> “probable” events like floods, especially when there<br />
are on larger time scales (almost generation periods).<br />
Good<br />
Very good<br />
Whole country 308.5 462.7<br />
Distance correction 91.6 176.4<br />
Distance & income correction 112.8 155.6<br />
Market size (km) * 59 86<br />
* Distance where value reduces to €0.<br />
Table 6: Estimated total economic value (TEV) in million Euros per year <strong>for</strong> good and very good<br />
water quality in Romania based on different aggregation procedures<br />
From the above table we can observe that in Romania the TEV <strong>for</strong> good water quality reduces<br />
by 70 percent when accounting <strong>for</strong> distance-decay. Secondly, accounting <strong>for</strong> distance-decay and income<br />
variation within the boundaries of the market size the TEV increases due to the positive income effects<br />
of a number of large cities near the Danube river (including Bucharest), which more than compensate<br />
<strong>for</strong> the negative impact of distance-decay. However, extending the market size <strong>for</strong> very good water<br />
quality (from 59 to 86 km) and accounting <strong>for</strong> both distance-decay and income effects results in a<br />
similar reduction of the TEV of around 10 percent.<br />
24
5. Conclusions<br />
The study carry in the Braila Islands LTSER site was the first exercise of economic<br />
evaluation in the field of water management using the methodology of CE in Romania. Still, the<br />
little experience held by the Romanian team was compensated by the close coordination and<br />
support of the project leaders. The Romanian team exercise proves once more that economic<br />
evaluation of ERCB is quite a difficult task which requires finances, time and expertise. These<br />
are probably the most important limitations of the valuation process, showing the need of<br />
developing reliable studies and methodologies <strong>for</strong> benefit transfer across river basins.<br />
The study results show that there is a great concern from the local people related to water<br />
quality and that there is no willingness to pay <strong>for</strong> long term results (decrease in flood frequency).<br />
By comparison with the other two Danube basin countries involved in the AquaMoney project<br />
(Austria and Hungary), this situation is not specific to all danubian countries which raises again<br />
the issue of transferability and its limitations.<br />
As people perception related to water quality differs from reality, as people believe that<br />
the quality is worse than it really is, show that there is a great need to in<strong>for</strong>m and communicate<br />
with the general public. Communication can also help decision-makers prioritize the measure<br />
that need to be taken and which are the major aspects that need to be emphasized in the public<br />
consultation process (e.g. water quality rather than floods).<br />
25
6. Best practice recommendations<br />
As monetary valuation methods can provide relevant input <strong>for</strong> decisions related to Article<br />
9 of the WFD and is most likely to play a decisive role is the decision on exemptions on the<br />
grounds of disproportionate costs, the need of developing and explaining the methodologies <strong>for</strong><br />
the economic valuation is crucial. There<strong>for</strong>e in order to avoid any pitfalls the experience gained<br />
in the Aquamoney project might prove to be extremely valuable.<br />
The most important lessons learned by using CE in the present study are related to:<br />
The difficulties of creating a common design <strong>for</strong> an international river basin that will<br />
respect the methodological conditions (avoid attribute correlation), address the<br />
complexity of the socio-ecological systems and tackle the specificity of each country or<br />
river body. A common design that addresses different conditions will lead to making<br />
compromises like eliminating from the design important attributes which are crucial <strong>for</strong><br />
explaining the systems complexity but which can create correlation or are difficult to<br />
explain to the general public in terms that are easily understood by everyone or setting<br />
attribute levels that will correspond to all the countries reference conditions.<br />
Regardless of the software used to produce the experimental design, which was SPSS <strong>for</strong><br />
the Danube case-study, some changes in the choice sets will need to be done in order to<br />
avoid any irrational alternatives. The revision of the choice sets must be done with<br />
extreme care in order not to affect the orthogonality of the experiment. Expertise in the<br />
experimental design is essential <strong>for</strong> the whole study.<br />
The use of pictograms and colors seems to be very useful to explain the water quality<br />
levels to the general sample, but they must be tested <strong>for</strong> all age categories to see if all the<br />
visual elements are easily perceived and understood by the respondents (<strong>for</strong> example<br />
some visual elements can be more difficult to perceive by older population).<br />
The use of maps is helpful first <strong>for</strong> introducing the study area, to present scenarios and to<br />
create awareness among the respond over the fact that the subject of the evaluation (e.g.<br />
restoration project) refers to the area where they live, work, recreate etc. The level of<br />
maps must be carefully tested in order to send all the visual stimuli to the respondents<br />
providing the right level of detail and avoiding the overload of in<strong>for</strong>mation.<br />
As the design is crucial <strong>for</strong> the credibility of the valuation exercise it is important to<br />
allocate enough time and resources to identify the right attributes and their level <strong>for</strong> the<br />
study through focus groups, interviews and pre-testing.<br />
Using face-to-face sampling had the following advantages and disadvantages:<br />
(+)Advantages: good representativeness of the sample <strong>for</strong> the decided criteria (urbanrural<br />
and gender ratios) but also age following the sampling routine; low refuse rates;<br />
easier to convince people to finish the questionnaire; operators had a strong inside of<br />
people’s motivations <strong>for</strong> choosing between alternatives<br />
Disadvantages: difficulties in handling all the additional materials (maps, water quality<br />
letter, payment cards) <strong>for</strong> only one operator; long time <strong>for</strong> applying the questionnaire<br />
(average 35 minutes); could include operator bias; time needed <strong>for</strong> operators debriefing<br />
meetings after each day of field work, a lot of time spent with traveling in different<br />
locations some of them difficult to access due to infrastructure problems.<br />
Finding reliable official data to undertake the socio-economical characterization of the<br />
local population sometimes seems an impossible task. Using older studies can sometimes<br />
help the process of identifying the representativity criteria, but in other situation giving up<br />
to some criteria seem to be the only solution in a study.<br />
26
The time required to fill in a questionnaire in face-to -face surveys (an average of 35<br />
minutes <strong>for</strong> about 35 questions) makes valuation expensive and time consuming.<br />
The time chosen <strong>for</strong> the survey implementation plays an important role. In the Braila<br />
Islands study the survey was implemented in November, which was ideally <strong>for</strong> the rural<br />
areas, when people are not so much involved in agricultural work but it was a problem <strong>for</strong><br />
the operators due to the low temperatures as the surveys were applied on the street.<br />
The use of econometric software can raise problems without the proper training and<br />
expertise.<br />
As conjoint valuation are sometimes dependent on the respondents perception of the real<br />
conditions it is important to thoroughly in<strong>for</strong>m people first about the current situation and<br />
to find suitable explanations <strong>for</strong> the attributes that need to be valued.<br />
Conjoint valuations will always raise questions: How do you know whether respondents<br />
would actually pay what they say they would? How can huge projects’ budgets be<br />
covered from household payments only? How can you make sure that the project results<br />
will mach the expectations of the population? How are the perverse effects of a<br />
policy/project considered in WTP valuations if these are only used to reflect<br />
improvements in the attributes considered <strong>for</strong> the project? These questions are difficult to<br />
address by carrying a one-shot evaluation, there<strong>for</strong>e complementary in<strong>for</strong>mation has to<br />
support the studies results and has to reflect the changes in people’s attitudes and<br />
behavior that appear in time.<br />
People’s awareness is also dependent on the level of dissemination of studies result. The<br />
present study results will be disseminated through the reports sent to the National Water<br />
Authority which will include results in the River Basin Management Plan that will be<br />
subjected to public consultation.<br />
27