Case study report Po Italy - VU University, Institute for Environmental ...
Case study report Po Italy - VU University, Institute for Environmental ...
Case study report Po Italy - VU University, Institute for Environmental ...

You also want an ePaper? Increase the reach of your titles
YUMPU automatically turns print PDFs into web optimized ePapers that Google loves.
Deliverables D41: Pilot case <strong>study</strong> results and D51: Best<br />
practice recommendations from pilot case studies<br />
Pilot <strong>Case</strong> Study <strong>Po</strong> Basin<br />
Author(s) : Meri Raggi, Davide Ronchi, Laura Sardonini, Davide Viaggi<br />
Date February 2009
Contact in<strong>for</strong>mation AquaMoney Partners
Colophone<br />
This <strong>report</strong> is part of the EU funded project AquaMoney, Development and Testing of Practical Guidelines <strong>for</strong> the<br />
Assessment of <strong>Environmental</strong> and Resource Costs and Benefits in the WFD, Contract n o SSPI-022723.<br />
General<br />
Deliverable D41-51<br />
Deadline<br />
Complete reference<br />
Status Author(s): M. Raggi, D.<br />
Ronchi, L. Sardonini, D.<br />
Viaggi<br />
Approved / Released<br />
Reviewed by<br />
Pending <strong>for</strong> Review<br />
Date February 2009 Comments<br />
Date<br />
Second draft<br />
First draft <strong>for</strong> Comments<br />
Under Preparation<br />
Confidentiality<br />
Public<br />
Restricted to other programme participants (including the Commission Service)<br />
Restricted to a group specified by the consortium (including the Advisory Board)<br />
Confidential, only <strong>for</strong> members of the consortium<br />
Accessibility<br />
Workspace<br />
Internet<br />
Paper<br />
Copyright © 2006<br />
All rights reserved. No part of this publication may be reproduced, stored in a retrieval system or transmitted in any <strong>for</strong>m or by any<br />
means, electronic, mechanical, photocopying, recording or otherwise without the prior written permission of the copyright holder.
Content<br />
1. Introduction 1<br />
2. Description of the case <strong>study</strong> 1<br />
2.1 Location of the case <strong>study</strong> area 1<br />
2.2 Water system characteristics 2<br />
2.3 Short characterization of water use and water users 2<br />
2.4 Main water management and policy issues in the context of the WFD 3<br />
2.5 Survey areas: characteristics and motivations 4<br />
3. Survey 1 (Common) - Set up of the survey 4<br />
3.1 Questionnaire design (common) 4<br />
3.2 Sampling procedure and response rate 4<br />
4. Survey 1 (Common) - Valuation results 5<br />
4.1 Respondent characteristics and sample representativeness 5<br />
4.1.1 Demographic characteristics 5<br />
4.1.2 Socio-economic characteristics 6<br />
4.1.3 Water use characteristics 7<br />
4.2 Public perception of water management problems 9<br />
4.3 Estimated economic values <strong>for</strong> water resource management (CVM) 12<br />
4.4 Results of the Choice Experiments (CE) IT1 12<br />
5. Survey 2 - Set up of the survey 15<br />
5.1 Questionnaire design (only <strong>Italy</strong>) 15<br />
5.2 Sampling procedure and response rate 15<br />
5.3 Choice experiment design (attribute and level) 15<br />
6. Survey 2 - Valuation results 17<br />
6.1 Respondent characteristics and sample representativeness 17<br />
6.1.1 Demographic characteristics 17<br />
6.1.2 Socio-economic characteristics 18<br />
6.1.3 Water use characteristics 20<br />
7.1 Public perception of water management problems 21<br />
7.2 Results of the Choice Experiments (CE) IT2 25<br />
7.3 Comparison between sub-basins 26<br />
8. Conclusions 29<br />
9. Best practice recommendations 30<br />
9.1 Organisation 30<br />
9.2 Formulation of the Research Problem and (Valuation) Objective(s) 30<br />
9.3 Determination of the Research Design/Mapping Out of the Valuation Approach 30<br />
9.4 Design of the Valuation Instrument 31<br />
9.5 Design of the Sampling Plan 31<br />
9.6 Administer the Valuation Instrument/Collection of the Data 32<br />
9.7 Prepare Data 32<br />
9.8 Analyse and Interpret the Data 32<br />
9.9 Reporting 32<br />
I
Summary<br />
• This paper <strong>report</strong>s the final results of the AquaMoney pilot case <strong>study</strong> concerning the <strong>Po</strong> Basin. It includes a<br />
description of methodologies and of results of two evaluation exercises per<strong>for</strong>med in the area.<br />
• Each one of the two evaluation exercises include both Choice experiment (CE) and Contingent valuation methods<br />
(CVM) exercises. They differ in terms of basin, sample selection and design. The IT1 survey was located in the subbasin<br />
having as administrative reference the ATO 4, Modena (<strong>Po</strong> Basin), and was per<strong>for</strong>med following the common<br />
design of the Aquamoney scarcity group. The IT2 survey involved a sample split between the <strong>Po</strong> and the Reno<br />
basins and followed a design were allocation of water to the environment is confronted with allocation to economic<br />
sectors.<br />
• The results show a relevant Willingness to pay (WTP) <strong>for</strong> environmental uses of water, with WTP per household and<br />
year up to 140 euro, depending on the range of variation of environmental improvements. However, this relevance is<br />
moderated when confronted with productive uses.<br />
• A tentative testing of scale effects did not allow to identify a clear-cut reaction to scale. Rather, they hint at the idea<br />
that respondents perceived the difference between the two basins and answered consistently with the prevailing<br />
feature of, respectively, the whole and the sub-basin.<br />
• The experience draws also attention to non-monetary in<strong>for</strong>mation arising from the surveys, to the difficulties to<br />
provide an effective common design <strong>for</strong> a very locally specific issue such as water management and to the need to<br />
involve appropriate expertise in the design and implementation of “real world” evaluation exercises.<br />
III
AquaMoney
Deliverables D41: Pilot case <strong>study</strong> results and D51: Best practice recommendations from pilot case studies<br />
1. Introduction<br />
This <strong>report</strong> includes the final results of the AquaMoney pilot case <strong>study</strong> concerning the <strong>Po</strong> Basin.<br />
Chapter 2 to 7 represent the content of deliverable D41, while chapter 8 includes contents of the deliverable D51.<br />
The main objective of the case <strong>study</strong> was to test methodologies <strong>for</strong> the evaluation of components of the full cost of<br />
water services and related best practices <strong>for</strong> evaluation and use of in<strong>for</strong>mation <strong>for</strong> policy purposes.<br />
In the case <strong>study</strong>, two evaluations were per<strong>for</strong>med:<br />
1. Evaluation of water scarcity according to the common design and questionnaire agreed in the water scarcity<br />
group (coded as IT1);<br />
2. Evaluation of water scarcity and preferences <strong>for</strong> sector allocation developed exclusively <strong>for</strong> the Italian case<br />
<strong>study</strong> (coded as IT2).<br />
A detailed description of the Pilot <strong>Case</strong> Study can be found in <strong>Case</strong> Study Status Report <strong>Po</strong> River Basin (D31).<br />
2. Description of the case <strong>study</strong><br />
2.1 Location of the case <strong>study</strong> area<br />
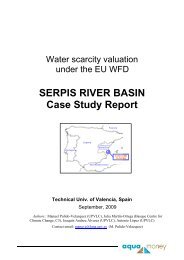
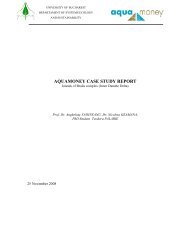
The <strong>Po</strong> river basin is located in the North-West of <strong>Italy</strong>. The basin area is around 74.000 km 2 (40.606 of mountain and<br />
29.372 of plain) with 16 milion inhabitants (Figure 1).<br />
Figure 1: <strong>Po</strong> Basin Area.<br />
As such, the <strong>Po</strong> basin is the widest in <strong>Italy</strong> and characterised by a great variety of soil and climate conditions, as well as<br />
of water uses (from energy production to agriculture use). Due to its dimension, the basin is also split between different<br />
regional authorities (from the administrative point of view) and divided into different sub-basins (from the hydrological<br />
point of view).<br />
1
AquaMoney<br />
2.2 Water system characteristics<br />
Total water resources in the basin amount at 80 billions of m 3 /year. Water abstraction from surface water bodies is<br />
about 25,1 billion cubic meters per year and 5,3 billion cubic meters from groundwater. A detailed water balance can be<br />
found in <strong>Case</strong> Study Status Report <strong>Po</strong> River Basin (based mainly on in<strong>for</strong>mation drawn from Autorità di Bacino del <strong>Po</strong>,<br />
2006).<br />
The river flows are fed by glaciers on the Alps and by rainfall and groundwater on the Appennines. Lakes have an<br />
important role in particular in Lombardia where the main lakes of the basin are located. Groundwater is an important<br />
source throughout the plain area. Delta length is 25 km and its structure is variable in time and in space. In this area<br />
there are wetlands as the dominant feature.<br />
The river flow is characterised by the important pieces of artificial tracts, <strong>for</strong> about 375 km (from Tanaro to <strong>Po</strong> di<br />
Goro). Some sub-basins are used <strong>for</strong> energy production. Artificial reservoirs along all rivers are exploited <strong>for</strong> several<br />
uses (flood control, etc.). CER canal transports water from the <strong>Po</strong> to the neighbouring Reno basin and Romagna basins,<br />
hence connecting the <strong>Po</strong> with the neighbouring South-Eastern basins.<br />
Urban runoff is unmeasured, but important in drought seasons in some areas <strong>for</strong> irrigation. It goes only partially through<br />
wastewater treatments and can cause water quality problems. Wastewater treatment is compulsory in principle, but is<br />
actually absent or hardly working in many important towns. The hydrographic network is affected by flows from<br />
treatment facilities in Emilia Romagna. A big emphasis is given now to water reuse (through incentive policies), though<br />
it is almost irrelevant in practice. Desalinisation is not relevant.<br />
2.3 Short characterization of water use and water users<br />
Table 1 <strong>report</strong>s the water uses and services in the <strong>Po</strong> basin, divided by sector. The main water using sector is agriculture<br />
(46%), followed by industry (20%) and idropower (18%). The household sector uses only 16% of total water use in the<br />
basin. The distribution among different water uses is very heterogeneous in space. For example, the use <strong>for</strong> energy is<br />
almost totally concentrate in the area of the big lakes (Northern of the <strong>Po</strong> river). In the plain area, agriculture uses the<br />
large majority of the water available.<br />
Table 1: Uses and services of water by sector<br />
Sector Distribution Uses & services<br />
Household 16% Drinking, cooking, washing and other household uses<br />
Industry 20% Manufacturing, thermoelectric cooling and others industrial uses<br />
Agriculture 46% Irrigation of crops, livestock watering, aquaculture<br />
Energy 18% Hydroelectric generation power<br />
Recreation and<br />
Irrigation of parks and golf courses, swimming, boating, maintenance of biodiversity,<br />
-<br />
environment<br />
etc.<br />
Driving <strong>for</strong>ces behind the use by sector show diverging trends. <strong>Po</strong>pulation has decreased in the last years, about -1,5%<br />
each year. In many areas, people move from mountains to urban areas, which gives rise to concentration of human<br />
pressure. At the same time, in other areas population flows from city centres to surrounding settlements. The industry<br />
sector is more or less stable, while the total farms number decreases, but those remained increase their dimension.<br />
Irrigable agricultural area is increasing, while irrigated area is decreasing.<br />
The amount of water used <strong>for</strong> recreation and environmental purposes is partly unknown and partly accounted in the<br />
other sectors. The role of water in maintaining ecosystems and environmental services is very important. <strong>Environmental</strong><br />
flow requirements (EFR) are not well defined in <strong>Italy</strong>. In fact, the decree 152/99 underlines the importance of EFR but<br />
there is not an unique criteria: <strong>for</strong> example, in Lombardia the EFR is taken equal to 10% of annual average natural<br />
capacity (Regione Lombardia, 2005). In general there is a EFR deficit between May and September in Emilia Romagna.<br />
Planning documents provide <strong>for</strong> assuring the EFR in 2008 <strong>for</strong> all basin rivers. Given the weak definition and<br />
uni<strong>for</strong>mity, EFR tends to be an important source of conflicts.<br />
2
Deliverables D41: Pilot case <strong>study</strong> results and D51: Best practice recommendations from pilot case studies<br />
In the <strong>Po</strong> basin there are 816 different areas protected under EU and/or <strong>Italy</strong> law (national or local park, etc.). The area<br />
of protected areas is about the 15% of the basin. Many protected areas are characterised by their aquatic environment<br />
(e.g. the <strong>Po</strong> delta).<br />
2.4 Main water management and policy issues in the context of the WFD<br />
Water management issues relate to different problems. Scarcity problems have not been particularly important in the<br />
past, but are now one of the main focus of future scenarios. However, several allocation issues are in the policy agenda,<br />
involving different geographical levels in the <strong>Po</strong> basin. At the higher scale, there is an issue of distribution of<br />
quantitative water rights among different Regions. A larger amount of water is used by upstream regions (Piemonte,<br />
Lombardia). Along rivers streaming from the Alps, the right to retain water in dams <strong>for</strong> electricity is an important issue,<br />
particularly during summer. A property right issue is water abstraction from wells. Though in principle groundwater<br />
should be public property subject to concession, in practice a large number of wells is unregulated.<br />
Scarcity is also a seasonal issue as in the summer a lot of areas suffer droughts; the lack of snow and rainfall during<br />
winter and/or autumn has increased this problem in recent years, also reducing the natural and artificial stocks (glaciers,<br />
lakes). <strong>Po</strong>licies under consideration include artificial reservoirs.<br />
Water use efficiency is an issue, also in relation to water scarcity problems. The main concerns regard in house misuses,<br />
percolation and evaporation from canals and leakage from pipes, as well as excessive water use in agriculture. <strong>Po</strong>licy<br />
actions concerns in<strong>for</strong>mation, infrastructure renovation and diffusion of water saving technologies.<br />
Main quality problems appear in between two regions: Emilia-Romagna and Lombardia (Parma, Panaro Lambro and<br />
Olona, rivers), due to the bad quality of Lambro-Olona river (considered HMWB in according to the WFD definition),.<br />
Lombardia is also responsible of a large share of pollution, which affects downstream regions and the Adriatic sea.<br />
Downstream effects of pollution along the coast are a cause of major concern due also to the touristic relevance of the<br />
Adriatic sea area (Massarutto et al. 2007 RVEBP).<br />
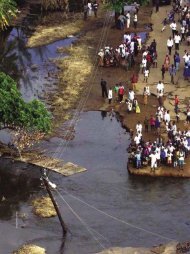
Flood risk issues are historically of paramount importance in the basin. Traditionally they include flood defence in the<br />
lower <strong>Po</strong> valley, during exceptional rainfall event. However, also floods in the bottom part of mountain valley have<br />
become an issue following urbanisation. Several disasters mark the area.<br />
The coastal area is deeply affected by the problem of subsidence. This is partly related to the gas abstraction made<br />
around years ’40s-’50s. Presently the main cause is groundwater abstraction. Subsidence produced problems related the<br />
reclamation actions, flooding and harbour infrastructures (Autorità di Bacino, 2006).<br />
Presently, the WFD is not implemented in <strong>Italy</strong>. The Italian government approved the decree 152/2006 that<br />
implemented the WFD, but it was basically stopped at the end of 2006 (decree 284/2006 that established to maintain the<br />
previous situation). At the moment, water issues are regulated by a number of laws, but mainly by decree 152/1999.<br />
Main responsibilities are centralised and delegated to regions. As a consequence, each region may produce its own laws<br />
and provinces have their responsibilities in local implementation.<br />
However, basin authorities exist, dealing mainly with flood control and general water concessions. There is not a<br />
hierarchy between regional administration and basin authorities.<br />
ATO (Ambiti Territoriali Ottimali), are in charge of water distribution <strong>for</strong> human consumption and industrial use.<br />
Reclamation and irrigation boards are responsible <strong>for</strong> land reclamation, (local) flood control and distribution of<br />
irrigation water.<br />
The present institutional framework is undergoing major changes which result is still unclear. ATO have been recently<br />
abolished. Also Regional administration have the possibility to abolish irrigation boards, though this would mostly<br />
result in a “simple” restructuring of the irrigation boards.<br />
Key planning documents are PTA (Water Protection Plan) made by the regions and the BP (Basin Plan) made by the<br />
Basin authorities.<br />
The existing laws already mentioned cost-benefit studies as a desirable tool to support decision making, particularly <strong>for</strong><br />
very important issues. On this basis and anticipating the WFD, some regions are including economic studies within their<br />
planning documents, mainly in relation to very specific and localised problems. References are in<strong>for</strong>mally made to<br />
WFD-related documents (e.g. WATECO).<br />
However, to date, a comprehensive economic analysis of water use related to the <strong>Po</strong> basin has not been done yet. There<br />
are some specific and local analyses done by some regions and <strong>report</strong>ed in their PTA. The available economic analyses<br />
are usually based on an analysis of cost <strong>for</strong> water provision and treatment. In some areas, e.g. Lombardia region, a<br />
3
AquaMoney<br />
“full” cost <strong>for</strong> water has been calculated taking into account depreciation costs of new infrastructures. This in<strong>for</strong>mation<br />
is generally used to allow a rough evaluation of cost recovery. Resource and environmental costs are mentioned in some<br />
documents (e.g. PTA Piemonte), though the origin of their calculation is unclear.<br />
2.5 Survey areas: characteristics and motivations<br />
The IT1 survey was located in the sub-basin having as administrative reference the ATO 4, Modena. The area is located<br />
in the extreme south of the <strong>Po</strong> Basin (Figure 2). The sub-basin area is about 3000 km 2 (60% mountain and 40% plain)<br />
with about 670000 inhabitants. In this area there are three main rivers (Secchia, Panaro and Enza) flowing from southwest<br />
to north-east and flow in the <strong>Po</strong> river.<br />
Figure 2: <strong>Po</strong> Basin Area and in detail the Modena area.<br />
Several reasons justify the choice of this area:<br />
1. The area is the one with the highest scarcity problems in the whole <strong>Po</strong> basin; scarcity concerns in particular the<br />
highest part of the plain area at the foot hill of Apennines.<br />
2. Scarcity problems reflect substantially also in quality issues; the main conflicts arise during summer between<br />
agriculture and the environmental uses.<br />
3. The location was convenient <strong>for</strong> the interviewers; in fact the distance between Bologna and Modena is only<br />
about to 50km.<br />
The IT2 survey was conducted partly in the area of <strong>Po</strong> basin and partly in an area of the neighbouring Reno basin. The<br />
choice of this area was driven by the following reasons:<br />
1. It allows to compare the perception of water issues in the <strong>Po</strong> basin and in another basin, heterogeneous as<br />
regards water management problems, but similar in terms of socio-economic context.<br />
2. The location of the Reno basin was also convenient <strong>for</strong> the interviewers (Bologna is included in the basin).<br />
The partial overlapping among the two surveys (IT1 and IT2) also allows some comparison of the results under two<br />
different design.<br />
3. Survey 1 (Common) - Set up of the survey<br />
3.1 Questionnaire design (common)<br />
This evaluation is based on the use of CE to estimate the environmental value of quantitative water uses and the<br />
willingness to pay to reduce the risks of water shortages. This survey followed the Common questionnaire and Common<br />
design of the CE proposed by the Group on water scarcity within the AquaMoney consortium.<br />
3.2 Sampling procedure and response rate<br />
The survey was made using face to face interviews in Modena with a response rate equal to 17% (242 respondents out<br />
of 1381 people contacted). We started the survey at the beginning of July 2008 but we stopped because of the rain<br />
4
Deliverables D41: Pilot case <strong>study</strong> results and D51: Best practice recommendations from pilot case studies<br />
(submitting questions about water scarcity during rainy period was not taken seriously by respondents). In August it<br />
was impossible to continue because the most part of families went on holiday so the survey was conducted during the<br />
first half of September. The survey realization was difficult because of the length of the questionnaire (more than 20<br />
minutes). In addition, other problems depend on the lack of available time of people (work, shopping, etc.), the distrust<br />
of people to answer to questions and a large presence of <strong>for</strong>eigners (difficulties to understand questions) and people<br />
outside the basin.<br />
4. Survey 1 (Common) - Valuation results<br />
4.1 Respondent characteristics and sample representativeness<br />
4.1.1 Demographic characteristics<br />
The sample is balanced as <strong>for</strong> sex, with a presence of 60% of male and 40% of female. The population distribution in<br />
<strong>Italy</strong> show a larger presence of female (51.4%, Istat 2005). The average age in the sample is 40.4 years and the median<br />
age is 36. In the sample, we have a large group under 45 years old (63%); this depends on the fact that 23.1% of<br />
interviewees are students. The age distribution is presented in Table 2<br />
Table 2: Age distribution in intervals.<br />
Age % Age %<br />
65 11.20%<br />
35-45 14.52% - 0.00%<br />
45-55 14.94% Tot 100.00%<br />
The joint distribution of sex and age shows how the sample is balance enough (see Table 3):<br />
Table 3: Joint distribution of age and sex.<br />
Sex<br />
Age Male Female Tot.<br />
=65 16 11 27<br />
- 1<br />
Tot 142 99 242<br />
Here, we investigate the family structure. In the sample there are 177 families without ‘under 18’ people and the median<br />
value of number of people per family is 3. The 9.5% of sample are single and only the 26.8% of families have one or<br />
more ‘under 18’. In Table 4 it is shown the joint distribution between the number of ‘under 18’ and the number of<br />
household members.<br />
Table 4: Family structure: joint distribution between under 18 and number of household members<br />
Number of people<br />
Under 18 1 2 3 4 5 6 7 - Tot<br />
0 23 53 43 46 7 1 1 3 177<br />
1 1 24 13 9 47<br />
2 1 12 2 2 17<br />
5
AquaMoney<br />
3 1 1<br />
Tot 23 54 68 71 19 3 1 3 242<br />
4.1.2 Socio-economic characteristics<br />
Socio-economic characteristics investigated are: education level, job and family income. In <strong>Italy</strong> the education system is<br />
composed by four steps (primary, junior high school, secondary and university). The higher education level completed<br />
is the secondary school in most cases. A large part of older people have completed only the primary school, while the<br />
youngest have completed the secondary and/or university (Table 5).<br />
Table 5: Joint distribution of age and education level<br />
Age<br />
primary<br />
junior high<br />
school<br />
education level<br />
secondary university - Tot<br />
65 18 5 2 2 27<br />
no<br />
answer 1 1 2<br />
Tot 23 44 104 70 1 242<br />
The 23.1% of people are students and 16.1% retired; this fact depends on that in these classes people have more free<br />
time so it is more frequent to meet them in the street. The higher job frequency is <strong>for</strong> the employers in the service sector<br />
(29.3%) and factory workers (12.0%). Fisherman category is not present. However, the classification procedure was<br />
difficult because some work categories were not clear <strong>for</strong> respondents (i.e. free lancers are classified in the service<br />
sector so the class percentage increases). In the <strong>report</strong>, the low percentage of some worker classes (such as employed in<br />
tourism sector, health care sector) is caused by difficulty to identify these categories during the day, in the working<br />
hours (Table 6).<br />
Table 6: Job distribution<br />
Job Tot %<br />
Unemployed/looking <strong>for</strong> work 5 2.1<br />
Farmer 2 0.8<br />
Employed in the tourism sector (hotel, restaurant, camping etc.) 4 1.7<br />
Employed in the service sector (bank, administrator, etc.) 71 29.3<br />
Employed in the industry sector (factory worker) 29 12.0<br />
Employed in the health care sector 6 2.5<br />
Employed in the education sector 14 5.8<br />
Retired 39 16.1<br />
Student 56 23.1<br />
Housewife/man 14 5.8<br />
Other 2 0.8<br />
Tot 242 100.0<br />
6
Deliverables D41: Pilot case <strong>study</strong> results and D51: Best practice recommendations from pilot case studies<br />
In the question about annual income per household, only 25 people refused to answer. The higher annual income<br />
frequency is the interval C. The monthly amount, presented in Table 7 (and also in the questionnaire), was an help to<br />
people in the computation of the family income. The annual average income is 18,248€/year, equal to 1,520 €/month.<br />
Table 7: Family income distribution<br />
Total annual income <strong>for</strong> household<br />
J less than € 6,000 per year (less than 500€ month) 24<br />
H € 6,000 – 12,000 per year (500 –1000€/ month) 34<br />
C € 12,000 – 18,000 per year (1000-1500€/month) 60<br />
S € 18,000 – 24,000 per year (1500-2000€/month) 44<br />
X € 24,000 – 30,000 per year (2000-2500€/month) 30<br />
N € 30,000 – 36,000 per year (2500-3000€/month) 15<br />
A € 36,000 – 42,000 per year (3000-3500€/month) 4<br />
F € 42,000 – 48,000 per year (3500-4000€/month) 3<br />
L € 48,000 – 54,000 per year (4000-4500€/month) 2<br />
R more than € 54,000 per year (more than 4500€/month) 1<br />
no answer 25<br />
Tot 242<br />
Table 8 <strong>report</strong>s the joint distribution of annual income per household and education level. As expected, high education<br />
level corresponds to higher income levels even if the mean income level is quite low (this likely depends on the distrust<br />
of people in revealing their true income).<br />
Table 8: Joint distribution of annual income per household and education level<br />
Total annual income per household<br />
primary<br />
junior high<br />
school<br />
Tot<br />
Education level<br />
secondary university -<br />
J less than € 6,000 per year (less than 500€ month) 1 4 10 9 24<br />
H € 6,000 – 12,000 per year (500 –1000€/ month) 13 11 8 2 34<br />
C € 12,000 – 18,000 per year (1000-1500€/month) 7 13 27 13 60<br />
S € 18,000 – 24,000 per year (1500-2000€/month) 1 4 22 17 44<br />
X € 24,000 – 30,000 per year (2000-2500€/month) 3 13 13 1 30<br />
N € 30,000 – 36,000 per year (2500-3000€/month) 3 6 6 15<br />
A € 36,000 – 42,000 per year (3000-3500€/month) 1 2 1 4<br />
F€ 42,000 – 48,000 per year (3500-4000€/month) 2 1 3<br />
L € 48,000 – 54,000 per year (4000-4500€/month) 1 1 2<br />
R more than € 54,000 per year (more than 4500€/month) 1 1<br />
no answer 1 5 12 7 25<br />
Tot 23 44 104 70 1 242<br />
Tot<br />
4.1.3 Water use characteristics<br />
The most part (61%) of people do not currently practice water recreation activities. The large part (61%) of the<br />
respondents do not practice any recreational activities (Table 9).<br />
Table 9: Water users<br />
Water Users Tot<br />
No 148<br />
Yes 94<br />
Tot 242<br />
7
AquaMoney<br />
The question about activities carried out is multiple so we obtain several answers. In the sample (Table 10), walking<br />
(57) results the most frequent water-related recreation activity, then fishing (28), pic-nic (20) and swimming (19).<br />
Table 10: Activities<br />
Activities Tot Activities Tot<br />
bird-watching 3 walking 57<br />
pic-nic 20 hunting 9<br />
swimming 19 boating 1<br />
Fishing 28 other 9<br />
Activities are taken near rivers (61.70% of people) or lakes (15.96%) and creek s(15.96%) (Table 11).<br />
Table 11: Water body<br />
Water body<br />
Tot<br />
River 58<br />
Creek 15<br />
Lake 15<br />
Estuary 1<br />
Other 4<br />
- 1<br />
Tot 94<br />
The 81% of respondents practice water recreation activities in a distance equal or less than 30 km from their home. The<br />
nearest water bodies are rivers or/and creeks (Table 12 and Table 13).<br />
Table 12: Distance between house and the water bodies<br />
Table 13: Joint distribution of distance and water bodies<br />
Km<br />
Tot<br />
=100 4<br />
no answer 15<br />
Tot 242<br />
Distance km<br />
Water - =100 Tot<br />
body used<br />
River 1 19 18 16 2 2 58<br />
Creek 1 2 5 4 3 15<br />
Lake 2 3 3 6 1 15<br />
Estaury 1 1<br />
Other 1 2 1 4<br />
no answer 1 1<br />
Tot 2 24 28 25 11 4 94<br />
People that remember the water bill amount are 123 (50.83%), people that do not remember the water bill amount are<br />
112 (46.28%) and only 7 (2.89%) do not have a water bill. The bill distribution is presented in Table 15.<br />
8
Deliverables D41: Pilot case <strong>study</strong> results and D51: Best practice recommendations from pilot case studies<br />
Table 14: Distribution of people who remember or not the water bill<br />
Bill Tot %<br />
I don’t have a water bill 7 2.89<br />
I don’t remember 112 46.28<br />
Remember amount 123 50.83<br />
Tot 242 100.00<br />
Most often, young people do not remember the annual amount of the water bill (Table 15) because parents pay the bill.<br />
Table 15: Bill and age distribution<br />
Bill<br />
Age no bill not remember remember Tot<br />
65 6 21 27<br />
no answer 1 1<br />
Tot 7 112 123 242<br />
The average annual water bill is about 250€, although with a wide variability range (Figure 3). The mean value results<br />
higher than the reality probably because of the people payment perception.<br />
Figure 3: Annual bill distribution in intervals<br />
4.2 Public perception of water management problems<br />
In this part we ask about the three most important general problems in the respondents area.<br />
In Table 16 we present the most frequently problems mentioned. The most frequent problems are: economic problems,<br />
safety/crime and traffic. These items represent the most evident and observable problems in <strong>Italy</strong>.<br />
In the sample there are few people that mention environment/water problems as one of three most important problems.<br />
9
AquaMoney<br />
Table 16: The most important problems<br />
First Problem Freq Second Problem Freq Third Problem Freq<br />
economic problem 48 economic problem 38 economic problem 24<br />
safety/crime 32 traffic 36 safety/crime 23<br />
traffic 28 safety/crime 36 traffic 16<br />
pollution 27 politcs/policy 18 social problems 14<br />
social problems 18 pollution 17 pollution 13<br />
labour/unemployment 16 social problems 17 other 13<br />
Immigration 14 labour/unemployment 13 politcs/policy 13<br />
politcs/policy 12 immigration 12 immigration 10<br />
other 11 other 11 environment/water 7<br />
environment/water 11 environment/water 9 labour/unemployment 6<br />
public<br />
transport/infrastructure<br />
6<br />
public<br />
transport/infrastructure<br />
4 climate change 5<br />
drug 4 climate change 3 drug 3<br />
climate change 3 drug 2<br />
public<br />
transport/infrastructure<br />
no answer 12 ageing 2 no answer 93<br />
no answer 24<br />
Tot. 242 242 242<br />
2<br />
The second question of the survey is about the importance of environmental issues. A very large frequency (92.15%)<br />
considers important/very important the environment, in spite of the fact that this seems to contradict the answer to the<br />
first question (Table 17). This should suggest a cautious evaluation of the importance given to the environment when<br />
this is known to be the issue why people are interviewed and that protecting the environment is somehow an obvious<br />
commitment.<br />
Table 17: <strong>Environmental</strong> importance<br />
Importance of environment<br />
Tot<br />
Not important 0.83%<br />
Not important/not unimportant 6.61%<br />
Important 50.00%<br />
Very important 42.15%<br />
Don't know 0.41%<br />
After the importance of environmental issues, it is requested the perception of water scarcity problems. In the Table 18<br />
it is shown that the problems in most cases are not considered as relevant.<br />
Table 18: Perception of scarcity problems<br />
Perception %<br />
Not a problem at all 14.46%<br />
Not a problem 30.58%<br />
Somewhat of a problem 31.82%<br />
A problem 15.70%<br />
A big problem 5.37%<br />
Don't know 2.07%<br />
10
Deliverables D41: Pilot case <strong>study</strong> results and D51: Best practice recommendations from pilot case studies<br />
In the questionnaire, the perception of a relation between environmental quality and water scarcity is asked and the<br />
61.5% believe that environmental situation/condition is affected by water scarcity problem. Table 19 shows the number<br />
of people that have suffered water restrictions, due to several reasons, in the last 10 years. Only 29% of people have<br />
really suffered restrictions in the last 10 years. The stated causes of restrictions do not represent specific water scarcity<br />
problems in the area, such as <strong>for</strong> example water pipes problems.<br />
Table 19: Restrictions in water uses<br />
Restrictions<br />
My household never experienced any water use restrictions<br />
due to limited water availability<br />
Tot<br />
171<br />
My private well ran low on water 1<br />
Households in my area were prohibited from using water<br />
<strong>for</strong> certain types of uses such as washing cars, watering<br />
gardens, and so on.<br />
42<br />
Households in my area had water pipe cuts in the past 23<br />
Households in my area were prohibited from using tap<br />
water due to water pollution<br />
In<strong>for</strong>mation campaigns were organized to voluntarily<br />
reduce water consumption<br />
8<br />
40<br />
no answer 71<br />
In spite of this the perception of future restrictions is high, in fact 48% of people believe that in the future they will<br />
experience water restrictions, while 25% of people don’t know (Table 20).<br />
Table 20: Perception of water restriction in the future<br />
Restrictions in the future Tot<br />
No, definitely not 29<br />
No, probably not 38<br />
Don’t know/not sure 59<br />
Yes, probably 100<br />
Yes, definitely 16<br />
Beside question on the perception, we asked how is the expected frequency of restriction in the next 10 years. As<br />
expected, people who had suffered in the past expect to have restriction in the future (see Table 21).<br />
11
AquaMoney<br />
Table 21: Joint distribution: restriction in the future and expected years of restrictions<br />
Restrictions in the future<br />
Years of restriction in the<br />
next 10 years no, definitely not no, probably not don’t know/not sure yes, probably yes, definitely Tot<br />
1 13 13<br />
2 15 15<br />
3 21 3 24<br />
4 14 1 15<br />
5 28 6 34<br />
6 3 2 5<br />
7 2 2<br />
8 1 1<br />
10 6 1 7<br />
do not answer 29 38 67<br />
- 59 59<br />
Tot 29 38 59 100 16 242<br />
4.3 Estimated economic values <strong>for</strong> water resource management (CVM)<br />
In the Italian version of the questionnaire we also asked the maximum willingness to pay to have the best attributes<br />
level. In Table 22 the willingness to pay <strong>for</strong> the two attributes are derived as the average given by all respondents. The<br />
value of the willingness to pay is lower than values found in literature. In the previous parts of the questionnaire the<br />
importance about environmental problems results high but when we ask to translate words in money people are<br />
dubious. More than 15% of people are not willing to pay <strong>for</strong> measures to ensure the best level <strong>for</strong> the attributes. People<br />
giving wtp show a mean value equal to 36.04 €/year per household <strong>for</strong> environmental improvement and 34.44 €/year <strong>for</strong><br />
external water restriction.<br />
Table 22: Willingness to pay derived from CVM<br />
<strong>Environmental</strong><br />
improvement<br />
External household<br />
water restriction<br />
Mean<br />
(€/household)<br />
Median<br />
(€/household)<br />
Sd Frequency wtp =0<br />
36.04 30 39.37 16.20%<br />
34.44 25 44.87 18.30%<br />
Tot 70.19 52.5 79.83 14.90%<br />
4.4 Results of the Choice Experiments (CE) IT1<br />
In this section, we analyse results derived from the Choice Experiment method.<br />
In spite of the fact that the design, following the literature, tried to keep an easy understanding of the pictures and of the<br />
trade-offs involved, in our case many respondents had a not easy understanding of the mechanism of CE. The choice<br />
process was not simple <strong>for</strong> respondents and this represents one of the reason <strong>for</strong> the length of the survey. In fact the<br />
large part of time was spent to clarify attributes meanings and example card to interviewees. Difficulties arise because<br />
of the attributes definition and the status quo which is very far from reality.<br />
Be<strong>for</strong>e analysing the CE results, we propose in Table 23 the joint distribution between the status quo choices related to<br />
the credibility perception of the all scenarios presented. When people believe in the scenarios then they choose more<br />
frequently the status quo.<br />
12
Deliverables D41: Pilot case <strong>study</strong> results and D51: Best practice recommendations from pilot case studies<br />
Table 23: Joint distribution of status quo choice in the card and scenario credibility<br />
not credible<br />
at all<br />
not<br />
credible<br />
somewhat<br />
credible<br />
credible<br />
very<br />
credible<br />
don’t know<br />
CARD 1 2.89% 7.44% 8.26% 5.37% 0.00% 5.79%<br />
CARD 2 2.48% 5.37% 7.02% 4.55% 0.00% 3.31%<br />
CARD 3 2.89% 4.96% 2.89% 4.55% 0.00% 4.13%<br />
CARD 4 2.48% 6.20% 3.72% 4.96% 0.83% 5.79%<br />
The statistical analysis, using the MNL model, gives the results in Table 24 and Table 25.<br />
Table 24: Parameter estimates considering only the good characteristic<br />
Variable B WTP<br />
<strong>Environmental</strong> improvement<br />
sufficient<br />
<strong>Environmental</strong> improvement<br />
good<br />
<strong>Environmental</strong> improvement<br />
very good<br />
External household water<br />
restriction<br />
Sd<br />
0.869 62.07 0.212 0<br />
1.674 119.57 0.208 0<br />
1.9 135.71 0.228 0<br />
Sig<br />
0.015 1.07 0.062 0.804<br />
Bill -0.014 / 0.002 0<br />
ASC -1.153 / 0.075 0<br />
The analysis shows that people are willing to pay <strong>for</strong> an environmental improvement, in fact the estimate are significant<br />
and positive. In particular they pay to increase from the poor environmental status to another one and the amount is<br />
given in the second column in<br />
Table 24.. The amount increases when the level of improvement increases, though the increases are non-linear. The<br />
estimate <strong>for</strong> the external household water restriction is positive but not significant. The ASC is negative and significant.<br />
Table 25: Model fitting in<strong>for</strong>mation<br />
Model<br />
Model fitting<br />
criteria<br />
- 2Log<br />
Likelihood<br />
Intercept only 469.436<br />
Likelihood Ratio Tests<br />
Chi-Square df Sig.<br />
Final 276.689 192.75 5 0<br />
Including the individual characteristics (Table 26 and Table 27), we obtain that the individual characteristics are not<br />
significant. As in the previous model, the estimate <strong>for</strong> the environmental improvement is positive and significant but the<br />
estimate <strong>for</strong> the external household water restriction is negative and not significant so people are not interested in<br />
avoiding restrictions on their external uses of water.<br />
13
AquaMoney<br />
Table 26: Parameter estimates considering individual characteristics<br />
Importance of<br />
environmental<br />
problems<br />
Variable B WTP Sd Sig<br />
Bill -0.015 / 0.002 0<br />
ASC -1.094 / 0.322 0.001<br />
<strong>Environmental</strong><br />
improvement<br />
sufficient 1.148 76.53 0.229 0<br />
<strong>Environmental</strong><br />
improvement good 1.84 122.66 0.224 0<br />
<strong>Environmental</strong><br />
improvement very<br />
good 2.062 137.46 0.247 0<br />
External household<br />
water restriction -0.076 / 0.067 0.254<br />
Members 0 / 0.043 0.994<br />
Child 0.001 / 0.079 0.988<br />
Education 0.001 / 0.058 0.984<br />
Income 0 / 0 0.925<br />
Sex -0.012 / 0.091 0.899<br />
Age 0 / 0.003 0.942<br />
Not important 0.003 / 0.454 0.994<br />
Not<br />
important/important -0.014 / 0.204 0.044<br />
Important -0.004 / 0.093 0.964<br />
Very important /<br />
Table 27: Model fitting in<strong>for</strong>mation considering individual characteristics<br />
Model<br />
fitting<br />
criteria<br />
Likelihood Ratio Tests<br />
Model<br />
- 2Log<br />
Likelihood<br />
Intercept only 2919.61<br />
Chi-Square df Sig.<br />
Final 2768.383 151.23 14 0<br />
The survey was carried out with two subsamples, each one using a different reference basin, described trough a<br />
different map. A subsample was showed the map of the whole <strong>Po</strong> basin, while the other was shown the sub-basin of<br />
ATO4 (Modena-Reggio).<br />
The results of the CE <strong>for</strong> the two subsamples are illustrated in Table 28. The results <strong>for</strong> the small sub-basin show a<br />
higher WTP <strong>for</strong> the shift from poor water quality level to the sufficient level, contrary to expectations. The contrary<br />
happens <strong>for</strong> the shift to the higher level.<br />
The result do not allow to identify a clear scale effect. Rather, they hint at the idea that respondents perceived the<br />
difference between the two basins and answered consistently with the prevailing feature of, respectively, the whole and<br />
the sub-basin. In addition, the highest commitment to pay <strong>for</strong> the area close to the pace of living seems to prevail on the<br />
expectation that a higher basin would induce a higher WTP.<br />
14
Deliverables D41: Pilot case <strong>study</strong> results and D51: Best practice recommendations from pilot case studies<br />
Table 28: Comparison of subsample with different basin size<br />
<strong>Po</strong><br />
Mo-Re<br />
B wtp Sig. B wtp Sig.<br />
Intercept -0.944 / 0 -1.369 / 0<br />
External household water<br />
restriction -0.113 / 0.23 0.132 9.43 0.112<br />
Bill -0.014 0 -0.014 0<br />
<strong>Environmental</strong><br />
improvement very good 2.009 143.50 0 1.866 133.29 0<br />
<strong>Environmental</strong><br />
improvement good 1.686 120.43 0 1.712 122.29 0<br />
<strong>Environmental</strong><br />
improvement sufficient 0.662 47.29 0.042 1.12 80.00 0<br />
5. Survey 2 - Set up of the survey<br />
5.1 Questionnaire design (only <strong>Italy</strong>)<br />
The second questionnaire is based on one of the previous version of the common design questionnaire; in particular we<br />
referred to November/December version as the starting point. For this reason, several questions in the questionnaire are<br />
the same or similar of the final common questionnaire and it is possible to use the two surveys <strong>for</strong> comparison. The<br />
main difference regards the attributes definition. In fact, in this second survey, we focus on water in the environment<br />
and the allocation between economic sectors (agriculture, energy, industry). This is because, in the <strong>Po</strong> area, scarcity is<br />
more a matter of allocation among sectors than absolute scarcity (at least <strong>for</strong> the time being).<br />
The rationale behind this design is to try to elicit the social component of water use value associated to different sectors.<br />
Hence, the values estimated, do not intend to substitute the private value of water use (e.g. <strong>for</strong> agriculture), but rather<br />
the public component of the total economic value associated to each sector.<br />
5.2 Sampling procedure and response rate<br />
The survey procedure was made using face to face interviews in cities of <strong>Po</strong> and Reno basins. We started the survey at<br />
the beginning of February 2008 and finished in June. The interviews were conducted by students of the Faculty of<br />
Agriculture of the <strong>University</strong> of Bologna. Each student had to interview people distributed in different age classes such<br />
as to have a representative sample distribution.<br />
Results are shown at an aggregated level to have general in<strong>for</strong>mation of the sample. However, in the section 7.3 we give<br />
some element <strong>for</strong> a comparison of results between the sub-basins. In particular the basins are <strong>Po</strong> (159 interviewees) and<br />
Reno-Romagna (191 interviewees divided in Reno 158 and Romagna 33). The decision to divide the sample depends on<br />
the possibility to maintain two groups geographically close and with substantially the same characteristics.<br />
5.3 Choice experiment design (attribute and level)<br />
The choice experiment design (attributes and levels) in the IT2 questionnaire is different respect to the IT1 version.<br />
Design is composed by three different attributes with several levels. In the following a brief explanation and overview<br />
of attributes is given.<br />
The first attribute (water in environment) is related to the redistribution of the total actually used water. In particular, a<br />
reduction in the actual uses of the economic sectors (except the civil sector because it is guaranteed by law) is assumed,<br />
consequence of the assumption is the increasing of the water quantity left in the environment (rivers, lakes, ect.).<br />
<strong>Po</strong>ssibility of water quantity increasing in the environment entails a series of social benefits such as improvement of the<br />
biodiversity and aquatic ecosystem (environmental flow requirements - EFR), improvement of the water quality as<br />
consequence of a minor concentration of pollutant substance, increase of water recreation activities opportunity (e.g.<br />
15
AquaMoney<br />
fishing, boating, etc.), reduction of the subsidence, etc. The levels proposed <strong>for</strong> this attribute are express in percentage,<br />
as: +1,5%, +3% and +6% of increase of water in the environment, that correspond to a reduction of -2,5%, -5% and -<br />
10% of the actual economic uses (the relation between increase of water and reduction of uses originates from the data<br />
of the river basins). The attributes and levels are summarized in the Figure 4.<br />
Figure 4: Overview of attributes and levels correspondent of the choice experiment<br />
The second attribute is related to the choice of guaranteeing one of the economic sectors (between agricultural,<br />
industrial and energetic) from the water reduction specified in the first attribute. In this situation, the sector chosen uses<br />
are guaranteed and the reduction is attributed to the other two economic sectors, based on the actual uses. In this<br />
attribute the sectors to guarantee are:<br />
- Agricultural: guaranteeing the agriculture means to divide equally the reduction between industrial (50%) and<br />
energy (50%) sector;<br />
- Industrial: guaranteeing the industry means to divide the reduction between agricultural (75%) and energy<br />
(50%) sector;<br />
- Energy: guaranteeing the energy means to divide the reduction between agricultural (75%) and industrial<br />
(50%) sector.<br />
The percentage previously mentioned derives from the actual distribution of the uses among sectors (agriculture uses<br />
actually a quantity of water equal to three time that used by industry and three time that used by idropower generation).<br />
The third attribute is the payment required <strong>for</strong> the two previous attributes and it consists in an increasing of the<br />
household annual water bill. The levels of increasing of the water bill are: 10, 30, 40, 60, 70, 90, 120, 150 and 180<br />
€/year. The interviewee can express his preference, into a card, between two scenarios (each composed by three<br />
attributes), or eventually opt <strong>for</strong> the status quo (which is to maintain the present situation). In the status quo scenario the<br />
distribution and uses remains constant, the sector guaranteed after the civil is the agricultural (although not all the crops<br />
are guaranteed, such as <strong>for</strong> example the arable crops) and the annual water bill does not suffer variations.<br />
In the questionnaire there are 4 cards with different levels <strong>for</strong> each attribute (see the example card in the Figure 5)<br />
Figure 5: Example card<br />
16
Deliverables D41: Pilot case <strong>study</strong> results and D51: Best practice recommendations from pilot case studies<br />
6. Survey 2 - Valuation results<br />
6.1 Respondent characteristics and sample representativeness<br />
6.1.1 Demographic characteristics<br />
The sample size is 350 interviewes in the two sub-basins. The sample is balanced as <strong>for</strong> sex, with a presence of 54% of<br />
male and 45% of female (1% is missing). The sex distribution shows a larger presence of male respect to the <strong>Italy</strong> sex<br />
distribution. The average age in the sample is 48.4 years and the median age is 48. The age distribution is presented in<br />
Table 29 and it is balanced between the different classes of age even if the classes 35-45 and 45-55 are about half of the<br />
sample.<br />
17
AquaMoney<br />
Table 29: Age distribution in intervals.<br />
Age % Age %<br />
65 13.43%<br />
35-45 28.57% - 0.57%<br />
45-55 20.29% Tot 100.00%<br />
Table 30 shows the joint distribution of age and sex.<br />
Table 30: Joint distribution of age and sex.<br />
Sex<br />
Age Male Female - Tot.<br />
=65 30 17 47<br />
- 1 1 2<br />
Tot 189 158 3 350<br />
The family structure (Table 31), shows that half of the interviewees have at least one child ‘under 18’, in particular 100<br />
have one and 60 have more than one ‘under 18’. The remaining 190 families do not include ‘under 18’ people. The<br />
median of the number of people per household is 3. These data respect the mean Italian statistics.<br />
Table 31: Family structure<br />
Number of people<br />
Under 18 0 1 2 3 4 5 6 7 - Tot<br />
0 1 21 66 57 27 15 3 190<br />
1 3 45 32 14 5 1 100<br />
2 4 39 6 2 51<br />
3 6 1 7<br />
- 1 1 2<br />
Tot 1 21 69 107 98 41 11 1 1 350<br />
6.1.2 Socio-economic characteristics<br />
Socio economic characteristics investigated are: educational level, job and family income. The higher education level<br />
completed by the respondent is the secondary school in most cases (see Table 32). A large part of older people have<br />
completed only the primary school or junior high school, while the younger have completed the secondary and/or<br />
university (first level of Italian university).<br />
18
Deliverables D41: Pilot case <strong>study</strong> results and D51: Best practice recommendations from pilot case studies<br />
Table 32: Age and education level<br />
education level<br />
junior<br />
high<br />
Age no education primary school secondary university Other - Tot<br />
65 1 17 17 8 4 47<br />
- 1 1 2<br />
Tot 2 23 75 166 78 3 3 350<br />
Table 33 shows family income distribution. At this question only 34 interviewees (9.7%) refused to answer. The most<br />
frequent classes of family income are 24,000–30,000 and 30,000–50,000 €/years. The average family income is 29,250<br />
€/year (2,400 €/month). The income revealed in the IT2 survey results higher than the IT1 (that was quite low respect<br />
the Italian statistics).<br />
Table 33: Family income distribution<br />
Income<br />
Freq.<br />
less than € 6,000 €/year 15<br />
6,000 - 12,000 €/year 25<br />
12,000 - 18,000 €/year 56<br />
18,000 – 24,000 €/year 50<br />
24,000 - 30,000 €/year 63<br />
30,000 – 50,000 €/year 72<br />
50,000 - 80,000 €/year 26<br />
more than 80,000 €/year 9<br />
- 34<br />
Tot 350<br />
The sample job distribution is shown in Table 34. The most frequent employements are in service sector (16%) and<br />
industrial sector (13%). The 15% are retired and 18% belongs to category “other” (i.e. freelancers). The frequency of<br />
the ‘other’ category show that the job categories use were not completely able to represent the job population structure.<br />
The farmers were only 8% of the total.<br />
19
AquaMoney<br />
Table 34: Job distribution<br />
Job Tot %<br />
Unemployed/looking <strong>for</strong> work 6 1.71%<br />
Farmer 30 8.57%<br />
Employed in the tourism sector (hotel, restaurant, camping etc.) 12 3.43%<br />
Fisherman 5 1.43%<br />
Employed in the service sector (bank, administrator, etc.) 57 16.29%<br />
Employed in the industry sector (factory worker) 46 13.14%<br />
Employed in the education sector 16 4.57%<br />
Retired 53 15.14%<br />
Student 33 9.43%<br />
Housewife/man 25 7.14%<br />
Other 65 18.57%<br />
- 2 0.57%<br />
Tot 350 100.00%<br />
Table 35 shows the joint distribution of job and educational level. As expected, a higher education level corresponds to<br />
a higher income level.<br />
Table 35: Joint distribution of job and the educational level.<br />
Total annul income <strong>for</strong><br />
household<br />
no<br />
education<br />
primary<br />
junior high<br />
school secondary university other - Tot<br />
less than € 6.000 €/anno 3 2 8 2 15<br />
6.000 - 12,000 €/’year 1 8 9 6 1 25<br />
12.000 - 18.000 €/year 7 19 25 5 56<br />
18.000 - 24.000 €/year 1 4 12 23 10 50<br />
24.000 - 30.000 €/year 1 15 32 15 63<br />
30.000 - 50.000 €/year 12 39 20 1 72<br />
50.000 - 80.000 €/year 3 9 12 2 26<br />
more than 80.000 €/year 1 3 5 9<br />
- 2 21 8 3 34<br />
Tot 2 23 75 166 78 3 3 350<br />
6.1.3 Water use characteristics<br />
In the survey, water use characteristics are investigated, in particular water recreation activities frequency, type of<br />
activities, and water bill. Water recreation activities are summarized in Table 36. The most part of respondents (64%)<br />
do not practice any water recreation activities.<br />
Table 36: Water users and non-users<br />
Water Users<br />
Freq.<br />
No 63.71%<br />
Yes 36.29%<br />
Tot 100.00%<br />
The question about activities carried out is multiple choice and the outcome is summarised in Table 37. The principal<br />
activities of the respondents are: walking (50), fishing (39) and swimming (28).<br />
20
Deliverables D41: Pilot case <strong>study</strong> results and D51: Best practice recommendations from pilot case studies<br />
Table 37: Activities near water bodies<br />
7.<br />
Activities Tot<br />
Activities Tot<br />
pic-nic 12 hunting 16<br />
swimming 28 boating 3<br />
fishing 39 other 14<br />
walking 50<br />
In the IT2 survey, details concerning the distance from home to the nearest open freshwater <strong>for</strong> recreation and the kind<br />
of water body are not asked, so it is not possible to make a parallel between IT1 and IT2. The average annual water bill<br />
is 327€/year and Figure 6 presents its distribution per classes of watr bill amount. The most frequent class of annual<br />
water bill is between 200 and 300 €/year, followed by 150-200 €/year. The higher water bills are stated by farmers,<br />
likely taking into account the cost <strong>for</strong> irrigation water, rather than the household water bill, which explain the very high<br />
amount stated by some respondents. Only 22 people did not remember their annual water bill.<br />
Figure 6: Annual bill distribution in intervals<br />
7.1 Public perception of water management problems<br />
In the following we <strong>report</strong> the principal questions of the Italian questionnaire type (some questions are similar/equal to<br />
the common questionnaire design while other are different. The questionnaire starts with general questions until focus<br />
to specific questions about water scarcity and restriction problems).<br />
Note: The numbers of the questions are referred to the number in the questionnaire.<br />
In Table 38, the three most important problems stated by the interviews are shown. The most frequent problems are<br />
traffic, pollution and environment/water (that includes general environmental problems, water scarcity and quality,<br />
etc.).<br />
21
AquaMoney<br />
Table 38: ( Q1))Most important problems in the area<br />
First Problem Freq Second Problem Freq Third Problem Freq<br />
Public<br />
Traffic 56 Traffic 54 transport/infrastructure 47<br />
<strong>Po</strong>llution 51 <strong>Po</strong>llution 42 Other 34<br />
Environment/water 39 Environment/water 32 <strong>Po</strong>llution 29<br />
Safety/crime 34 Social problems 29 Safety/crime 27<br />
Social problems 29 Safety/crime 29 Traffic 20<br />
Economic problems 28 Economic problems 29 Environment/water 19<br />
Public<br />
Public<br />
transport/infrastructure 26 transport/infrastructure 23 Economic problems 18<br />
Immigration 22 Other 19 Social problems 14<br />
Labour/unemployment 12 Immigration 14 <strong>Po</strong>litics/policy 13<br />
<strong>Po</strong>litics/policy 12 <strong>Po</strong>litics/policy 14 Labour/unemployment 9<br />
Wastes 6 Labour/unemployment 8 Wastes 8<br />
Other 4 Wastes 6 Immigration 8<br />
Drug 2 Drug 2 Climate change 4<br />
Climate change 1 no answer 49 Drug 1<br />
no answer 28 no answer 99<br />
Tot 350 Tot 350 Tot 350<br />
In the question about the importance of the environment, almost the totality of the respondents (90%) considers<br />
important or very important the environment.<br />
Table 39: ( Q2) Importance of the environment<br />
Importance of environment<br />
Freq.<br />
Not important at all 0.86%<br />
Not important 2.29%<br />
Not important/not<br />
unimportant 6.57%<br />
Important 44.29%<br />
very important 46.00%<br />
Tot 100.00%<br />
Beside question related to the most important problems in the area, we also asked to people which are the most<br />
important environmental problems. This question was made to better understand the perception of people regarding<br />
environmental and water problems. Analysing the answers (see Table 40), the most important problems noticed are:<br />
pollution (general, noise, electromagnetic, soil, etc.), air pollution, wastes (urban, management, etc.), water quality<br />
(drink water, rivers and lakes problems, etc.) and water scarcity (summer drought, aquifer resources, etc.). Problems<br />
specifically related to water represents about 18% of responses (as first environmental problem). The ‘other’ category<br />
includes: fog, de<strong>for</strong>estation, <strong>for</strong>est fire, geologic problems, law respects, absence of conservation area, etc.<br />
22
Deliverables D41: Pilot case <strong>study</strong> results and D51: Best practice recommendations from pilot case studies<br />
Table 40: (Q3) Most important environmental problems in the area.<br />
First <strong>Environmental</strong><br />
problem<br />
Freq<br />
Second environmental<br />
problem<br />
Freq<br />
Third environmetal<br />
problem<br />
<strong>Po</strong>llution 148 water quality 34 other 48<br />
Water quality 39 air pollution 35 wastes 32<br />
water scarcity 16 other 40 water quality 18<br />
climate change 5 biodiversity 6 climate change 18<br />
waterworks 9 water scarcity 23 air pollution 17<br />
air pollution 34 pollution 34 water scarcity 16<br />
wastes 20 no green area 23 no green area 14<br />
no green area 9 resources management 6 landscape problems 12<br />
other 14 wastes 28 <strong>Po</strong>llution 10<br />
landscape problems 13 climate change 14 biodiversity 8<br />
resources<br />
biodiversity 5 landscape problems 15 management 5<br />
resources management 2 waterworks 4 waterworks 2<br />
- 36 - 88 - 150<br />
Tot 350 Tot 350 Tot 350<br />
In the question about the importance of scarcity problems (see Table 41), people states to consider this issue very<br />
important or important (80%).<br />
Table 41: (Q4) Importance of water scarcity problems<br />
Importance of water scarcity<br />
respects to environment<br />
Tot<br />
Not important at all 2.86%<br />
Not important 6.29%<br />
Not important/not<br />
unimportant 8.57%<br />
Important 51.71%<br />
Very important 28.86%<br />
no answer 1.71%<br />
Tot 100.00%<br />
Freq<br />
Also restriction problems (see Table 42) are considered important by the people (66%), while only 16% considers these<br />
problems as not important.<br />
Table 42: (Q6) Importance of water restrictions<br />
Importance of water restriction in<br />
the uses<br />
Tot<br />
Not important at all 5.14%<br />
Not important 11.43%<br />
Not important/not unimportant 17.43%<br />
Important 52.57%<br />
Very important 13.43%<br />
Tot 100.00%<br />
They high percentage of ‘important’ or ‘very important’ attributed to restriction problems contrasts with the fact that, in<br />
the past, only 19% of the respondents suffered of restriction problems (Table 43). This perception may depend on the<br />
23
AquaMoney<br />
wide in<strong>for</strong>mation campaigns concerning environmental problem and water scarcity carried out by mass-media in recent<br />
years.<br />
Table 43: (Q7)Restriction cases in the past<br />
Restriction Tot<br />
No 80.29%<br />
Yes 19.14%<br />
no answer 0.57%<br />
Tot 100.00%<br />
The probability to suffer in the future of water restriction problems is perceived as very high (68%) and only 32%<br />
considers future restrictions as not probable or not probable at all (Table 44).<br />
Table 44: (Q11) Probability of problems in the future<br />
Future restriction Freq.<br />
Not probable at all 10.86%<br />
Not probable 21.43%<br />
Probable 48.00%<br />
Very probable 13.71%<br />
Sure 6.00%<br />
Tot 100.00%<br />
Table 45 presents the joint distribution of the first environmental problems and importance of water scarcity. Problems<br />
specifically related to water scarcity represents only 4.5%. People consider important/very important water scarcity<br />
problems, but they do not mention the item in the environmental problem question (Table 40).<br />
Table 45: (Q3_1 vs. Q4) Joint distribution of the first environmental problem and importance of water scarcity<br />
First most important environmental problem<br />
Not<br />
important at<br />
all<br />
Not<br />
important<br />
Q4<br />
Not<br />
important/not<br />
unimportant<br />
Important<br />
Very<br />
important - Tot<br />
air pollution 0.57% 1.14% 1.14% 5.43% 1.43% 0.00% 9.71%<br />
biodiversity 0.29% 0.00% 0.00% 0.29% 0.86% 0.00% 1.43%<br />
climate change 0.00% 0.29% 0.00% 0.86% 0.29% 0.00% 1.43%<br />
landscape problems 0.00% 0.00% 0.00% 2.29% 1.43% 0.00% 3.71%<br />
no green area 0.00% 0.00% 0.29% 1.14% 1.14% 0.00% 2.57%<br />
other 0.00% 0.57% 1.14% 1.43% 0.86% 0.00% 4.00%<br />
pollution 1.14% 3.43% 4.00% 22.29% 11.43% 0.00% 42.29%<br />
resources<br />
management 0.29% 0.00% 0.00% 0.29% 0.00% 0.00% 0.57%<br />
wastes 0.00% 0.00% 0.29% 3.71% 1.71% 0.00% 5.71%<br />
water quality 0.29% 0.29% 1.14% 6.57% 2.86% 0.00% 11.14%<br />
water scarcity 0.00% 0.00% 0.00% 2.57% 2.00% 0.00% 4.57%<br />
waterworks 0.00% 0.00% 0.00% 1.43% 1.14% 0.00% 2.57%<br />
no answer 0.29% 0.57% 0.57% 3.43% 3.71% 1.71% 10.29%<br />
Tot 2.86% 6.29% 8.57% 51.71% 28.86% 1.71% 100.00%<br />
In the Table 46, it is presented the relation between the importance attributed to family water restrictions and the<br />
presence of water restriction. Although, the most part of people does not suffer water restriction a large part (almost<br />
66%) considers family water restrictions as an important or very important problems.<br />
24
Deliverables D41: Pilot case <strong>study</strong> results and D51: Best practice recommendations from pilot case studies<br />
Table 46: (Q7 vs. Q6) Joint distribution of suffering family water restriction and importance of water restriction<br />
Q6<br />
Q7<br />
Not<br />
important<br />
at all<br />
Not<br />
important<br />
Not<br />
important/not<br />
unimportant<br />
Important<br />
Very<br />
important<br />
No 4.57% 10.29% 16.29% 40.57% 8.57% 80.29%<br />
yes 0.29% 1.14% 1.14% 11.71% 4.86% 19.14%<br />
no answer 0.29% 0.00% 0.00% 0.29% 0.00% 0.57%<br />
Tot 5.14% 11.43% 17.43% 52.57% 13.43% 100.00%<br />
Tot<br />
In Table 47, future perception of water restrictions is related to having suffered of restriction in the past. People who<br />
suffered of water restriction in the past are slightly more likely to think that a future situation of water restrictions could<br />
be probable/very probable.<br />
Table 47: (Q7 vs. Q11) Joint distribution of suffering family water restriction and future perception of water restriction<br />
not probable<br />
at all<br />
not<br />
probable<br />
Q11<br />
probable<br />
very<br />
probable<br />
sure<br />
Tot<br />
Q7<br />
No 8.86% 18.86% 38.57% 9.71% 4.29% 80.29%<br />
Yes 1.71% 2.57% 9.14% 4.00% 1.71% 19.14%<br />
no answer 0.29% 0.00% 0.29% 0.00% 0.00% 0.57%<br />
Tot 10.86% 21.43% 48.00% 13.71% 6.00% 100.00%<br />
7.2 Results of the Choice Experiments (CE) IT2<br />
In this section, we show results from the CE method. The analysis shows that the estimate <strong>for</strong> the water increase in the<br />
environment is positive but not significant, while the coefficient attached to other attributes are significant, but with<br />
opposite signs. In particular, the respondents are willing to pay <strong>for</strong> the protection of water use in agriculture and<br />
production of energy. On the opposite, the coefficient <strong>for</strong> the use of water in industry is negative showing not<br />
availability to pay <strong>for</strong> it.. The ASC is negative but not significant (Table 48).<br />
Table 48: Estimate of parameter<br />
Variable B WTP Sd Sig<br />
water increases in<br />
environment 0.039 5.57 0.24 0.11<br />
agriculture protection 0.329 47 0.14 0.02<br />
energy protection 0.417 59.57 0.1 0<br />
industry protection -0.675 \ 0.11 0<br />
bill -0.007 0.001 0<br />
ASC -0.569 0.452 0.21<br />
25
AquaMoney<br />
Table 49: Model fitting<br />
Model fitting criteria<br />
Likelihood Ratio Tests<br />
Model - 2Log Likelihood Chi-Square df Sig.<br />
Intercept only 670.581<br />
Final 2152.808 318.77 5 0<br />
In the questionnaire we also used the CVM method to ask directly the maximum wtp <strong>for</strong> the economic sectors and<br />
environment. In this case the highest WTP obtained by the environment. Among sectors, the ones with the highest WTP<br />
are confirmed to be agriculture and energy production.<br />
Table 50: Willingness to pay derived from CVM<br />
Mean (€/famiglia) Median (€/famiglia) Sd Frequency wtp =0<br />
Environment 42.96 30 63.03 23.70%<br />
Agriculture 29.95 10 43.12 34.90%<br />
Energy 23.38 10 42.63 44.80%<br />
Industry 13.87 0 25.74 55.80%<br />
7.3 Comparison between sub-basins<br />
This section is devoted to the comparison between the two sub-samples belonging to the two main basins considered. In<br />
particular, we compare the characteristics and the results of CVM <strong>for</strong> the data coming out of the IT2 sample. We split<br />
the data in two parts related two different basins. The first sub-sample is located in the Reno-Romagna basin with a size<br />
of 159 people and the second sample in the <strong>Po</strong> basin with a size of 191 people.<br />
In the following a description of the main sample characteristics is <strong>report</strong>ed. The aim of the description is to know how<br />
the samples differ.<br />
In both samples the sex distribution shows a larger presence of male respect to the <strong>Italy</strong> sex distribution (see Table 51).<br />
Table 51: Sex distribution in the two samples<br />
Sex Reno <strong>Po</strong><br />
Male 54.97% 52.83%<br />
Female 45.03% 45.28%<br />
- 0.00% 1.89%<br />
Tot 100.00% 100.00%<br />
The average age is 47 in the Reno sample and 43 in the <strong>Po</strong> sample. In particular in the <strong>Po</strong> basin the presence of people<br />
over 65 years old is less than in Reno and the interval class with the highest frequency is 35-45 years old (see Table 52).<br />
Table 52: Age distribution in the two samples<br />
Age Reno <strong>Po</strong> Age Reno <strong>Po</strong><br />
65 19.37% 6.29%<br />
35-45 20.94% 37.74% - 0.00% 1.26%<br />
45-55 20.42% 20.13% Tot 100.00% 100.00%<br />
Differences between samples can be understand analysing the job distribution (Table 53). In fact, in the Reno basin the<br />
presence of retired is larger than in the <strong>Po</strong> (21% vs. 8%) and the farmers presence is larger in the <strong>Po</strong> basin than in the<br />
Reno (13% vs. 5%). In the <strong>Po</strong> basin the presence of fisherman depends on the possibility to make the activity as a job.<br />
26
Deliverables D41: Pilot case <strong>study</strong> results and D51: Best practice recommendations from pilot case studies<br />
Table 53: Comparison of job in the two samples<br />
Job Reno <strong>Po</strong><br />
unemployed/looking <strong>for</strong> work 1.05% 2.55%<br />
Farmer 4.71% 13.38%<br />
employed in the tourism sector (hotel, restaurant, camping<br />
etc.) 2.62% 4.46%<br />
Fisherman 0.52% 2.55%<br />
employed in the service sector (bank, administrator, etc.) 16.75% 15.92%<br />
employed in the industry sector (factory worker) 13.09% 13.38%<br />
employed in the education sector 5.76% 3.18%<br />
Retired 21.47% 7.64%<br />
Student 10.47% 8.28%<br />
housewife/man 5.24% 9.55%<br />
Other 18.32% 19.11%<br />
Tot 100.00% 100.00%<br />
As shown in the Table 54 the Reno income distribution is on average higher than the <strong>Po</strong> income distribution. In fact,<br />
Reno income average is 10520.23€/year and the <strong>Po</strong> income average is 9510.5€/year. In both samples the 10% of people<br />
do not answer to the income question.<br />
Table 54: Income distribution in the two samples<br />
Income Reno <strong>Po</strong><br />
less than € 6,000 €/year 5.24% 3.14%<br />
6,000 - 12,000 €/year 7.85% 6.29%<br />
12,000 - 18,000 €/year 16.23% 15.72%<br />
18,000 – 24,000 €/year 12.04% 16.98%<br />
24,000 - 30,000 €/year 18.32% 17.61%<br />
30,000 – 50,000 €/year 22.51% 18.24%<br />
50,000 - 80,000 €/year 8.38% 6.29%<br />
more than 80,000 €/year 0.00% 5.66%<br />
- 9.42% 10.06%<br />
Tot 100.00% 100.00%<br />
Figure 7 shows the water bill distributions of the two basins. In spite of the different distribution in the samples, the<br />
average water bill is similar: 339€/year in the Reno basin and 311€/year in the <strong>Po</strong> basin. The values are raised because<br />
of some high values (e.g. over 1000€/year).<br />
27
AquaMoney<br />
Figure 7: Water bill annual distribution €/year in Reno basin and in <strong>Po</strong> basin<br />
The general perception of importance of the water restrictions in the uses (Table 55) results important and very<br />
important (more than 60% of people expressed this in both samples). It is important to underline that about 80% of<br />
people in the basins do not suffer of water restriction, as shown in Table 56. So the high importance to the restriction<br />
problems can depend on the increasing attention and concern <strong>for</strong> the recent climate changes (e.g. rain scarcity,<br />
temperature increase, etc.).<br />
Table 55: (Q6) Importance of water restriction in the uses in the two samples<br />
Importance of water<br />
restriction in the uses Reno <strong>Po</strong><br />
not important at all 5.76% 4.40%<br />
not important 13.61% 8.81%<br />
Not important/not<br />
unimportant 16.23% 18.87%<br />
Important 50.79% 54.72%<br />
very important 13.61% 13.21%<br />
Tot 100.00% 100.00%<br />
However, Table 56 also shows relevant differences in the water restrictions suffered in the past by the interviewees. In<br />
particular, in the Reno basin there are more cases (about 25%) of water restriction problems with respect to the <strong>Po</strong><br />
basin.<br />
28
Deliverables D41: Pilot case <strong>study</strong> results and D51: Best practice recommendations from pilot case studies<br />
Table 56: (Q7) Water restriction in the past<br />
Restriction Reno <strong>Po</strong><br />
No 74.87% 86.79%<br />
Yes 24.61% 12.58%<br />
- 0.52% 0.63%<br />
Tot 100.00% 100.00%<br />
Table 57 <strong>report</strong>s the water recreation activities frequency. In the two basins there are approximately the same<br />
percentages.<br />
Table 57: (Q13) Water recreation activities frequency<br />
Water Users Reno <strong>Po</strong><br />
No 65.45% 61.64%<br />
Yes 34.55% 38.36%<br />
Tot 100.00% 100.00%<br />
After some in<strong>for</strong>mation about the differences in demographic characteristics and restriction problems, in this section a<br />
comparison exercises will be done to better understand differences and similarities between the two basins. In the next<br />
two tables (Table 58 and Table 59), the wtp are shown.<br />
From the tables, it appears that in the two basins, all willingness to pay are similar and the level of relevance is the<br />
same. Comparing the average, we found that there is no difference in the amount <strong>for</strong> energy, while <strong>for</strong> environment and<br />
industry, the average in the <strong>Po</strong> basin are slightly higher (about 2 Euros). Finally there is a difference of about 10 Euros<br />
in the wtp <strong>for</strong> the agriculture, probably because of the higher percentage of farmers in the sample of the <strong>Po</strong> basin<br />
(13.38%).<br />
Table 58: Willingness to pay derived from CVM related to Reno Basin<br />
Mean<br />
(€/famiglia)<br />
Median<br />
(€/famiglia)<br />
Sd<br />
Frequency wtp<br />
=0<br />
Environment 42.29 30.00 71.56 23.60<br />
Agriculture 26.03 10.00 35.26 37.20<br />
Energy 23.41 10.00 35.81 46.60<br />
Industry 13.10 0.00 24.44 58.60<br />
Table 59: Willingness to pay derived from CVM related to <strong>Po</strong> Basin<br />
Mean<br />
(€/famiglia)<br />
Median<br />
(€/famiglia)<br />
Sd<br />
Frequency wtp<br />
=0<br />
Environment 43.95 38.75 48.10 23.80<br />
Agriculture 35.84 15.00 52.39 31.50<br />
Energy 23.34 10.00 51.43 42.10<br />
Industry 15.02 0.00 27.65 51.60<br />
8. Conclusions<br />
The main outcome of the two studies in the area is that the environmental benefits from an higher amount of water in<br />
the environment are considered relevant and affect the willingness to pay. This is a clear outcome of the IT1 and is<br />
partially confirmed in the IT2.<br />
29
AquaMoney<br />
The results of CVM show different WTPs compared to CE. In the common design exercise, in spite of the best<br />
environmental alternative proposed (very good condition), the wtp from CVM is lower (even four times less) than CE<br />
results. The IT2 survey yielded different results, with a low WTP <strong>for</strong> the environmental attribute in the CE and a WTP<br />
higher than the ones of the production sectors in the CVM exercise.<br />
The implementation of the two design with different attributes drives the analysis in two opposite directions. In the IT1<br />
the respondents are willing to pay mainly <strong>for</strong> environmental improvement while in IT2 the respondents are willing to<br />
pay mainly to guarantee water to agriculture and energy sectors. The comparison between the two designs show the<br />
presence of a different trade-off in the two designs; in fact people are willing to pay <strong>for</strong> the environment improving<br />
instead of ensuring the no-reduction of external water restrictions; however, when confronted with water allocation in<br />
productive sectors, people are willing to pay <strong>for</strong> sectors rather than <strong>for</strong> environmental improvements.<br />
A tentative testing of scale effects did not allow to identify a clear-cut reaction to scale. Rather, they hint at the idea that<br />
respondents perceived the difference between the two basins and answered consistently with the prevailing feature of,<br />
respectively, the whole and the sub-basin.<br />
In a wider perspective, the experience shows also the need to go beyond pure monetary evaluation and to design<br />
appropriate survey means in order to collect the vision of the problem by the respondents. The most interesting outcome<br />
of the surveys illustrated in this paper is the difference between the strong statement of importance of the environment<br />
when it is taken alone, compared with the low priority in the list of the main problems perceived by citizens. The same<br />
tends to apply <strong>for</strong> water issues in comparison with other environmental problems. This reflects also in the need <strong>for</strong> a<br />
cautious use of monetary evaluation results when single services are evaluated without taking into account the tradeoffs<br />
with other issues.<br />
The experience with the definition of a common survey design showed the difficulties and the challenges in defining<br />
common methodologies <strong>for</strong> the evaluation related to a very locally specific issue like water uses. This should warn<br />
against the use of too generalised tools in environmental evaluation, reducing the ability to adapt to local conditions and<br />
possibly leading to misleading results.<br />
Altogether, the <strong>study</strong> shows the importance of using appropriate evaluation expertise in order to fill the gap between<br />
general methodology specifications and specific policy-oriented evaluation exercises,<br />
9. Best practice recommendations<br />
9.1 Organisation<br />
In this section we summarise the main recommendations arising from the <strong>Po</strong> case <strong>study</strong>. In doing that, we follow the<br />
structure of the Aquamoney Draft Technical guidelines (Brouwer and Gorgiou, 2007, chapter 3.2, plus an additional<br />
section about <strong>report</strong>ing).<br />
This is intended to follow a linear logical structure of the contribution to the evaluation exercise, starting with the<br />
analysis of the problem to feeding the results back in the decision making process.<br />
9.2 Formulation of the Research Problem and (Valuation) Objective(s)<br />
This point can benefit only partially from our research driven approach. However, we tested the difficulty in matching<br />
theoretically defined concepts with the understanding of respondents in stated preference methods. The explicit<br />
consideration of spurious or mixed values should be explicitly taken into account.<br />
9.3 Determination of the Research Design/Mapping Out of the Valuation Approach<br />
Also this point can benefit only partially from our research driven approach. The experience of the <strong>Po</strong> <strong>Case</strong> <strong>study</strong> shows<br />
the relevance of caring about the motivations behind the realisation of a valuation exercise. The role of the client and its<br />
vision of the problem is of course the main starting point in practical studies. At this stage, the use of focus groups or<br />
other participatory approaches are useful in order to understand the problem structure from the point of view of the local<br />
population/interest groups, as well as to understand the relevance of the individual problems to be addressed.<br />
This could be structured in two major steps: structure of the specific choice problem; identification of the kind of<br />
in<strong>for</strong>mation needed <strong>for</strong> the decision making process (including choosing monetary vs. non monetary tools).<br />
In practical terms, if a <strong>study</strong> is important enough to require an original evaluation <strong>study</strong>, our experience teaches that a<br />
professional analyst is required and should be incorporated in a <strong>study</strong> group from the very beginning.<br />
30
Deliverables D41: Pilot case <strong>study</strong> results and D51: Best practice recommendations from pilot case studies<br />
9.4 Design of the Valuation Instrument<br />
This should follow partly from the previous step. However our experience prove the need to be prepared to manage the<br />
trade of between research questions and practical “representability”/communicability. The main issues and problems<br />
encountered:<br />
• Trade off between locally relevant issues/ perceptions and generalized measurements. We tested this with the<br />
common scarcity design, that was adopted in IT1. IT2 was more driven by local issues and focused on<br />
allocation of water to the environment and between economic sectors. This is because in the <strong>Po</strong> area scarcity is<br />
more a matter of allocation than absolute scarcity (at least <strong>for</strong> the time being).<br />
• We also experienced that when the number of attributes and attribute levels is small, then people during the<br />
choice process do not understand the differences between cards. The status quo was also far from the reality<br />
and this perceived, even if most of the people did not looked really in<strong>for</strong>med about water issues.<br />
• IT1: we had a long discussion about the perception of the frequency of water restrictions during the pre-test<br />
and we ended up with the one adopted in the common design; though it went smooth during the interviews, it<br />
is difficult to say what was the exact perception by respondents; from the analysis we would say that they did<br />
not consider the difference very relevant. Generally speaking the understanding of the current situation and the<br />
credibility of scenarios was very weak because of people being not in<strong>for</strong>med or not having means to evaluate<br />
the credibility of general future situations as the one presented. In addition, external household uses are not<br />
perceived as very important in the area. Likely most household have minor restrictions but they are not aware<br />
of them. IT2: The meaning of guaranteeing water to a specific sector may be not always easy to understand in<br />
terms of implications (there is a discrepancy between total water allocation and guarantee in case of water<br />
emergency, which is the concept more diffuse); in addition quantitative measures of water re-allocation may be<br />
not so meaningful <strong>for</strong> respondents and produce in the researcher the perception (illusion) to have an exact<br />
monetary value per unit of water, even when it is not so (or when it is not possible to make sure).<br />
• IT: we used maps <strong>for</strong> water quantity, but only to show the reference basin. Respondents were more or less<br />
indifferent: even colourful maps are difficult to understand and the meaning is difficult to translate in the<br />
perception of water quality.<br />
• in addition, it is important to use focus groups or similar participatory approaches to analyse what problems are<br />
perceived as important and how they should be approached. In <strong>Italy</strong> as well the issue of allocation among<br />
sectors is perceived as somehow more important that water in the environment itself (from which IT2).<br />
• Starting with open questions in the questionnaire is very important to cast the thinking into the overall range of<br />
problems of interest of the interviewee.<br />
• Be aware that “symbolic” pictograms or ordering wording on attributes cannot build a real perception of the<br />
problems and the derived WTP should be taken cautiously.<br />
9.5 Design of the Sampling Plan<br />
We concentrated our survey in the south of the <strong>Po</strong> basin with the presence of scarcity problems. The biggest problem is<br />
to identify the water body of interest (as many different bodies can be in the mind of the population considered) and the<br />
correspondence between population and water bodies (due to the difference between administrative boundaries and<br />
water bodies boundaries).<br />
About the survey mean, face to face interview in the street tends to bias sample towards retired people, students, etc.<br />
Here is synthesis the Italian sample strategy.<br />
Balance between male-female and ageing.<br />
(-) The survey was conducted in the street, the response rate was low. Other method (telephone call to fix an<br />
appointment) was attempted but without results<br />
(-) the time <strong>for</strong> surveying is long (20 minutes) and people are busy and there is not the possibility to tell them all<br />
in<strong>for</strong>mation (in particular in the CE part)<br />
(+) Separation between survey and card was good to limit heavy interviewing time.<br />
The main lesson learned concerns the need to design a consistent questionnaire/sampling plan and data collection, based<br />
on a previous knowledge of opportunities to contact people.<br />
31
AquaMoney<br />
9.6 Administer the Valuation Instrument/Collection of the Data<br />
The survey took on average 20 minutes and this amount of time represents a large disadvantages because people in<br />
street do not have time. In the future, a more focused questionnaire <strong>for</strong> a specific problem could avoid general<br />
questions. A problem is anyway the definition of the problem and attributes which is too long <strong>for</strong> telephone and street<br />
interviews, unless a more focused problem is considered and respondents know it.<br />
Concerning the effect of the timing of the survey, it was implemented in the first half of September, after holiday season<br />
(August); most of the interviews were made by street interviews and were casual and driven by places were respondents<br />
could be available to answer; weather was reasonably good <strong>for</strong> most of the survey and the year was not mentioned as a<br />
particularly dry and hot one in the area (though water scarcity problems happen). We actually delayed the survey also to<br />
avoid rain (in June) and holiday time (in July-August)<br />
The practical way of administering the questionnaire may affect the ability to intercept the population relevant <strong>for</strong> the<br />
issue addressed; this may be more easily done when the <strong>study</strong> is more focused than the object of evaluation considered<br />
here.<br />
9.7 Prepare Data<br />
-<br />
9.8 Analyse and Interpret the Data<br />
We used Limdep <strong>for</strong> the CE. Comparison between areas was mostly made through comparison of descriptive statistics,<br />
rather than <strong>for</strong>mal methods.<br />
9.9 Reporting<br />
The actual in<strong>for</strong>mation content of the results should be evaluated more critically with respect to the actual decisionmaking<br />
problems: what is the perceived object being estimated? To what extent we can trust monetary values or should<br />
relax our interpretation to a “voting procedure”? Perceptions and open answers should have a higher place.<br />
Context questions are more often to be ready to arise when the work is discussed with the public. In the case of our<br />
design, typical issues raised during discussions occurred till the preparation of the <strong>report</strong> are:<br />
• IT1: Why did you not include in-house domestic uses? What if the expectations of respondents are wrong?<br />
How do you justify the low attention/importance of water issues? What was the amount paid by the<br />
respondents through water bill? Did you make sure that the perception of water bill is correct? How was the<br />
weather like when you carried out the survey? Why should families pay <strong>for</strong> the environment? Why should the<br />
water bill be the correct payment <strong>for</strong>m? How much is the ratio between costs attribute and water bill?<br />
• IT2: why should families be willing to pay <strong>for</strong> production sectors? How much water is used by household on<br />
the total? How relevant is a change in water in the environment by 3-6%. (questions actually raised during<br />
internal presentations)<br />
In the Italian case <strong>study</strong>, results will be discussed with the <strong>Po</strong> Basin authority and with the regional administration. An<br />
open event will be jointly organised. In fact the project was carried out since the beginning in strong coordination with<br />
<strong>Po</strong> Basin authority and with the Regional administration, including discussion of in<strong>for</strong>mation need and survey design.<br />
In drafting the <strong>report</strong>s attention should be focused on how the kind of results obtained fit into the next <strong>report</strong>ing<br />
requirements of the decision makers. It is necessary to have in mind here the differences between <strong>report</strong>ing a <strong>study</strong><br />
driven by research funding and a <strong>study</strong> driven by decision-makers funding <strong>for</strong> practical decision making.<br />
In real life situation it might be expected that the diffusion of the results will go through different levels of <strong>report</strong>ing and<br />
technicality. This may also imply that results of an evaluation <strong>study</strong> could also be part of wider planning, evaluation of<br />
participation documents mediated by the decision-making authority. In this case, attention should be paid to the<br />
consistency between different pieces of in<strong>for</strong>mation and to avoid misuse/misunderstanding of the evaluation exercise.<br />
References<br />
ARPA Emilia-Romagna, 2005. Valsat, valutazione della sostenibilità ambientale e territoriale. All’interno del piano di<br />
tutela e uso delle acque. (VER)<br />
32
Deliverables D41: Pilot case <strong>study</strong> results and D51: Best practice recommendations from pilot case studies<br />
Autorità di Bacino del <strong>Po</strong>, 2006. Caratteristiche del bacino del fiume <strong>Po</strong> e primo esame dell’impatto ambientale delle<br />
attività umane sulle risorse idriche (Characteristics of the river basin of the <strong>Po</strong> river and first examination of<br />
environmental impact of the human activities on the water resources). <strong>Italy</strong>. (RB)<br />
Brouwer R. and Georgiou S., 2007. Economic Valuation of <strong>Environmental</strong> and Resource Costs and Benefits of Water<br />
Uses and Services in the Water Framework Directive: Technical Guidelines <strong>for</strong> Practitioners RESTRICTED<br />
AQUAMONEY Deliverable D21.<br />
Massarutto, A., Basoni, A., De Carli, A., Lodi, A., Paccagnan, V., 2007. Studio di fattibilità concernente lo sviluppo<br />
dell’analisi economica dell’utilizzo idrico a scala di bacino del fiume <strong>Po</strong> così come prevista dalla Direttiva<br />
2000/60/CE (Feasibility <strong>study</strong> concerning the development of the economic analysis of water use to scale of <strong>Po</strong> river<br />
basin like previewed from Directive 2000/60/EC). IEFE, istituto di economia e politica dell’energia e dell’ambiente,<br />
Università commerciale Luigi Bocconi, <strong>Italy</strong>. (RVEBP)<br />
Massarutto, A., Basoni, A., De Carli, A., Lodi, A., Paccagnan, V., 2007. Studio di fattibilità concernente lo sviluppo<br />
dell’analisi economica dell’utilizzo idrico a scala di bacino del fiume <strong>Po</strong> così come prevista dalla Direttiva<br />
2000/60/CE, attività integrativa (Feasibility <strong>study</strong> concerning the development of the economic analysis of water use to<br />
scale of <strong>Po</strong> river basin like previewed from Directive 2000/60/EC, integration activity). IEFE, Istituto di economia e<br />
politica dell’energia e dell’ambiente, Università Commerciale Luigi Bocconi, <strong>Italy</strong>. (RVEI)<br />
Regione Emilia-Romagna, 2005. Piano di tutela e uso delle acque. (RER)<br />
Regione Lombardia, 2005. Piano di tutela e uso delle acque. (SPL)<br />
33