SERPIS RIVER BASIN Case Study Report - VU University, Institute ...
SERPIS RIVER BASIN Case Study Report - VU University, Institute ...
SERPIS RIVER BASIN Case Study Report - VU University, Institute ...

Create successful ePaper yourself
Turn your PDF publications into a flip-book with our unique Google optimized e-Paper software.
Water scarcity valuation<br />
under the EU WFD<br />
<strong>SERPIS</strong> <strong>RIVER</strong> <strong>BASIN</strong><br />
<strong>Case</strong> <strong>Study</strong> <strong>Report</strong><br />
Francia<br />
Portugal<br />
España<br />
Confederación<br />
Hidrográfica<br />
del Júcar<br />
Cuenca del<br />
río Serpis<br />
Mar Mediterráneo<br />
Technical Univ. of Valencia, Spain<br />
September, 2009<br />
Authors: Manuel Pulido-Velazquez (UPVLC), Julia Martín-Ortega (Basque Centre for<br />
Climate Change, C3), Joaquín Andreu Álvarez (UPVLC), Antonio López (UPVLC)<br />
Contact email: mapuve@hma.upv.es (M. Pulido-Velazquez)
Contact information AquaMoney Partners<br />
77
Colophone<br />
This report is part of the EU funded project AquaMoney, Development and Testing of Practical Guidelines for the<br />
Assessment of Environmental and Resource Costs and Benefits in the WFD, Contract n o SSPI-022723.<br />
General<br />
Deliverable D41-51<br />
Deadline<br />
Complete reference<br />
Status<br />
Approved / Released<br />
Reviewed by<br />
Pending for Review<br />
Author(s): M. Pulido,<br />
Martín-Ortega, J.,<br />
Andreu, J., López, A.<br />
Date Sept. 2009 Comments Date<br />
Second draft<br />
First draft for Comments<br />
Under Preparation<br />
Confidentiality<br />
Public<br />
Restricted to other programme participants (including the Commission Service)<br />
Restricted to a group specified by the consortium (including the Advisory Board)<br />
Confidential, only for members of the consortium<br />
Accessibility<br />
Workspace<br />
Internet<br />
Paper<br />
All rights reserved. No part of this publication may be reproduced, stored in a retrieval system or transmitted in any form or by any<br />
means, electronic, mechanical, photocopying, recording or otherwise without the prior written permission of the copyright holder<br />
Copyright © 2006
TABLE OF CONTENT<br />
1. Introduction<br />
2. Description of the case study<br />
2.1. Location of the case study<br />
2.2. Water system characteristics<br />
2.3. Water use and water users<br />
2.4. Main water management and policy issues in the context of the WFD<br />
3. Set up of the survey<br />
3.1. Questionnaire design<br />
3.2. Sampling procedure and response rate<br />
4. Valuation results<br />
4.1. Respondent characteristics and sample representativeness<br />
4.2. Public perception of water management problems<br />
4.3. Estimated economic values for water resource management<br />
4.4. Factors explaining economic values for water resource management<br />
4.5. Total Economic Value<br />
5. Conclusions<br />
6. Best practice recommendations<br />
References<br />
Annex. Questionnaire and choice cards (in Spanish)<br />
All rights reserved. No part of this publication may be reproduced, stored in a retrieval system or transmitted in any form or by<br />
any means, electronic, mechanical, photocopying, recording or otherwise without the prior written permission of the copyright<br />
holder Copyright © 2006
1. Introduction<br />
This report includes the final results of the AquaMoney pilot case study for the Serpis<br />
river basin (Jucar River Basin District). The main objective of the case study is to test<br />
methodologies for the valuation of components of the environmental and resource costs<br />
of water services under conditions of water scarcity, and to come up with best practice<br />
recommendations both for the valuation process and the use of the information to inform<br />
the policy process. Specifically, we intend to test a methodology to assess:<br />
• The economic value of environmental water use, i.e. allocating water to the<br />
environment to ensure good environmental status under conditions of limited<br />
water availability.<br />
• The option value of domestic water use, i.e. not using water now, but in the<br />
future.<br />
To estimate the value the society places on improvements in water allocation to the<br />
environment and in the future reliability of household water supply we resort to Choice<br />
Experiments. Choice (CE) experiments are one example of the stated preference<br />
approach to environmental valuation, since they involve eliciting responses from<br />
individuals in constructed, hypothetical markets, rather than the study of actual<br />
behaviour. The CE technique is based on random utility theory and the characteristics<br />
theory of value: environmental goods are valued in terms of their attributes, by applying<br />
probabilistic models to choices between different bundles of attributes. By making one of<br />
these attributes a price or cost term, marginal utility estimates can be converted into<br />
willingness-to-pay estimates for changes in attribute levels, and welfare estimates<br />
obtained for combinations of attribute changes. The decision to use a CE approach here<br />
was driven by the desire to estimate separate values for allocating water to the<br />
environment and for reducing uncertainty on household future water supply under water<br />
scarcity conditions. Choice experiments (CE) are becoming a popular means of<br />
environmental valuation, and have already been applied to deal with other valuations<br />
required by the implementation of the WFD (e.g., Hanley et al., 2006).<br />
A common design of the CE questionnaire has been developed in cooperation with two<br />
other partners of AquaMoney (Univ. of the Aegeon, Greece, and Univ. of Bologna, Italy),<br />
Dr. Martín-Ortega (at that moment at IVM, Amsterdam, The Netherlands), Dr. Álvarez-<br />
Farizo (CSIC, Spain), and Dr. Roy Brouwer, coordinator of the AQUAMONEY project.<br />
The common questionnaire has been applied in four river basins in Southern Europe:<br />
the Serpis, Guadalquivir and Tajo river basins in Spain, the Po River basin in Italy and<br />
the Lesvos Island in Greece. Valuation exercises are expensive and time consuming,<br />
and regulators are very unlikely to have the time or money to commission original<br />
valuation studies for every river basin. The common design is done with the purpose of<br />
conducting a benefits transfer test across these river basins, to see what errors are<br />
likely to be experienced if benefits transfer procedures are used as part of implementing<br />
the WFD.<br />
7
2. Description of the case study<br />
2.1 Location of the case study<br />
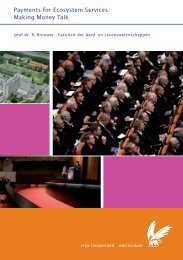
The Serpis River Basin is located at the East of Spain, south to Valencia and north to<br />
Alicante cities, within the domain of the Jucar River Basin District (see Fig. 1). It is<br />
located south to Valencia province, and north to Alicante province, mainly within the<br />
municipal districts of Gandía, Llutxent, Villalonga,, Beniarrés, Muro de Alcoy,<br />
Cocentaina, Rotova and Alcoy.<br />
Figure 1 Location of the Serpis RB (source: Jucar RBD, art. 5 report)<br />
Mediterráneo<br />
Gandia<br />
Río Bernisa<br />
Río Serpis<br />
Emb. Beniarrés<br />
Bco. La Encantada<br />
Río Agres<br />
Río Barxell<br />
Alcoy<br />
Río Valleseta<br />
Río Penaguila<br />
Río Polop<br />
2.2 Water system characteristics<br />
2.2.1 Total natural runoff and available water resources.<br />
Table 1 Surface and groundwater resources in the Serpis RB (source: Jucar River Basin Mngmt. Plan)<br />
<strong>BASIN</strong><br />
TOTAL NATURAL RUNOFF (Mm 3 )<br />
SURFACE<br />
RUNOFF<br />
AQUIFER<br />
DISCHARGE<br />
TOTAL<br />
Serpis river until Beniarrés dam 15,69 25,75 41,44<br />
Serpis river between Beniarrés reservoir<br />
and Villalonga 11,60 17,11 28,71<br />
Bernisa river 5,74 lp. 5,74<br />
Serpis river, rest of basin lp. 10,00 10,00<br />
Serpis river, total basin 33,0 52,86 85,89<br />
Table 2 Surface and groundwater resources in the Serpis RB (source: Jucar River Basin Mngmt. Plan)<br />
Characteristics<br />
Conventional resources<br />
Description<br />
8
Regulated surface resources<br />
17.0 Mm 3 /year<br />
Groundwater resources<br />
105.0 Mm 3 / year<br />
Irrigation return flow<br />
8.0 Mm 3 / year<br />
Total volume of available resources 130 Mm 3 / year<br />
Marginal (nonconventional) resources<br />
Wastewater reuse * 4.5 Mm 3<br />
*Proyected in the current Jucar RB Hydrological Plan (CHJ, 1999)<br />
2.2.2 Streams and aquifer characteristics.<br />
With a surface area of 990 km 2 and a river length of 75 km, the Serpis river basin<br />
domain comprises 12 surface water bodies, 13 groundwater bodies, and 1 heavily<br />
modified water body (Beniarrés reservoir).<br />
Figure 2 Serpis river and main tributaries (left) and groundwater bodies (rigth) (source: Art. 5, Jucar RBD)<br />
2.2.3 Hydraulic infrastructure.<br />
The most important hydraulic infrastructure is:<br />
• A dam, located in Beniarrés, with an active storage capacity of 29.5 Mm 3 .<br />
• Hydropower plants:<br />
Table 3 Hydroelectric plants (source: CHJ, 1999)<br />
Hydropower Plants Power (Mw) Hydraulic jump (m)<br />
Lorcha 0.68 31.0<br />
Rincón del Duque 0.12 -<br />
Ullals 0.13 -<br />
Reprimala 0.34 18.3<br />
(-) Not in use any more<br />
9
• Irrigation canals:<br />
Table 4 Irrigation canals (source: CHJ, 1999)<br />
Canals<br />
Acequia Real de Gandía (Canales Bajos del Serpis)<br />
Canales Altos del Serpis<br />
Riegos de Bernisa<br />
Huerta de Beniarrés y Lorcha<br />
Pequeños regadíos del Bajo Serpis<br />
Pequeños regadíos del Alto Serpis<br />
• Wastewater Treatment Plants (WWT):<br />
There are 30 WWT plants that get wastewater from the main urban and industrial areas, and<br />
treat around 29 Mm3/year. The three more important are: Font de la Pedra (18.5%; discharges<br />
to the river); Alcoy (25.6%; discharges to the river); and Gandía (49.8%; discharges to the river).<br />
Wastewater discharge represents a high percentage of the total streamflow (up to 50% during<br />
winter, and 90% during summer time), and it is responsible for up to a 90% of the annual load of<br />
solids, organic matter and nutrients.<br />
2.3 Water use and water users<br />
The main water use is agriculture (75%; mainly fruit trees, especially citrus, and<br />
vegetables), followed by urban supply (21%; mainly from groundwater) and industry<br />
(4%; basically, textile industry).<br />
Figure 3 Water uses in the basin<br />
The next table shows the most important sources of supply for the main water uses in<br />
the basin:<br />
Table 5 Origins of water use (source: CHJ, 1999)<br />
Use<br />
Urban supply<br />
Agriculture<br />
Industry<br />
Hydropower<br />
Origin<br />
Groundwater - springs<br />
Mix (surface and groundwater)<br />
Groundwater (municipal supply network and wells)<br />
Surface water<br />
10
2.4 Main water management and policy issues in the context of the WFD<br />
2.4.1 Institutional framework<br />
The Serpis river basin belongs to the Jucar RBD. The Jucar River Basin Authority<br />
(Confederación Hidrográfica del Júcar, CHJ) belongs to the chart of the Ministry of<br />
Environment, within the national Administration but works as functionally autonomous.<br />
2.4.2 Legal and water rights issues<br />
• The 1985 Water Law brought groundwater into the system of water use regulation<br />
along with surface water.<br />
• The 1999 Amendment regulates water rights transfer contracts.<br />
• There is a restriction on transfers, depending on the order of priority: domestic<br />
water supply, irrigation, industrial uses, and others.<br />
2.4.3 Droughts and water scarcity problems<br />
The basin often suffers droughts, which can be classified as moderate, severe, and<br />
critical. Some of the mitigation policies to solve this problem are: regulation through<br />
Beniarrés reservoir, wastewater reuse, and better conjunctive use management of<br />
surface and groundwater resources.<br />
2.4.4 Flood risk issues<br />
The Serpis is a Mediterranean river, with a very irregular streamflows and prone to flood<br />
problems. Fortunately, the dam is providing an important mitigation of the flood risk.<br />
2.4.5 Water quality issues<br />
Water quality is better in the upstream water bodies, while in the middle and lower basin<br />
water it gets worse, mainly due to the polluted discharges from the urban and industrial<br />
areas. Most surface water bodies in the basin are at very high or high risk of failing to<br />
achieve the environmental objectives of the Water Framework Directive (WFD). The<br />
most important water quality problem is the severe eutrophication process in Beniarres<br />
reservoir, which provokes fish kills, deterioration of aesthetic conditions, unpleasant<br />
odour and colour, and the impossibility of recreation uses. The WFD programme of<br />
measures aims to reduce pollutant discharges, mainly by: more advanced wastewater<br />
treatments, control of direct industrial and urban wastewater discharges and illegal<br />
water abstractions, better irrigation management practices, and wastewater reuse for<br />
agriculture and industrial applications.<br />
2.4.6 Resources overexploitation<br />
Some aquifers in the basin are currently overexploited, mainly in the lower basin.<br />
According to the River Basin Hydrological Plan, a minimum of groundwater discharge to<br />
the sea of 21 Mm3/year is required to stabilize the fresh-salt water interface.<br />
11
2.4.7 Water use efficiency<br />
Reducing water losses for irrigation by improving the applications techniques, upgrading<br />
the infrastructure and moving to drop irrigation in some Districts that still apply surface<br />
furrow irrigation, would increase water conservation and efficiency in the basin.<br />
12
3. Set up of the survey<br />
3.1 Questionnaire design<br />
A non-labeled fractional factorial orthogonal design was elaborated with the combination<br />
of two attributes: the likelihood of water use restrictions in households (defined in terms<br />
of restriction for sprinkling gardens, washing machines and other secondary uses of<br />
water during certain hours in dry summers), and different environmental quality levels<br />
(poor, moderate, good and very good) due to water flow in the river, plus a monetary<br />
attribute (amount of money to be added to the water bill per year per household). The<br />
improved environmental conditions and the reduction of the likelihood of restrictions<br />
could be obtained in exchange of an increase of the water bill for households in the next<br />
ten years. Respondents from a representative sample of the river basin population were<br />
asked to select the most preferred alternative out of three (in four choice occasions per<br />
person), in which different scenarios of water allocation to the environment and different<br />
probabilities of water restrictions to the households were presented. One of the options<br />
was always the baseline situation (future expected probability of water restrictions to<br />
households and poor environmental status in the river basin if no measures are taken in<br />
a horizon of 10 years).<br />
Respondents were informed that securing future water supply for the environment<br />
means that water levels in rivers and aquifers increase, reducing the risk that they will<br />
dry out forever and improving living conditions for a variety of fish, plants and other<br />
animals living in and near the water. Three possible levels of improvement were<br />
proposed, corresponding to the WFD categorization and compared to the expected<br />
‘poor’ situation (status quo) with low water levels and environmental quality:<br />
- Poor (status quo): Expected future situation of low water levels and<br />
environmental quality status. This is a large deviation from the natural situation<br />
due to the increased water scarcity conditions. Many fish species will disappear<br />
and riverbanks will lose most of their vegetation. As a result most birds and<br />
insects will disappear too.<br />
- Moderate: less than average water levels and environmental quality status under<br />
natural conditions. This is still a substantial deviation from the natural situation. A<br />
limited number of fish species are present. Riverbanks have some vegetation<br />
supporting a limited number and variety of birds and other wildlife.<br />
- Good: water levels and environmental quality status are close to their average<br />
natural levels. This is a small deviation from the natural situation. Under these<br />
13
conditions riverbanks have a lighter than natural vegetation cover. As a result the<br />
breeding and nesting conditions for a number of species are limited.<br />
- Very good: water levels and environmental quality status are in their natural state<br />
where there is almost no pressure from human activities. Conditions for wildlife<br />
are optimal under these circumstances.<br />
Household water restrictions were defined in terms of restriction for sprinkling gardens,<br />
washing machines and other secondary uses of water during certain hours in dry<br />
summers. The improved environmental conditions and the reduction of the likelihood of<br />
restrictions could be obtained in exchange of an increase of the water bill for households<br />
in the next ten years. Fig. 4 shows the attributes.<br />
Figure 4 Attributes in the CE<br />
14
The questionnaire contains three parts:<br />
• First part: questions reference to environment, water use and experiences with<br />
water restrictions, in order to infer social perceptions and attitudes.<br />
• Second part: choice experiment. Two attributes with different levels plus the price<br />
attribute are considered:<br />
- The likelihood of household facing outdoor water use restrictions: as a household<br />
you currently face a likelihood of water use restrictions during 4 of the next 10<br />
years until and including 2018. Depending on the water saving measures, the<br />
likelihood of outdoor water use restrictions during any one summer over the next<br />
10 years can be reduced to 3 years, 2 years or 1 year.<br />
- Environment: three possible environmental situations (moderate, good and very<br />
good) are presented versus the current poor situation with low water levels and<br />
poor environmental quality.<br />
- Cost prices have been defined in view of the fact that taking additional measures<br />
to secure future water supply for households and the environment costs money:<br />
20, 40, 60, 80,100,120 €.<br />
The CE consisted of 6 block, each block with 4 cards. Fig. 5 shows and example of<br />
choice card.<br />
Figure 5 Example card<br />
15
• Third part: socio-demographic characteristics of the respondent. This information<br />
is useful in utility/preference formation, but also for checking that the sample<br />
collected matches known characteristics of the population of interest.<br />
3.2 Sampling procedure and response rate<br />
Sampling procedure<br />
The population of the Serpis basin is 172,388 inhabitants (according to the 2007<br />
population census). A total number of 394 interviews were carried out in the cities of<br />
Alcoy and Gandía, the main urban areas in the basin. The survey was carried out by<br />
random face-to-face interviews in the streets by four trained students over the months of<br />
June and July of 2008. The interviews took on average about 20 minutes to be<br />
completed.<br />
To carry out the survey, we prepared the following material:<br />
• The set of questionnaires<br />
• Some books with the following information:<br />
- A map of the basin.<br />
- The cards of the choice experiment (show cards)<br />
- The card of income levels<br />
- Auxiliary cards showing the options for some questions.<br />
The interviewers had to read the questions and explain the cards. A briefing was<br />
organized to ensure that the interviewers knew exactly what the study was about and<br />
how they were supposed to conduct the interview.<br />
The next distribution of the sample was considered:<br />
16
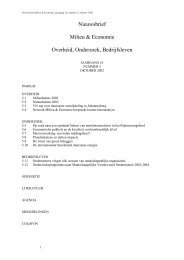
Figure 6 Interviews Distribution<br />
Gandia + Alcoy, 80 % of<br />
population<br />
Mediterráneo<br />
Gandia<br />
Río Bernisa<br />
Río Serpis<br />
240 SURVEYS<br />
(45%)<br />
Emb. Beniarrés<br />
Bco. La Encantada<br />
Río Agres<br />
Río Barxell<br />
Alcoy<br />
Río Valleseta<br />
Río Penaguila<br />
Río Polop<br />
162 SURVEYS<br />
(35%)<br />
Figure 7 Population Distribution (source: Instituto Valenciano de Estadística, IVE,2008)<br />
The average response rate was 33 %, and it varies a lot with the location of the survey<br />
within the city.<br />
17
4. Valuation results<br />
4.1. Respondent characteristics and sample representativeness<br />
4.1.1. Demographic characteristics<br />
The interviews were carried out between the cities of Alcoy and Gandía, which<br />
represent together a 80% of the basin population. The sample collected matches the<br />
characteristics of the population of interest in terms of age and gender distribution.<br />
ALCOY<br />
Table 6. Data of Alcoy (Source: IVE)<br />
City<br />
ALCOY<br />
Code 03009<br />
Province<br />
ALICANTE<br />
Region<br />
L´ALCOIÁ<br />
Distance to the capital of province (km) 54<br />
Area (km^2) 129,9<br />
Population's density (hab/km^2) 466,6<br />
Coastal<br />
NO<br />
Figure 8. Alcoy. Age distribution<br />
18
Figure 9. Alcoy. Gender Distribution<br />
GANDIA<br />
Table 7. Data of Gandía (Source: IVE)<br />
City<br />
GANDIA<br />
Code 46131<br />
Province<br />
VALENCIA<br />
Region<br />
LA SAFOR<br />
Distance to the capital of province (km) 69,9<br />
Area (km^2) 60,8<br />
Population's density (hab/km^2) 1230<br />
Coastal<br />
SI<br />
Figure 10. Gandía. Age distribution<br />
19
Figure 11. Gandía. Gender Distribution.<br />
4.1.2. Socio-economic characteristics<br />
The following characteristics are analyzed: studies, income, and jobs. The sample<br />
collected matches the characteristics of the population of interest<br />
Studies<br />
Figure 12. Studies in Alcoy.<br />
Figure 13. Studies in Gandia.<br />
More than 50 % have completed primary and secondary school in both, Gandia and Alcoy.<br />
20
Income<br />
Figures 14 and 15 show the annual family income distribution in Alcoy and Gandia.<br />
Figure 14. Annual Family Income in Alcoy.<br />
70 % of people have an annual income between 9000 euros and 25000 euros.<br />
Figure 15. Annual Income in Gandia.<br />
Jobs<br />
The sample and the population job distribution in Alcoy and Gandia are shown in<br />
Figures 16 and 17.<br />
21
Figure 16.Jobs distribution in Alcoy<br />
Figure 17.Jobs distribution in Gandia<br />
4.1.3. Public perception of the environment and water use characteristics<br />
Only few people, 10% of the sample, identified water problems like the most important<br />
problems in their area. Instead, economic and traffic problems were first.<br />
22
Table 8.Most important problems.Question1.<br />
First Problem (%) Second Problem(%) ThirdProblem(%)<br />
Economic Problems 39,34 25,63 22,84<br />
Traffic 17,26 8,12 7,87<br />
Housing Problems 4,57 4,06 2,79<br />
Safety 4,57 8,38 7,87<br />
Water 5,08 2,79 2,54<br />
Public Services 8,88 4,82 7,11<br />
Infrastructure 0,76 1,78 0,51<br />
Pollution 3,55 5,33 8,63<br />
Inmigration 5,08 4,82 3,05<br />
Any problem 3,81 0,00 0,00<br />
Environment 2,54 2,28 2,03<br />
Climate Change 0,25 1,27 2,28<br />
Culture 0 2,54 3,05<br />
Demography 0,25 0,51 1,02<br />
Any option 0 25,89 26,14<br />
Public constructions 0,76 1,77 2,28<br />
Others 3,3 0,00 0,00<br />
However, a large share of respondents (93%) considered the environment as<br />
important/very important. A 75 % believes that the environmental quality is affected by<br />
water scarcity (Table 9).<br />
Table 9. Environment influenced by water availability. Question 9.<br />
Percent<br />
No 15,48<br />
Yes 74,37<br />
Don´t Know / Don´t<br />
10,15<br />
know<br />
In the survey, the relationships of the respondents with water uses in the basin are<br />
investigated. In particular, for water recreation activities, considering frequency, type of<br />
activities, and water bill. Most of the respondents (83%) do not practice any recreation<br />
water activity. From those who practice water recreation, these are the activities they<br />
have chosen (Fig. 18) and the type of water body (Fig. 19).<br />
23
Figure 18. Distribution of activities near open freshwater. Question 4.<br />
Figure 19. Type of water body. Question 7.<br />
On the other hand, most people (92%) are professionally or workwise affected by water<br />
availability or water restrictions.<br />
Finally, the respondents were asked about their water bill. The majority (62%) remember<br />
the amount that they pay, and the mean amount obtained was 36.2 euros.<br />
24
4.2. Public perception of water management problems<br />
This part contains information about the water management problems as perceived by<br />
the respondents. This also allows assessing the credibility of the baseline conditions<br />
that are presented to the respondents.<br />
Although water scarcity is considered as a (big) problem in the region for a 62% of the<br />
respondents, only 21 % of the sample has suffered restrictions in their households in the<br />
past (last 10 years) for different reasons (including pipe cuts for public works or pipe<br />
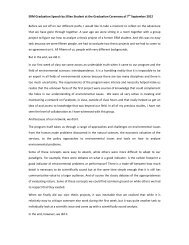
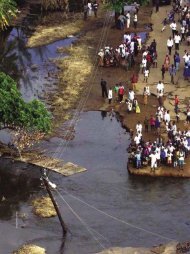
breakdowns) (Fig. 20).<br />
Figure 20. Previous experience on water restrictions. Question 10<br />
HAS YOUR HOUSEHOLD EVER EXPERIENCED ANY OF THE FOLLOWING<br />
TYPES OF WATER RESTRICTIONS DUE TO LIMITED WATER AVAILABILITY?<br />
(% PEOPLE)<br />
90,0<br />
80,0<br />
70,0<br />
60,0<br />
50,0<br />
40,0<br />
30,0<br />
20,0<br />
10,0<br />
0,0<br />
OPTION 0<br />
78,7<br />
OPTION 1<br />
0,5 0,3<br />
OPTION 2<br />
OPTION 3<br />
8,6<br />
OPTION 4<br />
4,3 1,5 4,6<br />
OPTION 5<br />
OPTION 6<br />
OPTION 3 & 5<br />
0,3 0,3 0,5 0,3 0,3<br />
OPTION 2 & 4<br />
OPTION 3 & 6<br />
OPTION 1 & 5<br />
OPTION 1 & 3 & 4<br />
0 = my household never experienced any water use restrictions due to limited water availability<br />
1 = my private well ran low on water<br />
2 = households in my area were prohibited from using water for washing cars, watering gardens,<br />
and so on.<br />
3 = households in my area had water pipe cuts in the past<br />
4 = households in my area were prohibited from using tap water due to water pollution<br />
5 = information campaigns were organized to voluntarily reduce water consumption<br />
6 = others<br />
A higher percentage, 38 %, consider that their households would face any water<br />
restrictions in the years to come (“yes, probably” and “yes, definitively”; Fig. 21).<br />
25
Figure 21. Expected future restrictions. Question 14<br />
DO YOU EXPECT THAT YOURHOUSEHOLD WILL FACE ANY<br />
WATER RESTRICTIONS IN THE YEARS TO COME?<br />
% PEOPLE<br />
35,0<br />
30,0<br />
25,0<br />
20,0<br />
15,0<br />
10,0<br />
7,1<br />
31,0<br />
24,1<br />
31,2<br />
6,6<br />
5,0<br />
0,0<br />
no, definitely not no, probably not don´t know / not<br />
sure<br />
yes, probably<br />
yes, definitely<br />
In a follow-up question, when people were asked about how severe the restrictions<br />
would be, we obtained that a 73% believes that they will suffer from water restrictions at<br />
least 3 times in the next 10 years (Fig. 22).<br />
Figure 22. Expected future restrictions. Question 15<br />
IF SO, CAN YOU TELL ME HOW OFTEN IN THE NEXT 10 YEARS?<br />
25,0<br />
19,9 19,5 20,3 7,9<br />
(% PEOPLE)<br />
20,0<br />
15,0<br />
10,0<br />
5,0<br />
0,0<br />
12,9<br />
10,0<br />
2,9 2,9<br />
0,0 0,0<br />
3,7<br />
OPTION 0<br />
OPTION 1<br />
OPTION 2<br />
OPTION 3<br />
OPTION 4<br />
OPTION 5<br />
OPTION 6<br />
OPTION 7<br />
OPTION 8<br />
OPTION 9<br />
OPTION 10<br />
0 = none of these years<br />
1 = 1 of the next 10 years 6 = 6 of the next 10 years<br />
2 = 2 of the next 10 years 7 = 7 of the next 10 years<br />
3 = 3 of the next 10 years 8 = 8 of the next 10 years<br />
4 = 4 of the next 10 years 9 = 9 of the next 10 years<br />
5 = 5 of the next 10 years 10 = every year<br />
26
A 62 % considered that it is (very) credible water scarcity will increase in the river basin<br />
in the next 10 years. Finally, over 70 % considered that, if no additional water saving<br />
measures are taken, future water and environment problems are possible (Fig. 23).<br />
Figure 23. Future conditions if we do nothing. Question 23<br />
WHAT DO YOU BELIEVE WILL HAPPEN IN THE FUTURE IF NO<br />
ADDITIONAL WATER SAVING MEASURES ARE TAKEN?<br />
(% PEOPLE)<br />
45,0<br />
40,0<br />
35,0<br />
30,0<br />
25,0<br />
20,0<br />
15,0<br />
10,0<br />
5,0<br />
0,0<br />
OPTION 0<br />
11,5 14,1<br />
OPTION 1<br />
OPTION 2<br />
11,0<br />
OPTION 3<br />
38,2<br />
7,4 7,2<br />
1,8<br />
OPTION 4<br />
OPTIONS 1 & 3<br />
OPTIONS 1 & 2<br />
OPTIONS 1 & 2 &3<br />
6,9<br />
OPTIONS 2 & 3<br />
1,8<br />
0 = nothing, I don’t believe there will be any water problems in the future<br />
1 = the environment will remain in a poor state<br />
2 = my household will (still) face water restrictions in the future<br />
3 = other<br />
4 = don’t know<br />
People who think they will not suffer restrictions in the future, answer subsequent<br />
questions hypothetically (i.e. “if there were restrictions I would think it would be<br />
important to take measures”). This hypothetical way of thinking might affect the results<br />
of the choice experiment (CE). After the CE, the respondents were asked about the<br />
general credibility of the alternative situations that were presented to them. About a 60%<br />
of the respondents consider “credible” or “very credible” the options presented.<br />
Figure 24. Credibility of the scenarios. Question 22.<br />
HOW CREDIBLE DO YOU CONSIDER THE ALTERNATIVE<br />
SITUATIONS THAT WERE PRESENTED TO YOU?<br />
(% PEOPLE)<br />
60,0<br />
50,0<br />
40,0<br />
30,0<br />
20,0<br />
10,0<br />
5,3<br />
11,4<br />
22,6<br />
49,7<br />
8,1<br />
2,8<br />
0,0<br />
NOT<br />
CREDIBLE<br />
AT ALL<br />
NOT<br />
CREDIBLE<br />
SOMEWHAT<br />
CREDIBLE<br />
CREDIBLE<br />
VERY<br />
CREDIBLE<br />
DON´T<br />
KNOW<br />
27
A question about their priorities in water allocation was also included in the<br />
questionnaire. According to the respondents, when water is scarce, the priority should<br />
be given after household supply to agriculture (53%), environment (35%), and industry<br />
(12%).<br />
28
4.3 Estimated economic values for water resources management.<br />
A simple Multinominal Logit Model (MNL) was estimated by including the different<br />
levels of improvement for the environmental quality as dummy variables, and the<br />
attribute ‘reduction of household water supply’ as a continuous variable reflecting the<br />
probability of water restrictions (from the baseline, 4 years out of 10, to 1 year out of 10).<br />
The results of the MNL were used for assessing the consumer surplus of the attributes,<br />
and the standard error of the estimates:<br />
Attributes<br />
Consumer Surplus<br />
(€ per household/year)<br />
Standard<br />
Error<br />
Domestic Supply 297.6 43.50<br />
Good<br />
Environm. Quality<br />
64.1 10.09<br />
Very Good<br />
Environm. Quality<br />
104.0 13.13<br />
Table 10. Consumer surplus for the attributes.<br />
In the Serpis study, the poor environmental level and restrictions in 4 out of 10 years are<br />
treated as the baseline status, whose credibility was analyzed in the previous section.<br />
The value of improving the environmental quality of the river basin by assuring a certain<br />
water flow in the river basin has been estimated in the model as 64 € per household per<br />
year from the ‘poor’ level to the ‘good’ level (the one required by the Water Framework<br />
Directive), and 104 € per household per year from the poor level to the very good level.<br />
This mean that the costs in terms of public’s welfare losses of not meeting the<br />
environmental standards of the WFD (specifically related here to environmental<br />
streamflow conditions) are 64 € per household per year.<br />
The value of reducing the probability of water restrictions for secondary uses in the<br />
households in one year out of ten is 297.65 € per household per year. We assume that<br />
the WTP for reducing the probability of restrictions is as reasonable approximation of the<br />
value of the foregone benefits in case of restrictions. This argument is arguable and of<br />
course subject to critics. At least it gives an illustrative idea of what the welfare losses of<br />
the restrictions to secondary uses of water can be, at least to show how far this is from<br />
the estimates by the avoided costs method.<br />
29
4.4. Factors explaining economic values for water resources management.<br />
A multivariate model was developed to analyze demand heterogeneity and which<br />
variables influence the WTP for the attributes. The interactions included in the model<br />
were:<br />
• Int1: income * costs<br />
• Int2: income * domestic supply<br />
• Int10: age* environment<br />
• Int13: experience * domestic supply<br />
• Int16: credibility* domestic supply<br />
• Int 19: member ecologist organization * environment<br />
• Int20: remember bill * cost<br />
Variable Coefficient Standard Error b/St.Er. P[|Z|>z]<br />
ASC 1.49224050 .18540515 8.049 .0000<br />
DOM -8.96678084 .88727599 -10.106 .0000<br />
ENV3 .85584499 .09372516 9.131 .0000<br />
ENV4 1.74923789 .20985436 8.335 .0000<br />
COST -.03408502 .00390799 -8.722 .0000<br />
INT1 .609110D-06 .823410D-07 7.397 .0000<br />
INT10 -.00746599 .00405244 -1.842 0654<br />
INT13 -1.51449957 .67940501 -2.229 .0258<br />
INT16 1.95073241 .26015458 7.498 .0000<br />
INT19 -.88974775 .46031534 -1.933 .0532<br />
INT20 .00457176 .00170207 2.686 .0072<br />
Table 11. Multivariate model for analyzing interactions.<br />
The value of R 2 of 20% indicates a good fit of the model.<br />
ASC positive and significant indicates that people in general want a change. The<br />
variable Dom is negative and significant showing people willingness to pay to reduce<br />
probability of restrictions. Env3 is positive and significant, indicating people WTP to<br />
improve environmental status from poor to good. Env4 is positive and significant, what<br />
refers to people WTP to improve environmental status from poor to very good. Env3<br />
and Env4 are significantly different between them according to Wald test, implying<br />
sensitivity to scope, i.e., WTP more for a better improvement, as theoretically expected.<br />
Bcost is significant and negative, which means negative utility associated with cost:<br />
people are less WTP for a more expensive option, as theoretically expected. Int1 is<br />
significant and positive: people with higher income are WTP more than people with<br />
lower income, as theoretically expected. Int10 is significant and negative: younger<br />
30
people are more WTP for the environment. Int13 is significant and negative: people<br />
having suffered water restrictions in their households are more WTP for reducing the<br />
probability. Int16 is significant and positive, which means that the more people believe<br />
there would be restrictions in the future the more they are WTP to reduce restrictions in<br />
the future. Int19 is significant and positive, which means that members of ecologist<br />
organizations are WTP more for the environment. Int20 is significant and positive, which<br />
means that people who remember their water bill are WTP more.<br />
In a nutshell, people want in general a change. Young people and people with higher<br />
income show greater WTP for the environment. People having suffered water<br />
restrictions in their households have higher WTP for reducing the probability. The results<br />
show “sensitive to scope” in WTP for better environmental conditions (higher<br />
environmental flows generate higher benefits).<br />
31
4.5. Total Economic Value.<br />
In order to aggregate the individual (household) values for the whole population in the<br />
study area, we considered the estimated 172,388 inhabitants (2007 population census)<br />
and an average of 2.73 persons per household. Taking in to account the 2% of protest<br />
answers, we obtained the aggregated values (social cost) for costs due to restrictions in<br />
the domestic supply of 18.42 million € and 3.96 million € for environmental cost<br />
(economic value of achieving the WFD environmental objective), which sum up for a<br />
total cost of 22.38 million € per year (24.86 M€ for very good conditions) from water<br />
scarcity conditions.<br />
Table 12. Aggregated non-market costs of water scarcity in the Serpis <strong>Case</strong> <strong>Study</strong><br />
Total number of households 63,146<br />
Protest answers 2%<br />
Total number of WTP households 61,882<br />
Costs due to restrictions in the domestic<br />
supply (million €)<br />
18.42<br />
Environmental costs (million €) 3.96 - 6.44<br />
Total non-market costs due to the drought 22.38 -24.86<br />
(million €)<br />
32
5. Conclusions.<br />
The study has shown the clear social interest in the Serpis river basin for water scarcity<br />
issues and the need of allocating flow for improving the environmental conditions,<br />
translated into a significant WTP for reducing supply restrictions and for enhancing<br />
water quality in the basin. Two types of non-market costs have been identified: those<br />
related to the decrease of the ecological status of the river basin due to the lowering of<br />
water flows (reduction of the provisioning of ecosystem services) and those related to<br />
the social welfare losses due to the restrictions of water supply in the households for<br />
secondary uses (outdoor use, use of washing machines, etc.). These costs have been<br />
estimated on the basis of a stated preference valuation (choice experiment), and add up<br />
for 22.4 million Euros for both types of costs. These social benefits or avoided costs<br />
should be considered in the implementation of the WFD as a useful input for the cost<br />
recovery analysis, and for the development of the cost-benefit analysis of water<br />
management options and possible disproportionate costs.<br />
The experience in the definition of the common survey design, conditioned by the<br />
requirement for testing transferability of the results, showed the difficulties and<br />
challenges in finding a common design that adapt to different local conditions. The<br />
estimates are expected to be subject to significant transfer errors, due to the differences<br />
on the environmental conditions of the policy and study site and the socio-demographic<br />
differences of the involved, but also due to the fact that the valuation exercise was not<br />
explicitly designed for the purposes for which is used here, and thus some adjustments<br />
and assumptions have been made. This is why these estimates should be interpreted<br />
with caution. However, we believe that they can provide a very illustrative idea of the<br />
magnitude and importance of these costs, which are normally not accounted for in the<br />
estimation of costs, and the under-estimation normally incurred in when calculating them<br />
by the approach of the avoided costs of the measures.<br />
In order to come up with resource opportunity costs, we need to confront the economic<br />
value of water for all the competing uses in the basin. State-preference (SP) techniques<br />
can provide some input for that, but there is a bunch of complementary approaches that<br />
could be applied (combining SP with revealed preferences and other environmental<br />
valuation approaches) into integrated river basin hydro-economic models that can<br />
assess opportunity cost. Although it has not been done in this study, we can relate the<br />
units of quantity (e.g., river discharge) with economic values. On the other hand,<br />
quantity and quality problems are often interrelated, and are difficult to separate. Water<br />
33
scarcity problems lead also to water quality and environmental problems. Other issues<br />
that are not addressed in the study are substitution and uncertainty.<br />
34
6. Best practice recommendations.<br />
A successful valuation exercise requires an extensive and complete pretest. A pretest<br />
was developed (40 interviews), in which we found that the questionnaire was too long,<br />
with an average duration of the interviews of 20 minutes. Particularly, we had the<br />
feelings that there were too many show cards. After that pretest, we reduced the length<br />
of the questionnaire (from 41 questions to 35 questions), mainly removing the<br />
contingent valuation questions and redesigning the choice experiment with 6 blocks of 4<br />
cards, in order to reduce the number of cards. Another pretest was developed and we<br />
were able to reduce the average duration from 20 minutes to 15 minutes. People were<br />
more concentrated, especially when they asked the CE, than in the other design.<br />
With regards to the CE design, we suggest:<br />
• The credibility of the baseline is a fundamental issue in the validity of the<br />
valuation exercise, and need to be carefully tested in the pretest. The<br />
requirement of the common questionnaire for all the participants in the “water<br />
scarcity group” (as discussed in the previous section) reduces the flexibility to<br />
adapt to the local conditions. In any case, our results shown that the scenario<br />
created in the survey was considered credible by most of the respondents.<br />
• The pictures of the choice experiment, to show to the respondents the different<br />
levels of the attributes, must be very clear. People have to be able to distinguish<br />
the difference among the different levels. This should be tested carefully.<br />
• In the income question, we recommended that each category was identified with<br />
a non consecutive letter.<br />
• We suggest to translate the annual payment into cost per month for a better<br />
understanding of the magnitude of the offered quantity (given also that the water<br />
bill is monthly or bi-monthly in most cases, and that it would make it easier for<br />
taking into account the budget limitations).<br />
• Use of a map to show the basin and the location of the cities where the survey is<br />
taking place.<br />
Another interesting issue is the influence of the seasonal status of the resources at the<br />
time of conducting the survey. Given that the issue under question is water scarcity, the<br />
35
perceptions and attitudes of the respondent are affected by the current situation of<br />
resource availability in the basin.<br />
36
References:<br />
Jucar River Basin Authority (Confederación Hidrográfica del Júcar) (2001). Jucar River<br />
Basin Management Plan (Plan Hidrológico de Cuenca del Júcar). Ministerio de Medio<br />
Ambiente, Spain.<br />
Hanley, N., S. Mourato, and R. Wright, (2001). Choice Modelling Approaches: a Superior<br />
Alternative for Environmental Valuation? Journal of Economic Surveys, 15 (3); 435‐462.<br />
Hanley, N., Wrigh, R.E, and Álvarez‐Farizo, B., (2006). Estimating the economic value of<br />
improvements in river ecology using choice experiments: an application to the Water<br />
Framework Directive. J. of Env. Management 78, 183–193<br />
Hensher, D., Rose, J.M., and Greene, W.H., (2005). Applied Choice Analysis. A premier.<br />
Cambridge Univ. Press., Cambridge, UK.<br />
37
ANNEX<br />
Questionnaire and<br />
cards of Choice Exp.<br />
UPVLC<br />
(Spanish)<br />
38
UNIVERSIDAD POLITECNICA DE VALENCIA<br />
Entrevistador:<br />
Municipio:<br />
Fecha:<br />
Sexo del Entrevistado:<br />
N 0 .<br />
Buenos días/tardes. Mi nombre es……, estoy realizando unas entrevistas de parte de la Universidad<br />
Politécnica de Valencia. Estamos interesados en escuchar la opinión pública sobre temas relacionados<br />
con el agua en su región. La entrevista no durará más de 15 minutos. Todas las respuestas son<br />
anónimas, serán tratadas de manera confidencial y no serán utilizadas para ningún otro propósito que el<br />
científico.<br />
0. ¿Reside usted en esta ciudad?<br />
0 = No (le das las gracias a la persona y paras la entrevista)<br />
1 = Sí. ¿Cuál es su código postal?……………………………<br />
1. ¿Cuáles son en su opinión los asuntos o problemas más importantes en su región? (ordene por orden<br />
de prioridad)<br />
1)……………………………………………...........................................<br />
2)……………………………………......................................................<br />
3)……………………………………………...........................................<br />
2. ¿Cómo de importante es para usted el Medio Ambiente en general? (muestra tarjeta)<br />
0 = No importante en absoluto 3 = Importante<br />
1 = No importante 4 = Muy Importante<br />
2 = No importante/ No sin importancia 5 = No lo sé<br />
3. ¿Realiza alguna actividad recreativa en ríos o lagos?<br />
Nota: no se incluye la playa o el mar<br />
0 = No (VE A LA CUESTIÓN 8).<br />
1 = Sí<br />
4. ¿Qué actividades realiza en ríos o lagos? (varias respuestas son posibles)<br />
1 = Avistamiento de aves. 4 = Pescar<br />
2 = Pic-nic / merienda 5 = Paseo y/o senderismo<br />
3 = Nadar 6 = Cazar.............<br />
7 = Pasear en barca 8 = Otro. ¿Cuál?.........<br />
5. ¿Con qué frecuencia ha practicado estas actividades de media durante el año pasado? (muestra<br />
tarjeta)<br />
0 = Una o dos veces al año 3 = Una vez a la semana<br />
1 = Una vez cada tres meses 4 = Más de una vez por semana<br />
2 = Una vez al mes 5 = Otra frecuencia. ¿Cuál?.........<br />
6. ¿Qué distancia tiene que recorrer desde su casa hasta el lugar que visita con mayor frecuencia para<br />
realizar esas actividades? …..….km (en un único sentido).<br />
1
UNIVERSIDAD POLITECNICA DE VALENCIA<br />
Entrevistador:<br />
Municipio:<br />
Fecha:<br />
Sexo del Entrevistado:<br />
7. ¿Qué tipo de masa de agua es? (sólo una) (muestra tarjeta)<br />
1 = Río 4 = Estuario<br />
2 = Arroyo 5 = Otro. ¿Cuál?........................<br />
3 = Lago<br />
8. Ahora voy a hacerle algunas preguntas relacionadas con el agua en la Cuenca del Serpis, de la que se<br />
suministra el agua a la zona donde usted vive (Muestra el mapa). La Cuenca del Serpis cubre un área de<br />
unos 700 km 2 , y proporciona agua para unas 200 mil personas.<br />
¿Hasta qué punto considera la disponibilidad de agua en la Cuenca del Serpis como un problema?<br />
(muestra tarjeta)<br />
0 = No es un problema en absoluto 3 = Es un problema<br />
1 = No es un problema 4 = Es un gran problema<br />
2 = Un pequeño problema 5 = No lo sé<br />
9. ¿Piensa que el medio ambiente se ve afectado de alguna manera por la disponibilidad del agua en la<br />
Cuenca del Serpis?<br />
0 = No.<br />
1= Si.<br />
2= No lo sé/No estoy seguro<br />
10. ¿Ha experimentado su hogar alguno de los siguientes tipos de restricciones de usos del agua<br />
debidos a la disponibilidad limitada de la misma? (varias respuestas) (muestra tarjeta)<br />
0= Mi hogar nunca experimentó restricción alguna de usos de agua debida<br />
a la disponibilidad limitada de la misma (VE A LA CUESTIÓN 12)<br />
1= Mi pozo privado prácticamente se ha secado o está próximo a secarse.<br />
2= En los hogares de mi zona se ha prohibido usar el agua para lavar el<br />
coche, regar los jardines, etcétera<br />
3= Los hogares en mi zona sufrieron cortes de agua por la rotura de<br />
tuberías.<br />
4= En los hogares de mi zona fue prohibido el uso del agua del grifo<br />
debido a la contaminación de la misma.<br />
5= Se organizaron campañas de información para reducir voluntariamente<br />
el consumo del agua.<br />
6= Otras, nómbralas………………………………………………………<br />
2
UNIVERSIDAD POLITECNICA DE VALENCIA<br />
11. ¿Con qué frecuencia ha sufrido restricciones de agua en su hogar en los últimos diez años? (muestra<br />
tarjeta)<br />
0= Mi hogar no ha sufrido restricciones de agua en ninguno de estos últimos 10 años.<br />
Las restricciones de agua fueron impuestas:<br />
1= 1 de los últimos 10 años 6= 6 de los últimos 10 años<br />
2= 2 de los últimos 10 años 7= 7 de los últimos 10 años<br />
3= 3 de los últimos 10 años 8=8 de los últimos 10 años<br />
4= 4 de los últimos 10 años 9= 9 de los últimos 10 años<br />
5= 5 de los últimos 10 años 10= cada año<br />
12. ¿Se ve profesionalmente o en su ámbito de trabajo afectado de alguna manera por la disponibilidad o<br />
restricciones del agua?<br />
0 = No (VE A LA CUESTIÓN 14)<br />
1 = Sí<br />
13. ¿Puede explicar brevemente en qué sentido?…………………………………………………………….<br />
...................................................................................................<br />
………………………………………………………………………..<br />
……………………………………………………………………….<br />
14. ¿Cree que su hogar sufrirá alguna restricción de agua en los próximos años?<br />
0 = No, sin duda (VE A LA CUESTIÓN 16)<br />
1 = Probablemente no (VE A LA CUESTIÓN 16)<br />
2 = No lo sé/ No estoy seguro<br />
3 = Probablemente sí<br />
4 = Sí, sin duda<br />
15. Si es así, ¿podría decirme con qué frecuencia se producirán en los próximos 10 años? (muestra<br />
tarjeta)<br />
0= En ninguno de los próximos 10 años<br />
Las restricciones ocurrirán:<br />
1= 1 de los próximos 10 años 6= 6 de los próximos 10 años<br />
2= 2 de los próximos 10 años 7= 7 de los próximos 10 años<br />
3= 3 de los próximos 10 años 8=8 de los próximos 10 años<br />
4= 4 de los próximos 10 años 9= 9 de los próximos 10 años<br />
5= 5 de los próximos 10 años 10= cada año<br />
3
UNIVERSIDAD POLITECNICA DE VALENCIA<br />
16. ¿Está usted de acuerdo o en desacuerdo con las siguientes afirmaciones? (muestra tarjeta)<br />
16.1. “El medio ambiente tiene derecho a ser protegido independientemente de su coste”<br />
0 = Completamente en desacuerdo 3 = De acuerdo<br />
1 = En desacuerdo 4 = Completamente de acuerdo<br />
2 = Ni de acuerdo/Ni en<br />
5 = No lo sé<br />
desacuerdo<br />
16.2. “La escasez del agua es un fenómeno natural más allá del control humano”<br />
0 = Completamente en desacuerdo 3 = De acuerdo<br />
1 = En desacuerdo 4 = Completamente de acuerdo<br />
2 = Ni de acuerdo/Ni en<br />
5 = No lo sé<br />
desacuerdo<br />
16.3. “La calidad del agua en mi región es muy baja”<br />
0 = Completamente en desacuerdo 3 = De acuerdo<br />
1 = En desacuerdo 4 = Completamente de acuerdo<br />
2 = Ni de acuerdo/Ni en desacuerdo 5 = No lo sé<br />
16.4. “La calidad del agua es un asunto más importante<br />
que el de las posibles restricciones o cortes de agua”<br />
0 = Completamente en desacuerdo 3 = De acuerdo<br />
1 = En desacuerdo 4 = Completamente de acuerdo<br />
2 = Ni de acuerdo/Ni en desacuerdo 5 = No lo sé<br />
⇒ Ahora me gustaría informarle de lo siguiente. Actualmente, la limitada disponibilidad de agua da como<br />
resultado, de vez en cuando y durante los periodos de sequía, niveles bajos de agua en los ríos, arroyos,<br />
lagos y acuíferos, afectando al estado ambiental de estas aguas de un modo negativo.<br />
Los expertos en cambio climático predicen que la escasez de agua en España se incrementará en los<br />
próximos 10 años debido a condiciones climáticas más extremas como son las sequías y una<br />
disminución general de las precipitaciones. Al mismo tiempo se espera que la demanda de agua de los<br />
hogares, agricultura e industria se mantenga al mismo nivel actual o incluso se incremente.<br />
Suponiendo que este escenario se materializara, la probabilidad de restricciones en diferentes usos de<br />
agua aumentaría, pudiendo afectar a zonas donde hasta ahora nunca se han sufrido.<br />
4
UNIVERSIDAD POLITECNICA DE VALENCIA<br />
En los hogares, una restricción en usos de agua significa limitaciones en los usos de agua puertas<br />
afuera, es decir: usted no podría por ejemplo lavar su coche, regar el jardín o llenar las piscinas. Los<br />
usos de agua en el interior del hogar como beber agua o el agua necesaria para su higiene personal<br />
estarán siempre garantizados.<br />
⇒ Además de los hogares, la agricultura y la industria, el medio ambiente también necesitan agua.<br />
Cuando el agua es escasa, no hay suficiente agua en los ríos y acuíferos para mantener el medio<br />
ambiente en buen estado. El número y la diversidad de peces y otros animales que viven en o cerca del<br />
agua se reducen, la vegetación de la ribera desaparece y los ríos y acuíferos podrían secarse.<br />
17. ¿Cómo de familiarizado está usted con esta información? (muestra tarjeta)<br />
0 = No familiarizado en absoluto/ Nunca había escuchado esto<br />
1 = No familiarizado<br />
2 = Algo familiarizado<br />
3 = Familiarizado<br />
4 = Muy familiarizado<br />
18. ¿Cómo de creíble es para ti que la escasez de agua se incremente en la Cuenca del Serpis en los<br />
próximos 10 años? (muestra tarjeta)<br />
0 = No creíble en absoluto 3 = Creíble<br />
1 = No creíble 4 = Muy Creíble<br />
2 = Algo creíble 5 = No lo sé<br />
⇒ Para informar a los gestores del agua, nos gustaría escuchar su opinión acerca de las garantías de<br />
suministro de agua en los próximos 10 años para diferentes usos, incluyendo el medio ambiente.<br />
Para ello, le voy a presentar una serie de tarjetas como ésta (muestra la tarjeta ejemplo), mostrando cada<br />
vez dos situaciones futuras diferentes caracterizadas por la probabilidad de que usted pueda sufrir<br />
restricciones en usos de agua, un cambio en los niveles de agua en los ríos y acuíferos, sus<br />
consecuencias en el medio ambiente y un precio para los hogares, en vista de que tomar medidas<br />
adicionales para asegurar el suministro futuro de agua para hogares y medio ambiente cuesta dinero.<br />
Las medidas para ahorrar agua tendrían que ser asumidas por todos los usos del agua, esto es:<br />
agricultura, industria y hogares, y si se adoptan medidas más estrictas para ahorrar agua, se dispondría<br />
de una mayor cantidad de agua pero el coste sería mayor.<br />
Cada uso del agua contribuiría a este coste de una manera equilibrada en función de la cantidad que<br />
consuma, y en el caso de los hogares, el coste sería pagado cada año a través de un incremento en el<br />
recibo actual del agua desde el próximo año hasta los próximos 10 años, es decir hasta el año 2018<br />
(inclusive) para anticiparnos a la futura escasez de agua.<br />
⇒ Supongamos también que, si no se hiciera nada, en el hogar usted se enfrentaría actualmente a la<br />
probabilidad de sufrir restricciones en los usos de agua durante 4 de los próximos 10 años, hasta el año<br />
2018 (inclusive), basado en las predicciones de expertos en cambio climático. Esto significa que durante<br />
los próximos 10 años usted se enfrentaría a posibles restricciones en usos de agua puertas afuera en 4<br />
años diferentes. Esto es, que usted no podría regar su jardín, lavar su coche o llenar las piscinas durante<br />
5
UNIVERSIDAD POLITECNICA DE VALENCIA<br />
ciertos días en el verano de aquellos años. Este déficit de agua podría durar hasta 20 días, con<br />
restricciones de usos del agua durante 5 ó 6 horas por día.<br />
Dependiendo de las medidas de ahorro de agua, esta probabilidad de restricciones de agua en 4 veranos<br />
en los próximos 10 años podría verse reducida a 3, 2 ó 1 año de 10. (muestra la tarjeta con los dos<br />
atributos).<br />
⇒ Por otra parte, asegurar el suministro de agua futura para el medio ambiente significa que los niveles<br />
de los ríos y los acuíferos se incrementen en los próximos 10 años, hasta el 2018 (inclusive), reduciendo<br />
el riesgo de que se sequen y aumentando las condiciones de vida para peces, plantas y otros animales<br />
que viven en el agua o cerca de ella. Dependiendo de las medidas para ahorrar agua que se adopten,<br />
podemos distinguir 3 niveles de situación ambiental respecto a la mala situación esperada con niveles<br />
bajos de agua y calidad ambiental pobre en los próximos 10 años en la cuenca del Serpis:<br />
-Mala: esta es la situación prevista en los próximos 10 años, con niveles de agua y calidad<br />
ambiental bajos. Esto supone una gran brecha respecto a la situación natural del río, por el aumento de<br />
la escasez de agua. Muchas especies de peces desaparecerán y en las riberas de los ríos se perderán la<br />
mayoría de la vegetación. Como resultado de ello la mayoría de aves desaparecerán también.<br />
-Moderado: los niveles de agua y la calidad ambiental se encuentran todavía bastante por debajo<br />
de las condiciones naturales medias. Hay una brecha considerable entre la situación moderada y la<br />
natural.<br />
Un número limitado de especies de peces están presentes.<br />
Los márgenes tendrían algo de vegetación, sirviendo ésta de soporte para un número y variedad limitada<br />
de aves y otros animales.<br />
-Bueno: los niveles de agua y la calidad ambiental están próximos a los niveles medios naturales.<br />
Hay una pequeña brecha entre la situación buena y la natural.<br />
Bajo estas condiciones las riberas tienen una cubierta vegetal más ligera que la natural. Como resultado<br />
la reproducción y las condiciones para anidar para algunas aves son limitadas.<br />
-Muy bueno: los niveles de agua y la calidad ambiental están en su estado natural. No existe<br />
brecha entre la situación muy buena y la natural.<br />
Las condiciones para la vida animal y la flora son óptimas bajo estas circunstancias.<br />
Basándonos en estas alternativas, le voy a preguntar a usted que situación es la que más prefiere,<br />
teniendo en cuenta el incremento que sufrirá su recibo del agua. No le estoy preguntando que valore<br />
ninguna medida específica necesaria para lograr garantizar un suministro futuro de agua. Usted también<br />
puede elegir ninguna de las dos situaciones. En ese caso usted estaría diciendo que no desearía pagar<br />
ninguna cantidad extra en su recibo del agua y que aceptaría la probabilidad de tener que afrontar un<br />
aumento de restricciones de usos de agua en los próximos 10 años y el deterioro de la calidad ambiental<br />
de los ríos y acuíferos. En primer lugar le voy a enseñar un ejemplo. (muestra la tarjeta ejemplo )<br />
6
UNIVERSIDAD POLITECNICA DE VALENCIA<br />
19. Por favor mire las siguientes tarjetas e indíqueme que opción prefiere.<br />
SEÑALA QUÉ VERSIÓN DE CUADERNILLO ESTÁS USANDO<br />
Versión:<br />
1 2 3<br />
4 5 6<br />
Situación A Situación B Ninguna de los dos<br />
Tarjeta ejemplo □ □ □<br />
a. Tarjeta 1 □ □ □<br />
b. Tarjeta 2 □ □ □<br />
c. Tarjeta 3 □ □ □<br />
d. Tarjeta 4 □ □ □<br />
SI LA PERSONA ELIGE 4 VECES “NO SE TOMA NINGUNA MEDIDA” VE A CUESTIÓN 20, SINO A LA<br />
CUESTIÓN 21<br />
20. ¿Puede explicar por qué ha elegido las 4 veces “No se toma ninguna medida”?<br />
1 = No estoy interesado en asegurar el suministro futuro de agua para mi o para el medio ambiente.<br />
2 = La situación actual es suficientemente buena.<br />
3 = No puedo permitirme pagar un dinero extra.<br />
4 = Prefiero gastar mi dinero en otras cosas importantes.<br />
5 = Otra razón. ¿Cuál?……………………………………<br />
AHORA VE A LA CUESTIÓN 22<br />
21. ¿Puede explicarme brevemente cual es la principal razón de sus elecciones? (Sólo 1 respuesta,<br />
Nombre la razón más importante)<br />
1 = Reducir la probabilidad en las restricciones de usos de agua.<br />
2 = Aumentar la calidad ambiental de ríos y acuíferos.<br />
3 = El coste (demasiado alto, bien de precio, aceptable, razonable) (marca el apropiado)<br />
4 = Otra razón. ¿Cuál?………………………………………..<br />
22. ¿Le han parecido creíbles las alternativas que le he presentado?(No leer) (muestra tarjeta)<br />
0 = No creíbles en absoluto 3 = Creíbles<br />
1 = No creíbles 4 = Muy creíbles<br />
2 = Algo creíbles 5 = No sabe<br />
7
UNIVERSIDAD POLITECNICA DE VALENCIA<br />
23. ¿Qué cree que sucederá si no son tomadas medidas adicionales para ahorrar agua? (varias<br />
respuestas son posibles)<br />
0= Nada, no creo que haya problemas de agua en el futuro.<br />
1 = El medio ambiente permanecerá en un mal estado<br />
2 = Mi hogar también sufrirá restricciones de agua en el futuro.<br />
3 =Otra, nómbrela………………………………………….<br />
4= No lo sé<br />
24. ¿Le importaría decirme cuánto paga actualmente en su recibo del agua?<br />
0 = No tengo recibo del agua/ No pago por el agua<br />
1 = No lo recuerdo<br />
2=……….euros por mes/ 2 meses/ 3 meses/ 6 meses /año (Marca la apropiada)<br />
25. Después de los hogares, que usuario debería de tener siempre la mayor prioridad, en su opinión,<br />
cuando el agua es escasa y hay que tomar una decisión de distribuir el agua disponible limitada entre la<br />
agricultura, el medio ambiente y la industria.<br />
Señalar número en el ranking<br />
Agricultura ……… Industria ……….Medio Ambiente ………<br />
26. El entrevistado es:<br />
0=Hombre<br />
1=Mujer<br />
⇒ Finalmente me gustaría hacerle algunas preguntas sobre su situación personal para propósitos<br />
estadísticos, sólo es para evaluar la representatividad de la encuesta. Por favor, tenga en cuenta que<br />
todos los datos serán tratados de forma confidencial.<br />
27. ¿Cuál es su año de nacimiento? 19…<br />
28. ¿Cuántas personas viven en su hogar incluyéndole a usted?……….. personas<br />
29. ¿Cuántos niños (menores de 18) hay en su hogar?………<br />
30.¿Cuáles son los estudios de mayor nivel que ha completado?<br />
0= Sin estudios.<br />
1= Secundaria/E.G.B./F.P.<br />
2 = Bachiller/BUP y COU.<br />
3 = Universidad.<br />
4= Otros, Nómbrelos…………….<br />
8
UNIVERSIDAD POLITECNICA DE VALENCIA<br />
31. ¿Cuál es su profesión? (dejar que conteste solo y después señalar la opción más adecuada)<br />
0 = Sin empleo, buscando trabajo. 6 =Empleado en Sanidad<br />
1 =Agricultor 7 =Empleado en Educación<br />
2 = Sector del turismo 8 = Retirado<br />
3 =Pescador 9 = Estudiante<br />
4 =Empleado en el sector servicios 10 = Ama-o de casa/sus labores<br />
5 =Empleado en la industria 11= Otro. ¿Cuál?......<br />
32. ¿Podría indicarme a qué letra de esta tarjeta (enseñar tarjeta con los niveles de ingresos)<br />
corresponde el total de ingresos conjuntos de su hogar al mes? Ingresos netos, después de impuestos.<br />
(Esta información será tratada de manera confidencial)<br />
J H C S X<br />
N A F L R<br />
33. ¿Es miembro de alguna organización ecologista o ambiental?<br />
0 = No (fin de la entrevista)<br />
1 = Sí. ¿Cuál?:<br />
1 = WWF/Adena 3 = Organización de Protección de<br />
aves<br />
2 = Greenpeace 4 = Otra. ¿Cuál?.................<br />
(AHORA VE A LA CUESTIÓN 34)<br />
34. ¿Podría decirme cuánto paga de media cada año en esta organización?................. euros al año.<br />
ESTA ENTREVISTA SE HA BASADO EN EL PLANTEAMIENTO DE UN ESCENARIO HIPOTÉTICO PARA EL<br />
ESTUDIO, QUE NO IMPLICA NECESARIAMENTE QUE SEA EL QUE SE DARÁ EN LA REALIDAD EN LA<br />
CUENCA.<br />
ESTE ES EL FINAL DE LA ENTREVISTA.<br />
MUCHAS GRACIAS POR SU COLABORACIÓN<br />
9
CARD 1 ( CHOICE EXPERIMENT) 2.1<br />
6.6 € (80 €) 8.3 € (100 €)<br />
0 €
CARD 2 ( CHOICE EXPERIMENT)<br />
2.2<br />
10 € (120 €) 5 € (60 €)<br />
0 €
CARD 3 ( CHOICE EXPERIMENT)<br />
2.3<br />
1.6 € (20 €) 3.3 € (40 €)<br />
0 €
2.4<br />
CARD 4 (CHOICE EXPERIMENT)<br />
5 € (60 €) 6.6 € (80 0 €