1500 Thu 3 Bristow Group - Jefferies
1500 Thu 3 Bristow Group - Jefferies
1500 Thu 3 Bristow Group - Jefferies

You also want an ePaper? Increase the reach of your titles
YUMPU automatically turns print PDFs into web optimized ePapers that Google loves.
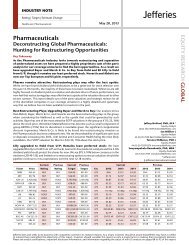
Adjusted EBITDAR margin* trend<br />
2010 2011<br />
Q1 Q2 Q3 Q4 Full Year Q1 Q2 Q3 Q4 Full Year<br />
EBU 31.2% 31.7% 31.9% 28.0% 30.8% 29.8% 31.5% 34.6% 34.4% 32.7%<br />
WASBU 31.7% 36.8% 33.7% 39.1% 36.0% 33.7% 36.9% 35.8% 34.3% 35.2%<br />
NABU 18.3% 20.0% 14.9% 17.7% 17.8% 20.8% 25.8% 15.9% 8.5% 18.5%<br />
AUSBU 26.5% 36.7% 34.4% 31.3% 32.4% 33.2% 26.1% 27.0% 31.1% 29.3%<br />
OIBU 34.4% 37.6% 25.9% 25.1% 31.0% 18.3% 40.2% 37.4% 59.4% 39.3%<br />
Consolidated 24.7% 27.8% 24.7% 23.9% 25.3% 23.8% 27.5% 25.9% 29.6% 26.7%<br />
2012 2013<br />
Q1 Q2 Q3 Q4 Full Year Q1 Q2<br />
EBU 33.0% 31.4% 30.7% 36.1% 32.9% 32.2% 34.6%<br />
WASBU 29.5% 35.5% 37.2% 36.6% 35.0% 31.9% 26.5%<br />
NABU 14.3% 20.6% 14.8% 19.4% 17.3% 23.2% 20.7%<br />
AUSBU 20.2% 14.4% 23.5% 35.6% 24.3% 27.0% 28.0%<br />
OIBU 48.1% 19.1% 47.8% 42.9% 39.5% 36.2% 44.2%<br />
Consolidated 23.4% 24.0% 27.6% 31.2% 26.6% 26.3% 26.1%<br />
* Adjusted EBITDAR excludes special items and asset dispositions and calculated by taking adjusted EBITDAR divided by operating revenue<br />
29

![1530 Wed 3 Basic Energy Services [Compatibility Mode] - Jefferies](https://img.yumpu.com/23648530/1/190x135/1530-wed-3-basic-energy-services-compatibility-mode-jefferies.jpg?quality=85)