GAAP reconciliation Three Months Ended Six Months Ended September 30, September 30, 2012 2011 2012 2011 (In thousands) Adjusted operating income ................................................................ $ 46,274 $ 38,493 $ 93,276 $ 73,482 Loss on disposal of assets ................................................................(1,262) (1,611) (6,577) (195) Special items ................................................................................................ 2,316 (27,287) 622 (27,287) Operating income ................................................................................................ $ 47,328 $ 9,595 $ 87,321 $ 46,000 Adjusted EBITDAR ................................................................................................ $ 84,922 $ 71,235 $ 168,727 $ 138,260 Loss on disposal of assets ................................................................(1,262) (1,611) (6,577) (195) Special items ................................................................................................ 2,316 (24,610) 622 (24,610) Depreciation and amortization ................................................................ (23,321) (25,431) (44,693) (48,139) Rent expense ................................................................................................ (15,282) (9,108) (31,556) (18,061) Interest expense ................................................................................................ (8,597) (9,459) (17,371) (18,414) (Provision) benefit for income taxes ................................................................ (8,342) 1,945 (14,522) (4,661) Net income ................................................................................................ $ 30,434 $ 2,961 $ 54,630 $ 24,180 Adjusted net income ................................................................................................ $ 29,153 $ 23,287 $ 58,425 $ 43,227 Loss on disposal of assets ................................................................ (990) (1,257) (5,196) (152) Special items ................................................................................................ 1,505 (19,319) 101 (19,319) Net income attributable to <strong>Bristow</strong> <strong>Group</strong> ................................ $ 29,668 $ 2,711 $ 53,330 $ 23,756 Adjusted diluted earnings per share ................................................................ $ 0.80 $ 0.63 $ 1.60 $ 1.18 Loss on disposal of assets ................................................................ (0.03) (0.03) (0.14) — Special items ................................................................................................ 0.04 (0.53) — (0.53) Diluted earnings per share ................................................................ 0.82 0.07 1.46 0.65 34
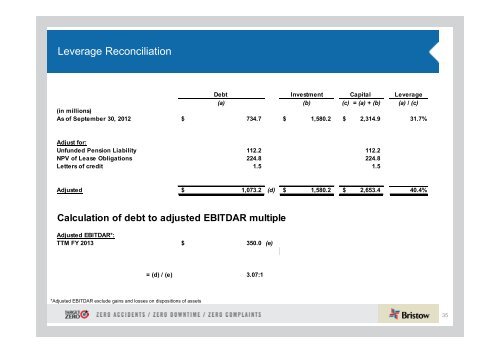
Leverage Reconciliation Debt Investment Capital Leverage (a) (b) (c) = (a) + (b) (a) / (c) (in millions) As of September 30, 2012 $ 734.7 $ 1,580.2 $ 2,314.9 31.7% Adjust for: Unfunded Pension Liability 112.2 112.2 NPV of Lease Obligations 224.8 224.8 Letters of credit 1.5 1.5 Adjusted $ 1,073.2 (d) $ 1,580.2 $ 2,653.4 40.4% Calculation of debt to adjusted EBITDAR multiple Adjusted EBITDAR*: TTM FY 2013 $ 350.0 (e) = (d) / (e) 3.07:1 *Adjusted EBITDAR exclude gains and losses on dispositions of assets 35


![1530 Wed 3 Basic Energy Services [Compatibility Mode] - Jefferies](https://img.yumpu.com/23648530/1/190x135/1530-wed-3-basic-energy-services-compatibility-mode-jefferies.jpg?quality=85)