Environmental Effects of Increased Atmospheric Carbon Dioxide
Environmental Effects of Increased Atmospheric Carbon Dioxide
Environmental Effects of Increased Atmospheric Carbon Dioxide

You also want an ePaper? Increase the reach of your titles
YUMPU automatically turns print PDFs into web optimized ePapers that Google loves.
the increase in production <strong>of</strong> C02 from human activities since<br />
the Industrial Revolution.<br />
, 18<br />
-1.0 I I<br />
1750 1800 1850 1900 1950 2000<br />
Year<br />
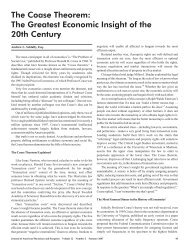
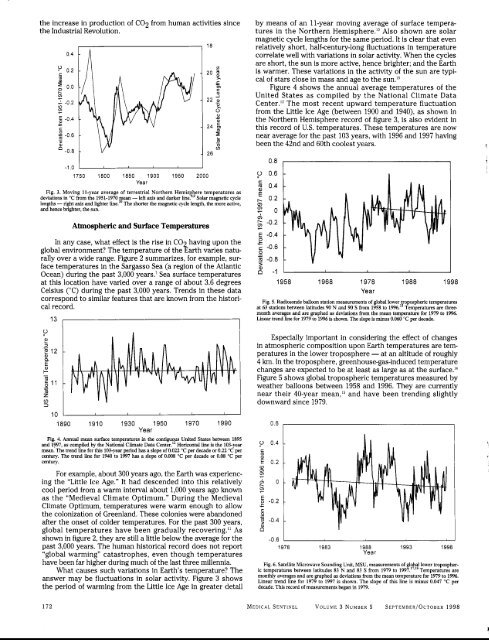
Fig. 3. Moving 11-year average <strong>of</strong> terrestrial Northern Hemisphere temperatures as<br />
deviations in “C from the 1951-1970 mean - left axis and darker Solar magnetic cycle<br />
lengths - right axis and lighter line.” The shorter the magnetic cycle length, the more active,<br />
and hence brighter, the sun.<br />
<strong>Atmospheric</strong> and Surface Temperatures<br />
In any case, what effect is the rise in C02 having upon the<br />
global environment? The temperature <strong>of</strong> the Earth varies naturally<br />
over a wide range. Figure 2 summarizes, for example, surface<br />
temperatures in the Sargasso Sea (a region <strong>of</strong> the Atlantic<br />
Ocean) during the past 3,000 years.’ Sea surface temperatures<br />
at this location have varied over a range <strong>of</strong> about 3.6 degrees<br />
Celsius (“C) during the past 3,000 years. Trends in these data<br />
correspond to similar features that are known from the historical<br />
record.<br />
13<br />
1 1 I I I<br />
1890 1910 1930 1950 1970 1990<br />
Year<br />
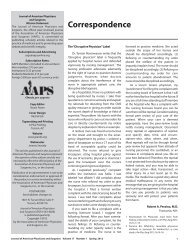
Fig. 4. Annual mean surface temperatures in the contiguous United States between 1895<br />
and 1897, as compiled by the National Climate Data Center.” Horizontal line is the 103-year<br />
mean. The trend line for this 103-year period has a slope <strong>of</strong> 0.022 “C per decade or 0.22 OC per<br />
century. The trend line for 1940 to 1997 has a slope <strong>of</strong> 0.008 “C per decade or 0.08 OC per<br />
century.<br />
For example, about 300 years ago, the Earth was experiencing<br />
the “Little Ice Age.” It had descended into this relatively<br />
cool period from a warm interval about 1,000 years ago known<br />
as the “Medieval Climate Optimum.” During the Medieval<br />
Climate Optimum, temperatures were warm enough to allow<br />
the colonization <strong>of</strong> Greenland. These colonies were abandoned<br />
after the onset <strong>of</strong> colder temperatures. For the past 300 years,<br />
global temperatures have been gradually recovering.” As<br />
shown in figure 2, they are still a little below the average for the<br />
past 3,000 years. The human historical record does not report<br />
“global warming” catastrophes, even though temperatures<br />
have been far higher during much <strong>of</strong> the last three millennia.<br />
What causes such variations in Earth’s temperature? The<br />
answer may be fluctuations in solar activity. Figure 3 shows<br />
the period <strong>of</strong> warming from the Little Ice Age in greater detail<br />
by means <strong>of</strong> an 11-year moving average <strong>of</strong> surface temperatures<br />
in the Northern Hemisphere.’O Also shown are solar<br />
magnetic cycle lengths for the same period. It is clear that even<br />
relatively short, half-century-long fluctuations in temperature<br />
correlate well with variations in solar activity. When the cycles<br />
are short, the sun is more active, hence brighter; and the Earth<br />
is warmer. These variations in the activity <strong>of</strong> the sun are typical<br />
<strong>of</strong> stars close in mass and age to the sun.13<br />
Figure 4 shows the annual average temperatures <strong>of</strong> the<br />
United States as compiled by the National Climate Data<br />
Center.” The most recent upward temperature fluctuation<br />
from the Little Ice Age (between 1900 and 1940), as shown in<br />
the Northern Hemisphere record <strong>of</strong> figure 3, is also evident in<br />
this record <strong>of</strong> US. temperatures. These temperatures are now<br />
near average for the past 103 years, with 1996 and 1997 having<br />
been the 42nd and 60th coolest years.<br />
2 0.4<br />
C<br />
8<br />
-<br />
C<br />
.-<br />
9 -0.4<br />
8<br />
0.8<br />
g 0.6<br />
5 0.4<br />
E<br />
0.2<br />
0)<br />
0)<br />
7 0<br />
h<br />
6 -0.2<br />
7<br />
-0.4<br />
L t<br />
c -0.6<br />
0<br />
3<br />
.- -0.8<br />
s<br />
o -1 I<br />
-<br />
E 0.2 -<br />
a<br />
m<br />
.?<br />
m 0 -<br />
rṁ r<br />
E -0.2 -<br />
-<br />
I<br />
1958 1968 1978 1988 1998<br />
Year<br />
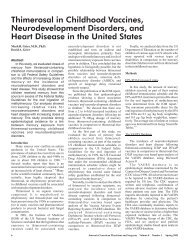
Fig. 5. Radiosonde balloon station measurements <strong>of</strong> global lower tropospheric temperatures<br />
at 63 stations between latitudes 90 N and 90 S from 1958 to 1996.15 Temperatures are threemonth<br />
averages and are graphed as deviations from the mean temperature for 1979 to 1996.<br />
Linear trend line for 1979 to 1996 is shown. The slope is minus 0.060 “C per decade.<br />
Especially important in considering the effect <strong>of</strong> changes<br />
in atmospheric composition upon Earth temperatures are temperatures<br />
in the lower troposphere - at an altitude <strong>of</strong> roughly<br />
4 km. In the troposphere, greenhouse-gas-induced temperature<br />
changes are expected to be at least as large as at the surfa~e.’~<br />
Figure 5 shows global tropospheric temperatures measured by<br />
weather balloons between 1958 and 1996. They are currently<br />
near their 40-year mean,15 and have been trending slightly<br />
downward since 1979.<br />
0.6<br />
-0.6 I<br />
1978 1983 1988<br />
Year<br />
1993 1998<br />
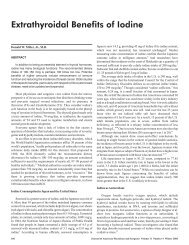
Fig. 6. Satellite Microwave Sounding Unit, MSU, measurements <strong>of</strong> global lower tropospheric<br />
temperatures between latitudes 83 N and 83 S from 1979 to 1997.”,’* Temperatures are<br />
monthly averages and are graphed as deviations from the mean temperature for 1979 to 1996.<br />
Linear trend line for 1979 to 1997 is shown. The slope <strong>of</strong> this line is minus 0.047 “C per<br />
decade. This record <strong>of</strong> measurements began in 1979.<br />
I<br />
172 MEDICAL SENTINEL<br />
VOLUME 3 NUMBER 5 SEPTEMBER/~CTOBER 1998