Environmental Effects of Increased Atmospheric Carbon Dioxide
Environmental Effects of Increased Atmospheric Carbon Dioxide
Environmental Effects of Increased Atmospheric Carbon Dioxide

Create successful ePaper yourself
Turn your PDF publications into a flip-book with our unique Google optimized e-Paper software.
120<br />
100<br />
i<br />
j 80<br />
E<br />
P<br />
60<br />
i%<br />
5 40<br />
20<br />
0<br />
Ocean Surface North-Swth<br />
Flux Correction Wnamic<br />
Humidity MWdS Grenhouse<br />
(Doubled C02)<br />
Heat Flux By<br />
Motlons<br />
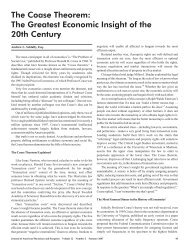
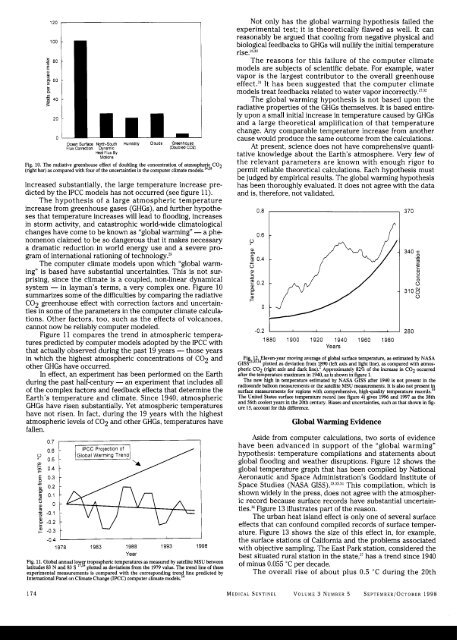
Fig. 10. The radiative greenhouse effect <strong>of</strong> doubling the concentration <strong>of</strong> atmospheric CO2<br />
(right bar) as compared with four <strong>of</strong> the uncertainties in the computer climate model^.'^^*^<br />
increased substantially, the large temperature increase predicted<br />
by the IPCC models has not occurred (see figure 11).<br />
The hypothesis <strong>of</strong> a large atmospheric temperature<br />
increase from greenhouse gases (GHGs), and further hypotheses<br />
that temperature increases will lead to flooding, increases<br />
in storm activity, and catastrophic world-wide climatological<br />
changes have come to be known as “global warming” - a phe<br />
nomenon claimed to be so dangerous that it makes necessary<br />
a dramatic reduction in world energy use and a severe program<br />
<strong>of</strong> international rationing <strong>of</strong> techn01ogy.2~<br />
The computer climate models upon which “global warming”<br />
is based have substantial uncertainties. This is not surprising,<br />
since the climate is a coupled, non-linear dynamical<br />
system - in layman’s terms, a very complex one. Figure 10<br />
summarizes some <strong>of</strong> the difficulties by comparing the radiative<br />
CO2 greenhouse effect with correction factors and uncertainties<br />
in some <strong>of</strong> the parameters in the computer climate calculations.<br />
Other factors, too, such as the effects <strong>of</strong> volcanoes,<br />
cannot now be reliably computer modeled.<br />
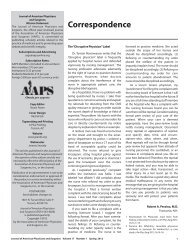
Figure 11 compares the trend in atmospheric temperatures<br />
predicted by computer models adopted by the IPCC with<br />
that actually observed during the past 19 years - those years<br />
in which the highest atmospheric concentrations <strong>of</strong> C02 and<br />
other GHGs have occurred.<br />
In effect, an experiment has been performed on the Earth<br />
during the past half-century - an experiment that includes all<br />
<strong>of</strong> the complex factors and feedback effects that determine the<br />
Earth’s temperature and climate. Since 1940, atmospheric<br />
GHGs have risen substantially. Yet atmospheric temperatures<br />
have not risen. In fact, during the 19 years with the highest<br />
atmospheric levels <strong>of</strong> Cog and other GHGs, temperatures have<br />
fallen.<br />
m<br />
5 04<br />
E 0.3<br />
z 0.2<br />
-<br />
-<br />
P m 0.1 -<br />
r<br />
O -<br />
-0.1<br />
-0.2<br />
-0.3<br />
-<br />
-<br />
IPCC Projection <strong>of</strong><br />
Global Warming Trend<br />
u<br />
-0.4<br />
1978 1983 1988 1993 1998<br />
Year<br />
Fig. 11. Global annual lower tropospheric temperatures as measured by satellite MSU between<br />
latitudes 83 N and 83 S ”J~ plotted as deviations from the 1979 value. The trend line <strong>of</strong> these<br />
experimental measurements is compared with the corresponding trend line predicted by<br />
International Panel on Climate Change (IPCC) computer climate models.’4<br />
Not only has the global warming hypothesis failed the<br />
experimental test; it is theoretically flawed as well. It can<br />
reasonably be argued that cooling from negative physical and<br />
biological feedbacks to GHGs will nullify the initial temperature<br />
The reasons for this failure <strong>of</strong> the computer climate<br />
models are subjects <strong>of</strong> scientific debate. For example, water<br />
vapor is the largest contributor to the overall greenhouse<br />
effe~t.~’ It has been suggested that the computer climate<br />
models treat feedbacks related to water vapor in~orrectly.~~~~~<br />
The global warming hypothesis is not based upon the<br />
radiative properties <strong>of</strong> the GHGs themselves. It is based entirely<br />
upon a small initial increase in temperature caused by GHGs<br />
and a large theoretical amplification <strong>of</strong> that temperature<br />
change. Any comparable temperature increase from another<br />
cause would produce the same outcome from the calculations.<br />
At present, science does not have comprehensive quantitative<br />
knowledge about the Earth’s atmosphere. Very few <strong>of</strong><br />
the relevant parameters are known with enough rigor to<br />
permit reliable theoretical calculations. Each hypothesis must<br />
be judged by empirical results. The global warming hypothesis<br />
has been thoroughly evaluated. It does not agree with the data<br />
and is, therefore. not validated.<br />
b.’<br />
5<br />
0.8<br />
0.6<br />
a, m<br />
5 0.4<br />
P<br />
4-<br />
g 0.2<br />
E<br />
F<br />
0<br />
-0.2<br />
1880 1900 1920 1940 1960 1980<br />
Years<br />
f<br />
370<br />
340 6<br />
‘ci<br />
P<br />
L<br />
C<br />
8<br />
s<br />
3108<br />
0<br />
’<br />
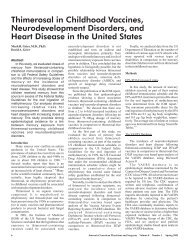
12. Eleven-year moving average <strong>of</strong> global surface temperature, as estimated by NASA<br />
G133,33,34 plotted as deviation from 1890 (left axis and light line), as compared with atmospheric<br />
CO2 (right axis and dark line).” Approximately 82% <strong>of</strong> the increase in CO2 occurred<br />
after the temperature maximum in 1940, as is shown in figure 1.<br />
The new high in temperature estimated by NASA GISS after 1940 is not present in the<br />
radiosonde balloon measurements or the satellite MSU measurements. It is also not present in<br />
surface measurements for regions with comprehensive, high-quality temperature record^.'^<br />
The United States surface temperature record (see figure 4) gives 1996 and 1997 as the 38th<br />
and 56th coolest years in the 20th century. Biases and uncertainties, such as that shown in figure<br />
13. account for this difference.<br />
Global Warming Evidence<br />
Aside from computer calculations, two sorts <strong>of</strong> evidence<br />
have been advanced in support <strong>of</strong> the “global warming”<br />
hypothesis: temperature compilations and statements about<br />
global flooding and weather disruptions. Figure 12 shows the<br />
global temperature graph that has been compiled by National<br />
Aeronautic and Space Administration’s Goddard Institute <strong>of</strong><br />
Space Studies (NASA GISS).23,33,34 This compilation, which is<br />
shown widely in the press, does not agree with the atmospheric<br />
record because surface records have substantial uncertainties.36<br />
Figure 13 illustrates part <strong>of</strong> the reason.<br />
The urban heat island effect is only one <strong>of</strong> several surface<br />
effects that can confound compiled records <strong>of</strong> surface temperature.<br />
Figure 13 shows the size <strong>of</strong> this effect in, for example,<br />
the surface stations <strong>of</strong> California and the problems associated<br />
with objective sampling. The East Park station, considered the<br />
best situated rural station in the has a trend since 1940<br />
<strong>of</strong> minus 0.055 “C per decade.<br />
The overall rise <strong>of</strong> about plus 0.5 “C during the 20th<br />
280<br />
174 MEDICAL SENTINEL<br />
VOLGME 3 NUMBER 5 SEPTEMBER/~CTOBER 1998