Environmental Effects of Increased Atmospheric Carbon Dioxide
Environmental Effects of Increased Atmospheric Carbon Dioxide
Environmental Effects of Increased Atmospheric Carbon Dioxide

Create successful ePaper yourself
Turn your PDF publications into a flip-book with our unique Google optimized e-Paper software.
I<br />
0.8<br />
p 0.7<br />
CD<br />
0)<br />
53 0.6<br />
0<br />
d<br />
0.5<br />
a,<br />
-0<br />
3 0.4<br />
a,<br />
0<br />
0.3<br />
Q<br />
‘0<br />
= 0.2<br />
e!<br />
4-<br />
e!<br />
3 0.1<br />
P<br />
a,<br />
E o<br />
F<br />
-0.1<br />
X<br />
/<br />
K I Y<br />
10,000 100,000 1,000,000 10,000,000<br />
Population <strong>of</strong> County<br />
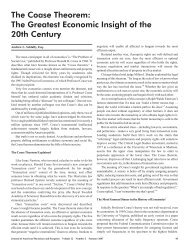
Fig. 13. Surface temperature trends for the period <strong>of</strong> 1940 to 1996 from 107 measuring stations<br />
in 49 California co~nties.)~.~ After averaging the means <strong>of</strong> the trends in each county,<br />
counties <strong>of</strong> similar population were combined and plotted as closed circles along with the standard<br />
errors <strong>of</strong> their means. The six measuring stations in Los Angeles County were used to<br />
calculate the standard error <strong>of</strong> that county, which is plotted alone at the county population <strong>of</strong><br />
8.9 million. The “urban heat island effect” on surface measurements is evident. The straight<br />
line is a least-squares fit to the closed circles. The points marked “X” are the six unadjusted<br />
station records selected by NASA GISSz3,33,34 for use in their estimate <strong>of</strong> global temperatures<br />
as shown in figure 12.<br />
century is <strong>of</strong>ten cited in support <strong>of</strong> “global warming.”38 Since,<br />
however, 82% <strong>of</strong> the C02 rise during the 20th century occurred<br />
after the rise in temperature (see figures 1 and 12), the C02<br />
increase cannot have caused the temperature increase. The<br />
19th century rise was only 13 ppm.’<br />
In addition, incomplete regional temperature records have<br />
been used to support “global warming.” Figure 14 shows an<br />
example <strong>of</strong> this, in which a partial record was used in an<br />
attempt to confirm computer climate model predictions <strong>of</strong><br />
temperature increases from greenhouse gases.4’ A more complete<br />
record refuted this attern~t.~’<br />
Not one <strong>of</strong> the temperature graphs shown in figures 4 to 7,<br />
which include the most accurate and reliable surface and<br />
atmospheric temperature measurements available, both global<br />
and regional, shows any warming whatever that can be attributed<br />
to increases in greenhouse gases. Moreover, these data<br />
show that present day temperatures are not at all unusual<br />
compared with natural variability, nor are they changing in any<br />
unusual way.<br />
\<br />
Sea Levels and Storms<br />
The computer climate models do not make any reliable<br />
predictions whatever concerning global flooding, storm variability,<br />
and other catastrophes that have come to be a part <strong>of</strong><br />
the popular definition <strong>of</strong> “global warming.” (See Chapter 6,<br />
section 6-5 <strong>of</strong> reference 14.) Yet several scenarios <strong>of</strong> impending<br />
global catastrophe have arisen separately. One <strong>of</strong> these<br />
hypothesizes that rising sea levels will flood large areas <strong>of</strong><br />
coastal land. Figure 15 shows satellite measurements <strong>of</strong> global<br />
sea level between 1993 and 1997.43 The reported current global<br />
rate <strong>of</strong> rise amounts to only about plus 2 mm per year, or plus<br />
8 inches per century, and even this estimate is probably<br />
high.43 The trends in rise and fall <strong>of</strong> sea level in various regions<br />
cn<br />
-6 1<br />
1993 1994 1995 1996 1997<br />
Year<br />
Fig. 15. Global sea level measurements from the Topefloseidon satellite altimeter for 1993<br />
to ~w.4~ The instrument record gives a rate <strong>of</strong> change <strong>of</strong> minus 0.2 mm per yea1.4~ However,<br />
it has been reported that SO-year tide gauge measurements give plus 1.8 mm per year. A<br />
correction <strong>of</strong> plus 2.3 mm per year was added to the satellite data based on comparison to<br />
selected tide gauges to get a value <strong>of</strong> plus 2.1 mm per year or 8 inches per ce11tury.4~<br />
have a wide range <strong>of</strong> about 100 mm per year with most <strong>of</strong> the<br />
globe showing downward t~ends.4~ Historical records show no<br />
acceleration in sea level rise in the 20th Moreover,<br />
claims that global warming will cause the Antarctic ice cap to<br />
melt and sharply increase this rate are not consistent with<br />
experiment or with theory?<br />
Similarly, claims that hurricane frequencies and intensities<br />
have been increasing are also inconsistent with the data.<br />
Figure 16 shows the number <strong>of</strong> severe Atlantic hurricanes per<br />
year and also the maximum wind intensities <strong>of</strong> those hurricanes.<br />
Both <strong>of</strong> these values have been decreasing with time.<br />
in<br />
I .V<br />
p 0.8<br />
5 0.6<br />
5 0.4<br />
% 0.2<br />
n<br />
e! 0.0<br />
3<br />
5 -0.2<br />
% -0.4<br />
E -0.6<br />
!-<br />
-0.8<br />
1955 1960 1965 1970 1975 1980 1985 1990 1995 2000<br />
Year<br />
Fig. 14. The solid circles in the oval are tropospheric temperatures for the Southern<br />
Hemisphere between latitudes 30 S and 60 S, published in 199641 in support <strong>of</strong> computermodel-projected<br />
warming. Later in 1996, the study was refuted by a longer set <strong>of</strong> data, as<br />
shown by the open circles!z<br />
1940 1950 1960 1970 1980 1990 2000<br />
Year<br />
Fig. 16. Annual numbers <strong>of</strong> violent hurricanes and maximum attained wind speeds during<br />
those humcanes in the Atlantic Ocean.46 Slopes <strong>of</strong> the trend lines are minus 0.25 hurricanes<br />
per decade and minus 0.33 meters per second maximum attained wind speed per<br />
decade.<br />
MEDICAL SENTINEL<br />
VOLUME 3 NUMBER 5 SEPTEMBER/~CTOBER 1998 175