Model of the Dispersion of Fresh Water and Other Sewage Materials ...
Model of the Dispersion of Fresh Water and Other Sewage Materials ...
Model of the Dispersion of Fresh Water and Other Sewage Materials ...

Create successful ePaper yourself
Turn your PDF publications into a flip-book with our unique Google optimized e-Paper software.
<strong>Model</strong> <strong>of</strong> <strong>the</strong> D;spers;on<strong>of</strong><strong>Fresh</strong> <strong>Water</strong>.<br />
29<br />
Results <strong>and</strong> Discussion<br />
The results <strong>of</strong> <strong>the</strong> studied elements in <strong>the</strong> surface water <strong>of</strong> Jeddah coast are pre.<br />
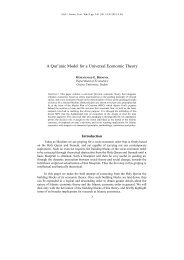
sented in <strong>the</strong> form <strong>of</strong> distributions shown in Fig. 2, 5-8.<br />
SALINITY (.,..)<br />
N-..<br />
39 ..., .> 39 .<br />
"<br />
SALINITYC",,)<br />
A--<br />
~\\" ~<br />
J) '. .<br />
..\ \;-1<br />
A--<br />
'""-<br />
." N<br />
" OV ..~) 1981<br />
APRIL 1982<br />
/\..-'"<br />
> 39<br />
h;, --:.<br />
"'~'~~-J<br />
.."/,<br />
.~DEC. 1981<br />
v<br />
/<br />
~~ MAY 1982<br />
vv<br />
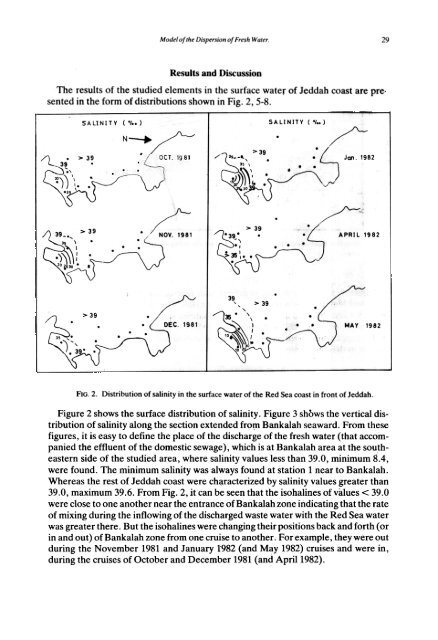
FIG. 2. Distribution <strong>of</strong> salinity in <strong>the</strong> surface water <strong>of</strong> <strong>the</strong> Red Sea coast in front <strong>of</strong> Jeddah.<br />
Figure 2 shows <strong>the</strong> surface distribution <strong>of</strong> salinity. Figure 3 shows <strong>the</strong> vertical distribution<br />
<strong>of</strong> salinity along <strong>the</strong> section extended fro~ Bankalah seaward. From <strong>the</strong>se<br />
figures, it is easy to define <strong>the</strong> place <strong>of</strong> <strong>the</strong> discharge <strong>of</strong> <strong>the</strong> fresh water (that accompanied<br />
<strong>the</strong> effluent <strong>of</strong> <strong>the</strong> domestic sewage), which is at Bankalaharea at <strong>the</strong> sou<strong>the</strong>astern<br />
side <strong>of</strong> <strong>the</strong> studied area, where salinity values less than 39.0, minimum 8.4,<br />
were found. The minimum salinity was always found at station 1 near to Bankalah.<br />
Whereas <strong>the</strong> rest <strong>of</strong> Jeddah coast were characterized by salinity values greater than<br />
39.0, maximum 39.6. From Fig. 2, it can be seen that <strong>the</strong> isohalines <strong>of</strong> values < 39.0<br />
were close to one ano<strong>the</strong>r near <strong>the</strong> entrance <strong>of</strong> Bankalah zone indicating that <strong>the</strong> rate<br />
<strong>of</strong> mixing during <strong>the</strong> inflowing <strong>of</strong> <strong>the</strong> discharged waste water with <strong>the</strong> Red Sea water<br />
was greater <strong>the</strong>re. But <strong>the</strong> isohalines were changing <strong>the</strong>ir positions back <strong>and</strong> forth (or<br />
in <strong>and</strong> out) <strong>of</strong> Bankalah zone from one cruise to ano<strong>the</strong>r. For example, <strong>the</strong>y were out<br />
during <strong>the</strong> November 1981 <strong>and</strong> January 1982 (<strong>and</strong> May 1982) cruises <strong>and</strong> were in,<br />
during <strong>the</strong> cruises <strong>of</strong> October <strong>and</strong> December 1981 (<strong>and</strong> April 1982).<br />
--- ~