Model of the Dispersion of Fresh Water and Other Sewage Materials ...
Model of the Dispersion of Fresh Water and Other Sewage Materials ...
Model of the Dispersion of Fresh Water and Other Sewage Materials ...

You also want an ePaper? Increase the reach of your titles
YUMPU automatically turns print PDFs into web optimized ePapers that Google loves.
<strong>Model</strong> <strong>of</strong> <strong>the</strong> <strong>Dispersion</strong> <strong>of</strong> <strong>Fresh</strong> <strong>Water</strong>.<br />
33<br />
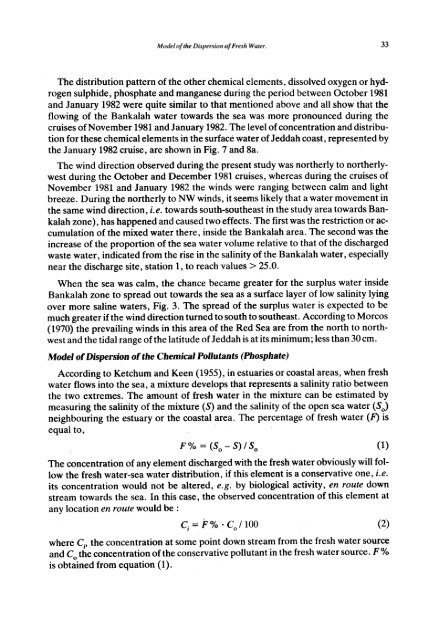
The distribution pattern <strong>of</strong> <strong>the</strong> o<strong>the</strong>r chemical elements, dissolved oxygen or hydrogen<br />
sulphide, phosphate <strong>and</strong> manganese during <strong>the</strong> period between October 1981<br />
<strong>and</strong> January 1982 were quite similar to that mentioned above <strong>and</strong> all show that <strong>the</strong><br />
flowing <strong>of</strong> <strong>the</strong> Bankalah water towards <strong>the</strong> sea was more pronounced during <strong>the</strong><br />
cruises <strong>of</strong> November 1981 <strong>and</strong> January 1982. The level <strong>of</strong> concentration <strong>and</strong> distribution<br />
for <strong>the</strong>se chemical elements in <strong>the</strong> surface water <strong>of</strong> Jeddah coast, represented by<br />
<strong>the</strong> January 1982 cruise, are shown in Fig. 7 <strong>and</strong> 8a.<br />
The wind direction observed during <strong>the</strong> present study was nor<strong>the</strong>rly to nor<strong>the</strong>rlywest<br />
during <strong>the</strong> October <strong>and</strong> December 1981 cruises, whereas during <strong>the</strong> cruises <strong>of</strong><br />
November 1981 <strong>and</strong> January 1982 <strong>the</strong> winds were ranging between calm <strong>and</strong> light<br />
breeze. During <strong>the</strong> nor<strong>the</strong>rly to NW winds, it seems likely that a water movement in<br />
<strong>the</strong> same wind direction, i.e. towards south-sou<strong>the</strong>ast in <strong>the</strong> study area towards Bankalah<br />
zone), has happened <strong>and</strong> caused two effects. The first was <strong>the</strong> restriction or accumulation<br />
<strong>of</strong> <strong>the</strong> mixed water <strong>the</strong>re, inside <strong>the</strong> Bankalah area. The second was <strong>the</strong><br />
increase <strong>of</strong> <strong>the</strong> proportion <strong>of</strong> <strong>the</strong> sea water volume relative to that <strong>of</strong> <strong>the</strong> discharged<br />
waste water, indicated from <strong>the</strong> rise in <strong>the</strong> salinity <strong>of</strong> <strong>the</strong> Bankalah water, especially<br />
near <strong>the</strong> discharge site, station 1, to reach values> 25.0.<br />
When <strong>the</strong> sea was calm, <strong>the</strong> chance became greater for <strong>the</strong> surplus water inside<br />
Bankalah zone to spread out towards <strong>the</strong> sea as a surface layer <strong>of</strong> low salinity lying<br />
over more saline waters, Fig. 3. The spread <strong>of</strong> <strong>the</strong> surplus water is expected to be<br />
much greater if <strong>the</strong> wind direction turned to south to sou<strong>the</strong>ast. According to Morcos<br />
(1970) <strong>the</strong> prevailing winds in this area o,f <strong>the</strong> Red Sea are from <strong>the</strong> north to northwest<br />
<strong>and</strong> <strong>the</strong> tidal range <strong>of</strong> <strong>the</strong> latitude <strong>of</strong> J eddah is at its minimum; less than 30 cm.<br />
<strong>Model</strong> <strong>of</strong> <strong>Dispersion</strong> <strong>of</strong> <strong>the</strong> Chemical Pollutants (Phosphate)<br />
According to Ketchum <strong>and</strong> Keen (1955), in estuaries or coastal areas, when fresh<br />
water flows into <strong>the</strong> sea, a mixture develops that represents a salinity ratio between<br />
<strong>the</strong> two extremes. The amount <strong>of</strong> fresh water in <strong>the</strong> mixture can be estimated by<br />
measuring <strong>the</strong> salinity <strong>of</strong> <strong>the</strong> mixture (S) <strong>and</strong> <strong>the</strong> salinity <strong>of</strong> <strong>the</strong> open sea water ( So)<br />
neighbouring <strong>the</strong> estuary or <strong>the</strong> coastal area. The percentage <strong>of</strong> fresh water (F) is<br />
equal to,<br />
F % = (So -S) / So (1)<br />
The concentration <strong>of</strong> any element discharged with <strong>the</strong> fresh water obviously will follow<br />
<strong>the</strong> fresh water-sea water distribution, if this element is a conservative one, i.e.<br />
its concentration would not be altered, e.g. by biological activity, en route down<br />
stream towards <strong>the</strong> sea. In this case, <strong>the</strong> observed concentration <strong>of</strong> this element at<br />
any location en route would be :<br />
Ci = F% .Co/ 100 (2)<br />
where Ci, <strong>the</strong> concentration at some point down stream from <strong>the</strong> fresh water source<br />
<strong>and</strong> Co <strong>the</strong> concentration <strong>of</strong> <strong>the</strong> conservative pollutant in <strong>the</strong> fresh water source. F %<br />
is obtained from equation (1).