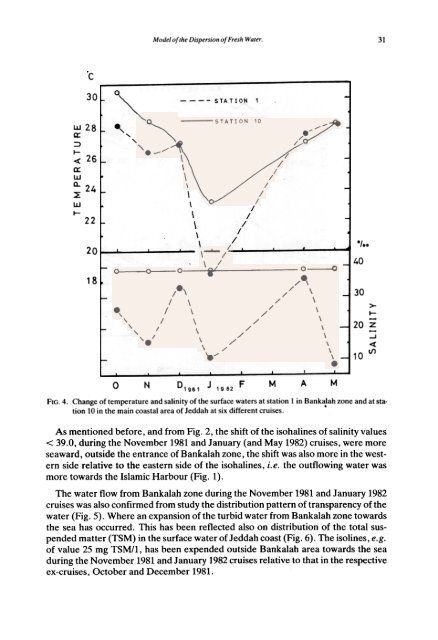
30 OsmanA. EI-Rayis :I: 1-3 a. w4 0 m 1 2 0 5 6 FIG. 3. Distribution <strong>of</strong> salinity along <strong>the</strong> vertical section extending across stations 1,3,12 <strong>and</strong> 14 in Jeddah coast. Figure 4, shows <strong>the</strong> change in salinity with time <strong>of</strong> sampling (between October 1981 <strong>and</strong> May 1981) at station 1 near to Bankalah. The salinity was fluctuating between 8.4 <strong>and</strong> 35.8, <strong>and</strong> noteworthy that <strong>the</strong> salinity was at its minimum values in <strong>the</strong> cruises <strong>of</strong> November 1981 <strong>and</strong> January (<strong>and</strong> May) 1982. Th~ pattern <strong>of</strong> change <strong>of</strong> <strong>the</strong> water temperature (unpublished da(a) at this station with time, shown in Fig. 4, was similar to that for salinity. Figure 4, also, shows <strong>the</strong> change in salinity <strong>and</strong> temperature with time but at a station lying outside <strong>the</strong> Bankalah zone (station 10), i.e., in <strong>the</strong> main coastal area. It shows <strong>the</strong>re is very little change in <strong>the</strong> salinity (39.3 :t: 0.3), unlike <strong>the</strong> water temperature, which was ata minimum in <strong>the</strong> winter (January 1982) <strong>and</strong> at a maximum in <strong>the</strong> (summer <strong>and</strong>) autumn, October 1981. This is related to <strong>the</strong> scarcity <strong>of</strong> <strong>the</strong> precipitation, in this arid zone <strong>and</strong> agrees well with <strong>the</strong> climatic changes reported for <strong>the</strong> Red Sea region by Morcos (1970). The change in <strong>the</strong> minimum salinity observed near Bankalah (i.e., near to <strong>the</strong> discharge site <strong>of</strong> <strong>the</strong> sewage effluent) during <strong>the</strong>se cruises would be expected to depend mainly on <strong>the</strong> rate <strong>of</strong> <strong>the</strong> discharge <strong>of</strong> <strong>the</strong> fresh water accompanied <strong>the</strong> waste effluents <strong>and</strong> on <strong>the</strong> hydrographic conditions that prevails during <strong>the</strong>se times in <strong>the</strong> coastal area. The first is expected not to be altered much at least during <strong>the</strong> months <strong>of</strong> <strong>the</strong> cold season, November 1981 to January 1982. In addition, <strong>the</strong> <strong>Water</strong> <strong>and</strong> Wastewater Authorities in Jeddah (personal communication) confirmed <strong>the</strong> stability <strong>of</strong> <strong>the</strong> rate (r'oJ 32,000 m3/day) <strong>of</strong> <strong>the</strong> discharge <strong>of</strong> <strong>the</strong> waste effluents at least during <strong>the</strong>se months. Therefore, <strong>the</strong> minimum salinity observed during November 1981 <strong>and</strong> January 1982 cruises must be due to <strong>the</strong> o<strong>the</strong>r factor, <strong>the</strong> hydrographic conditions, e.g. water currents generated by <strong>the</strong> prevailing winds.
'c " Mode/<strong>of</strong> <strong>the</strong> <strong>Dispersion</strong> <strong>of</strong> <strong>Fresh</strong> <strong>Water</strong>. 31 UJ 28 a: => I- « 26 a: UJ Q. ~ UJ I- , 30 STATION 24 , " / \ I 22 / I / 20 18 0'00 40 30 >- I- 20 Ẕ -J