CIA 4U1 Key Chapter 4: Costs of Production CHAPTER 4 Page 95 a ...
CIA 4U1 Key Chapter 4: Costs of Production CHAPTER 4 Page 95 a ...
CIA 4U1 Key Chapter 4: Costs of Production CHAPTER 4 Page 95 a ...

Create successful ePaper yourself
Turn your PDF publications into a flip-book with our unique Google optimized e-Paper software.
<strong>CIA</strong> <strong>4U1</strong><br />
<strong>Key</strong> <strong>Chapter</strong> 4: <strong>Costs</strong> <strong>of</strong> <strong>Production</strong><br />
<strong>CHAPTER</strong> 4<br />
<strong>Page</strong> <strong>95</strong><br />
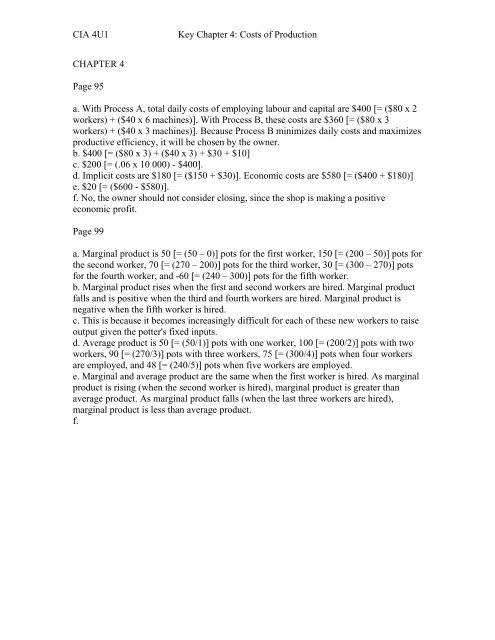
a. With Process A, total daily costs <strong>of</strong> employing labour and capital are $400 [= ($80 x 2<br />
workers) + ($40 x 6 machines)]. With Process B, these costs are $360 [= ($80 x 3<br />
workers) + ($40 x 3 machines)]. Because Process B minimizes daily costs and maximizes<br />
productive efficiency, it will be chosen by the owner.<br />
b. $400 [= ($80 x 3) + ($40 x 3) + $30 + $10]<br />
c. $200 [= (.06 x 10 000) - $400].<br />
d. Implicit costs are $180 [= ($150 + $30)]. Economic costs are $580 [= ($400 + $180)]<br />
e. $20 [= ($600 - $580)].<br />
f. No, the owner should not consider closing, since the shop is making a positive<br />
economic pr<strong>of</strong>it.<br />
<strong>Page</strong> 99<br />
a. Marginal product is 50 [= (50 – 0)] pots for the first worker, 150 [= (200 – 50)] pots for<br />
the second worker, 70 [= (270 – 200)] pots for the third worker, 30 [= (300 – 270)] pots<br />
for the fourth worker, and -60 [= (240 – 300)] pots for the fifth worker.<br />
b. Marginal product rises when the first and second workers are hired. Marginal product<br />
falls and is positive when the third and fourth workers are hired. Marginal product is<br />
negative when the fifth worker is hired.<br />
c. This is because it becomes increasingly difficult for each <strong>of</strong> these new workers to raise<br />
output given the potter's fixed inputs.<br />
d. Average product is 50 [= (50/1)] pots with one worker, 100 [= (200/2)] pots with two<br />
workers, 90 [= (270/3)] pots with three workers, 75 [= (300/4)] pots when four workers<br />
are employed, and 48 [= (240/5)] pots when five workers are employed.<br />
e. Marginal and average product are the same when the first worker is hired. As marginal<br />
product is rising (when the second worker is hired), marginal product is greater than<br />
average product. As marginal product falls (when the last three workers are hired),<br />
marginal product is less than average product.<br />
f.
<strong>CIA</strong> <strong>4U1</strong><br />
<strong>Key</strong> <strong>Chapter</strong> 4: <strong>Costs</strong> <strong>of</strong> <strong>Production</strong><br />
Total Product Curve<br />
350<br />
300<br />
Pots Produced per Week<br />
250<br />
200<br />
150<br />
100<br />
TP<br />
50<br />
0<br />
0 1 2 3 4 5 6<br />
Number <strong>of</strong> Workers Employed per Week<br />
Marginal and Average Product Curves<br />
200<br />
150<br />
Pots Produced per Week<br />
100<br />
50<br />
AP<br />
0<br />
0 1 2 3 4 5 6<br />
-50<br />
MP<br />
-100<br />
Number <strong>of</strong> Workers Employed per Week<br />
g. Marginal product reaches its peak where diminishing marginal returns set in. Total<br />
product rises less rapidly and finally becomes negatively sloped once diminishing<br />
marginal returns set in. Average product reaches its maximum where it equals marginal<br />
product. Then, because <strong>of</strong> diminishing marginal returns, with marginal product falling<br />
and below average product, average product declines.
<strong>CIA</strong> <strong>4U1</strong><br />
<strong>Key</strong> <strong>Chapter</strong> 4: <strong>Costs</strong> <strong>of</strong> <strong>Production</strong><br />
<strong>Page</strong> 104<br />
a. Variable costs are $0 at a zero output, $100 at an output <strong>of</strong> 50 pots, $200 at 200 pots,<br />
$300 at 270 pots, and $400 at 300 pots. Total cost is $100 [= ($100 + $0)] at 0 pots, $200<br />
[= ($100 + $100)] at 50 pots, $300 [= ($100 + $200)] at 200 pots, $400 [= ($100 + $300)]<br />
at 270 pots, and $500 [= ($100 + $400)] at 300 pots.<br />
b. Marginal cost is $2.00 [= ($100 - $0)/(50 – 0)] when moving from 0 to 50 pots; $0.67<br />
[= ($200 - $100)/( 200 – 50)] from 50 to 200 pots; $1.43 [= ($300 - $200)/(270 – 200)]<br />
from 200 to 270 pots; $3.33 [= ($400 - $300)/(300 – 270)] from 270 to 300 pots.<br />
c. Average fixed cost is $2.00 [= ($100/50) at 50 pots, $0.50 [= ($100/200)] at 200 pots,<br />
$0.37 [= ($100/270)] at 270 pots, and $0.33 [= ($100/300)] at 300 pots. Average variable<br />
cost is $2.00 [= ($100/50)] at 50 pots, $1.00 [= ($200/200)] at 200 pots, $1.11 [=<br />
($300/270)] at 270 pots, and $1.33 [= ($400/300)] at 300 pots. Average cost is $4.00 [=<br />
($200/50)] at 50 pots, $1.50 [= ($300/200)] at 200 pots, $1.48 [= ($400/270)] at 270 pots,<br />
and $1.67 [= ($500/300)] at 300 pots.<br />
d.<br />
Average Fixed Cost Curve<br />
2.50<br />
2.00<br />
1.50<br />
$ per Pot<br />
1.00<br />
0.50<br />
AFC<br />
0.00<br />
0 50 100 150 200 250 300 350<br />
Pots Produced per Week
<strong>CIA</strong> <strong>4U1</strong><br />
<strong>Key</strong> <strong>Chapter</strong> 4: <strong>Costs</strong> <strong>of</strong> <strong>Production</strong><br />
Marginal, Average Variable and Average Cost Curves<br />
4.50<br />
4.00<br />
$ per Pot<br />
3.50<br />
3.00<br />
2.50<br />
2.00<br />
1.50<br />
1.00<br />
MC<br />
AC<br />
AVC<br />
0.50<br />
0.00<br />
0 50 100 150 200 250 300 350<br />
Pots Produced per Week<br />
e. Yes. The marginal cost and average variable cost curves are J-shaped, and the average<br />
cost curve is bowl-shaped, with the minimum points <strong>of</strong> both average variable cost and<br />
average cost occurring at the curves' intersection with the marginal cost curve.<br />
<strong>Page</strong> 109<br />
a. The percentage increase in the labour input is 50% [= ((9 – 6)/6)) x 100%] and the<br />
percentage increase in the capital input is also 50% [= ((3 – 2)/2)) x 100%], while the<br />
percentage increase in output is 100% [= (240 – 120)/120]. Because the relative increase<br />
in output exceeds the relative increase in each <strong>of</strong> the inputs, the business is experiencing<br />
increasing returns to scale. Long run average cost falls from $5.33 [= ((6 x $100) + (2 x<br />
$20))/120] to $4 [= ((9 x $100) + (3 x $20))/240].<br />
b. The percentage increase in output is 50% [= (180 – 120)/120]. Because the relative<br />
increase in output equals the relative increase in each <strong>of</strong> the inputs, the business is<br />
experiencing constant returns to scale. Long run average cost at 120 units is $5.33 [= ((6<br />
x $100) + (2 x $20))/120] and at 180 units is also $5.33 [= ((9 x $100) + (3 x $20))/180].<br />
c. The percentage increase in output is 33% [= (160 – 120)/120]. Because the relative<br />
increase in output is less than the relative increase in each <strong>of</strong> the inputs, the business is<br />
experiencing decreasing returns to scale. Long run average cost rises from $5.33 [= ((6 x<br />
$100) + (2 x $20))/120] to $6 [= ((9 x $100) + (3 x $20))/160].