Kelowna's Urban Forest: - City of Kelowna
Kelowna's Urban Forest: - City of Kelowna
Kelowna's Urban Forest: - City of Kelowna

You also want an ePaper? Increase the reach of your titles
YUMPU automatically turns print PDFs into web optimized ePapers that Google loves.
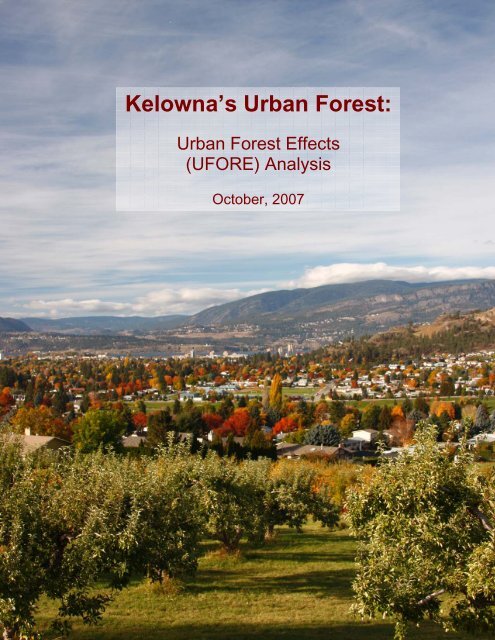
<strong>Kelowna</strong>’s <strong>Urban</strong> <strong>Forest</strong>:<br />
<strong>Urban</strong> <strong>Forest</strong> Effects<br />
(UFORE) Analysis<br />
October, 2007
Table <strong>of</strong> Contents<br />
Table <strong>of</strong> Contents................................................................................................................ 1<br />
Acknowledgements............................................................................................................. 1<br />
1.0 Introduction................................................................................................................... 4<br />
1.1 Rationale ..................................................................................................................4<br />
1.2 The Role <strong>of</strong> the <strong>Urban</strong> <strong>Forest</strong>................................................................................... 5<br />
1.2.1 Air Quality ........................................................................................................ 5<br />
1.2.2 Regional Climate Change ................................................................................. 6<br />
1.2.3 Energy Conservation......................................................................................... 7<br />
1.2.4 Water Conservation .......................................................................................... 7<br />
1.2.5 Social Benefits .................................................................................................. 7<br />
1.2.6 Economic Benefits............................................................................................ 8<br />
2.0 Methodology................................................................................................................8<br />
2.1 Plot Selection ........................................................................................................... 8<br />
2.2 Data Collection ...................................................................................................... 10<br />
2.3 Data Analysis......................................................................................................... 10<br />
3.0 Results and Discussion .............................................................................................. 10<br />
3.1 <strong>Urban</strong> <strong>Forest</strong> Structure........................................................................................... 10<br />
3.2 Vegetation Cover and Plantable Space.................................................................. 14<br />
3.3 Pest Susceptibility.................................................................................................. 16<br />
3.3 Pollution Removal by the <strong>Urban</strong> <strong>Forest</strong>................................................................. 17<br />
3.4 Energy Savings ...................................................................................................... 18<br />
4.0 Conclusion and Recommendations............................................................................ 18<br />
5.0 References.................................................................................................................. 21<br />
Appendix 1. Plot Locations (GPS Coordinates) .............................................................. 23<br />
Acknowledgements<br />
The following people contributed to this study: Meaghan Eastwood (University <strong>of</strong><br />
Toronto, Master’s student); Dr. David Nowak and Robert Hoehn (USDA <strong>Forest</strong><br />
Service); and Ralph Adams and Eric Taylor (BC Ministry <strong>of</strong> Environment).<br />
The project was supported in part through a grant from the Tree Canada<br />
Foundation.<br />
<strong>Kelowna</strong>’s <strong>Urban</strong> <strong>Forest</strong>: UFORE Analysis 1
Executive Summary<br />
A growing body <strong>of</strong> research demonstrates that trees and other vegetation provide<br />
important “ecosystem services”, providing benefits such as clean water and air,<br />
climate regulation, cultural and recreational benefits, and supporting wildlife and<br />
biodiversity. The <strong>Urban</strong> <strong>Forest</strong> Effects (UFORE) model was developed by the<br />
US <strong>Forest</strong> Service to help quantify some <strong>of</strong> the key benefits provided by urban<br />
vegetation.<br />
During the summer <strong>of</strong> 2007, 150 randomly located plots were assessed by a<br />
ground crew to characterize the structure <strong>of</strong> <strong>Kelowna</strong>’s urban vegetation. These<br />
data were analyzed in the UFORE model, to produce the following key findings:<br />
Feature<br />
Measure<br />
Major tree species, by % canopy cover • Douglas-fir (33%)<br />
• Ponderosa pine (24%)<br />
• Apple (19%)<br />
• Other (24%)<br />
Estimated number <strong>of</strong> trees in <strong>Kelowna</strong> 3.3 million<br />
Total replacement value <strong>of</strong> <strong>Kelowna</strong>’s trees<br />
Total carbon stored in <strong>Kelowna</strong>’s trees<br />
Carbon sequestered annually by <strong>Kelowna</strong>’s<br />
urban forest<br />
Susceptibility to exotic and native pests<br />
(% susceptible host by leaf area)<br />
$ 1.1 billion<br />
126,900 metric tonnes<br />
7,500 metric tonnes<br />
Pollution removed annually by urban forest<br />
and value <strong>of</strong> the removal<br />
Volatile Organic Compounds (VOC’s) 43 tonnes<br />
produced annually by trees<br />
Ozone index score* 94 (out <strong>of</strong> 100)<br />
Annual energy savings due to trees and<br />
annual carbon emission reductions due to<br />
power savings<br />
Average vegetation cover, plantable space<br />
and impervious surfaces<br />
• Asian longhorned beetle (34%)<br />
• Pine beetle (24%)<br />
• Gypsy moth (23%)<br />
• Dutch elm disease (4%)<br />
• Emerald ash borer (1.6%)<br />
195 tonnes ($1.1 million)<br />
$ 19.4 million / 1,800 tonnes carbon<br />
• Trees - 12.8%<br />
• Shrubs - 9.1%<br />
• Grass - 42.3%<br />
• Plantable space - 27.3%<br />
• Buildings, impervious – 12%<br />
* A perfect score <strong>of</strong> 100 represents forest composition where all species have the<br />
maximum effect on reducing ozone (lowest possible VOC emissions).<br />
<strong>Kelowna</strong>’s <strong>Urban</strong> <strong>Forest</strong>: UFORE Analysis 2
The top three species in <strong>Kelowna</strong>, Douglas-fir, ponderosa pine and apple,<br />
comprise 76% <strong>of</strong> the total tree canopy, indicating a low level <strong>of</strong> diversity overall.<br />
Most <strong>of</strong> these species are located on natural, undeveloped lands, or on<br />
agricultural lands, indicating the high importance <strong>of</strong> these areas for providing<br />
ecosystem services. As some <strong>of</strong> these areas are developed in the future, some<br />
ecosystem services will be lost and may have to be replaced through<br />
investments in stormwater, water purification or other “grey infrastructure”<br />
improvements.<br />
The major threats to <strong>Kelowna</strong>’s urban forest in the next decade are mountain<br />
pine beetle, development, and wildfire. The model estimates that <strong>Kelowna</strong> has<br />
about 606,000 ponderosa pine trees, with a replacement value <strong>of</strong> $181 million.<br />
According to the provincial government, we are likely to lose about 80% <strong>of</strong> these<br />
trees (primarily mature trees) due to pine beetle.<br />
<strong>Kelowna</strong>’s current tree canopy is only about 13%, on average, although there is<br />
another 27% plantable space. Areas with the highest tree cover include vacant /<br />
wildland (23%), and agriculture and rural lands (15%), while the lowest cover<br />
(3%) occurs on land zoned as commercial / industrial and transportation.<br />
Strategies to enhance the ecological services <strong>of</strong> urban trees in <strong>Kelowna</strong> include:<br />
1) Aiming for species, size and age diversity (reduces the impact <strong>of</strong> pests);<br />
2) Increasing the number <strong>of</strong> healthy trees;<br />
3) Maximizing the use <strong>of</strong> low VOC emitting trees to improve air quality;<br />
4) Sustaining and increasing existing tree cover;<br />
5) Sustaining large, healthy trees (greater benefits per tree);<br />
6) Using long-lived species (reduces carbon emissions from planting and<br />
removal activities);<br />
7) Using low-maintenance trees (reduces fossil fuel requirements for maintaining<br />
vegetation);<br />
8) Planting trees in energy-conserving locations;<br />
9) Planting trees as part <strong>of</strong> transportation corridors (extends the life <strong>of</strong> streets,<br />
reduces carbon dioxide emissions) and parking lots (cooling effect and<br />
reduction <strong>of</strong> VOC emissions from parked vehicles);<br />
10) Planting trees in polluted areas;<br />
11) Avoiding pollution sensitive tree species;<br />
12) Utilizing evergreen trees for particulate matter reduction (year-round removal<br />
<strong>of</strong> pollutants).<br />
<strong>Kelowna</strong>’s <strong>Urban</strong> <strong>Forest</strong>: UFORE Analysis 3
1.0 Introduction<br />
The <strong>Urban</strong> <strong>Forest</strong> Effects (UFORE) computer model was developed by the<br />
USDA <strong>Forest</strong> Service as part <strong>of</strong> the i-Tree S<strong>of</strong>tware Suite. UFORE is designed<br />
to use standardized field data from randomly located plots throughout a<br />
community, along with hourly air pollution and meteorological data, to quantify<br />
the structure and function <strong>of</strong> the urban forest. The model calculates the following<br />
information:<br />
<strong>Urban</strong> forest structure (e.g. species composition, tree density, tree health,<br />
leaf area, leaf and tree biomass, species diversity, etc.);<br />
Hourly pollution removal by the urban forest and associated percent<br />
improvement in air quality (pollution removal is calculated for ozone (O 3 ),<br />
sulphur dioxide (SO 2 ), nitrogen dioxide (NO 2 ), carbon monoxide (CO) and<br />
particulate matter (PM 10 ));<br />
Total carbon stored and net carbon sequestered annually by the urban<br />
forest;<br />
Effect <strong>of</strong> trees on building energy use for heating and cooling as well as<br />
the subsequent associated carbon dioxide emissions reductions; and<br />
Compensatory value <strong>of</strong> the urban forest, as well as the value for air<br />
pollution removal and carbon storage and sequestration<br />
To date, UFORE analyses have been completed by three other Canadian cities:<br />
Toronto, Calgary, and Oakville. <strong>Kelowna</strong> is therefore the first community in<br />
British Columbia to successfully complete a UFORE analysis.<br />
1.1 Rationale<br />
Over the next decade and beyond, <strong>Kelowna</strong>’s urban forest is likely to face three<br />
major threats: pine beetle, development, and wildfire.<br />
The mountain pine beetle epidemic continues to spread throughout British<br />
Columbia’s interior, affecting over 8 million hectares <strong>of</strong> pine forest in the central<br />
and southern regions <strong>of</strong> the province. According to projections by the Ministry <strong>of</strong><br />
<strong>Forest</strong>s and Range the infestation will likely continue to until 2018 and will kill<br />
approximately 80% <strong>of</strong> provincial pine volume in the central and southern Interior<br />
(MoFR 2007). Consequently, <strong>Kelowna</strong> is likely to see a dramatic change in<br />
forest structure and composition as both the western pine beetle (Dendroctonus<br />
brevicomis) and mountain pine beetle (Dendroctonus ponderosae) continue to<br />
attack native ponderosa pine (Pinus pondersa) as well as exotic pines planted in<br />
landscapes. Significant mortality in <strong>Kelowna</strong>’s mature pine forests has been<br />
observed in recent months and as a result local canopy cover is quickly<br />
declining, a trend which is likely to continue in the future. The UFORE analysis<br />
will not only aid in the estimation <strong>of</strong> the potential impact <strong>of</strong> the pine beetle<br />
epidemic, it will also identify and prioritize areas for future tree planting initiatives.<br />
In addition, the study will provide a baseline for future research.<br />
<strong>Kelowna</strong>’s <strong>Urban</strong> <strong>Forest</strong>: UFORE Analysis 4
The 2006 Census revealed that <strong>Kelowna</strong>’s population grew by 10.6% from 2001<br />
to 2006, thus making it one <strong>of</strong> the fastest growing municipalities in the province.<br />
The growth rate between 2007-2017 is projected the <strong>City</strong> Planning Department to<br />
be 25%, with most <strong>of</strong> the growth occurring in areas that are currently forested or<br />
natural areas. As the city continues to grow, increasing pressure will be placed<br />
on the existing forest cover to provide essential environmental, economic, and<br />
social services. In particular, demand for air pollution abatement and local<br />
climate change mitigation will surely increase. Yet at the current pace <strong>of</strong><br />
expansion a reduction in canopy cover will be seen as forested areas are cleared<br />
for residential developments.<br />
Significant areas <strong>of</strong> forest have already been lost due to 2003 wildfires in the<br />
southwest corner <strong>of</strong> the city and in the adjacent Crown forests. Catastrophic<br />
wildfire continues to be a major threat to <strong>Kelowna</strong>’s forests although<br />
management activities over the last several years have helped to lower the risk<br />
to forests, people and property. However, the desire to retain trees and<br />
vegetation will also have to be balanced with the need to thin and remove<br />
vegetation in order to mitigate the risk <strong>of</strong> wildfire.<br />
By quantifying the current structure <strong>of</strong> <strong>Kelowna</strong>’s urban forest, the UFORE<br />
project will help guide future canopy cover targets which will optimize the<br />
potential benefits <strong>of</strong> urban trees. Ultimately the results <strong>of</strong> the UFORE analysis<br />
will assist in the future management and planning <strong>of</strong> the community’s green<br />
infrastructure.<br />
1.2 The Role <strong>of</strong> the <strong>Urban</strong> <strong>Forest</strong><br />
Trees greatly impact the quality <strong>of</strong> urban life by providing a number <strong>of</strong> valuable<br />
environmental, economic, and recreational services. The urban forest directly<br />
benefits the community by improving local air quality, reducing energy<br />
consumption, increasing land values and local tax bases, enhancing public<br />
safety, conserving water resources, and reducing soil erosion. In addition, city<br />
trees beautify the landscape and provide invaluable psychological benefits to<br />
urban dwellers.<br />
1.2.1 Air Quality<br />
<strong>Urban</strong> air pollution can have direct impacts on human health. By significantly<br />
reducing the amount <strong>of</strong> airborne pollutants trees can mitigate the potential health<br />
problems associated with poor air quality. Ground level ozone (O 3 ) and airborne<br />
particulate matter (PM 10 ) are two pollutants which pose a significant threat to<br />
human health. Ozone is not emitted directly but rather is created by chemical<br />
<strong>Kelowna</strong>’s <strong>Urban</strong> <strong>Forest</strong>: UFORE Analysis 5
eactions between oxides <strong>of</strong> nitrogen (NO X ) and volatile organic compounds<br />
(VOCs) such as gasoline fumes, in sunlight. Trees also produce their own<br />
VOC’s, with some species producing higher levels than others. However, in the<br />
absence <strong>of</strong> nitrogen oxides (which come almost entirely from human sources),<br />
these VOC’s can actually reduce ozone concentrations. Because VOC<br />
emissions are temperature dependent and trees generally lower air<br />
temperatures, increased tree cover can lower overall VOC emissions and,<br />
consequently, ozone levels in urban areas. Thus, urban trees, particularly<br />
species which emit low levels <strong>of</strong> VOCs, are a viable strategy to reduce urban O 3<br />
levels (Cardelino and Chameides 1990; Nowak et al. 2000a).<br />
Air borne particulates consist <strong>of</strong> microscopic solids or liquid droplets, <strong>of</strong>ten<br />
originating from smoke and diesel soot, which form in the air from oxides <strong>of</strong><br />
nitrogen and sulphur. These harmful pollutants are problematic as they can<br />
irritate and damage lung tissue. Trees reduce the amount <strong>of</strong> particulate matter<br />
by intercepting and storing large airborne particulate on outer leaf surfaces,<br />
rough branches and bark surfaces (Nowak et al. 2006). In addition, trees<br />
improve air quality by binding or dissolving water soluble pollutants onto moist<br />
leaf surfaces. Other gaseous air pollutants, such as carbon monoxide and<br />
sulphur dioxide, are removed primarily by leaf stomatal uptake (Smith 1990).<br />
<strong>Urban</strong> forests also play an integral role in the mitigation <strong>of</strong> high levels <strong>of</strong><br />
atmospheric carbon dioxide (CO 2 ), an important greenhouse gas which<br />
contributes to global warming. Anthropogenic production <strong>of</strong> CO 2 is most notably<br />
a result <strong>of</strong> fossil fuel combustion and large-scale deforestation. Trees reduce<br />
atmospheric CO 2 levels through photosynthetic uptake and subsequent carbon<br />
sequestration in woody biomass. Furthermore, trees which are adjacent to<br />
buildings can reduce the demand for heating and air conditioning through their<br />
moderating influence on solar insolation, wind speed, and air temperature. This<br />
in turn reduces the emissions associated with fossil fuel combustion which are a<br />
direct result <strong>of</strong> heating and the provision <strong>of</strong> electric power for cooling (Simpson<br />
and McPherson, 2000).<br />
1.2.2 Regional Climate Change<br />
The “urban heat island" phenomenon describes urban and suburban<br />
temperatures that are 1 to 6°C warmer than nearby rural areas. <strong>Urban</strong> heat<br />
islands form as cities replace natural land cover with pavement, buildings, and<br />
other infrastructure. Increasing the canopy cover <strong>of</strong> the urban forest is an<br />
effective way to mitigate the heat island effect. The shade generated by tree<br />
canopies reduces the amount <strong>of</strong> solar radiation transmitted to underlying<br />
surfaces. Consequently, cooler surfaces lessen the heat island effect by<br />
reducing heat transfer to the surrounding air. Furthermore, evapotranspiration<br />
can result in peak summer temperature reductions <strong>of</strong> 1° to 5°C in urban areas<br />
<strong>Kelowna</strong>’s <strong>Urban</strong> <strong>Forest</strong>: UFORE Analysis 6
(EPA 2007). Every 1% increase in canopy cover results in maximum mid-day air<br />
temperature reductions <strong>of</strong> 0.04° to 0.2°C (Simpson 1998).<br />
1.2.3 Energy Conservation<br />
Trees can reduce summer temperatures substantially by providing localized<br />
shade and wind speed reductions. Trees also ameliorate climate by transpiring<br />
water from their leaves, which has a cooling effect on the atmosphere. Thus, the<br />
effective placement <strong>of</strong> a tree or shrub can efficiently lower building temperatures<br />
and decrease the demand for cooling. Simpson and McPherson (1999) report<br />
that shade from two large trees planted on the west side <strong>of</strong> a house and one on<br />
the east side can save up to 30% <strong>of</strong> a typical residence’s annual air conditioning<br />
costs. During winter months trees which are properly placed to create<br />
windbreaks can also decrease heating requirements and produce savings <strong>of</strong> up<br />
to 25% on winter heating costs (Heisler 1986).<br />
1.2.4 Water Conservation<br />
When stormwater hits impervious surfaces common in urban areas the water is<br />
heated and various pollutants, including lawn fertilizers and oils on roadways, are<br />
picked up by the run<strong>of</strong>f. Water quality problems then arise when large volumes<br />
<strong>of</strong> heated and polluted stormwater flow into receiving waters, posing threats to<br />
temperature sensitive species as well as providing conditions for algal blooms<br />
and nutrient imbalances. Tree cover helps intercept rainwater, thus reducing the<br />
amount, and speed, <strong>of</strong> stormwater in addition to filtering pollutants that eventually<br />
flow to receiving waters (Kollin 2006). A portion <strong>of</strong> the intercepted water<br />
evaporates back into the atmosphere while the remaining water soaks into the<br />
ground thereby reducing the total amount <strong>of</strong> run<strong>of</strong>f that must be managed in<br />
urban areas. Thus, the costs associated with stormwater management are much<br />
lower when significant urban canopy cover is maintained.<br />
1.2.5 Social Benefits<br />
Although more difficult to quantify the urban forest provides a variety <strong>of</strong> important<br />
social benefits. <strong>Urban</strong> trees have been found to significantly reduce crime levels.<br />
For example apartment buildings with high levels <strong>of</strong> greenery had 52% fewer<br />
crimes than those without trees (Kuo and Sullivan 2001). Furthermore, hospital<br />
patients were found to recover from major surgery more quickly and with fewer<br />
complications when provided with a view <strong>of</strong> trees (Ulrich 1984). Trees and urban<br />
parks also improve mental health and over all well-being by conveying a sense <strong>of</strong><br />
calm and beauty as well as facilitating relaxation and outdoor activity. In addition,<br />
trees can <strong>of</strong>fer screening, or reduce noise pollution by absorbing unwanted<br />
sound.<br />
<strong>Kelowna</strong>’s <strong>Urban</strong> <strong>Forest</strong>: UFORE Analysis 7
Trees and attractive landscaping are an important part <strong>of</strong> the “liveability” <strong>of</strong> a city<br />
and improving quality <strong>of</strong> life.<br />
1.2.6 Economic Benefits<br />
Trees and attractive landscaping are known to raise property values; there is also<br />
a link between proximity to green space and higher property values (Table 1).<br />
Furthermore, research shows that shoppers in well-landscaped business districts<br />
are willing to pay more for both parking and goods and services (Wolf 1999) and<br />
commercial properties can be receive higher rent with attractive landscaping<br />
(Table 1).<br />
Table 1. Summary <strong>of</strong> research on price increase due to trees and landscaping (from Wolf<br />
2007).<br />
Price Increase Condition<br />
2% Single mature yard tree (>9” diameter)<br />
3-5% Trees in front yard landscaping<br />
4.9% Multi-family unit with view <strong>of</strong> forested open spaces<br />
7% Rental rates for properties with quality landscaping<br />
8% House with a park view<br />
6-9% Good tree cover in a neighbourhood<br />
9-12% Increased consumer spending in forested business districts<br />
10% Inner-city home within ¼ mile (400 m) <strong>of</strong> a park<br />
10-15% Mature trees in high-income neighbourhoods<br />
18% Building lots with substantial mature tree cover<br />
19% Home adjacent to a passive park area<br />
22% Tree-covered undeveloped acreage<br />
32% Residential development adjacent to greenbelt<br />
19-35% Lots bordering suburban wooded preserves<br />
37% Open land that is 2/3 wooded<br />
2.0 Methodology<br />
2.1 Plot Selection<br />
<strong>Kelowna</strong>’s UFORE analysis was based on a randomized sampling scheme in<br />
which 150 circular plots (10 meters in radius) were positioned at randomly<br />
selected locations, on a grid, throughout the 48,640 ha study area (Figure 1). In<br />
order to provide a more confident estimate <strong>of</strong> the population the number <strong>of</strong> plots<br />
was increased from the original 100 to 150. Although a higher sample size<br />
would yield more accurate results, the number <strong>of</strong> plots surveyed provided an<br />
<strong>Kelowna</strong>’s <strong>Urban</strong> <strong>Forest</strong>: UFORE Analysis 8
acceptable level <strong>of</strong> standard error when weighed against the time and financial<br />
constraints associated with additional field data collection.<br />
Each individual plot was identified in the <strong>City</strong>’s mapping system and a high<br />
resolution orthophoto image was produced with the plot centre and site<br />
identification markings clearly indicated. GPS coordinates were also generated<br />
in order to facilitate accurate navigation to plot centre (see Appendix 1). Prior to<br />
entry, private property owners were contacted by telephone or through written<br />
communication in order to obtain permission to access their property. In the<br />
instance that a phone number could not obtained the field crew requested<br />
permission to access the property in person. If permission was not granted or<br />
access was restricted due to physical / topographic barriers, the field crew<br />
recorded measurements from the nearest representative location (Appendix 1).<br />
Fig. 1. Plot locations in the <strong>City</strong> <strong>of</strong> <strong>Kelowna</strong> (red and purple stars).<br />
<strong>Kelowna</strong>’s <strong>Urban</strong> <strong>Forest</strong>: UFORE Analysis 9
2.2 Data Collection<br />
Field data collection was conducted by a two member field crew during the<br />
summer leaf-on season <strong>of</strong> 2007. At each plot the present land-use was<br />
determined (e.g. residential) and detailed vegetation information was recorded in<br />
accordance with the UFORE manual specifications. Variables measured<br />
included ground cover types, shrub characteristics, foliage parameters and<br />
individual attributes <strong>of</strong> tree species. Specific tree measurements included<br />
diameter at breast height (DBH), height, crown width, percent canopy missing,<br />
crown dieback, and distance and direction to residential buildings. For a<br />
complete description <strong>of</strong> variables visit the UFORE manual at<br />
http://www.fs.fed.us/ne/syracuse/Tools/UFORE.htm.<br />
2.3 Data Analysis<br />
Data were input into excel spreadsheets in accordance with UFORE manual<br />
specifications, which were then submitted to the USDA <strong>Forest</strong> Service in<br />
Syracuse for analysis. Data processing was completed by the <strong>Forest</strong> Service<br />
and relevant output files were then forwarded to the <strong>Kelowna</strong> Parks Department<br />
for full interpretation.<br />
3.0 Results and Discussion<br />
3.1 <strong>Urban</strong> <strong>Forest</strong> Structure<br />
Figure 2 illustrates the top ten tree species in <strong>Kelowna</strong>, by percentage canopy<br />
cover. <strong>Kelowna</strong>’s urban forest has low diversity overall, as 75% <strong>of</strong> the total tree<br />
canopy is comprised <strong>of</strong> only three species, Douglas-fir, ponderosa pine and<br />
apple. An urban forest with higher diversity is more resilient to pest outbreaks,<br />
drought, disease, climate change or other disturbances. However, the ability to<br />
increase diversity in <strong>Kelowna</strong>’s natural areas will be very limited due to the hot,<br />
dry climate. There are opportunities, however, to increase diversity in the<br />
urbanized areas where non-native species can be grown. These species will<br />
have to be chosen carefully, however, to avoid invasive species as well as<br />
species with high water (irrigation) requirements.<br />
<strong>Kelowna</strong>’s <strong>Urban</strong> <strong>Forest</strong>: UFORE Analysis 10
Fig. 2. The top ten tree species in <strong>Kelowna</strong>, by canopy cover.<br />
Common pear, 3%<br />
Norway maple,<br />
3.5%<br />
Green ash, 2%<br />
London planetree,<br />
2%<br />
Crabapple, 2%<br />
Austrian pine, 2%<br />
Elm, 4%<br />
OTHER, 7%<br />
Douglas fir, 33%<br />
Apple, 19%<br />
Ponderosa pine,<br />
24%<br />
Orchard trees (apple, pear and cherry) comprise almost 22% <strong>of</strong> the total tree<br />
canopy. Although these trees tend to be small and require irrigation, they are<br />
producing significant benefits for <strong>Kelowna</strong> residents. As agricultural lands are<br />
converted to other crop types (grapes or field crops), or lost to development,<br />
some <strong>of</strong> these benefits will be lost.<br />
The total number <strong>of</strong> trees in <strong>Kelowna</strong> is approximately 3.3 million, with a<br />
replacement value <strong>of</strong> $1.1 billion (Table 2). Replacement value is based upon<br />
accepted formulae for estimating individual tree values; it is not the ecological or<br />
societal value <strong>of</strong> the tree.<br />
Trees act as “carbon sinks”, and can help mitigate global warming by removing<br />
(sequestering) carbon dioxide from the atmosphere. However, as trees<br />
eventually decay, die or burn in wildfires, this carbon is released back into the<br />
atmosphere. <strong>Kelowna</strong>’s trees sequester about 7,400 metric tonnes <strong>of</strong> carbon per<br />
year (Table 2) and currently store about 127,000 tonnes <strong>of</strong> carbon. Net carbon<br />
sequestration rates, per tree, generally increase as <strong>Kelowna</strong>’s trees get larger<br />
(Fig. 3).<br />
Most trees in <strong>Kelowna</strong> are small. Approximately 94% <strong>of</strong> the tree population is<br />
less than 30cm in diameter at breast height (DBH) (Fig. 4).<br />
<strong>Kelowna</strong>’s <strong>Urban</strong> <strong>Forest</strong>: UFORE Analysis 11
Table 2. Summary <strong>of</strong> <strong>Kelowna</strong>’s tree species.<br />
No. Trees<br />
Net Carbon<br />
Sequestered<br />
Leaf<br />
Area<br />
Replacement<br />
Tree Value<br />
Species % # (metric tonnes/yr) % $<br />
Apple 39.2 1,296,000 3,180 18.7 438,763,000<br />
Douglas fir 23.1 762,00 750 32.6 159,669,000<br />
Ponderosa pine 18.4 607,000 1,400 23.8 181,019,000<br />
Common pear 5.5 180,000 600 2.7 84,288,000<br />
Hedge cedar 2 68,000 110 1 10,135,000<br />
Austrian pine 1.7 57,000 80 2.2 15,929,000<br />
Elm 1.4 47,000 180 4 29,460,000<br />
Crabapple 1.1 36,000 130 1.9 15,181,000<br />
Juniper 0.8 27,000 20 0.3 556,000<br />
Quaking aspen 0.6 19,000 6 0.1 446,000<br />
London planetree 0.6 18,000 70 1.7 13,428,000<br />
Black cottonwood 0.5 18,000 160 1.4 18,194,000<br />
Red maple 0.4 14,000 40 0.7 6,158,000<br />
Norway maple 0.4 13,500 150 3.5 37,394,000<br />
Sweet cherry 0.4 13,500 95 0.2 11,504,000<br />
Red cedar 0.4 13,500 25 0.1 7,275,000<br />
Black locust 0.3 11,000 45 0.8 6,881,000<br />
Poplar 0.3 10,500 10 0.3 856,000<br />
Japanese maple 0.3 9,000 50 0.5 6,521,000<br />
Hawthorn 0.3 9,000 45 0.4 5,244,000<br />
Lodgepole pine 0.3 9,000 5 0.1 296,000<br />
Paper birch 0.3 8,700 70 0.4 9,896,000<br />
Freeman maple 0.3 8,500 7 0.1 1,712,000<br />
Common<br />
chokecherry 0.3 8,500 40 0.4 5,028,000<br />
Honeylocust 0.2 7,000 10 0 2,019,000<br />
Aspen 0.2 7,000 2 0 151,000<br />
Green ash 0.1 4,500 40 1.6 14,350,000<br />
White spruce 0.1 4,500 15 0.2 601,000<br />
Mugo pine 0.1 4,500 2 0 183,000<br />
Prunus spp. 0.1 4,500 7 0 599,000<br />
Mountain ash 0.1 4,500 20 0.2 2,881,000<br />
Douglas maple 0.1 1,800 1 0.1 23,000<br />
TOTALS 100 3,300,000 7,400 100 $1,086,640,579<br />
<strong>Kelowna</strong>’s <strong>Urban</strong> <strong>Forest</strong>: UFORE Analysis 12
Fig. 3. Per-Tree Net Carbon Sequestration (kg per year) for <strong>Kelowna</strong>’s trees, by diameter<br />
class (DBH, in centimetres).<br />
12<br />
10<br />
Net Carbon Sequestered (kg/yr)<br />
8<br />
6<br />
4<br />
2<br />
0<br />
0 - 8<br />
8 - 15<br />
15 - 23<br />
23 - 30<br />
30 - 38<br />
38 - 46<br />
46 - 53<br />
53 - 61<br />
DBH Class<br />
Fig. 4. The size <strong>of</strong> <strong>Kelowna</strong>’s trees, shown as a percentage <strong>of</strong> trees by diameter class<br />
(DBH, in centimetres).<br />
40<br />
35<br />
30<br />
% <strong>of</strong> Tree Population<br />
25<br />
20<br />
15<br />
10<br />
5<br />
0<br />
2 - 8 8 - 15 15 - 23 23 - 30 30 - 38 38 - 46 46 - 53 53 - 61<br />
DBH Class<br />
<strong>Kelowna</strong>’s <strong>Urban</strong> <strong>Forest</strong>: UFORE Analysis 13
The health <strong>of</strong> <strong>Kelowna</strong>’s trees is currently very good, with 92% <strong>of</strong> the tree<br />
population rated as “Fair” or better (Fig. 5).<br />
Fig. 5. Tree health (condition class).<br />
70<br />
60<br />
50<br />
% <strong>of</strong> Tree Population<br />
40<br />
30<br />
20<br />
10<br />
0<br />
Excellent Good Fair Poor Dead<br />
Condition Class<br />
3.2 Vegetation Cover and Plantable Space<br />
Because <strong>of</strong> the limited number <strong>of</strong> samples, several <strong>of</strong> the landuse types from the<br />
<strong>Kelowna</strong> Official Community Plan (OCP) were combined for the comparisons<br />
shown in Table 3.<br />
Table 3. Percentage cover comparisons by landuse type.<br />
Plantable<br />
Space<br />
Percentage covered by:<br />
Impervious<br />
(concrete,<br />
asphalt<br />
buildings) Herbs Grass Water Shrubs Other Trees<br />
Landuse Type<br />
Agriculture /<br />
Rural 17.6% 0.1% 33.8% 42.7% 0% 7.6% 0.8% 15%<br />
Commercial /<br />
Industrial /<br />
Transportation 12.3% 47.7% 5% 6.5% 0% 5% 2.7% 3.1%<br />
Park / Wetland<br />
/ Private<br />
Recreation /<br />
Golf 27.4% 5.9% 7.4% 66.5% 2.6% 6.5% 1.2% 8.2%<br />
Residential 35% 28.9% 5.2% 36% 0.8% 10.4% 1.5% 10.5%<br />
Vacant /<br />
Wildland 55% 1.3% 17.3% 43.7% 0% 18.1% 0.8% 23.4%<br />
CITY TOTAL 27.3% 12% 18.3% 42.3% 0.6% 9.1% 1.2% 13%<br />
<strong>Kelowna</strong>’s <strong>Urban</strong> <strong>Forest</strong>: UFORE Analysis 14
Average tree cover throughout the city is 13%. American <strong>Forest</strong>s, a tree<br />
research and education group, recommends 25% tree cover for cities in dry<br />
areas <strong>of</strong> western North America (Table 4). The national average tree canopy for<br />
cities in the U.S. is 27% (Anonymous 2007). Average tree canopy in some <strong>of</strong> the<br />
other cities in North America is compared to <strong>Kelowna</strong>’s tree canopy in Table 5.<br />
Vacant / wildland areas and agriculture lands have the highest tree canopy (23<br />
and 15%, respectively), while the commercial / industrial / transportation zoning<br />
types have the least (3%).<br />
The <strong>City</strong> has 27% plantable space where trees could be planted, on average.<br />
Most plantable space is in vacant / wildland areas (55%), followed by residential<br />
(35%).<br />
Grasses (native, or planted) are the highest overall cover in the city (42%).<br />
Shrubs cover another 9% <strong>of</strong> the city. These cover types are not evaluated in<br />
detail by UFORE but do contribute ecological benefits to the city in terms <strong>of</strong><br />
stormwater management, cooling and interception <strong>of</strong> dust or pollutants.<br />
Impervious surfaces (concrete / tar and buildings) comprise a total <strong>of</strong> about 12%<br />
<strong>of</strong> the city area, on average. Impervious surfaces are highest in commercial /<br />
industrial / transportation areas (48%), followed by residential (29%).<br />
Table 4. Recommended tree canopy goals for metropolitan areas <strong>of</strong> the Southwest and<br />
Dry West (American <strong>Forest</strong>s 2007):<br />
Landuse Type<br />
Percent Cover<br />
Average tree cover for all zones 25%<br />
Suburban residential zones 35%<br />
<strong>Urban</strong> residential zones 18%<br />
Central business districts 9%<br />
<strong>Kelowna</strong>’s <strong>Urban</strong> <strong>Forest</strong>: UFORE Analysis 15
Table 5. Average tree canopy in selected North American cities*:<br />
<strong>City</strong><br />
Average Canopy<br />
San Diego, CA 7%<br />
Calgary, AB 7.1%<br />
Jersey <strong>City</strong>, NJ 11.5%<br />
<strong>Kelowna</strong>, BC 13%<br />
Philadelphia, PA 15.7%<br />
Los Angeles, CA 18%<br />
Seattle, WA 18%<br />
Toronto, ON 20.5%<br />
New York <strong>City</strong>, NY 21%<br />
Boston, MA 22.3%<br />
Syracuse, NY 24.4%<br />
Baltimore, MD 25.2%<br />
Oakville, ON 29.1%<br />
Atlanta, GA 36.7%<br />
Sources: Anonymous, 2007; USDA <strong>Forest</strong> Service, 2007.<br />
3.3 Pest Susceptibility<br />
UFORE assesses susceptibility <strong>of</strong> the urban forest to various exotic pests (which<br />
are not currently present in <strong>Kelowna</strong>) such as Asian longhorned beetle (ALB),<br />
gypsy moth, or Dutch Elm Disease (Table 6). If these pests became established<br />
here, this shows the proportion <strong>of</strong> the urban forest that is “at risk”. Most <strong>of</strong> these<br />
exotic pests have only been detected in Eastern Canada to date, although Dutch<br />
elm disease is present in Washington State.<br />
The most imminent threat to <strong>Kelowna</strong>’s urban forest at this time is mountain and<br />
western pine beetle. UFORE estimates that <strong>Kelowna</strong> has about 606,000<br />
ponderosa pine trees, with a replacement value <strong>of</strong> $181 million, representing<br />
about 24% <strong>of</strong> the total canopy cover (Table 2). According to the B.C. Provincial<br />
government, <strong>Kelowna</strong> is likely to lose about 80% <strong>of</strong> these trees, primarily the<br />
larger mature pines. These mature trees also contribute the most ecological<br />
benefits to the city.<br />
Table 6. Proportion <strong>of</strong> <strong>Kelowna</strong>’s urban forest that is at risk due to exotic and native<br />
pests.<br />
Pest<br />
% Susceptible Host, by Tree Cover<br />
Asian Longhorned Beetle 39%<br />
Mountain & western pine beetle 24%<br />
Gypsy moth 23%<br />
Dutch elm disease 4%<br />
Emerald ash borer 2%<br />
<strong>Kelowna</strong>’s <strong>Urban</strong> <strong>Forest</strong>: UFORE Analysis 16
3.3 Pollution Removal by the <strong>Urban</strong> <strong>Forest</strong><br />
<strong>Kelowna</strong>’s urban forest removes more than 195 tonnes <strong>of</strong> pollutants annually,<br />
and the value <strong>of</strong> this removal is estimated at $1.1 million per year (Table 7).<br />
These values are based upon an estimate <strong>of</strong> the societal cost <strong>of</strong> pollutant<br />
emissions / formation (Nowak et. al 2000b).<br />
Trees also produce Volatile Organic Compounds (VOCs) which can be converted<br />
into ozone and affect air quality when they react with nitrogen oxides from<br />
human-sources <strong>of</strong> pollution. <strong>Kelowna</strong>’s trees produce about 43 metric tons <strong>of</strong><br />
VOCs per year. However, the Ozone Index Score <strong>of</strong> <strong>Kelowna</strong>’s urban forest is<br />
quite high, at 94 (out <strong>of</strong> 100). A score <strong>of</strong> 100 represents forest composition<br />
where all species have the maximum effect on reducing ozone (lowest possible<br />
VOC emissions).<br />
Certain species <strong>of</strong> trees are better at reducing ozone levels than others. The<br />
best trees and shrubs in <strong>Kelowna</strong> for reducing ozone (index values >99) include:<br />
Pear (Pyrus), apple (Malus), hawthorn (Crataegus), mountain ash<br />
(Sorbus), Saskatoon (Amelanchier), Mock orange (Philadelphus),<br />
snowberry (Symphoricarpos), rose (Rosa), sumac (Rhus), grape (Vitis),<br />
cotoneaster (Cotoneaster), weigela (Weigela), honeysuckle (Lonicera),<br />
raspberry (Rubus), Japanese rose (Kerria), and spiraea (Spiraea).<br />
Overall, <strong>Kelowna</strong>’s urban forest produces significant net benefits for residents in<br />
terms <strong>of</strong> air quality improvement. Mature trees produce more benefits than small<br />
trees; a large tree removes about 2.0 kg <strong>of</strong> pollution per year, about 65 times<br />
more pollution than a small tree (Nowak et al. 2000b).<br />
Table 7. Pollution removal by <strong>Kelowna</strong>’s urban forest.<br />
Metric<br />
tonnes<br />
removed<br />
annually<br />
$ Value <strong>of</strong><br />
removal<br />
Pollutant<br />
CO 2 $ 1,800<br />
NO 2 17 $ 115,000<br />
O 3 83 $ 558,500<br />
PM10 89 $ 400,200<br />
SO 2 5 $ 8,100<br />
195 $1,084,000<br />
<strong>Kelowna</strong>’s <strong>Urban</strong> <strong>Forest</strong>: UFORE Analysis 17
3.4 Energy Savings<br />
Only residential trees were found to have a significant contribution to energy<br />
savings in <strong>Kelowna</strong>. Trees save energy in the summer by shading buildings and<br />
avoiding power plant emissions due to electricity savings. Trees help save<br />
energy in the winter, through acting as a windbreak and by avoiding power plant<br />
emissions due to gas and electricity savings. However, shading <strong>of</strong> buildings<br />
during the winter months can lead to increased power usage.<br />
Net energy savings are $19 million per year in <strong>Kelowna</strong>, due to residential trees.<br />
Tree cover also helps to avoid the release <strong>of</strong> 1,800 metric tonnes <strong>of</strong> carbon into<br />
the atmosphere each year.<br />
4.0 Conclusion and Recommendations<br />
<strong>Kelowna</strong> faces an increasing threat <strong>of</strong> tree loss due to factors such as mountain<br />
pine beetle attack, development, and wildfire. Although mountain pine beetle<br />
appears to be the most imminent threat, trees that are lost can be replanted or<br />
regenerated over time as long as natural areas are preserved. <strong>Urban</strong>ization is<br />
the greatest long-term threat to <strong>Kelowna</strong>’s urban forest, since it reduces the<br />
overall plantable space and the ability to replace areas <strong>of</strong> lost forest.<br />
As areas <strong>of</strong> urban forest or green infrastructure are lost, the ecosystem services<br />
they provide may need to be replaced with investments in grey infrastructure<br />
such as drainage improvements, water filtration, and larger power plants for<br />
providing electricity or fossil fuels. These practices are not sustainable in the<br />
long run and can be very costly.<br />
Strategies and tactics to enhance the ecological services <strong>of</strong> urban trees include<br />
(Nowak et al. 2000b):<br />
1) Aiming for species, size and age diversity (reduces the impact <strong>of</strong> pests);<br />
Increase species diversity in urbanized parks where appropriate<br />
Provide the public with information on additional tree species choices, that<br />
are pest and drought tolerant, non-invasive and will help improve diversity<br />
Encourage local nurseries to provide a greater variety <strong>of</strong> species<br />
2) Increasing the number <strong>of</strong> healthy trees;<br />
Educate the public about the benefits <strong>of</strong> proper tree care and least-toxic<br />
pest management solutions<br />
Educate the public about proper tree selection, to avoid problem-prone<br />
species<br />
<strong>Kelowna</strong>’s <strong>Urban</strong> <strong>Forest</strong>: UFORE Analysis 18
3) Maximizing the use <strong>of</strong> low VOC emitting trees to improve air quality;<br />
Provide information on preferred tree species to minimize VOC emissions<br />
4) Sustaining and increasing existing tree cover;<br />
Set a city-wide tree canopy goal in the OCP, through input from citizens,<br />
<strong>City</strong> Council, staff<br />
Increase planting on city-owned properties where appropriate<br />
Promptly replant city owned areas affected by pine beetle, fire or other<br />
disturbance and encourage the same on private properties<br />
Utilize techniques such as “under planting” to ensure adequate<br />
recruitment <strong>of</strong> young trees as mature trees decay or die<br />
Explore incentives, partnerships, and education to encourage additional<br />
planting on private properties. This might include partnerships or<br />
subsidies to provide low cost trees to private properties<br />
Change city policies and bylaws, such as the subdivision bylaw, zoning<br />
bylaws, hillside development guidelines, road design standards,<br />
landscaping and parking lot standards, etc. to maximize the amount <strong>of</strong><br />
tree retention and new planting associated with development<br />
Explore the use <strong>of</strong> “carbon credits”, e.g. the sale or trading <strong>of</strong> carbon<br />
savings generated by <strong>Kelowna</strong>’s urban forest, to help fund increased tree<br />
planting<br />
Monitor the long-term success <strong>of</strong> these efforts, by periodically performing<br />
new UFORE analyses, or by using aerial photography or GIS analyses to<br />
determine changes in forest canopy over time<br />
5) Sustaining large, healthy trees (greater benefits per tree);<br />
Educate the public about proper tree selection and care, to increase the<br />
number <strong>of</strong> large specimens in the future<br />
Change city policies and bylaws, such as subdivision, or road design<br />
standards to increase the amount <strong>of</strong> space available for mature trees to<br />
develop<br />
6) Using long-lived species (reduces carbon emissions from planting and<br />
removal activities);<br />
Educate the public on preferred species types<br />
Gradually replace short-lived species on city properties with longer-lived<br />
varieties<br />
7) Using low-maintenance trees (reduces fossil fuel requirements for<br />
maintaining vegetation);<br />
Educate the public on preferred species types<br />
Gradually replace high maintenance and problem-prone species with<br />
lower maintenance species<br />
<strong>Kelowna</strong>’s <strong>Urban</strong> <strong>Forest</strong>: UFORE Analysis 19
8) Planting trees in energy-conserving locations;<br />
Incorporate appropriate tree planting into the design <strong>of</strong> city-owned<br />
buildings<br />
Educate the public about the best locations for tree planting to reduce<br />
energy use<br />
9) Planting trees as part <strong>of</strong> transportation corridors (extends the life <strong>of</strong><br />
streets, reduces carbon dioxide emissions) and parking lots (cooling<br />
effect and reduction <strong>of</strong> VOC emissions from parked vehicles);<br />
Incorporate tree planting into all new collector / arterial road designs<br />
Increase standards for planting in parking lots and implement monitoring<br />
to ensure trees survive over time<br />
Ensure that adequate space is provided in transportation corridors and<br />
parking lot design, particularly adequate soil volume for the development<br />
<strong>of</strong> large trees which will help to reduce storm water run<strong>of</strong>f from impervious<br />
surfaces and maximize shading<br />
10) Planting trees in polluted areas;<br />
Increase plantings along major transportation routes and in industrial<br />
areas to improve interception <strong>of</strong> pollutants<br />
11) Avoiding pollution sensitive tree species;<br />
Public education on appropriate tree species<br />
12) Utilizing evergreen trees for particulate matter reduction (year-round<br />
removal <strong>of</strong> pollutants).<br />
Encourage the use <strong>of</strong> evergreens, particularly in high-pollution areas or as<br />
windbreaks in winter.<br />
These recommendations will help to preserve and improve the quality <strong>of</strong><br />
<strong>Kelowna</strong>’s urban forest and improve the liveability <strong>of</strong> <strong>Kelowna</strong>, and are also<br />
compatible with <strong>Kelowna</strong>’s Sustainability Objectives.<br />
<strong>Kelowna</strong>’s <strong>Urban</strong> <strong>Forest</strong>: UFORE Analysis 20
5.0 References<br />
American <strong>Forest</strong>s, 2007. Setting urban tree canopy goals.<br />
http://www.americanforests.org/resources/urbanforests/treedeficit.php<br />
Anonymous, 2007. Some Cities Push for Increased Tree Canopy.<br />
http://notes.sej.org/sej/tipsheet.nsf/88cd8c96aea2f1d286256acd000afa8d/14da9<br />
b477fe3ff0d862572c8006561da?OpenDocument<br />
Cardelino,C.A. and W.L. Chameides.1990. Natural hydrocarbons, urbanization,<br />
and urban ozone. Journal <strong>of</strong> Geophysical Research 95(D9):13,971-<br />
13,979.<br />
EPA (2007). Heat island effect: trees and vegetation. U.S. Environmental<br />
Protection Agency. http://www.epa.gov/hiri/strategies/vegetation.html.<br />
Heisler, G.M. 1986. Energy savings with trees. Journal <strong>of</strong> Arboriculture 12.<br />
Kollin, C. 2006. How green infrastructure measures up to structural stormwater<br />
service: Quantifying the contribution <strong>of</strong> trees and vegetation.<br />
Stormwater 7(5).<br />
Kuo, F. and W. Sullivan. 2001. Environment and crime in the inner city: Does<br />
vegetation reduce crime? Environment and Behavior 33(3).<br />
Ministry <strong>of</strong> <strong>Forest</strong>s and Range. 2007. Provincial-level projection <strong>of</strong> the current<br />
mountain pine beetle outbreak: Update <strong>of</strong> the infestation projection<br />
based on the 2006 provincial aerial overview <strong>of</strong> forest health and<br />
revisions to the “Model” (BCMPB.v4).<br />
http://www.for.gov.bc.ca/hre/bcmpb/BCMPB.v4.BeetleProjection.Updat<br />
e.pdf<br />
Nowak, D.J., K.L. Civerolo, S.T. Rao, G. Sista, C.J. Luley, and D.E. Crane.<br />
2000a. A modeling study <strong>of</strong> the impact <strong>of</strong> urban trees on ozone.<br />
Atmospheric Environment 34.<br />
Nowak, D.J., D.E. Crane, J.C. Stevens, and M. Ibarra. 2000b. Brooklyn’s urban<br />
forest. General Technical Report NE-290. USDA <strong>Forest</strong> Service,<br />
Northeastern Research Station.<br />
Nowak, D.J., D.E. Crane, and J.C. Stevens. 2006. Air pollution removal by urban<br />
trees and shrubs in the United States. <strong>Urban</strong> <strong>Forest</strong>ry & <strong>Urban</strong><br />
Greening 4.<br />
<strong>Kelowna</strong>’s <strong>Urban</strong> <strong>Forest</strong>: UFORE Analysis 21
Simpson, J.R. 1998. <strong>Urban</strong> forest impacts on regional cooling and heating<br />
energy use: Sacramento County case study. Journal <strong>of</strong> Arboriculture<br />
24(4):201-214<br />
Simpson, J.R. and E.G. McPherson. 1996. Potential <strong>of</strong> tree shade for reducing<br />
residential energy use in California. Journal <strong>of</strong> Arboriculture 22(1).<br />
Simpson, J.R. and E.G. McPherson. 2000. Effects <strong>of</strong> urban trees on regional<br />
energy use and avoided carbon. In: Preprints, 3rd urban environment<br />
symposium; 2000 August 14-18; Davis, CA. Washington, DC:<br />
American Meteorological Society:143-144.<br />
Smith, W.H. 1990. Air pollution and forests, Springer-Verlag. New York.<br />
Ulrich, R. 1984. View through window may influence recovery from surgery.<br />
Science 224: 420-421<br />
USDA <strong>Forest</strong> Service, 2007. UFORE in action.<br />
http://www.ufore.org/action/index.html<br />
Wolf, K.L. 1999. Nature and commerce: Human ecology in business districts. In:<br />
Kollin, C., ed. Building Cities <strong>of</strong> Green: Proceedings <strong>of</strong> the 9 th National<br />
<strong>Urban</strong> <strong>Forest</strong> Conference. Washington, D.C: American <strong>Forest</strong>s.<br />
Wolf, K.L. 2007. <strong>City</strong> trees and property values.<br />
http://www.cfr.washington.edu/research.envmind/Policy/Hedonics_Cita<br />
tions.pdf<br />
<strong>Kelowna</strong>’s <strong>Urban</strong> <strong>Forest</strong>: UFORE Analysis 22
Appendix 1. Plot Locations (GPS Coordinates)<br />
GPS Coordinates for original 100 plots (plots #1-101):<br />
ID X-Coordinates Y-Coordinates<br />
1 315206.976828 5516776.214540<br />
2 317294.833259 5518054.341910<br />
3 318438.964887 5518806.123160<br />
4 319882.896053 5518935.139410<br />
5 322311.421366 5518675.175140<br />
6 322543.874170 5519046.166840<br />
7 320656.647448 5520280.160620<br />
8 321398.086621 5519695.848120<br />
9 322727.401081 5520737.424370<br />
10 320762.600880 5522321.428960<br />
11 322377.598877 5522118.604310<br />
12 323773.902244 5522271.492330<br />
13 325034.910969 5521522.846740<br />
14 325569.898260 5521497.738340<br />
15 326905.362539 5521897.801050<br />
16 321792.083368 5522501.866260<br />
17 323321.458449 5523237.240250<br />
18 324305.221601 5523362.756550<br />
19 326530.961057 5522892.527590<br />
20 326921.913248 5522714.758730<br />
21 329001.469608 5522911.500340<br />
22 329673.862071 5523875.208970<br />
23 331200.192770 5523071.513030<br />
24 321625.789342 5524551.507170<br />
25 323791.688779 5524256.212520<br />
26 325141.706151 5524046.849750<br />
27 326051.502183 5524267.760180<br />
28 326923.823446 5525273.106430<br />
29 329314.563169 5524737.466650<br />
30 330062.325611 5524452.512770<br />
31 332474.437067 5525065.693900<br />
32 321095.858100 5526463.848830<br />
33 322526.594628 5526741.151310<br />
34 324196.964589 5526809.488570<br />
35 326401.371165 5525507.484330<br />
36 327538.119402 5526799.293160<br />
37 328764.984974 5526341.988410<br />
38 330794.381175 5526407.402940<br />
39 331239.833920 5525505.823750<br />
40 332744.222585 5526860.755630<br />
41 322134.853763 5527119.728410<br />
ID X-Coordinates Y-Coordinates<br />
42 323301.377006 5528116.192440<br />
43 324551.823361 5527220.931750<br />
44 326048.896627 5527087.276940<br />
45 328097.479099 5527075.550300<br />
46 328826.438245 5528094.861160<br />
47 330969.857261 5527462.888190<br />
48 331603.186160 5527265.310660<br />
49 333073.491337 5526920.477460<br />
50 320163.452948 5528638.946730<br />
51 321147.429789 5529770.087160<br />
52 323244.369935 5528414.595300<br />
53 324209.622574 5529755.544260<br />
54 326689.352905 5528610.243880<br />
55 327331.498580 5528550.178190<br />
56 329364.259698 5529448.718140<br />
57 330672.642293 5529082.078510<br />
58 331432.227041 5528680.406960<br />
59 320814.917014 5530516.212840<br />
60 321097.188629 5531080.120100<br />
61 322678.882967 5530585.094410<br />
62 324647.884111 5529881.407600<br />
63 325820.063190 5530001.430400<br />
64 327837.544115 5530848.448110<br />
65 329588.130923 5531206.031300<br />
66 330815.096402 5530298.626370<br />
67 331140.315459 5530026.840260<br />
68 322830.584007 5531969.561190<br />
69 324734.741465 5531839.518960<br />
70 326008.199690 5532085.203600<br />
71 327826.051536 5531540.283170<br />
72 329419.691676 5532094.462080<br />
73 330896.586540 5532324.974150<br />
74 322117.698236 5532933.517430<br />
75 323267.753506 5532832.550430<br />
76 323881.199561 5533881.974130<br />
77 325431.162384 5533639.232270<br />
78 327648.837140 5533579.914160<br />
79 328592.401675 5533721.105630<br />
80 325199.078160 5535636.657400<br />
81 325928.091422 5535674.037100<br />
82 328057.788515 5535105.456080<br />
<strong>Kelowna</strong>’s <strong>Urban</strong> <strong>Forest</strong>: UFORE Analysis 23
ID X-Coordinates Y-Coordinates<br />
83 328439.739379 5534391.398930<br />
84 323978.248278 5537012.305310<br />
85 325324.892407 5536007.325460<br />
86 328060.020634 5536705.565590<br />
87 328596.589783 5536935.140030<br />
88 323905.460092 5538285.726710<br />
89 326633.833509 5537430.241040<br />
90 327689.335304 5538150.490340<br />
91 328662.404264 5538477.231420<br />
92 329794.426354 5538425.387660<br />
93 324870.916014 5539571.994890<br />
94 325797.599073 5539986.585360<br />
95 326827.587166 5539765.244460<br />
96 329233.482198 5539843.752140<br />
97 325856.342372 5541400.268160<br />
98 327578.292002 5540371.647430<br />
99 325385.136910 5542006.485290<br />
100 327688.584442 5541810.072060<br />
101 328670.921147 5542949.088080<br />
GPS Coordinates for additional 50<br />
plots (plots #1-50):<br />
ID X-Coordinates Y-Coordinates<br />
1 317591.701290 5518740.644370<br />
2 318897.044205 5518924.502620<br />
3 320989.070184 5520647.594550<br />
4 323318.519928 5519396.359360<br />
5 321635.428210 5522432.827910<br />
6 323563.971180 5521570.849070<br />
7 324397.444958 5521654.362480<br />
8 327152.005445 5522458.381730<br />
9 321000.605451 5523550.753260<br />
10 322643.449003 5524290.886390<br />
11 324571.226329 5524010.021070<br />
12 328131.614987 5523391.038710<br />
13 329592.714322 5523757.206200<br />
14 331259.906151 5524274.590780<br />
ID X-Coordinates Y-Coordinates<br />
15 322521.122610 5525163.056930<br />
16 324757.660867 5526570.293400<br />
17 327735.055796 5526424.717010<br />
18 329420.927734 5525306.657650<br />
19 331916.572311 5526171.473280<br />
20 320780.034369 5528608.281210<br />
21 323376.721892 5528150.268530<br />
22 326213.094036 5527218.479500<br />
23 327713.431618 5528126.888490<br />
24 329885.645766 5526949.173110<br />
25 330473.901042 5527217.200480<br />
26 320417.610469 5530374.621450<br />
27 322309.442617 5529979.060170<br />
28 324799.248659 5530507.595040<br />
29 326714.735596 5530158.790910<br />
30 328703.197215 5529104.019210<br />
31 332288.433223 5529173.066470<br />
32 324068.954665 5532776.143670<br />
33 325597.386568 5532614.492930<br />
34 327813.104122 5532637.276220<br />
35 329010.445148 5532854.801730<br />
36 331866.790175 5531858.748410<br />
37 323947.566286 5533685.500050<br />
38 325545.974432 5534184.003200<br />
39 327262.654517 5533221.578150<br />
40 328520.896302 5533774.417550<br />
41 326166.631277 5536924.522360<br />
42 328151.120367 5535310.446490<br />
43 328917.540175 5536421.995500<br />
44 325478.672430 5537560.717990<br />
45 326477.350914 5538585.450670<br />
46 324896.222118 5539392.156850<br />
47 326988.707082 5540836.446600<br />
48 328932.330430 5540257.833370<br />
49 326844.930634 5541679.380760<br />
50 329492.178715 5542946.221000<br />
<strong>Kelowna</strong>’s <strong>Urban</strong> <strong>Forest</strong>: UFORE Analysis 24
Plots that had to be moved to alternate locations, due to lack <strong>of</strong> access or<br />
permission was not granted by the landowner:<br />
Plot # Original Coordinates Modified Coordinates Description<br />
330062.325 x<br />
331544.554 x<br />
~ 1500m west <strong>of</strong><br />
30 5524452.512<br />
5524779.828<br />
original<br />
31<br />
332474.437 x<br />
5525065.693 ~ 1km south <strong>of</strong> original<br />
90<br />
327689.335 x<br />
5538150.490<br />
327433.933 x<br />
5537739.096 ~ 300m SW <strong>of</strong> original<br />
94<br />
325797.599 x<br />
5539986.585<br />
326109.914 x<br />
5539735.296 ~ 400m SE <strong>of</strong> original<br />
95<br />
326827.587 x<br />
5539765.244<br />
326401.000 x<br />
5539825.167 ~ 350m west <strong>of</strong> original<br />
133<br />
324068.954 x<br />
5532766.143<br />
324264.293 x<br />
5532952.321 ~ 300m SW <strong>of</strong> original<br />
145<br />
326477.350 x<br />
5538585.450<br />
326168.761 x<br />
5537772.159<br />
~ 850m south <strong>of</strong><br />
original<br />
147<br />
326988.707 x<br />
5540836.446<br />
327492.468 x<br />
5541137.415 ~ 675m NE <strong>of</strong> original<br />
149<br />
326844.930 x<br />
5541679.380<br />
326239.558 x<br />
5538042.373 ~ 4km south original<br />
<strong>Kelowna</strong>’s <strong>Urban</strong> <strong>Forest</strong>: UFORE Analysis 25