1 CLASS LECTURE NOTES - What is Applied Statistics ...
1 CLASS LECTURE NOTES - What is Applied Statistics ...
1 CLASS LECTURE NOTES - What is Applied Statistics ...

Create successful ePaper yourself
Turn your PDF publications into a flip-book with our unique Google optimized e-Paper software.
21<br />
BOX PLOT<br />
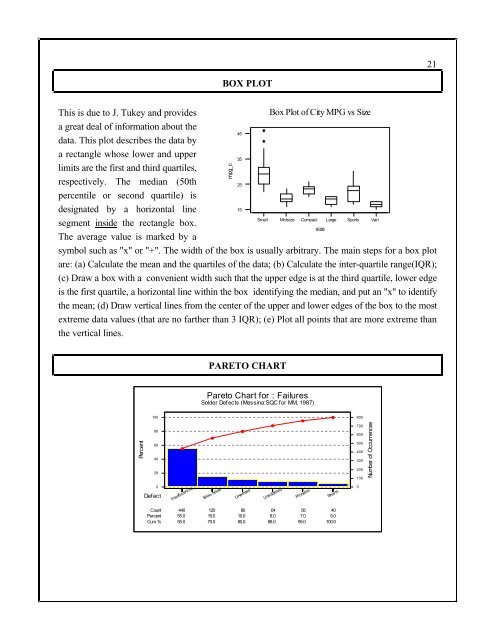
Th<strong>is</strong> <strong>is</strong> due to J. Tukey and provides<br />
Box Plot of City MPG vs Size<br />
a great deal of information about the<br />
45<br />
data. Th<strong>is</strong> plot describes the data by<br />
a rectangle whose lower and upper<br />
35<br />
limits are the first and third quartiles,<br />
respectively. The median (50th<br />
25<br />
percentile or second quartile) <strong>is</strong><br />
designated by a horizontal line<br />
15<br />
Small Midsize Compact Large Sports Van<br />
segment inside the rectangle box.<br />
size<br />
The average value <strong>is</strong> marked by a<br />
symbol such as "x" or "+". The width of the box <strong>is</strong> usually arbitrary. The main steps for a box plot<br />
are: (a) Calculate the mean and the quartiles of the data; (b) Calculate the inter-quartile range(IQR);<br />
(c) Draw a box with a convenient width such that the upper edge <strong>is</strong> at the third quartile, lower edge<br />
<strong>is</strong> the first quartile, a horizontal line within the box identifying the median, and put an "x" to identify<br />
the mean; (d) Draw vertical lines from the center of the upper and lower edges of the box to the most<br />
extreme data values (that are no farther than 3 IQR); (e) Plot all points that are more extreme than<br />
the vertical lines.<br />
mpg_c<br />
PARETO CHART<br />
Pareto Chart for : Failures<br />
Solder Defects (Messina:SQC for MM, 1987)<br />
Percent<br />
100<br />
80<br />
60<br />
40<br />
20<br />
800<br />
700<br />
600<br />
500<br />
400<br />
300<br />
200<br />
100<br />
Number of Occurrences<br />
0<br />
Defect<br />
Insufficient so<br />
Blow holes<br />
Unwetted<br />
Unsoldered<br />
Pinholes<br />
Shorts<br />
0<br />
Count<br />
Percent<br />
Cum %<br />
440<br />
55.0<br />
55.0<br />
120<br />
15.0<br />
70.0<br />
80<br />
10.0<br />
80.0<br />
64<br />
8.0<br />
88.0<br />
56<br />
7.0<br />
95.0<br />
40<br />
5.0<br />
100.0