Annual Report 2006 - Komatsu
Annual Report 2006 - Komatsu
Annual Report 2006 - Komatsu

You also want an ePaper? Increase the reach of your titles
YUMPU automatically turns print PDFs into web optimized ePapers that Google loves.
NOTES TO CONSOLIDATED FINANCIAL STATEMENTS<br />
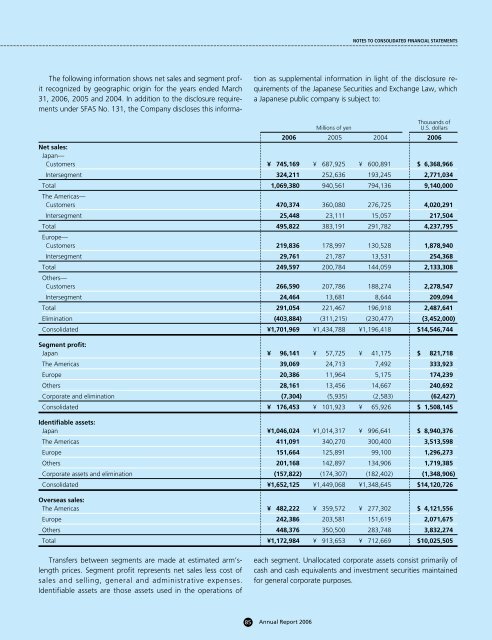
The following information shows net sales and segment profit<br />
recognized by geographic origin for the years ended March<br />
31, <strong>2006</strong>, 2005 and 2004. In addition to the disclosure requirements<br />
under SFAS No. 131, the Company discloses this information<br />
as supplemental information in light of the disclosure requirements<br />
of the Japanese Securities and Exchange Law, which<br />
a Japanese public company is subject to:<br />
Thousands of<br />
Millions of yen<br />
U.S. dollars<br />
<strong>2006</strong> 2005 2004 <strong>2006</strong><br />
Net sales:<br />
Japan—<br />
Customers ¥ 745,169 ¥ 687,925 ¥ 600,891 $ 6,368,966<br />
Intersegment 324,211 252,636 193,245 2,771,034<br />
Total 1,069,380 940,561 794,136 9,140,000<br />
The Americas—<br />
Customers 470,374 360,080 276,725 4,020,291<br />
Intersegment 25,448 23,111 15,057 217,504<br />
Total 495,822 383,191 291,782 4,237,795<br />
Europe—<br />
Customers 219,836 178,997 130,528 1,878,940<br />
Intersegment 29,761 21,787 13,531 254,368<br />
Total 249,597 200,784 144,059 2,133,308<br />
Others—<br />
Customers 266,590 207,786 188,274 2,278,547<br />
Intersegment 24,464 13,681 8,644 209,094<br />
Total 291,054 221,467 196,918 2,487,641<br />
Elimination (403,884) (311,215) (230,477) (3,452,000)<br />
Consolidated ¥1,701,969 ¥1,434,788 ¥1,196,418 $14,546,744<br />
Segment profit:<br />
Japan ¥ 96,141 ¥ 57,725 ¥ 41,175 $ 821,718<br />
The Americas 39,069 24,713 7,492 333,923<br />
Europe 20,386 11,964 5,175 174,239<br />
Others 28,161 13,456 14,667 240,692<br />
Corporate and elimination (7,304) (5,935) (2,583) (62,427)<br />
Consolidated ¥ 176,453 ¥ 101,923 ¥ 65,926 $ 1,508,145<br />
Identifiable assets:<br />
Japan ¥1,046,024 ¥1,014,317 ¥ 996,641 $ 8,940,376<br />
The Americas 411,091 340,270 300,400 3,513,598<br />
Europe 151,664 125,891 99,100 1,296,273<br />
Others 201,168 142,897 134,906 1,719,385<br />
Corporate assets and elimination (157,822) (174,307) (182,402) (1,348,906)<br />
Consolidated ¥1,652,125 ¥1,449,068 ¥1,348,645 $14,120,726<br />
Overseas sales:<br />
The Americas ¥ 482,222 ¥ 359,572 ¥ 277,302 $ 4,121,556<br />
Europe 242,386 203,581 151,619 2,071,675<br />
Others 448,376 350,500 283,748 3,832,274<br />
Total ¥1,172,984 ¥ 913,653 ¥ 712,669 $10,025,505<br />
Transfers between segments are made at estimated arm’slength<br />
prices. Segment profit represents net sales less cost of<br />
sales and selling, general and administrative expenses.<br />
Identifiable assets are those assets used in the operations of<br />
each segment. Unallocated corporate assets consist primarily of<br />
cash and cash equivalents and investment securities maintained<br />
for general corporate purposes.<br />
85 <strong>Annual</strong> <strong>Report</strong> <strong>2006</strong>