EG2040 Wind Power Systems Assignment 1 â Wind measurements ...
EG2040 Wind Power Systems Assignment 1 â Wind measurements ...
EG2040 Wind Power Systems Assignment 1 â Wind measurements ...

Create successful ePaper yourself
Turn your PDF publications into a flip-book with our unique Google optimized e-Paper software.
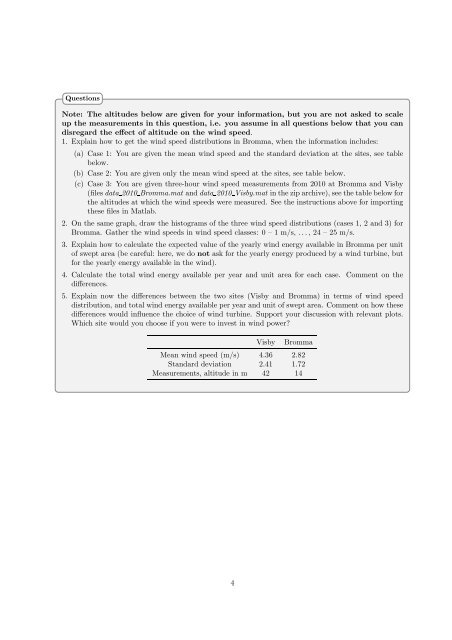
Questions<br />
Note: The altitudes below are given for your information, but you are not asked to scale<br />
up the <strong>measurements</strong> in this question, i.e. you assume in all questions below that you can<br />
disregard the effect of altitude on the wind speed.<br />
1. Explain how to get the wind speed distributions in Bromma, when the information includes:<br />
(a) Case 1: You are given the mean wind speed and the standard deviation at the sites, see table<br />
below.<br />
(b) Case 2: You are given only the mean wind speed at the sites, see table below.<br />
(c) Case 3: You are given three-hour wind speed <strong>measurements</strong> from 2010 at Bromma and Visby<br />
(filesdata 2010 Bromma.mat anddata 2010 Visby.mat intheziparchive),seethetablebelowfor<br />
the altitudes at which the wind speeds were measured. See the instructions above for importing<br />
these files in Matlab.<br />
2. On the same graph, draw the histograms of the three wind speed distributions (cases 1, 2 and 3) for<br />
Bromma. Gather the wind speeds in wind speed classes: 0 – 1 m/s, ..., 24 – 25 m/s.<br />
3. Explain how to calculate the expected value of the yearly wind energy available in Bromma per unit<br />
of swept area (be careful: here, we do not ask for the yearly energy produced by a wind turbine, but<br />
for the yearly energy available in the wind).<br />
4. Calculate the total wind energy available per year and unit area for each case. Comment on the<br />
differences.<br />
5. Explain now the differences between the two sites (Visby and Bromma) in terms of wind speed<br />
distribution, and total wind energy available per year and unit of swept area. Comment on how these<br />
differences would influence the choice of wind turbine. Support your discussion with relevant plots.<br />
Which site would you choose if you were to invest in wind power?<br />
Visby Bromma<br />
Mean wind speed (m/s) 4.36 2.82<br />
Standard deviation 2.41 1.72<br />
Measurements, altitude in m 42 14<br />
4